
In hc-deloitte-india-annual-compensation-trends-survey-report-fy-2016-noexp
24
Annual Compensation & Benefits Trends Survey India FY 2015-16 Human Capital Consulting April 2015
-
Upload
abhisek-gupta -
Category
Education
-
view
273 -
download
0
Transcript of In hc-deloitte-india-annual-compensation-trends-survey-report-fy-2016-noexp

Annual
Compensation & Benefits
Trends Survey
India
FY 2015-16
Human Capital Consulting
April 2015

Scope,
approach
and
methodology
Executive
summary
Sector-wise
analysis
About
Deloitte
Human
Capital
Consulting
Overall
industry
report
Table of Contents
To receive sector-wise analysis, please visit contact us
section at the end of this report

Scope, approach &
methodology

Scope, approach and methodology
Scope of the survey
The Deloitte India Compensation Trends Survey is an annual study conducted by
Human Capital Consulting. The objective of the study is to understand the key
compensation and benefits trends across sectors in the Indian market.
Organizations Sectors
Increment &
variable Pay
projections for
FY 2016 and
comparison
with FY 2015
Attrition
rates, key
levers for
mitigation
and talent
attraction
Key benefits
given across
sectors
Managing
and
rewarding
critical
talent
250 18
4© 2015 Deloitte Touche Tohmatsu India Private Limited

Scope, approach and methodology
Survey methodology
Design the survey instrument
The parameters of the study were finalized and
a structured questionnaire was
designed as a primary data collection tool
Finalize the target basket
The sectors covered in the study were finalized along with the leading
organizations from each sector
Invite participationA formal invitation e-mail and online questionnaire was sent to the Human Resources teams in the chosen organizations
requesting for participation
Collect and validate dataThe responses received from all participants were validated and checked for
accuracy and intended interpretation
Analyze dataThe data received was
collated and analyzed to get detailed insights on sector wise practices,
compensation and benefits trends
Generate the
Compensation Trends
Survey Report (FY 2015-
16)
5© 2015 Deloitte Touche Tohmatsu India Private Limited

Scope, approach and methodology
Definitions
10P/The lower decile position (where
one-tenth of the sample has lower
data)
25P/The lower quartile position (where
one quarter of the sample has lower
data)
50P/The middle position (where half of
the sample has lower and half has
higher data)
75P/The upper quartile position (where
three-quarters of the sample has
lower data)
90P/The upper decile position (where
nine-tenth of the sample has lower
data)
Top
Management
The most senior executive in the organization (CEO), coordinating a
full range of functions, providing leadership, overall direction and
control of company operations. Also, includes key executives
(direct reportees to CEO) within the organization, heading key
functions, businesses and geographies
Senior
Management
Executives who directly report to the Top Management, and manage
a range of functions. However, they are not regarded as Top
Management. This also includes direct reportees to different key
functional, business and geographical heads
Middle
Management
Includes executives who directly report to Senior Management,
with supervisory responsibility for a sub-function, part of a
business, geography etc.
Junior
Management
Includes supervisory staff usually involved in the day to day
functioning of a small team (First Level of Management Cadre).
Also, includes entry level employees with professional qualification
Includes non-management staff who work as individual contributors
reporting to ManagementClerical
Percentile definitions
6© 2015 Deloitte Touche Tohmatsu India Private Limited

Scope, approach and methodology
Participant profile
** Others include companies in Hospitality, Professional Services, Agriculture, Aviation, Export and Social Services sectors. Considering the limited number of responses
from these sectors within the specified timelines, separate sector reports have not been published
4.0% (10)
ChemicalConsumer
businessEnergy Hi-Tech ITeS
Infrastructure
& real estateLogistics
Auto & auto
Comp.BFSI Media &
advertising
Pharma, life
sciencesRetail Others**
(38)
Annual
revenue
1.6% 6.0%
13.6%
32.8%
46.0%
<100 Crore
100-300 Crore
300-500 Crore
500-1000 Crore
>1000 Crore
2.4%
9.2%
16.8%
20.4%22.4%
28.8%
< 500
500 - 2000
2000 - 5000
5000 - 10000
10000 - 25000
> 25000
Employee
strength
Engineering &
manufacturing
6.0% (15)
8.0% (20)
4.8% (12)
7.2 % (18)
15.2% (38)
12.0% (30)
10.0% (25)
4.8% (12)
3.2% (8)
4.8% (12)
8.0% (20)
6.0% (15) 6.0% (15)
250 organizations from 18 sectors have participated in the Compensation Trends Survey for FY 2016
7© 2015 Deloitte Touche Tohmatsu India Private Limited

Executive summary

Executive summary
Key findings
Increment
The average salary increment across sectors is projected at 10.7% in FY
2016, which is 0.4% points higher than the previous FY 2015 (10.3%)
Voluntary attrition
In FY 2015 highest attrition across industries was seen in the ITeS
sector (21.9%) whereas the lowest attrition was seen in the Energy &
natural resources sector (10.5%)
Variable pay
The average variable pay across sectors is projected at 17.4% in
FY 2016, which is 0.4% points higher than the previous FY 2015
(17.0%)
Top compensation levers for retention
Long term incentive plans, strong performance based variable pay,
and monetary / non monetary recognition awards are the three most
widely used compensation levers for employee retention
Reasons for attrition
Better pay, better career opportunities and need for work life balance
have emerged as top reasons for attrition across industries
The highest projected
average increment is in
the Pharma sector at
12.1%, and the lowest
projection is observed in
the Retail sector at 9.4%
The highest projected
increments across
industries are at the
Junior Management
level at 11.0%
The highest projected
average variable pay is
in the BFSI sector at
19.4%, and the lowest
projection is observed in
the Logistics sector at
15.6%
The Consumer Business
sector shows
conservative projections
towards increments
along with an increased
focus towards variable
pay
9© 2015 Deloitte Touche Tohmatsu India Private Limited

Executive summary
Industry snapshotIn %
Auto and auto components 10.2 10.4 0.20
BFSI 9.7 10.0 0.30
Chemical 11.0 11.4 0.40
Consumer business 10.9 10.8 -0.10
Energy & natural resources 10.1 10.3 0.20
Engineering & manufacturing 10.4 10.6 0.20
Hi-Tech 10.6 10.9 0.30
ITeS 10.6 10.8 0.20
Infrastructure & real estate 10.2 12.0 1.80
Logistics 9.6 9.8 0.20
Media & advertising 10.0 10.9 0.90
Pharma, life sciences & healthcare 12.0 12.1 0.10
Retail 9.5 9.4 -0.10
Overall industry 10.3 10.7 0.40
SectorsActual Projected Change
Average increments
Actual
indicates
actual
figures for
FY 2014-15
Projected
Indicates
projected
figures for
FY 2015-16
Projected
Rank
17.0 17.4 0.40
16.5 16.7 0.20
19.4 20.1 0.70
16.3 16.5 0.20
19.2 19.6 0.40
15.9 16.2 0.30
16.7 17.0 0.30
17.2 17.6 0.40
17.1 17.5 0.40
17.6 18.2 0.60
15.3 15.6 0.30
15.7 16.1 0.40
18.3 18.7 0.40
16.0 16.3 0.30
Actual Projected Change
9
11
3
6
10
8
4
6
2
12
4
1
13
8
8
1
9
2
11
7
5
6
4
13
3
10
8
12
Average variable pay
Projected
Rank
10© 2015 Deloitte Touche Tohmatsu India Private Limited

Overall industry
report

Overall industry analysis
Average annual increments FY 2016 (projections) vis-à-vis FY 2015 (Actuals)
(Actuals)
0.0
2.0
4.0
6.0
8.0
10.0
12.0
14.0
OverallIndustry
Auto BFSI Chem CB Energy Engg Hi-Tech ITeS Infra Log Media Pharma Retail
FY 2015 FY 2016
10.3 10.2 9.7 11.0 10.9 10.1 10.4 10.6 10.6 10.2 9.6 10.0 12.0 9.5
10.7 10.4 10.0 11.4 10.8 10.3 10.6 10.9 10.8 12.0 9.8 10.9 12.1 9.4
FY 2015
FY 2016
In %
Consumer business and
Retail sectors show a
decrease in projected
increments for FY 2016
vis-à-vis last FY
Infrastructure and real
estate has the maximum
increase in projected
average increments over
previous FY
In Pharma, Media, Hi-Tech
and ITeS sectors, the
projected increments are
significantly higher than
Industry average whereas
Logistics and Retail have
lower than industry average
increment projections
12© 2015 Deloitte Touche Tohmatsu India Private Limited

Overall industry analysis
Average annual increments FY 2016 (projections) vis-à-vis FY 2015
In % 10P 50P 90P Avg
Clerical 7.4 10.7 14.2 10.8
JM 7.6 11.1 14.5 11.0
MM 7.3 10.6 14.1 10.6
SM 7.1 10.5 13.8 10.5
TM 7.0 10.5 13.8 10.4
Level-wise increment percentiles (FY 2016) Average increments across levels
10.8
11.0
10.610.5
10.4
10.410.6
10.310.1
10.0
9.4
9.6
9.8
10.0
10.2
10.4
10.6
10.8
11.0
11.2
Clerical JM MM SM TM
FY 2016 FY 2015
In %
In % 10P 50P 90P Average
FY 2015 6.7 10.2 14.0 10.3
FY 2016 6.9 10.6 14.4 10.7
13© 2015 Deloitte Touche Tohmatsu India Private Limited

Overall industry analysis
Annual increments FY 2016 (projections)
In %Comparison of level-wise average increments across sectors
10.8 10.5 10.1 11.4 10.8 10.7 10.4 10.9 10.9 12.1 9.8 11.0 12.2 9.4
11.0 10.8 10.511.9 11.2 11.0 10.8 11.3 11.2
12.510.3
11.312.5
9.8
10.6 10.4 9.911.3
10.7 10.5 10.3 10.8 10.711.8
9.710.8
11.9
9.3
10.5 10.2 9.6
11.110.5 10.3 10.1
10.6 10.6
11.6
9.5
10.6
11.7
9.2
10.4 10.29.6
11.110.5 10.3 10.1
10.6 10.5
11.5
9.4
10.6
11.6
9.1
OverallIndustry
Auto BFSI Chem CB Eng Energy Hi-Tech ITeS Infra Log Media Pharma Retail
TM
SM
MM
JM
CL
The average increment
projections at Top, Senior
and Middle management
level are lower than the
projected Industry
average at 10.7%
The average increments at
all levels in Pharma,
Infrastructure and
Chemicals sectors are
significantly higher than the
respective level-wise
industry average
The average increments at
all levels in BFSI, Logistics
and Retail are lower than
respective level-wise
industry average
14© 2015 Deloitte Touche Tohmatsu India Private Limited

Overall industry analysis
Average annual variable pay FY 2016 (projections) vis-à-vis FY 2015
(Actuals)
0.0
5.0
10.0
15.0
20.0
25.0
OverallIndustry
Auto BFSI Chem CB Energy Engg Hi-Tech ITeS Infra Log Media Pharma Retail
FY 2015 FY 2016
17.0 16.5 19.4 16.3 19.2 15.9 16.7 17.2 17.1 17.6 15.3 15.7 18.3 16.0
17.4 16.7 20.1 16.5 19.6 16.2 17.0 17.6 17.5 18.2 15.6 16.1 18.7 16.3
FY 2015
FY 2016
In %
BFSI and Infrastructure
and real estate have the
maximum increase in
projected average variable
pay over previous FY
Logistics and Media have
projected lower than
average industry average
variable pay
In BFSI, Pharma and
consumer business, the
projected average variable
pay are significantly higher
than Industry average
15© 2015 Deloitte Touche Tohmatsu India Private Limited

Overall industry analysis
Average annual variable pay FY 2016 (projections) vis-à-vis FY 2015
In % 10P 50P 90P Avg
Clerical 5.6 10.3 18.2 10.4
JM 7.5 13.6 23.6 13.5
MM 10.2 17.6 29.4 17.5
SM 14.8 22.1 34.5 22.1
TM 16.5 24.3 38.1 24.2
Level-wise variable pay percentiles (FY 2016) Average variable pay across levels
10.4
13.5
17.5
22.1
24.2
10.2
13.1
17.2
21.7
23.7
10.0
12.0
14.0
16.0
18.0
20.0
22.0
24.0
26.0
Clerical JM MM SM TM
FY 2016 FY 2015
In %
In % 10P 50P 90P Average
FY 2015 5.6 17.1 34.8 17.0
FY 2016 5.9 17.6 35.3 17.4
16© 2015 Deloitte Touche Tohmatsu India Private Limited

Overall industry analysis
Annual variable pay FY 2016 (projections)
In %Comparison of level-wise average increments across sectors
10.4 9.7 11.9 9.5 11.8 9.9 9.2 10.6 10.5 10.9 8.6 9.1 10.7 9.3
13.5 12.715.2
12.614.9
12.9 12.3 13.7 13.6 14.111.6 12.2 13.9 12.4
17.5 16.5
19.8
16.419.3
16.8 16.217.5 17.5 18.0
15.6 16.218.4
16.1
22.121.4
25.3
21.2
24.6
21.8 20.922.4 22.3 23.0
20.2 20.8
23.6
21.0
24.223.3
27.4
23.1
26.8
23.722.8
24.4 24.3 24.9
22.5 22.6
25.6
22.8
OverallIndustry
Auto BFSI Chem CB Eng Energy Hi-Tech ITeS Infra Log Media Pharma Retail
TM
SM
MM
JM
CL
The average variable pay
projections at Clerical and
Junior management level
are lower than the
projected Industry
average at 17.4%
The average variable pay
projections at all levels in
BFSI and Consumer
Business sectors are
significantly higher than the
respective level-wise
industry average
The average projected
variable pay at all levels in
Logistics, Media and
Energy is lower than
respective level-wise
industry average
17© 2015 Deloitte Touche Tohmatsu India Private Limited
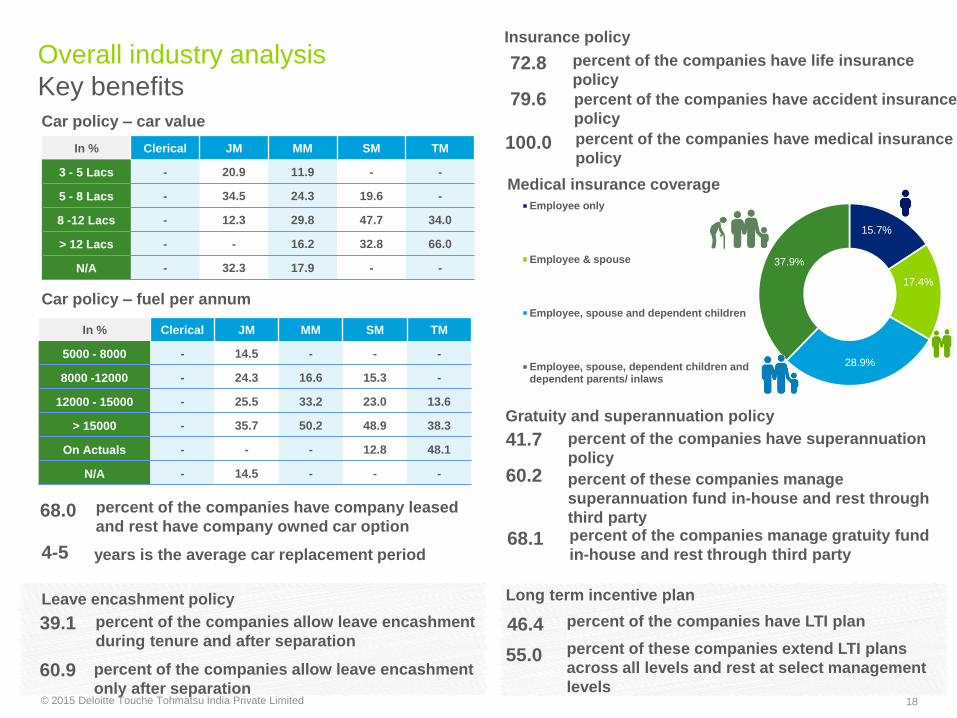
Overall industry analysis
Key benefits
Car policy – car value
In % Clerical JM MM SM TM
3 - 5 Lacs - 20.9 11.9 - -
5 - 8 Lacs - 34.5 24.3 19.6 -
8 -12 Lacs - 12.3 29.8 47.7 34.0
> 12 Lacs - - 16.2 32.8 66.0
N/A - 32.3 17.9 - -
Car policy – fuel per annum
In % Clerical JM MM SM TM
5000 - 8000 - 14.5 - - -
8000 -12000 - 24.3 16.6 15.3 -
12000 - 15000 - 25.5 33.2 23.0 13.6
> 15000 - 35.7 50.2 48.9 38.3
On Actuals - - - 12.8 48.1
N/A - 14.5 - - -
percent of the companies have company leased
and rest have company owned car option
Insurance policy
15.7%
17.4%
28.9%
37.9%
Employee only
Employee & spouse
Employee, spouse and dependent children
Employee, spouse, dependent children anddependent parents/ inlaws
Medical insurance coverage
years is the average car replacement period
percent of the companies allow leave encashment
during tenure and after separation
percent of the companies allow leave encashment
only after separation
Leave encashment policy
percent of the companies have life insurance
policy
percent of the companies have accident insurance
policy
percent of the companies have superannuation
policy
percent of these companies manage
superannuation fund in-house and rest through
third party
Gratuity and superannuation policy
percent of the companies manage gratuity fund
in-house and rest through third party
percent of the companies have medical insurance
policy
Long term incentive plan
percent of the companies have LTI plan
percent of these companies extend LTI plans
across all levels and rest at select management
levels
68.0
39.1
4-5
60.9
72.8
79.6
100.0
41.7
60.2
68.1
46.4
55.0
18© 2015 Deloitte Touche Tohmatsu India Private Limited

Overall industry analysis
Voluntary attrition analysis
0
5
10
15
20
25
OverallIndustry
Auto BFSI Chem CB Eng Energy Hi-Tech ITeS Infra Log Media Pharma Retail
FY 2014 FY 2015
16.2 11.4 18.7 10.6 18.4 10.9 10.4 19.4 21.5 17.5 16.6 17.2 18.2 18.9
16.5 11.6 18.9 10.7 18.7 11.1 10.5 19.9 21.9 17.8 16.8 17.5 18.6 19.4
FY 2014
FY 2015
In %
Comparison of level-wise voluntary attrition rate across sectors
Voluntary attrition rate across sectors
In %
24.8 22.228.4
16
26.317.5 15.2
29.8 32.328.1 24.6 25.8 26.1 29.2
19.317.2
21.2
13.3
20.6
14.311.4
2124
20.921.5 21.2 21.1
23.1
9.8
8.2
10.3
7.5
10.4
9.3
7.3
10.6
11.2
10.110.3 10.8 10.2
10.74.8
3.1
5.1
2.6
5.8
4.1
2.2
5.8
6.1
4.94.5 4.9 5.5
6.63.3
2.5
4.6
1.8
4.1
2.8
1.6
4.8
4.9
3.9 2.3 2.7 3.1 4.2
OverallIndustry
Auto BFSI Chem CB Eng Energy Hi-Tech ITeS Infra Log Media Pharma Retail
TM
SM
MM
JM
CL
19© 2015 Deloitte Touche Tohmatsu India Private Limited

Overall industry analysis
Attrition trends – reasons and mitigation measures
Top three
reasons for
attrition
Top three
compensation
levers for
talent retention
Top three
compensation
levers for
talent
attraction
Better pay elsewhere1
2
3
Better career opportunities
Better work life balance
Sign on bonuses1
2
3
Guaranteed incentives / variable pay
Attractive benefits offerings
1
2
3
Long term incentive plans
Performance based variable pay
Recognition awards (cash/non-cash)
20© 2015 Deloitte Touche Tohmatsu India Private Limited

About Deloitte Human
Capital Consulting

About Deloitte
Human Capital ConsultingDeloitte Consulting’s Human Capital practice is a leading global advisor and implementation partner working with companies, governments,
and organizations around the world. Our goal is to improve our clients’ organizational results and impact by focusing on challenges at the
intersection of business and people.
Our global network of more than 5,000 Human Capital professionals serves 100 countries. The scale of our global Human Capital partner
and practitioner network allows us to provide global and national clients with a network, which can respond quickly, flexibly, and at scale to
meet client challenges. Our practice goes to market applying deep industry experience and globally recognized HR, talent, and organization
transformation skills and capabilities. We offer a focused combination of breadth and expertise across HR service lines.
Our India offerings:
Organization Transformation,
Talent & Rewards
HR
Transformation
Strategic Change
Culture
Leadership Development
Organization Design
Technology Adoption
Talent Strategies:
• Career Development and Succession
• Diversity and Inclusion
• Performance, Engagement, and Retention
• Talent Sourcing
• Talent Strategies for Growth Markets
Learning Solutions
Sales Force Effectiveness
Rewards
• Job Evaluation
• Structuring & Benchmarking
• Incentive Plan Design
HR Transformation Strategy and Planning
HR Technology Strategy
HR Service Delivery:
• HR Shared Services
• High Impact HR Operating Model
• Outsourcing Advisory
HR Technologies:
• Oracle - EBS, HCM Cloud, PeopleSoft and Taleo
• SAP / SuccessFactors
• Salesforce.com
• Workday
• Cornerstone
• HR Technology – Other
Workforce Analytics
India Operations Setup:
• India Operations HR Setup
• Location Feasibility Study
• Rules And Regulations
• Employment Contract
Mergers, Acquisitions and Restructuring
22© 2015 Deloitte Touche Tohmatsu India Private Limited

Contact us
For sector specific reports and technical queries, please reach
out to:
Dr. Vishalli Dongrie, Sr. Director, Human Capital Consulting
Tel/Direct: +91 (22) 6185 4280 l Mobile: +91 98 3397 3458 l E-mail: [email protected]
Saptarshi Chatterjee, Senior Manager, Human Capital Consulting
Tel/Direct: +91 (22) 6185 4280 l Mobile: +91 98 1995 1648 l E-mail: [email protected]
Mandar Ranade, Senior Consultant, Human Capital Consulting
Tel/Direct: +91 (22) 6185 4280 l Mobile: +91 98 3369 1813 l E-mail: [email protected]
Malvika Sharma, Consultant, Human Capital Consulting
Tel/Direct: +91 (22) 6185 4280 l Mobile: +91 98 1991 2990 l E-mail: [email protected]
23© 2015 Deloitte Touche Tohmatsu India Private Limited

Deloitte refers to one or more of Deloitte Touche Tohmatsu Limited, a UK private company limited by guarantee (“DTTL”), its network of member firms, and
their related entities. DTTL and each of its member firms are legally separate and independent entities. DTTL (also referred to as “Deloitte Global”) does not
provide services to clients. Please see www.deloitte.com/about for a more detailed description of DTTL and its member firms.
This survey is a general survey carried out by Deloitte Touche Tohmatsu India Private Limited (DTTIPL) and data or information provided by you will be used
in connection with this survey, other studies or analyses performed by DTTIPL. This survey and the survey results are the proprietary property of DTTIPL and
will be disclosed only if required by law or in connection with this survey or such studies, analyses or services, however the data or information provided would
not contain any information that identifies you or associates with you the responses you have provided.
None of DTTIPL or its affiliate entities (Deloitte Network) are by means of this survey or the survey results, rendering professional advice or services. Neither
this survey nor the survey results is a substitute for any kind of professional advice or services. The Deloitte network is not responsible for any loss
whatsoever sustained by any person who relies on this survey or the survey results.
©2015 Deloitte Touche Tohmatsu India Private Limited. Member of Deloitte Touche Tohmatsu Limited


![HD Видеокамера HC-V770 HC-V760 HC-VX870 HC-VX870M · hc-v770 [v770] Серияv770 / серия [v770] hc-v770m [v770m] hc-v760 [v760] – Данная инструкция](https://static.fdocuments.net/doc/165x107/5e697831d35b2b14c40ee20b/hd-hc-v770-hc-v760-hc-vx870-hc-vx870m-hc-v770-v770-v770.jpg)