IMWP Hedge 4 PDF - J.P. Morgan Home | J.P. Morgan future return projections for each hedge fund...
18
INVESTMENT INSIGHT U nderstanding the drivers of hedge fund strategy returns
Transcript of IMWP Hedge 4 PDF - J.P. Morgan Home | J.P. Morgan future return projections for each hedge fund...

I N V E S T M E N T I N S I G H T
Understanding the drivers of hedge fund
strategy returns

2
Executive summary _______________________________ 3
Introduction _____________________________________ 4
Data and methodology ____________________________ 5
Discussion of results______________________________ 6
Potential applications____________________________ 10
Conclusion _____________________________________ 13
Appendix ______________________________________ 14
Bibliography ___________________________________ 16
JPMorgan Alternative Asset ManagementJ.P. Morgan Alternative Asset Management, Inc. (JPMAAM),a division of JPMorgan Asset Management, is a leadingmanager of hedge fund investment portfolios. With overten years of experience in the development and manage-ment of hedge fund products, JPMAAM has one of thelargest teams in the industry, with more than 65 employ-ees and US$8.5 billion in assets under management (as ofMay 31, 2005).
About the authors:This research paper was authored by Corey Case andTuygan Teoman. Corey Case is the head of the Risk Management and Quantitative Analysis Group ofJPMorgan Alternative Asset Management, and Tuygan Teoman is a senior member of the group.
[email protected]: 212-837-9099
[email protected]: 212-837-9241
T A B L E O F C O N T E N T S
U n d e r s t a n d i n g t h e d r i v e r s o f h e d g e f u n d s t r a t e g y r e t u r n s

Executive summary
Understanding the impact of broad macroeconomicfactors on hedge fund returns has become increas-ingly important to investors. Such an understandingcan help in assessing the exposure to macro-levelrisk factors and aids in constructing and managinga portfolio of hedge funds to meet risk and returnobjectives.
JPMorgan Alternative Asset Management has con-ducted extensive research to identify the macro fac-tors driving hedge fund returns and to quantify theirimpact on the returns of major hedge fund strate-gies, including: distressed securities, relativevalue, merger arbitrage, event-driven, long/shortequities, short selling and opportunistic/macrostrategies.
Research findings:
• Our research indicates that it is possible to identi-fy stable factors that have historically influencedreturns for various hedge fund strategies.
• Using multi-variate regression analysis, wedemonstrate the impact of key market variablessuch as interest rates, credit and equity marketson historical hedge fund returns.
• The result of our research is a multi-factor modelwhich can be used in estimating the likely impactof such variables on the level of returns for eachof the major hedge fund strategies.
• The model has proven to be statistically signifi-cant, robust and stable over discrete time periodsand produces intuitive results.
Potential applications: The main uses of the model include:
1. Developing return expectations: By incorporat-ing forward looking capital market assumptionsfor each of the market variables it is possible toform future return projections for each hedgefund strategy and to aggregate return projections at the overall portfolio level. These projections can be refined with adjustmentsto account for qualitative/real world considerations.
2. Stress testing: The multi-factor model can beadapted for risk management purposes, suchas testing the likely impact of extreme marketevents on hedge fund strategy returns.
3. Portfolio management: The model can be incor-porated into the portfolio management processfor a portfolio of hedge funds. For example,expectations for future strategy performancecan be used, as one of many inputs, to adjuststrategy allocations to achieve the desiredrisk/return characteristics of the portfolio.
I N V E S T M E N T I N S I G H T
U n d e r s t a n d i n g t h e d r i v e r s o f h e d g e f u n d s t r a t e g y r e t u r n s
3

4
IntroductionThe increasing asset flows into hedge funds, particularly
from institutional investors, combined with lower recent
returns has led many to question the ability of hedge
fund managers to generate historical levels of returns.
Many attribute these diminished returns to increased
asset flows as more investors chase fewer opportunities.
However, this rationale ignores the impact of capital
market conditions over recent years.
We believe it is critically important for investors to
understand the broad economic and market conditions
that impact hedge fund returns. Our research aims to
enhance this understanding by examining the historical
relationship between key market factors and hedge fund
performance. Towards this end, we have formulated a
multi-factor regression model, which can help assess the
factors influencing returns of seven major absolute return
strategies: distressed securities, relative value,
long/short equity, short-selling, opportunistic/
macro, event-driven and merger arbitrage.
The multi-factor model can help translate capital mar-
ket performance expectations for equities, interest rates,
fixed income and credit spreads into performance expec-
tations for hedge fund strategies. Similarly, because the
model captures the sensitivity of hedge fund returns to
macro-level variables, it can be used to stress-test the
performance of hedge fund strategies under extreme
market scenarios.
LimitationsOf course, quantitative modeling in the hedge fund
space faces certain limitations due to the non-normal dis-
tribution of returns and the diversity and complexity of
investment styles and manager skills. As such, the
explanatory power of the model is not as high as that
observed when modeling the returns of traditional man-
agers. Nevertheless, we believe the model provides an
important framework for understanding hedge fund
strategy returns and provides valuable input into the
management of portfolios of hedge funds. Qualitative
adjustments can then be made to reflect changes in the
hedge fund industry and the differences between the cur-
I N V E S T M E N T I N S I G H T
U n d e r s t a n d i n g t h e d r i v e r s o f h e d g e f u n d s t r a t e g y r e t u r n s
’92
Assets in billions ($)
’96 ’97 ’00’94 ’95 ’99 ’02 ’04’93 ’01 ’03’98’91’90
7,436 Funds
610 Funds
0
100
200
300
400
500
600
700
800
900
1,000
1,100
Major hedge fund strategies
Distressedsecurities
Opportunistic/ macro
Long/short equity
Short sellers
Relative value
Event driven
Merger arbitrage
DirectionalArbitrage
2000 2001 2002 2003 2004
-10%
-20%
0%
10%
20%
30%5 year annualized returns 3 month T-bills 2.66%S&P 500 -2.30%HFR fund weighted index 7.13%
U.S. T-Bill S&P 500 HFR Fund Weighted Index
Source: Hedge Fund Research (HFR), Inc.
Source: Bloomberg L.P., Hedge Fund Research (HFR), Inc.
Exhibit 1: Estimated growth of hedge fund assets (1990-2004)
Exhibit 2:Historical returns
Exhibit 3: Major hedge fund strategies

5
rent macroeconomic outlook and that which prevailed over
the period on which the model is based.
I. Data and methodologyPrevious research has also sought to identify the market
factors that drive hedge fund performance.1 This research
typically used single proxies to explain strategy perform-
ance, e.g., the S&P 500 index alone as a proxy for equities
and 3-month T-bills as a proxy for the interest rate vari-
able. However, our research covers a more comprehensive
set of economic variables for two primary reasons. First, a
broad set of variables is better aligned with the exposures
of a diversified portfolio of hedge funds. For example, the
use of the S&P 500 index alone as an equity market proxy
may not be sufficient to explain the performance of small
and mid capitalization stocks. Likewise, the trend embed-
ded in 3-month T-bill rates may not be representative of
that for other maturities of the yield curve. Second, the
use of a comprehensive set of variables enables us to con-
duct well-defined stress tests on portfolios of hedge funds.
For instance, since our model incorporates both short
term and long term interest rates, we can more accurately
assess the impact of non-parallel shifts in the yield curve.
Our research also puts greater emphasis on statistical
robustness and stability over pure explanatory power. Most
of the previous research in this area used the same set of
factors for each strategy and assessed the results over the
entire period of analysis. However, our approach deter-
mined which set of factors were significant for each strate-
gy and ensured that the final set of factors was statistically
significant, not only across the entire time period studied,
but also across discrete time periods (rolling three to four
year periods). While we have endeavored to use the most
comprehensive set of factors as possible, there may be vari-
ables that could lead to slightly higher explanatory power
at the expense of the stability of the model over discrete
time periods. Our model places a premium on the stability
of factors as we believe this increases the usefulness of the
model. Nevertheless, the ability of hedge fund managers
to dynamically adjust their trading strategies indicates
that there may be factors prevalent during certain periods
that lose significance over longer time periods. For exam-
ple, volatility (as measured by the VIX2) proved to have
significance for certain strategies during certain periods
but was not consistently present to become part of the
model. We discuss ways to adjust for such factors through
a qualitative overlay later in the paper.
Hedge fund strategy returnsWe used the Hedge Fund Research (HFR) strategy
indices for historical hedge fund strategy returns. This
is a widely used industry database to which hedge fund
managers voluntarily report their performance. While
issues of survivorship and selection bias in hedge fund
indices have been well researched and discussed else-
where, we believe the indices possess sufficient data qual-
ity to perform this analysis. We used April 1995 through
September 2004 as the period for investigation. This
includes many periods of significant market dislocation
such as the Asian crisis in 1997, the Russian debt default
crisis in 1998 and the bursting of the technology bubble
in 2000.
Principal component analysisWe began with a list of 112 macroeconomic financial
variables, which covered equities, credit related variables,
swap spreads, interest rates, currencies, commodities,
fixed income, volatility, business and investor sentiment,
and option related variables. After running several regres-
sion models for each strategy with different permutations
of these variables, we finalized the set to 12 variables.
Given the interrelationship of financial markets and glob-
alization of economies, these variables had a somewhat
correlated nature, e.g., the Federal funds rate and the ten
year U.S. Treasury yield. Therefore, as we increased the
number of variables in the regression equation, we ran
into statistical complexities such as multi-collinearity3,
which adversely impact the robustness of our multi-factor
models. In order to utilize a comprehensive set of factors
while maintaining the robustness of the multi-factor
model, we used principal component analysis4 (PCA).
PCA is a multi-variate statistical methodology that helps
to produce uncorrelated variables from a set of correlated
variables and to reduce the number of factors.
1. Please see bibliography for related research.2. The Chicago Board Option Exchange Market Volatility Index (VIX) represents the implied volatility on the S&P 100 option and is used
as a proxy for market volatility.3. Multi-collinearity refers to the case in which the different factors in the regression equation are correlated.4. Refer to the appendix for a more detailed description of principal component analysis.

6
Using PCA, we constructed the following principal
components:
1. credit component
2. interest rate level component
3. U.S. equity market component
• The credit component is composed of the following
factors: 1) average option-adjusted spreads between
AAA rated bonds and BBB rated bonds, 2) the returns
on the Lehman High Yield and Merrill Lynch High
Yield Master II indices, and 3) the change in the
LBOX and LBPX swaption volatility indices.5
The credit component is positively related to credit
spreads and changes in swaption volatilities and inverse-
ly related to high yield returns. That is, an increase in
the value of the credit component is driven by a widen-
ing of credit spreads, an increase in swaption volatilities
and a decrease in high yield returns. Likewise, a
decrease in the value of the credit component is driven
by a tightening of credit spreads, an increase in high
yield returns and a decrease in swaption volatilities.
• The interest rate level component consists of
1) Federal funds rate, 2) one-month LIBOR, and
3) yield on 2-year, 5-year and 10-year U.S. Treasuries.
The interest rate component is positively related to all
of the individual interest rate levels. In other words, an
increase in the interest rate level component is associat-
ed with an increase in overall levels of interest rates and
a decrease in the interest rate level component is associ-
ated with a decrease in overall levels of interest rates.
• The U.S. equity market component is composed of
1) S&P 500 index returns, 2) NASDAQ Composite
index returns and 3) Russell 2000 index returns.
The U.S. equity market component is positively related
to all of the constituent equity market indices. Hence,
well-performing equity markets will lead to higher val-
ues of the U.S. equity market component while poor
performing equity markets will result in lower values of
the U.S. equity market component. We found that
adding international equity indices did not significantly
improve the explanatory power of the model.
After constructing the credit, equity and interest rate com-
ponents, we ran regressions using these components against
the major hedge fund strategy returns to establish whether
the components had an impact on strategy performance.
II. Discussion of resultsIt is encouraging to see that it is possible to develop stable
and statistically significant regression models for each of
the major hedge fund strategies. The multi-factor models
for each strategy have highly consistent beta coefficients6
across different time intervals within the overall time-
frame. In addition, they have relatively strong explanatory
power and high hit ratios7.
We must also introduce one other element to the model;
alpha. For this model, alpha is defined as that portion of
return that is not attributable to the components we have
identified. This may represent the portion of return attrib-
utable to manager skill or to factors not yet identified. In
fact, alpha is typically the single most significant factor in
5. LBOX and LBPX are two different swaption volatility indices provided by Lehman Brothers. The former index computes volatility based on yield and the latter computes volatility based on price.
6. Beta coefficients measure the sensitivity of the dependent variable to changes in independent variables.7. Hit ratio represents the frequency with which the model correctly estimates the sign of the return in one half of the data set when the
beta coefficient estimates are based on the other half of the data set. Higher hit ratios lead to greater confidence in the ability of themodel to correctly predict the direction of returns.
Economic/
financial
data
Principal
component
analysis
Factors
Exhibit 5: Principal components
Exhibit 4: Principal component analysis
Component Factors
Credit Credit spreads, High yield returnsChanges in swaption volatilities
Interest rate level Federal Funds rate, LIBOR2, 5 and 10 year U.S. Treasuries
U.S. equity S&P 500, Nasdaq, Russell 2000
7
hedge fund strategy returns. Although we are using index
data, alpha is still present as we are dealing with returns
for a set of hedge fund managers rather than a pure securi-
ty market index such as the S&P 500 Index.
For each of the major strategies, we provide a brief
description of the strategy and an interpretation of the
beta coefficients of each factor. We limit our discussion in
the body of this report to a review of the results and
impact of the model. Please see the appendix for detailed
results of the regression analysis.
Distressed securitiesManagers in this strategy invest in the debt and equity
securities of companies in reorganization or bankruptcy.
Such securities tend to sell off dramatically when they
near/enter bankruptcy as traditional investors seek to
offload such securities for reasons of risk aversion, inability
to understand the bankruptcy process, etc. Typically, dis-
tressed securities managers perform in-depth credit analysis
to determine if distressed securities are trading at a dis-
count to their fundamental/break-up value. If they appear
undervalued, managers will typically invest in and hold the
securities until the company emerges from restructuring.
Our analysis shows that the returns for the distressed
securities strategy increase with the tightening of credit
spreads, increasing returns on high yield indices and
lower volatility in the swaption markets. This seems log-
ical, given the nature of the strategy and the generally
net long bias of managers in the space. Tightening credit
spreads and higher high yield returns indicate a greater
appetite for risk on behalf of investors. This environment
makes it easier for companies to raise money for invest-
ment as investors are more likely to provide financing to
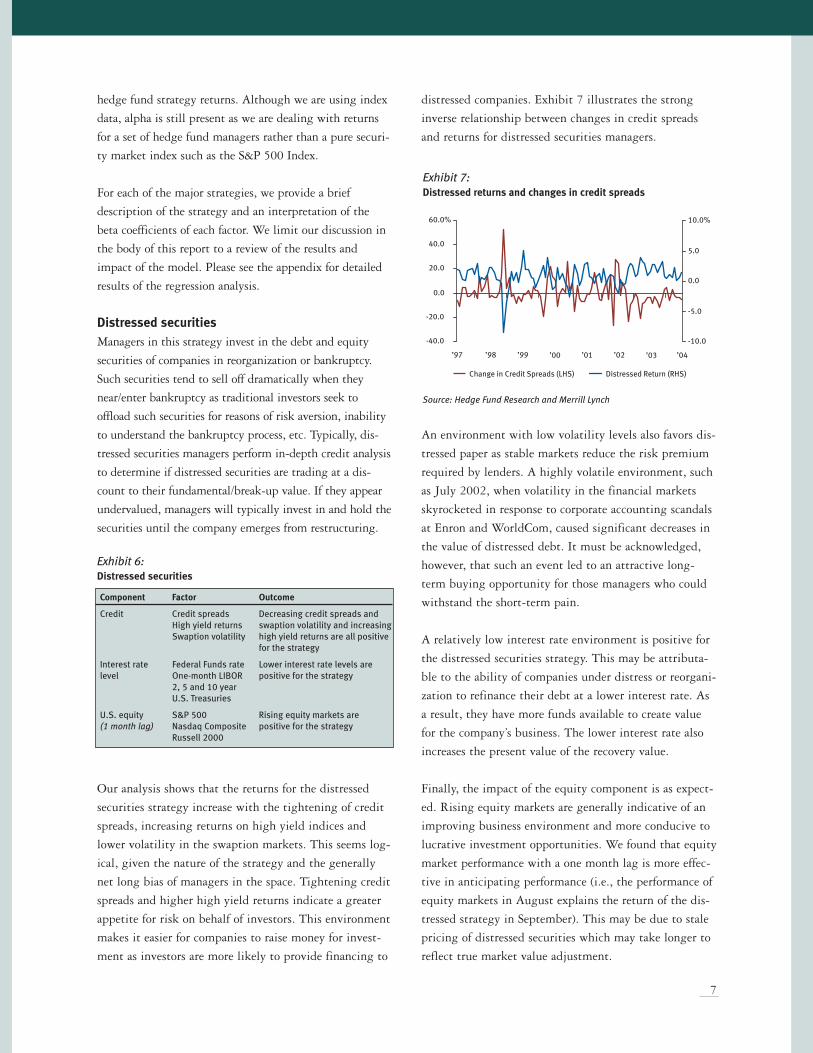
distressed companies. Exhibit 7 illustrates the strong
inverse relationship between changes in credit spreads
and returns for distressed securities managers.
An environment with low volatility levels also favors dis-
tressed paper as stable markets reduce the risk premium
required by lenders. A highly volatile environment, such
as July 2002, when volatility in the financial markets
skyrocketed in response to corporate accounting scandals
at Enron and WorldCom, caused significant decreases in
the value of distressed debt. It must be acknowledged,
however, that such an event led to an attractive long-
term buying opportunity for those managers who could
withstand the short-term pain.
A relatively low interest rate environment is positive for
the distressed securities strategy. This may be attributa-
ble to the ability of companies under distress or reorgani-
zation to refinance their debt at a lower interest rate. As
a result, they have more funds available to create value
for the company’s business. The lower interest rate also
increases the present value of the recovery value.
Finally, the impact of the equity component is as expect-
ed. Rising equity markets are generally indicative of an
improving business environment and more conducive to
lucrative investment opportunities. We found that equity
market performance with a one month lag is more effec-
tive in anticipating performance (i.e., the performance of
equity markets in August explains the return of the dis-
tressed strategy in September). This may be due to stale
pricing of distressed securities which may take longer to
reflect true market value adjustment.
Exhibit 6: Distressed securities
Component Factor Outcome
Credit Credit spreads Decreasing credit spreads and High yield returns swaption volatility and increasing Swaption volatility high yield returns are all positive
for the strategy
Interest rate Federal Funds rate Lower interest rate levels arelevel One-month LIBOR positive for the strategy
2, 5 and 10 year U.S. Treasuries
U.S. equity S&P 500 Rising equity markets are (1 month lag) Nasdaq Composite positive for the strategy
Russell 2000
-40.0
-20.0
0.0
20.0
40.0
60.0%
-10.0
-5.0
0.0
5.0
10.0%
’97 ’98 ’99 ’00 ’01 ’02 ’03 ’04
Change in Credit Spreads (LHS) Distressed Return (RHS)
Source: Hedge Fund Research and Merrill Lynch
Exhibit 7:Distressed returns and changes in credit spreads

8
Relative valueThe relative value strategy involves the simultaneous
purchase and sale of related or correlated instruments to
exploit perceived pricing differentials. Managers general-
ly attempt to neutralize long and short positions to min-
imize the impact of general market movements. This
strategy includes convertible bond arbitrage, equity mar-
ket neutral, fixed income arbitrage, capital structure
arbitrage and statistical arbitrage.
Our analysis reveals that, generally speaking, relative value
managers have tended to be long credit, which can be
explained by the inherent credit exposure within the con-
vertible bond and capital structure arbitrage strategies.
Thus, tightening of credit spreads, rising high yield mar-
kets and decreasing swaption volatility provides a favor-
able environment for relative value managers.
Relative value strategies involve identifying relatively
mispriced securities due to dislocations and anomalies in
the market. A market environment in which the overall
level of interest rates is relatively high would offer more
opportunities to make money than one in which the
overall level of interest rates is low. The higher interest
rate environment increases both the probability and the
size of the dislocations. The higher risk should, in theory,
lend itself to higher levels of return. For example, a very
low interest rate environment means rates are likely to
move in one direction only (i.e., upwards) while a higher
level of interest rates leads to more speculation on the
direction of future interest rate movements. Furthermore,
as most relative value managers run leveraged portfolios,
managers tend to put in trades that have a spread over
the borrowing rate. Therefore, when the overall level of
interest rates is higher, the absolute level of returns
expected (i.e., the reference rate plus the spread) will be
higher than in a low interest rate environment.
Merger arbitrageMerger arbitrage managers invest in the securities of firms
involved in mergers or acquisitions. Classical merger arbi-
trage usually involves taking a long position in the target
company and a short position in the acquiring company,
seeking to earn a spread between the target’s share price
and the announced offer price. The short position should
hedge out (unwanted) equity market exposure.
Our research indicates that a market environment in
which credit spreads are tightening, high yield markets
are doing well and volatility in swaption markets is rela-
tively muted, is more conducive to higher returns from
merger arbitrage activity. The total number of deals vari-
able has a positive impact on returns as illustrated by
Exhibit 10. In line with expectations, increased M&A
activity, as measured by the total number of outstanding
deals, leads to a greater number of arbitrage opportunities
from which merger arbitrage managers can profit.
-3.00
-2.00
-1.00
0.00
1.00
2.00
3.00%
0
50
100
150
200
250
300
Merger Arbitrage Returns (LHS) Total Deals (RHS)
’99 ’00 ’01 ’02 ’03 ’04
Source: Hedge Fund Research, Bloomberg L.P.
Exhibit 9: Merger arbitrage
Component Factor Outcome
Total # of deals Greater deal activity ispositive for the strategy
Credit Credit spreads Decreasing credit spreads, High yield returns swaption volatility andSwaption volatility increasing high yield returns
are all positive for the strategy
Exhibit 10: Merger arbitrage monthly returns and deal activity
Exhibit 8: Relative value
Component Factor OutcomeCredit Credit spreads Decreasing credit spreads and
High yield returns swaption volatility and increasingSwaption volatility high yield returns are all positive
for the strategyInterest rate Federal Funds rate Higher interest rate levels arelevel One-month LIBOR positive for the strategy
2, 5 and 10-year U.S. Treasuries

9
Event drivenThe managers in this universe are seeking returns on
investments in the securities of companies which are
undergoing company specific events such as restructuring,
litigation, spin-offs and recapitalizations. Performance for
the securities of such firms is influenced heavily by the
uncertainty around the events.
Our research indicates that the credit component plays a
significant part in returns for the event driven strategy.
This may be partly attributed to many managers in the
event driven index having exposure to distressed debt. As
such, an environment where credit spreads are relatively
tighter and high yield returns are higher tends to benefit
such companies. In addition, a rising equity environment
will favorably impact the strategy as there is often an
interval between events during which equity event posi-
tions are impacted by general market movements.
Long/short equityLong/short equity managers take long or short positions
in equity securities, which are deemed to be under- or
overvalued. Managers do not generally attempt to neu-
tralize the amount of long or short positions, i.e., they
will either be net long or net short rather than market
neutral. Long/short equity managers tend to have, on
average, a net long exposure between 10% and 40%,
which helps explain why such managers do well when
the equity markets are rising. The scatter plot in Exhibit
12 shows the positive relationship between HFR
long/short equity strategy returns and returns for the
Russell 2000 Index.
In fact, we found that we did not need to use a broader
equity component to model returns as the Russell 2000
index had a very high explanatory power.
We believe that a single equity variable should not suf-
fice to explain the return drivers of any particular strate-
gy. Certain hedge fund managers may be able to protect
capital in downside markets, creating an option-like pay-
off structure in the returns, whereby the returns are
expected to be more correlated in up equity markets but
less correlated in down markets.
Short sellingDedicated short sellers seek to profit from declining
security prices by assuming short positions in companies
with unfavorable prospects. The strategy is generally
used to hedge equity exposure in other parts of a portfo-
lio and provides downside protection in times of severe
market dislocation.
The analysis reveals a strong relationship between
declining equity markets and positive returns for the
short selling strategy.
Exhibit 14: Short selling
Component Factor Outcome
U.S. equity S&P 500 Declining equityNasdaq Composite markets are positive Russell 2000 for the strategy
Exhibit 11: Event driven
Component Factor Outcome
Credit Credit spreads Decreasing credit spreads andHigh yield returns swaption volatility and increasingSwaption volatility high yield returns are all positive
for the strategy
U.S. equity S&P 500 Rising equity markets are Nasdaq Composite positive for the strategyRussell 2000
HFR
Lon
g/S
hort
Equ
ity
Str
ateg
y Re
turn
s
-25.00
-20.00
-15.00
-10.00
-5.00
0.005.00
10.00
15.00
20.00
25.00%
0.00-10.00% -5.00 5.00 10.00 15.00
Russell 2000 Returns
Exhibit 12:A scatter plot of HFR long/short equity returns vs. Russell 2000returns
Source: Hedge Fund Research, Bloomberg L.P.
Exhibit 13: Long/short equity
Factor Outcome
Russell 2000 Rising equity markets are positive for the strategy

10 10
Opportunistic/MacroOpportunistic/Macro managers invest in a wide variety
of strategies/instruments in major global markets
including currencies, interest rates, equities and com-
modities, usually assuming a directional position based
on their macroeconomic forecasts for these markets.
Managers typically focus on fundamental research or are
quantitative/momentum based.
This strategy is the most difficult to model as these
managers tend to shift their market focus opportunisti-
cally and frequently. Therefore, it is difficult to extract
a model that is stable and robust throughout time. The
focus of the macro strategy over the first five years of
our research (1995 to 1999) was heavily tilted towards
equities as well as Japanese Yen currency trades.
However, the focus in the last five years has shifted
more to yield curve trades and currency trades involv-
ing the Euro. Hence, the factors that are statistically
significant in the first half of the period do not satisfac-
torily explain the HFR Macro index returns in the sec-
ond half. Since our outlook on the macroeconomic land-
scape over the next three years is more similar to that of
the second half, we utilize the factors prevalent in that
period, including the Lehman Aggregate Bond index,
S&P 500 index and the Euro, as the principal factors
driving performance.
Fund of FundsAlthough our model has a relatively high and stable
explanatory power for individual strategies, we did not
seek to develop a model to explain returns for the hedge
fund of funds index. The diversity of strategies employed
in fund of funds and their ability to adjust strategy alloca-
tions in response to changing market conditions make it
difficult to identify stable return drivers over various time
periods. Our primary focus was on understanding strategy
level return drivers which are important building blocks
in the fund of funds portfolio construction process.
Return assumptions at the strategy level can be aggre-
gated to formulate overall return projections for a
portfolio of hedge funds. Future research will also seek
to extend the model to identify drivers of return at the
manager level.
III. Potential applications
Developing return expectationsHaving developed a model that identifies stable factors
for each hedge fund strategy we can now take capital
market performance assumptions for these factors and
develop return projections for each strategy. The return
projection analysis in Exhibits 16 and 17 is based on
general capital market performance assumptions devel-
oped in conjunction with JPMorgan Asset Management’s
Strategic Investment Advisory Group (SIAG). For illus-
trative purposes, we provide return projections for the
distressed securities and long/short equity strategies.
Example 1: Distressed securitiesUsing our capital market assumptions for the components
influencing distressed returns and assuming historical
levels of alpha we arrive at a three year return assump-
tion of 11.46% for the distressed strategy (Exhibit 16).
Formula: monthly return expectation =
monthly alpha + betai x composite factor i
66bps + [(-0.0739) (-0.0068) + (-1.7341) (-0.0013) +
(-0.1094) (0.0025)] = 0.91% monthly return expectation
Annualized return = (1+0.91%)12 - 1 = 11.46%
Qualitative adjustmentsIt is here that we must examine and adjust for qualitative
considerations. The data on which the model betas are
based cover very bullish periods for the distressed strategy
and managers were able to add very significant alpha of 66
bps per month. Given the current industry outlook and
the fact that we have also just completed a cycle of extend-
ed credit spread tightening, we do not believe that the
average distressed manager in the HFR Distressed index is
going to be able to deliver a monthly alpha of 66 bps. The
current level of credit spreads and the expected average
level of the spreads in the next three years are similar to
those in the period between December 1996 and July
Exhibit 15: Opportunistic/Macro
Factor Outcome
Lehman Aggregate Rising fixed income market ispositive for the strategy
Euro Strengthening Euro is positivefor the strategy
S&P 500 Rising equity market is positivefor the strategy

11
2000. The corresponding monthly alpha attained during
that period was 32 bps. If we hold the factor sensitivities
the same and reduce the expected alphas we arrive at the
lower expected return of 7.04% for the strategy.
Example 2: Long/short equityUsing the same approach as previously discussed, the
model produces a return estimate for the long/short
equity strategy of 14.73% (Exhibit 17). Again, a high
and probably unsustainable level of alpha is embedded
in the return estimate. Long/short equity managers faced
a somewhat easier environment in which to invest in the
early period of the analysis (1995-1999), but we have
observed a diminution in the ability to generate alpha
over the last few years. Many theories have been sug-
gested for this decline, from the greater number of
investors in the long/short space and the growing con-
servatism of managers, to the increased difficulty of
shorting. Given this decline, we believe that the histori-
cal levels of alpha delivered by the hedge fund managers
in this space are unlikely to be attained in the coming
years. We have adjusted the level of expected alpha
downward from 90 bps per month to 50 bps per month.
When we adjust for this lower level of alpha we arrive at
a return assumption of 9.41%.
Stress testingFrom a risk management standpoint, the model can also
be used to conduct stress tests and sensitivity analysis on
portfolios of hedge funds. It is important for a portfolio
manager or risk manager to be able to assess the possible
impact of a dramatic drawdown in the equity markets,
an unexpected widening of credit spreads, or a large
increase in interest rates. The downside in extreme stress
scenarios is of great concern to the hedge fund investor.
For illustrative purposes, we will consider a credit shock
on the distressed strategy to demonstrate how the multi-
factor analysis can be utilized for stress testing.
Scenario: Credit spreads widen by more than 30–40 bpsLet us assume that the current level of credit spreads
(option adjusted) between AAA rated bonds and BBB
rated bonds is about 55 bps. When credit spreads widen
by more than 30-40 bps, the high yield markets will
experience a dramatic downfall and the swaption volatili-
3 yearAnnualized Return
Capital Projection (modelMarket predicted andAssumption Betas adjusted)
Actual monthly alpha 90 bps predicted:14.73%Adjusted monthly alpha 50 bps adjusted: 9.41%
Russell 2000 7.25% 0.4176
Exhibit 17: Three-year return projection schedule for long/shortequity strategy
3 yearAnnualized Return
Capital Projection (modelMarket 3 year predicted andAssumption Composite Factor Betas adjusted)
Actual monthly alpha 66 bpsAdjusted monthly alpha 32 bps
Credit component Credit spreads 100 bpsHigh yield returns 5.75% (0.0739) (0.0068)Change in swaption volatility n/a
Interest rate level component Federal Funds Rate 3.75% predicted: 11.46%LIBOR 4.00% adjusted: 7.04%2-year Treasuries 4.00% (1.7341) (0.0013)5-year Treasuries 4.50%10-year Treasuries 4.75%
U.S. equity component S&P 500 7.00%(1-month lag) NASDAQ Composite 7.25% (0.1094) 0.0025
Russell 2000 7.25%
Exhibit 16: Three-year return projection schedule for distressed securities strategy
Shown for illustrative purposes only. Numbers in parentheses are negative. Slight discrepancies may exist due to rounding.Source: JPMorgan Alternative Asset Management and JPMorgan Asset Management Strategic Investment Advisory Group (SIAG).

12
ties will surge. There have been two occasions in the last
10 years when credit spreads widened by more than 30-
40 bps in a month: the Russian default crisis in 1998
and the ensuing collapse of LTCM, and the post Enron
credit crunch in the summer of 2002.
In the summer of 2002, the numerous corporate account-
ing scandals following the collapse of Enron led to a
severe credit crunch in the capital markets. At that time,
high yield indices dropped by 7.5% and 4.0% in June
2002 and July 2002, respectively, while credit spreads
surged from 132 bps to 169 bps and then to 210 bps.
Swaption volatility increased by 12% in the 1998 scenario
and by about 8% in the 2002 scenario. Exhibit 18 shows
what the model would predict given the prevalent capi-
tal market conditions in July 2002. The projected return
of -2.23% is close to the actual HFR Distressed Strategy
return of -2.07%.
In the summer of 1998, credit spreads jumped from 63
bps in July 1998 to 96 bps in August 1998 upon the
emergence of the news about LTCM and Russia. High
yield indices posted a drawdown of 5%. Our model
underestimates the extent of the loss for the distressed
strategy in this period. However, we believe the out-
come of the July 2002 stress test is more relevant as the
development of credit default swaps, the increasing size
and diversity of the distressed market, and better hedg-
ing techniques of managers should mitigate some of the
adverse effects of a credit shock. Nevertheless, it does
illustrate the possibility for extreme market scenarios
to overwhelm even the most sophisticated modeling
techniques.
To make an assessment at the portfolio level, the impact
of the scenario should be evaluated for each strategy
using the multi-factor model. Then, the strategy results
should be aggregated to arrive at a conclusion for the
overall portfolio. Please note that the diversification
benefits of using multiple strategies are implicit in the
differing factor sensitivities for each strategy. For exam-
ple, under the given scenario, because of the anticipated
downfall in the equity markets, the short selling strate-
gy is likely to post high, positive results, substantiating
its function to serve as a hedge in the portfolio.
Portfolio managementThe multi-factor model can also be incorporated into the
portfolio management process for a diversified portfolio of
hedge funds. Expectations for future strategy performance
can be used, as one of many inputs, to determine appropri-
ate strategy allocations. For example, if the model forecasts
higher future returns for event driven strategies, the port-
folio manager can increase allocations to this strategy.
Similarly, when constructing a portfolio of hedge funds,
one could use the expected strategy performance to build
the portfolio to achieve a desired risk/return profile. Of
course, the practicalities and realities of hedge fund invest-
ing dictate that many other variables will influence the
strategy allocation process. Nevertheless, the model can be
used to stimulate discussion and to confirm or challenge
qualitative assessments and conclusions.
Exhibit 18: Distressed securities stress testing given the capital market conditions in July 2002
MonthlyAssumption Composite Factor Betas Projection
Alpha 66 bps
Credit component Credit spreads 210 bpsHigh yield returns (4.13%) 3.6295 (0.0068)Change in swaption volatility 7.35%
Interest rate level component Federal Funds Rate 1.75%LIBOR 1.82% (2.23%)2-year Treasuries 2.24% (3.6238) (0.0013)5-year Treasuries 3.45%10-year Treasuries 4.46%
U.S. equity component S&P 500 (7.79%)NASDAQ Composite (9.20%) (3.5744) 0.0025Russell 2000 (15.10%)
Shown for illustrative purposes only. Numbers in parentheses are negative. Slight discrepancies may exist due to rounding.Source: JPMorgan Alternative Asset Management

13
IV. ConclusionThe expansion of hedge fund investing and increased
institutionalization of the industry demand a thoughtful
and rigorous examination of the nature of hedge fund
returns. With this challenging landscape in mind,
JPMorgan Alternative Asset Management has developed
a model to help identify drivers of return at the strategy
level. Although the explanatory power of the final regres-
sion models for hedge fund strategies may not be as high
as those that are attainable for traditional markets, the
stability of the coefficients gives credence to the poten-
tial value of the models. The high values of the hit ratios
computed for each strategy reinforce the significance of
the models. The fact that the model generated intuitive
results for return projections as well as the stress scenario
has strengthened our commitment to the multi-factor
analysis of hedge fund strategies.
In the end, hedge fund investing will remain a balance
of art and science. This analysis is not to be used in
isolation but must be combined with detailed strategy
level research conducted by experienced hedge fund
analysts. We hope that by constantly examining and
challenging assumptions about hedge funds we will con-
tribute to more informed investment decision-making as
well as enhance the understanding of hedge fund market
dynamics.
14
A P P E N D I X
Regression analysis and principalcomponent analysisRegression analysis is the most common method used to
explain a variable of interest with a given set of independ-
ent variables. Due to the increasing globalization of the
economies and capital markets, the financial markets have a
somewhat correlated nature. However, the use of correlated
explanatory variables results in statistical problems such as
multi-collinearity (i.e., different factors in the regression
equation are correlated), which may adversely impact the
robustness of the multi-factor model. As such, we needed
to find a solution to two problems. First, we wanted to
limit the multi-collinearity effect and find uncorrelated
variables. Second, we needed to find a way to limit the
total number of independent variables used to explain the
variation in the dependent variable (i.e., the strategy-level
returns). Principal component analysis (“PCA”) helps
address both issues. First, PCA is used for producing
uncorrelated variables from a set of somewhat correlated
variables. To accomplish this, the variables are mapped
onto a different set of axes, which are orthogonal to one
another (i.e., the transformed variables are uncorrelated).
Second, PCA is used for data reduction. After the original
set of variables is transformed into new factors, we can easi-
ly gauge the variance explained by each factor. The algo-
rithm works in such a way that the first factor accounts for
the highest variance and the last factor accounts for the
least variance. Furthermore, the algorithm produces the
same number of factors as the number of original variables.
By carefully choosing a subset of these factors, we were able
to account for a significant amount of the variance in strat-
egy returns using a smaller, uncorrelated set of independent
variables. Hence, the PCA methodology provided a direct
remedy to the correlation problem. Despite the many bene-
fits of PCA, there are certain drawbacks. The transformed
variables may not be meaningful. In other words, it is often
difficult to attach an economic meaning to the factors that
emerge as a result of PCA. Second, we have to make sure
that the weights assigned to the original set of variables
that make up each factor are stable over time. Given the
relatively correlated nature of the financial capital markets,
we have had success not only with deriving meaningful fac-
tors but also with achieving stable weights over time.
Fortunately, we have been able to bypass the two major
drawbacks of principal component analysis.
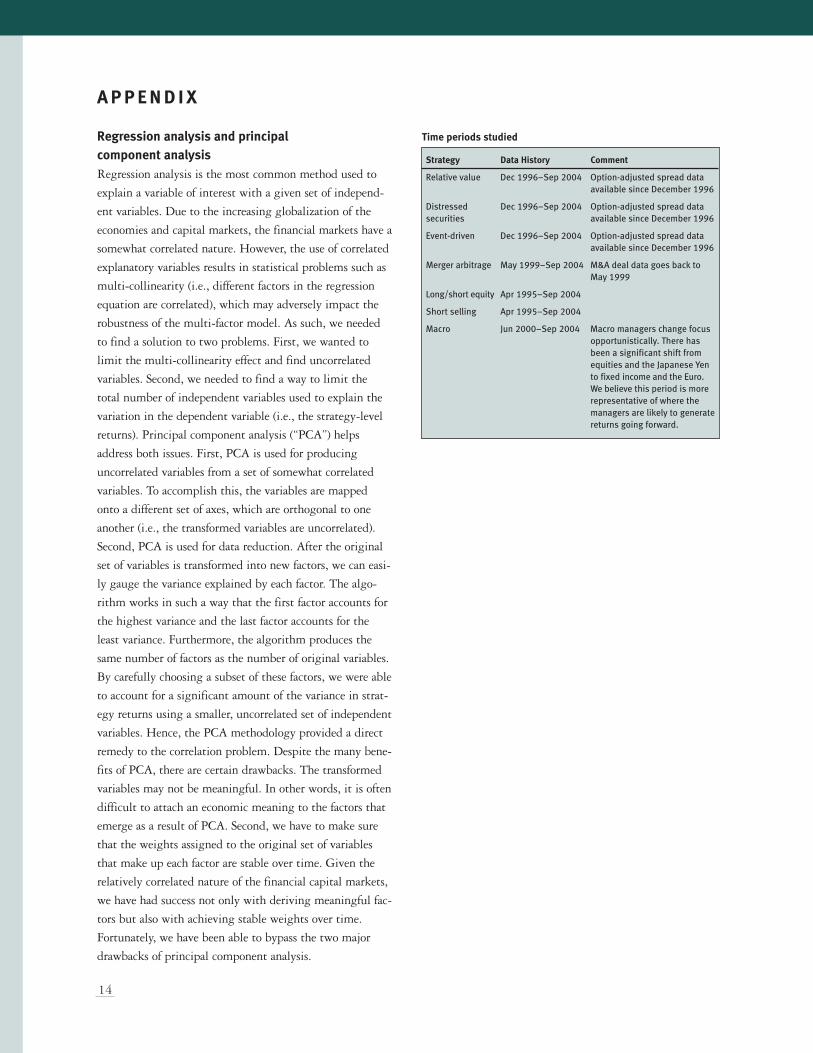
Strategy Data History Comment
Relative value Dec 1996–Sep 2004 Option-adjusted spread data available since December 1996
Distressed Dec 1996–Sep 2004 Option-adjusted spread data securities available since December 1996
Event-driven Dec 1996–Sep 2004 Option-adjusted spread data available since December 1996
Merger arbitrage May 1999–Sep 2004 M&A deal data goes back to May 1999
Long/short equity Apr 1995–Sep 2004
Short selling Apr 1995–Sep 2004
Macro Jun 2000–Sep 2004 Macro managers change focusopportunistically. There hasbeen a significant shift fromequities and the Japanese Yento fixed income and the Euro.We believe this period is morerepresentative of where themanagers are likely to generatereturns going forward.
Time periods studied

15
Regression resultsThe F-statistic and coefficient of determination
(R-squared) are two primary indicators of whether a
regression model is useful or not. The F-statistic provides
a measure of how well the aggregate set of explanatory
variables explains the variation in the dependent vari-
able. More specifically, the F-statistic is used to test
whether at least one explanatory variable explains a sub-
stantial portion of the variation in the dependent vari-
able. Higher F-values signify that the aggregate model is
useful in explaining the variation in the dependent vari-
able. The coefficient of determination (i.e., R-squared) is
a measure of the percentage of variation in the dependent
variable collectively accounted for by all the explanatory
variables. When new explanatory variables are added to
the regression model, R-squared almost always increases
even if the contribution of the new explanatory variable
is not statistically significant. Therefore, we chose to
look at adjusted R-squared, which accounts for the
increase in the number of explanatory variables.
In the results below, the alpha/intercepts, the betas, and
the F-statistic are statistically significant at the 95%
confidence level. Please note that the regression results
shown cover the entire data set. We also ran regression
analyses on a rolling time horizon basis and observed
that the beta coefficients and the explanatory power were
relatively stable across these time periods.
An alpha of 0.66% signifies the excess return the
distressed strategy generated given its exposure to the
credit, interest rate and U.S. equity components. Each of
the independent variables is statistically significant at
the 95% confidence level. The model explains 43% of
the variation in the HFR Distressed index returns. The
model, as a whole, is statistically significant at the 95%
confidence level. The hit ratio for the distressed strategy
is 83%. That is, 83% of the time the model correctly
estimates the sign of the return in the second half of the
data set when the beta coefficient estimates from the first
half of the data set are used.
Both the credit component and the interest rate compo-
nent are statistically significant at the 95% confidence
level. The model explains 34% of the variation in HFR
Relative Value index returns. The model, as a whole, is
statistically significant at the 95% confidence level. The
hit ratio is 91%.
Both the credit component and the total number of deals
variable are statistically significant at the 95% confi-
dence level. The model explains 27% of the variation in
HFR Merger Arbitrage index returns. The model, as a
whole, is statistically significant at the 95% confidence
level. The hit ratio is 76%.
Both the credit component and the U.S. equity component
are statistically significant at the 95% confidence level. The
model explains 46% of the variation in HFR Event Driven
index returns. It is also significant at the 95% confidence
level. The hit ratio is 72% for the event driven strategy.
Normalized Beta1
Alpha 0.66%
Credit Component (0.55)
Interest Rate Component (0.16)
U.S. Equity Component (1 month lag) 0.26
F=24.301, Adj. R2=43%
Normalized Beta
Alpha 0.89%
Credit Component (0.56)
Interest Rate Component 0.22
F=25.344, Adj. R2=34%
Normalized Beta
Intercept (0.0163)
Credit Component (0.43)
Total number of deals 0.34
F=13.110, Adj. R2=27%
Normalized Beta
Alpha 0.87%
Credit Component (0.64)
U.S. Equity Component (1 month lag) 0.16
F=40.448, Adj. R2=46%
1. The normalized beta signifies the standardized regression coefficients.Note: Numbers in parentheses indicate negative values.
Distressed securities
Relative value
Merger arbitrage
Event driven

16
The Russell 2000 index is statistically significant at the
95% confidence level. The model accounts for 76% of
the variation in HFR Long/Short equity index returns.
The model is statistically significant at the 95% confi-
dence level. The hit ratio is 89%.
The U.S. equity component is statistically significant at
the 95% confidence level. The model accounts for 77%
of the variation in HFR Short Selling index returns. The
model, as a whole, is statistically significant at the 95%
confidence level. The hit ratio is 82%.
Each of the independent variables is statistically signifi-
cant at the 95% confidence level. The model explains
27% of the variation in HFR Macro index returns. It is,
as a whole, statistically significant at the 95% confidence
level. The hit ratio is 54%.
B I B L I O G R A P H YAmenc, Noel; El Bied, Sina; Martellini, Lionel (2003):
Predictability in hedge fund returns, Financial Analysts
Journal, Volume 59, Number 5, pp. 32-46.
Edwards, Franklin R. and Caglayan, Mustafa O. (2001):
Hedge fund performance and manager skill, The Journal of
Futures Markets, Vol. 21, No. 11, pp. 1003-1028.
Fung, William and Hsieh, David A. (1997): Empirical
characteristics of dynamic trading strategies: the case of
hedge funds, The Review of Financial Studies, Vol. 10, No. 2,
Summer, pp. 275-302.
Schneeweis, Thomas and Spurgin, Richard (1998):
Estimation: A multi-factor analysis of hedge fund, man-
aged futures, and mutual fund return and risk character-
istics, Journal of Alternative Investments, pp. 1-24.
Schneeweis, Thomas and Kazew, Hossein and Martin,
George (2001): Understanding hedge fund performance:
research results and rules of thumb for the institutional
investor, Lehman Brothers.
Siegel, Laurence B. (2004): Distinguishing true alpha
from beta, CFA Institute Conference Proceedings,
pp. 20-29.
Normalized Beta
Alpha 0.37%Lehman Aggregate 0.32EUR 0.33S&P 500 0.29F=7.198, Adj. R2=27%
Normalized Beta
Alpha 0.21%
U.S. Equity Component (0.88)
F=370.99, Adj. R2=77%
Normalized Beta
Alpha 0.90%
Russell 2000 0.87
F=350.34, Adj. R2=76%
Long/short equity
Short selling
Opportunistic/Macro

17
Opinions and estimates offered constitute our judgment and are subject to change without notice, as are statements of financial market
trends, which are based on current market conditions. We believe the information provided here is reliable, but do not warrant its accura-
cy or completeness. This material is not intended as an offer or solicitation for the purchase or sale of any financial instrument.
References to specific securities, asset classes, and financial markets are for illustrative purposes only and are not intended to be, and
should not be interpreted as, recommendations.
These materials have been provided to you for information purposes only and may not be relied upon by you in evaluating the merits of
investing in any securities referred to herein. Past performance is not indicative of future results. Indices do not include fees or operating
expenses and are not available for actual investment. Indices presented, if any, are representative of various broad base asset classes.
They are unmanaged and shown for illustrative purposes only.
The views and strategies described may not be suitable for all investors. This material has been prepared for informational purposes
only, and is not intended to provide, and should not be relied on for, accounting, legal or tax advice. You should consult your tax or legal
advisor regarding such matters.
JPMorgan Asset Management is the marketing name for the asset management business of JPMorgan Chase & Co.
We welcome all comments and questions. Please contact your relationship manager for more information.
www.jpmorgan.com/assetmanagement ©2005 JPMorgan Chase & Co.

JPMorgan Asset Management • 522 Fifth Avenue New York, NY 10036 • www.jpmorgan.com/assetmanagement
IMWP_Hedge


![Sinope / [J.P. Six]](https://static.fdocuments.net/doc/165x107/577d22a21a28ab4e1e97df95/sinope-jp-six.jpg)