IMS Latin America Review 2004
137
March 15, 2022 © 2002 IMS Health Incorporated or its affiliates. All rights reserved. Strategic review of the pharmaceutical markets in the Latin America/Canada Region Prepared by IMS for Abbott - January 2004
-
Upload
yolanda-cristina-aguiar-morazzani -
Category
Documents
-
view
218 -
download
0
description
Revisión Mercado Latinoamericanos según IMS
Transcript of IMS Latin America Review 2004
April 15, 2023
© 2002 IMS Health Incorporated or its affiliates. All rights reserved.
Strategic review of the pharmaceutical markets in the Latin America/Canada Region
Prepared by IMS for Abbott - January 2004

April 15, 20232
© 2002 IMS Health Incorporated or its affiliates. All rights reserved.
Contents
• Introduction — The Global Pharmaceutical Market
• Latin America/Canada: Regional Overview
• Appendix: Latin America — Country Deep Dive
April 15, 20233
© 2002 IMS Health Incorporated or its affiliates. All rights reserved.
The Global Pharmaceutical Market
April 15, 20234
© 2002 IMS Health Incorporated or its affiliates. All rights reserved.
Global Overview
• Worldwide industry growth slowed
• Cost containment measures universal
• R&D productivity slow to improve
• Generics continue to erode sales growth but not increase volume
Source: IMS Health: MIDAS, MAT September 2003

April 15, 20235
© 2002 IMS Health Incorporated or its affiliates. All rights reserved.
Economic Environment
• Recovery from the recent economic slowdown has been slower than expected
• Governments are increasing spending in an effort to kick-start growth, but deficits are growing as a result
• Performance of the US economy will continue to have a major impact on global economic growth prospects
Source: IMS Health: IMS Market Prognosis Global Data 2003-2007
April 15, 20236
© 2002 IMS Health Incorporated or its affiliates. All rights reserved.
World Population 2003-2007
• World population to reach 6.6 billion by 2007 - growth concentrated in developing regions
• Declining birth rates and increases in life expectancy will continue to drive a gradual shift in the global demographic profile
• These trends will continue to drive up both pharmaceutical consumption and the cost of healthcare provision in both developed and developing countries
Source: IMS Health: IMS Market Prognosis Global Data 2003-2007
April 15, 20237
© 2002 IMS Health Incorporated or its affiliates. All rights reserved.
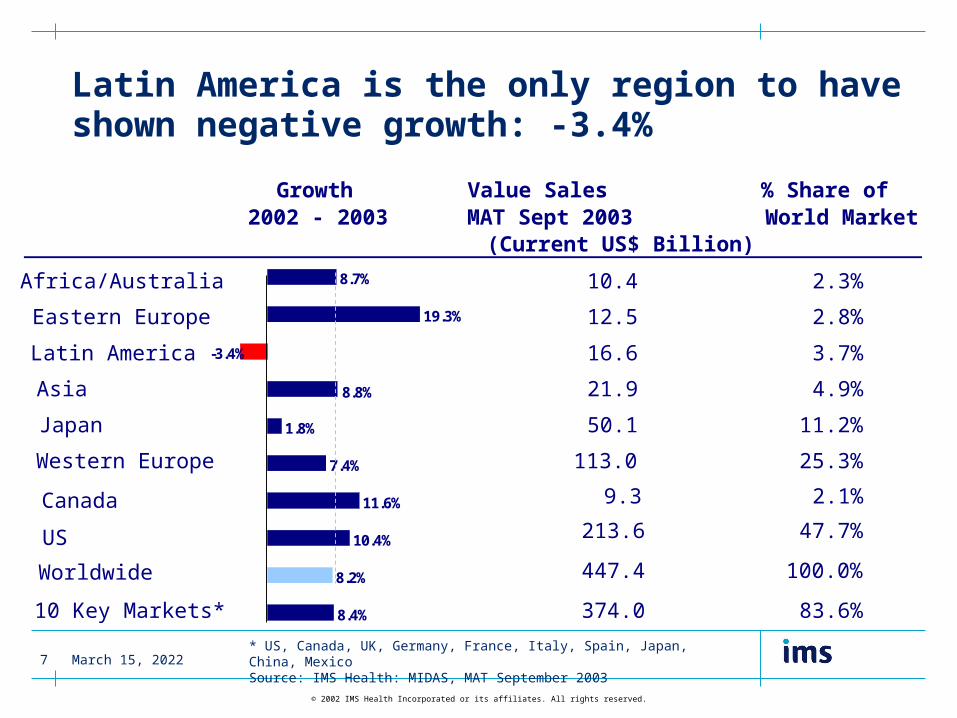
Latin America is the only region to have shown negative growth: -3.4%
Growth2002 - 2003
Value Sales MAT Sept 2003 (Current US$ Billion)
% Share of World Market
Africa/Australia 10.4 2.3%
Eastern Europe 12.5 2.8%
Latin America 16.6 3.7%
Asia 21.9 4.9%
Japan 50.1 11.2%
Western Europe 113.0 25.3%
US 213.6 47.7%
Worldwide 447.4 100.0%
10 Key Markets* 374.0 83.6%8.4%
8.2%
10.4%
11.6%
7.4%
1.8%
-3.4%
19.3%
8.7%
8.8%
* US, Canada, UK, Germany, France, Italy, Spain, Japan, China, MexicoSource: IMS Health: MIDAS, MAT September 2003
Canada 9.3 2.1%
April 15, 20238
© 2002 IMS Health Incorporated or its affiliates. All rights reserved.
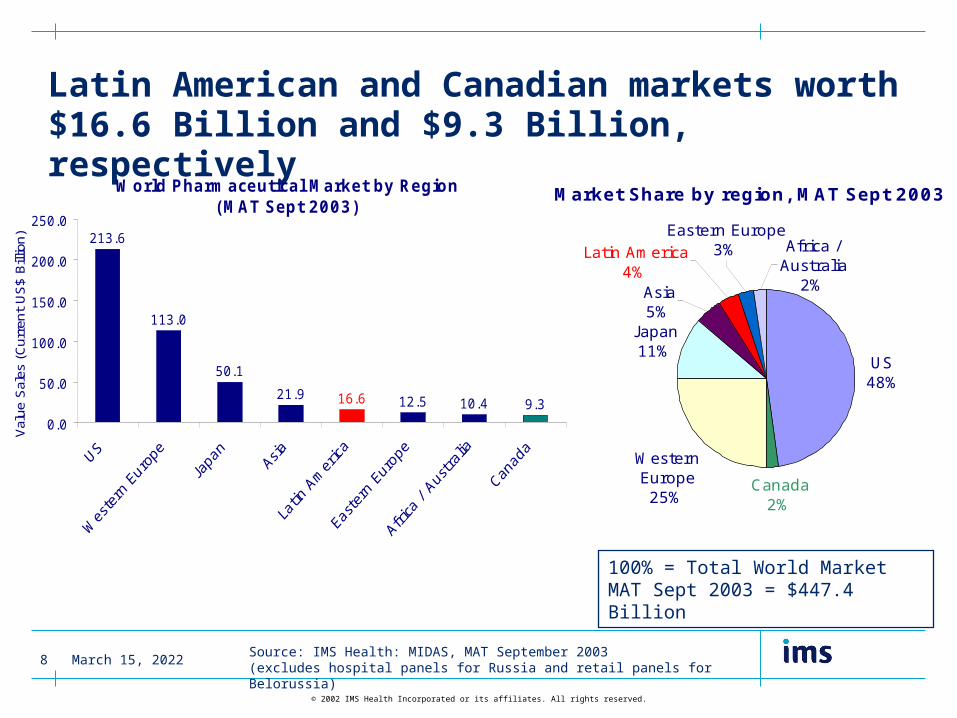
Latin American and Canadian markets worth $16.6 Billion and $9.3 Billion, respectively
World Pharmaceutical Market by Region(MAT Sept 2003)
213.6
113.0
50.1
21.9 12.5 10.4 9.316.6
0.0
50.0
100.0
150.0
200.0
250.0
Val
ue S
ales
(C
urre
nt U
S$
Bill
ion)
100% = Total World Market MAT Sept 2003 = $447.4 Billion
Source: IMS Health: MIDAS, MAT September 2003(excludes hospital panels for Russia and retail panels for Belorussia)
Market Share by region, MAT Sept 2003
Western Europe25%
J apan11%
US 48%
Canada2%
Latin America4%
Asia5%
Eastern Europe3% Africa /
Australia2%
April 15, 20239
© 2002 IMS Health Incorporated or its affiliates. All rights reserved.
12.8
0
5
10
15
Australia
12.5
0
5
10
15
USA
7.1
05
1015
LatinAmerica
1.9
0
5
10
15
J apan
10.7
0
5
10
15
Asia
8.0
05
1015
Top 5Europe
9.7
0
5
10
15
Global
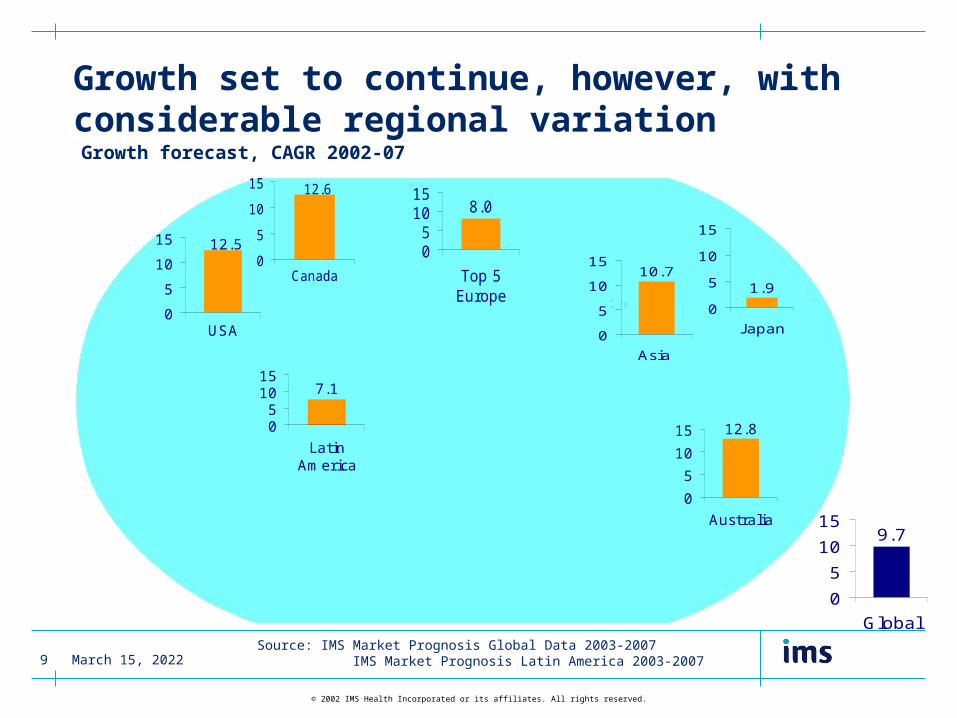
Growth set to continue, however, with considerable regional variationGrowth forecast, CAGR 2002-07
12.6
0
5
10
15
Canada
Source: IMS Market Prognosis Global Data 2003-2007 IMS Market Prognosis Latin America 2003-2007
April 15, 202310
© 2002 IMS Health Incorporated or its affiliates. All rights reserved.
Latin America/Canada:Regional Overview
• The Pharmaceutical Market
• Political, business & healthcare environment
• Abbott’s performance in the region

April 15, 202311
© 2002 IMS Health Incorporated or its affiliates. All rights reserved.
The Latin American/ Canada Pharmaceutical Market, 2003market value (current US$ billion, ex-manufacturer prices)
0 1 2 3 4 5 6 7 8 9 10
Canada
Mexico
Brazil
Argentina
Puerto Rico
Colombia
Venezuela
Central America
Chile
Equador
Peru
Dominican Republic
Uruguay
Other Markets
Canada
Latin America is a highly diverse region Market sizes ranging from US$7.1 Billion in Mexico to US$0.2 Billion in Uruguay
* C. America: Nicaragua, Honduras, Guatemala, El Salvador, Costa Rica, Panama; Retail/non-retail split not available for Central America and other markets
Source: IMS Market Prognosis Global Data 2003-2007 IMS Market Prognosis Latin America 2003-2007
Retail sales
Unaudited non-retail sales
9.2
7.1
4.9
1.6
1.3
1.2
1.2
0.8
0.6
0.5
0.4
0.3
0.2
0.3
** Canada, Puerto Rico include audited hospital sales
April 15, 202312
© 2002 IMS Health Incorporated or its affiliates. All rights reserved.
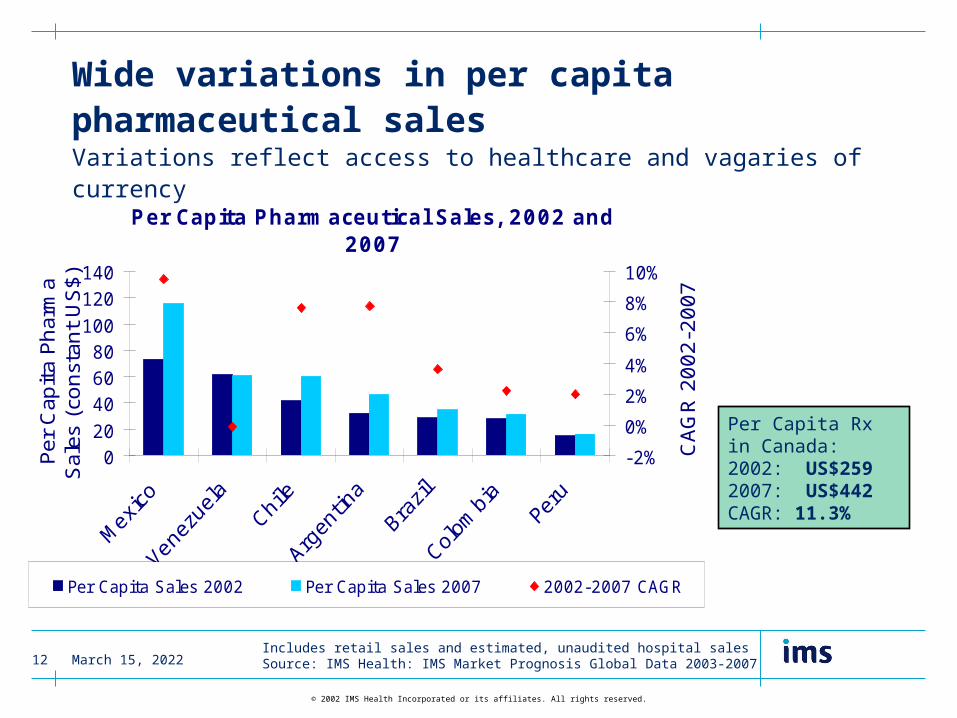
Wide variations in per capita pharmaceutical sales Variations reflect access to healthcare and vagaries of currency
Includes retail sales and estimated, unaudited hospital salesSource: IMS Health: IMS Market Prognosis Global Data 2003-2007
Per Capita Rx in Canada:2002: US$2592007: US$442CAGR: 11.3%
Per Capita Pharmaceutical Sales, 2002 and 2007
020406080
100120140
Per
Cap
ita
Phar
ma
Sal
es (
const
ant
US
$)
-2%
0%
2%
4%
6%
8%
10%
CA
GR
2002-2
007
Per Capita Sales 2002 Per Capita Sales 2007 2002-2007 CAGR
April 15, 202313
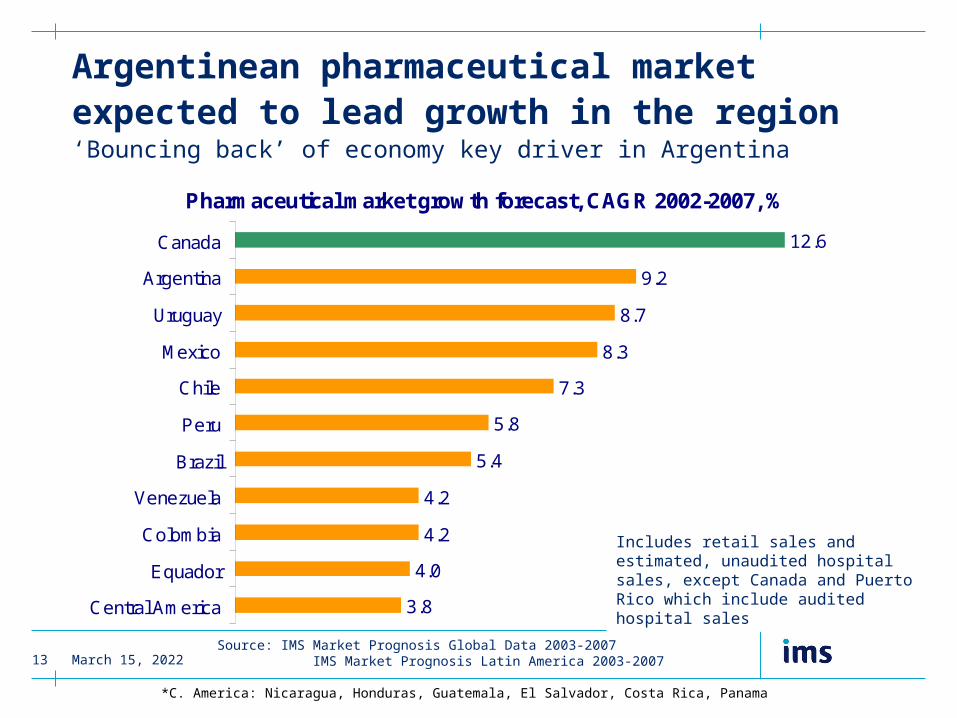
© 2002 IMS Health Incorporated or its affiliates. All rights reserved.*C. America: Nicaragua, Honduras, Guatemala, El Salvador, Costa Rica, Panama
Pharmaceutical market growth forecast, CAGR 2002-2007, %
3.8
4.0
4.2
4.2
5.4
5.8
7.3
8.3
8.7
9.2
12.6
Central America
Equador
Colombia
Venezuela
Brazil
Peru
Chile
Mexico
Uruguay
Argentina
Canada
Argentinean pharmaceutical market expected to lead growth in the region‘Bouncing back’ of economy key driver in Argentina
Source: IMS Market Prognosis Global Data 2003-2007 IMS Market Prognosis Latin America 2003-2007
Includes retail sales and estimated, unaudited hospital sales, except Canada and Puerto Rico which include audited hospital sales

April 15, 202314
© 2002 IMS Health Incorporated or its affiliates. All rights reserved.
Considerable variation in size of economies and per capita GDP
Source: Central Banks; World bank; estimated figures
C. America: Nicaragua, Honduras, Guatemala, El Salvador, Costa Rica, Panama
US GDP:US$10,450 billion
US per capita GDP:US$36,300
GDP (US$ billion)
715
605
453
263
79
77
77
71
58
26
19
0 100 200 300 400 500 600 700 800
Canada
Mexico
Brazil
Argentina
Central America
Venezuela
Colombia
Chile
Peru
Ecuador
Uruguay
Per capita GDP (US$ thousand)
23.1
6.2
2.6
6.9
2.1
3.1
1.8
4.6
2.2
2.0
5.7
0 5 10 15 20 25
Canada
Mexico
Brazil
Argentina
Central America
Venezuela
Colombia
Chile
Peru
Ecuador
Uruguay
April 15, 202315
© 2002 IMS Health Incorporated or its affiliates. All rights reserved.
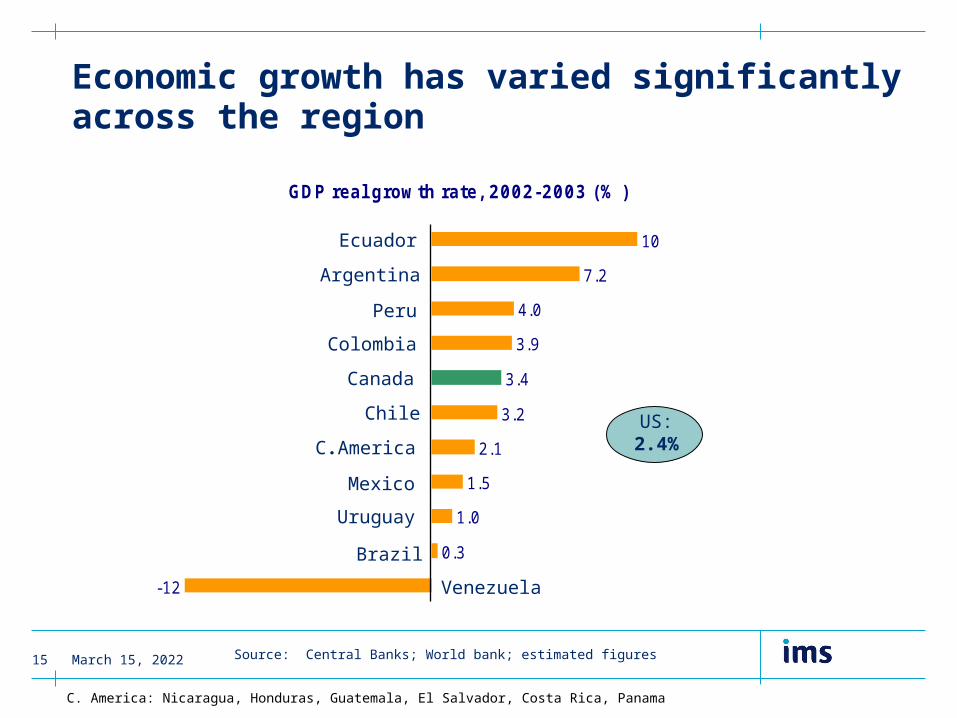
GDP real growth rate, 2002-2003 (% )
10
7.2
4.0
3.9
3.4
3.2
2.1
1.5
1.0
0.3
-12
Economic growth has varied significantly across the region
Canada
Colombia
Mexico
Chile
Peru
Brazil
Venezuela
Uruguay
Argentina
C. America: Nicaragua, Honduras, Guatemala, El Salvador, Costa Rica, Panama
US:2.4%
Ecuador
Source: Central Banks; World bank; estimated figures
C.America
April 15, 202316
© 2002 IMS Health Incorporated or its affiliates. All rights reserved.
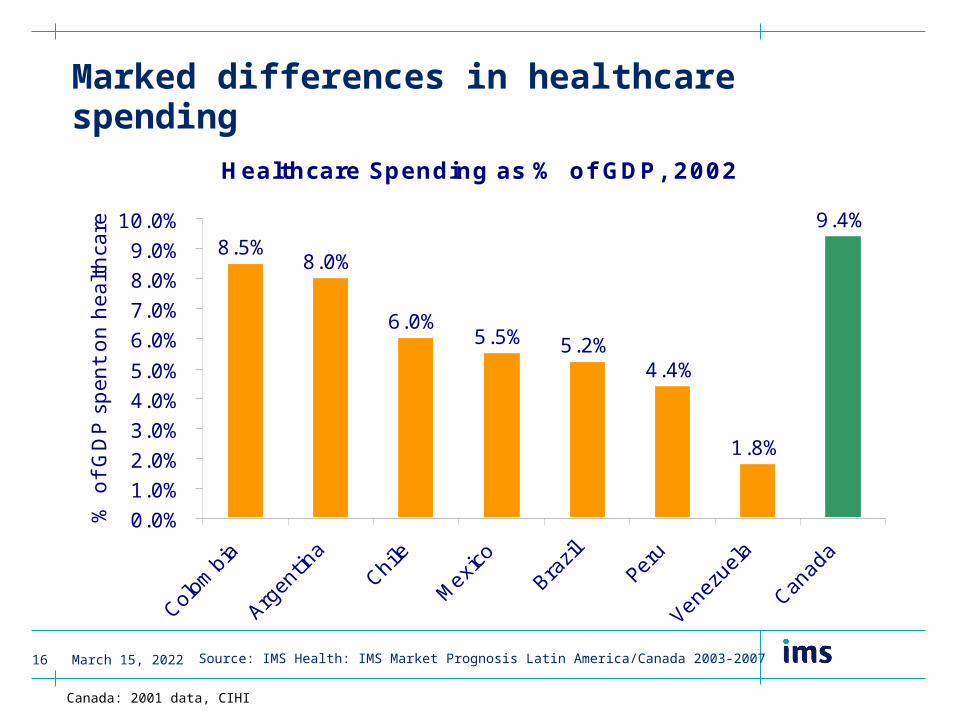
Marked differences in healthcare spending
Source: IMS Health: IMS Market Prognosis Latin America/Canada 2003-2007
Canada: 2001 data, CIHI
Healthcare Spending as % of GDP, 2002
8.5%8.0%
6.0%5.5% 5.2%
4.4%
1.8%
9.4%
0.0%
1.0%
2.0%
3.0%
4.0%
5.0%
6.0%
7.0%
8.0%
9.0%
10.0%
% o
f G
DP s
pen
t on h
eal
thca
re
April 15, 202318
© 2002 IMS Health Incorporated or its affiliates. All rights reserved.
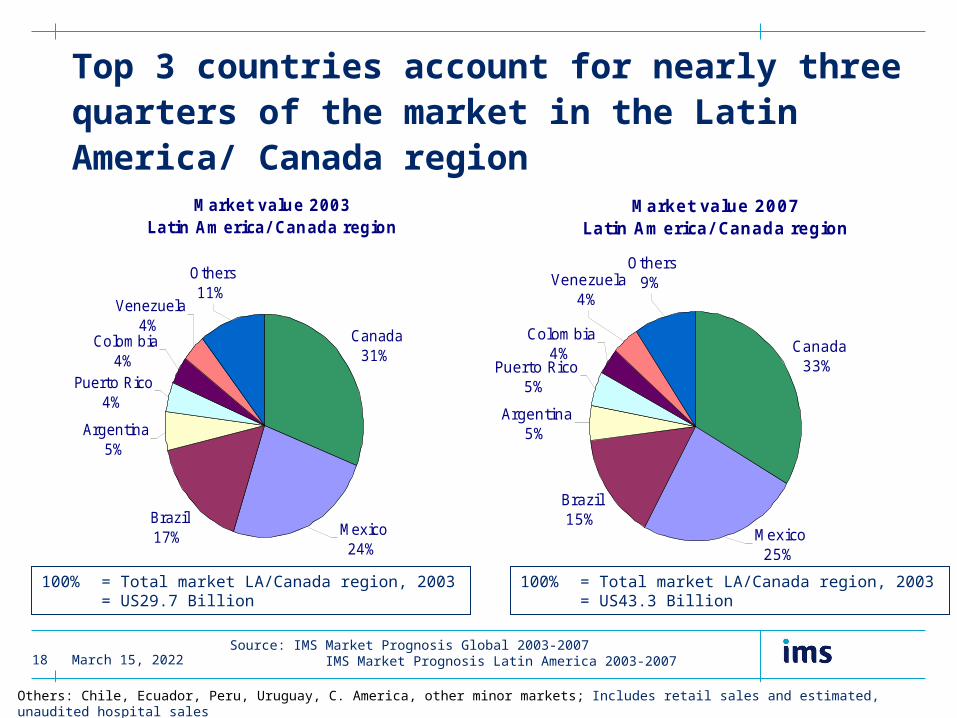
Top 3 countries account for nearly three quarters of the market in the Latin America/ Canada region
Source: IMS Market Prognosis Global 2003-2007 IMS Market Prognosis Latin America 2003-2007
100% = Total market LA/Canada region, 2003 = US29.7 Billion
Market value 2003Latin America/ Canada region
Canada31%
Brazil17%
Argentina5%
Puerto Rico4%
Mexico24%
Colombia4%
Venezuela4%
Others11%
Market value 2007Latin America/ Canada region
Canada33%
Brazil15%
Argentina5%
Puerto Rico5%
Mexico25%
Others9%Venezuela
4%
Colombia4%
100% = Total market LA/Canada region, 2003 = US43.3 Billion
Others: Chile, Ecuador, Peru, Uruguay, C. America, other minor markets; Includes retail sales and estimated, unaudited hospital sales

April 15, 202319
© 2002 IMS Health Incorporated or its affiliates. All rights reserved.
Market value, 2003 and 2007
0
2
4
6
8
10
12
14
16
Mark
et
valu
e (
curr
en
t U
S$
billion
s)
Canad
a
Mexican and Brazilian markets combined worth US$17.2 Billion by 2007
2003
2007
Source: IMS Market Prognosis Global Data 2003-2007 IMS Market Prognosis Latin America 2003-2007
Others: Chile, Ecuador, Peru, Uruguay, C. America, other minor markets; Includes retail sales and estimated, unaudited hospital sales
7.1
10.7
4.9
6.6
14.4
9.2

April 15, 202320
© 2002 IMS Health Incorporated or its affiliates. All rights reserved.
42.6 47.7 52.159.8
46.6 49.6
16.9 2.47.6
4.0
19.1 10.5
21.127.4
18.523.6
12.8 22.2
19.4 22.5 21.812.6
21.5 17.7
Canada Mexico Brazil Argentina Colombia Venezuela
Higher share of ‘other brands’ in Latin American markets due to copy products
C. America: Nicaragua, Honduras, Guatemala, El Salvador, Costa Rica, Panama
Not yet assigned/not patentable
Original andlicensed brands
Unbranded
Other brands(e.g. branded generics and copy products)
Source: IMS Health: MIDAS, MAT September 2003
100% = Total volume sales 2003
Volume market share by product licensing status, (%)
Canada
April 15, 202321
© 2002 IMS Health Incorporated or its affiliates. All rights reserved.
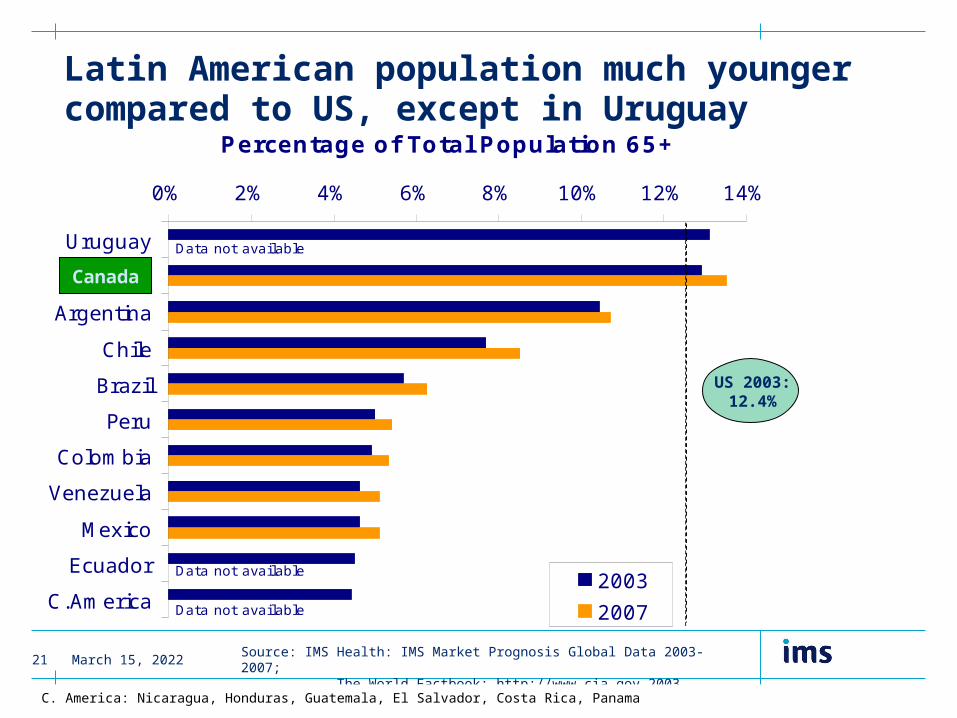
0% 2% 4% 6% 8% 10% 12% 14%
Uruguay
Canada
Argentina
Chile
Brazil
Peru
Colombia
Venezuela
Mexico
Ecuador
C.America
Percentage of Total Population 65+
2003
2007
Data not available
Data not available
Data not available
Latin American population much younger compared to US, except in Uruguay
Source: IMS Health: IMS Market Prognosis Global Data 2003-2007; The World Factbook: http://www.cia.gov 2003
US 2003:12.4%
C. America: Nicaragua, Honduras, Guatemala, El Salvador, Costa Rica, Panama
Canada
April 15, 202322
© 2002 IMS Health Incorporated or its affiliates. All rights reserved.
Latin America/Canada: Political, Business and Healthcare Environment
April 15, 202323
© 2002 IMS Health Incorporated or its affiliates. All rights reserved.
Political and Economic context
• Fragile economies and political instability will continue to affect the operating environment for pharmaceutical companies in most Latin American markets
• The currencies in all Latin American countries tend to be at risk from economic and political problems of their neighbours, while Mexico is particularly susceptible to movement in the US dollar
• The exchange rates are forecast to stabilise from 2004-05 onwards as the Latin American economies recover
• Progress towards increasingly open, market-led economies should benefit the pharmaceutical industry in the medium to long term
Source: IMS Health: IMS Market Prognosis Latin America 2003-2007

April 15, 202324
© 2002 IMS Health Incorporated or its affiliates. All rights reserved.
Economic context
• Canada has had the fastest growing GDP among the G7 group over the past two years, largely driven by buoyant domestic demand
• In addition, Canada has the strongest fiscal position among the G7 group with the Canadian budget in surplus for five consecutive years
• Canada is vulnerable to fluctuations of the US economy:US accounts for 73% of imports and 85% of exports
Source: IMS Market Prognosis Canada 2003-2007
April 15, 202325
© 2002 IMS Health Incorporated or its affiliates. All rights reserved.
Healthcare environment
• Lack of access to healthcare for large segments of the population in several Latin American countries
• Healthcare primarily provided through the public system, with little in the way of a primary care infrastructure
• Corruption and inefficiency within the public health sectors are rife, despite increasing government attempts to address the problems
• Hard-pressed governments will continue to implement healthcare cost-containment policies wherever possible - pharmaceutical spending being a key target
Source: IMS Health: IMS Market Prognosis Latin America 2003-2007

April 15, 202326
© 2002 IMS Health Incorporated or its affiliates. All rights reserved.
Healthcare environment
• Healthcare in Canada is publicly financed and privately delivered through the Medicare system
• Spiralling costs have prompted calls for a National Healthcare Reform, looking into
– Introducing new protection against ‘catastrophic’ prescription drug expenses
– Establishing a National Drugs Agency to evaluate drugs, regulate pricing, develop a National Formulary and control costs
– Reviewing patent legislation to facilitate access to generics
– Introducing health management approach to primary care
Source: IMS Market Prognosis Canada 2003-2007
April 15, 202327
© 2002 IMS Health Incorporated or its affiliates. All rights reserved.
Pharmaceutical business environment
• Growth of the pharmaceutical market is mainly driven by increasing demand and introduction of new drugs
• Cost containment measures, including a common drug review process, are putting downward pressure on market growth
– While higher prices for innovative treatment have been widely accepted, drugs categorised as less innovative will be the major target for containing cost
• The operating environment over the next few year looks set to be volatile while the healthcare reform is being debated
• Approval of new drugs by Health Canada is the slowest among OECD countries — 717 days in 2001
Source: IMS Market Prognosis Canada 2003-2007
April 15, 202328
© 2002 IMS Health Incorporated or its affiliates. All rights reserved.
Pricing
• Prescription drug prices remain free from direct government control in most major markets, with the exception of Brazil
• The reintroduction of government price controls remains a potential threat in Colombia and Argentina
• Given the recent economic turmoil, massive discounting as a marketing tool is widespread across the region
Source: IMS Health: IMS Market Prognosis Latin America 2003-2007
April 15, 202329
© 2002 IMS Health Incorporated or its affiliates. All rights reserved.
Pricing
• Prices of patented drugs in Canada are controlled by the Patented Medicines Prices Review Board (PMPRB)
• The PMPRB monitors Canadian prices in comparison to seven countries: US, UK, France, Germany, Italy, Sweden, Switzerland
• Price increases for individual products are tightly controlled and limited to rises in the Consumer Price Index (CPI)
– Pharmaceutical Manufacturers Price Index (PMPI) has increased by just 0.8% vs. 2.6% increase of the CPI between 1998-2001
• Introduction of the Common Review Process is likely to exert more downward pressure on prices
Source: IMS Market Prognosis Canada 2003-2007

April 15, 202330
© 2002 IMS Health Incorporated or its affiliates. All rights reserved.
Copy products
• Copy products will continue to account for substantial share of most Latin American markets
• Only gradual improvements in levels of intellectual property protection
• Some governments in the region will hesitate to introduce stronger patent protection - conflict regional/international trade agreements vs. protection of national pharmaceutical industries
Source: IMS Health: IMS Market Prognosis Latin America 2003-2007
April 15, 202331
© 2002 IMS Health Incorporated or its affiliates. All rights reserved.
Generics
• Seen by many governments in the Latin American region as the key to providing quality medicines at affordable prices
• Extensive copy product markets and the brand-consciousness of both prescribers and patients are major barriers to generics uptake
• Brazil has been most successful: true generics claiming 8% share of the Brazilian market by volume just 2 years after the first approval of bio-equivalent products
Source: IMS Health: IMS Market Prognosis Latin America 2003-2007
April 15, 202332
© 2002 IMS Health Incorporated or its affiliates. All rights reserved.
Generics
• While 42% of prescriptions written in Canada are generic, generic drugs accounted for only 14% of the value of the total retail and hospital markets in 2002
• Generics prices are not regulated by the PMPRB; market forces exert downward pressure, e.g., provincial formularies, new entrants, purchasing power of pharmacy chains
• The generics sector has experienced significant consolidation in recent years driven by entry of global players (Teva, Ratiopharm)
• The generics industry would benefit from the healthcare reform, esp. the review of patent legislation
Source: IMS Market Prognosis Canada 2003-2007
April 15, 202333
© 2002 IMS Health Incorporated or its affiliates. All rights reserved.
Abbott’s performance in the Latin America/Canada region
April 15, 202334
© 2002 IMS Health Incorporated or its affiliates. All rights reserved.
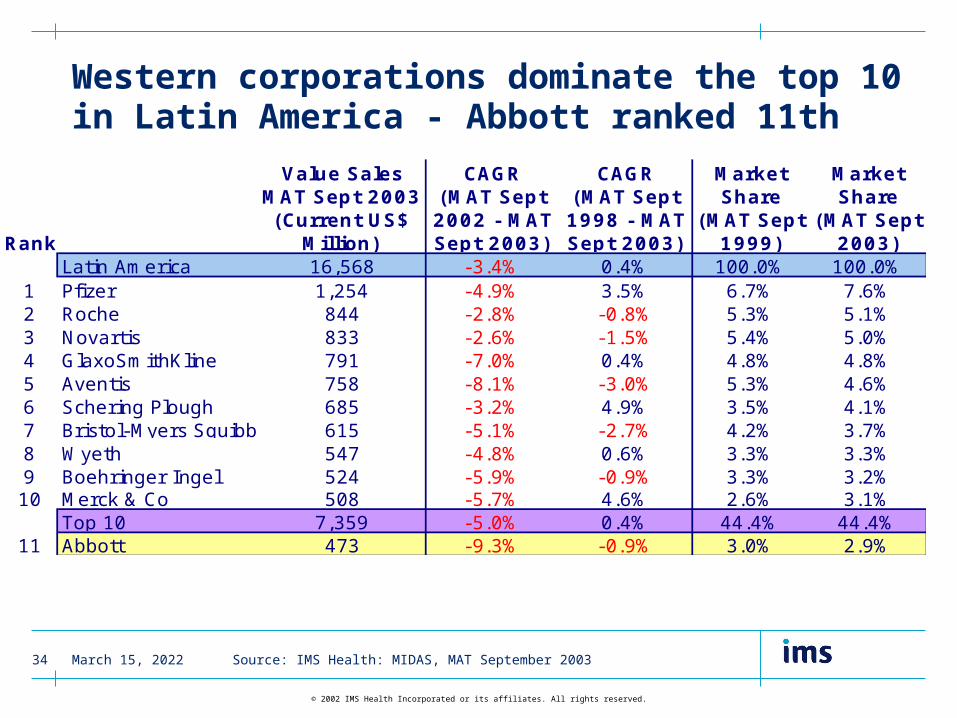
Western corporations dominate the top 10 in Latin America - Abbott ranked 11th
Source: IMS Health: MIDAS, MAT September 2003
Rank
Value Sales MAT Sept 2003 (Current US$
Million)
CAGR (MAT Sept 2002 - MAT Sept 2003)
CAGR (MAT Sept 1998 - MAT Sept 2003)
Market Share
(MAT Sept 1999)
Market Share
(MAT Sept 2003)
Latin America 16,568 -3.4% 0.4% 100.0% 100.0%1 Pfizer 1,254 -4.9% 3.5% 6.7% 7.6%2 Roche 844 -2.8% -0.8% 5.3% 5.1%3 Novartis 833 -2.6% -1.5% 5.4% 5.0%4 GlaxoSmithKline 791 -7.0% 0.4% 4.8% 4.8%5 Aventis 758 -8.1% -3.0% 5.3% 4.6%6 Schering Plough 685 -3.2% 4.9% 3.5% 4.1%7 Bristol-Myers Squibb 615 -5.1% -2.7% 4.2% 3.7%8 Wyeth 547 -4.8% 0.6% 3.3% 3.3%9 Boehringer Ingel 524 -5.9% -0.9% 3.3% 3.2%10 Merck & Co 508 -5.7% 4.6% 2.6% 3.1%
Top 10 7,359 -5.0% 0.4% 44.4% 44.4%11 Abbott 473 -9.3% -0.9% 3.0% 2.9%

April 15, 202335
© 2002 IMS Health Incorporated or its affiliates. All rights reserved.
Pfizer, Schering-Plough and Merck have strongly out-grown the market over past 5 years
Source: IMS Health: MIDAS, MAT September 2003
Top 11 Corporations in Latin America
PFIZER (1)
ROCHE (2)NOVARTIS (3)
GSK (4)AVENTIS (5)
SCHERING PLOUGH (6)
BRISTOL-MYERS SQB. (7)
WYETH (8)
BOEHRINGER INGEL (9)
MERCK & CO (10)ABBOTT (11)
0%
1%
2%
3%
4%
5%
6%
7%
8%
-4% -2% 0% 2% 4% 6%
CAGR 5 Years (1998-2003)
Mar
ket
Sha
re
LATINAMERICA

April 15, 202336
© 2002 IMS Health Incorporated or its affiliates. All rights reserved.
One generics company, Apotex, among the top 10 corporations in Canada
Shading represents Domestic Corporations
Rank Corporation
Value Sales MAT Sept 2003 (Current US$
Million)
Growth (MAT Sept
2002 - MAT Sept 2003)
CAGR (MAT Sept
1999 - MAT Sept 2003)
Market Share
(MAT Sept 1999)
Market Share
(MAT Sept 2003)
Canada 9,826 11.6% 13.9% 100.0% 100.0%1 Pfizer 1,374 11.0% 19.3% 11.6% 14.0%2 GlaxoSmithKline 748 7.3% 11.3% 8.4% 7.6%3 AstraZeneca 652 12.7% 14.9% 6.4% 6.6%4 Merck & Co 614 -0.5% 10.9% 7.0% 6.2%5 J ohnson & J ohnson 566 14.9% 12.3% 6.1% 5.8%6 Apotex 465 10.8% 14.5% 4.6% 4.7%7 Novartis 386 14.5% 11.8% 4.2% 3.9%8 Bristol-Myers Squibb 375 6.7% 5.4% 5.2% 3.8%9 Wyeth 357 16.4% 11.2% 4.0% 3.6%10 Aventis 337 13.9% 22.4% 2.6% 3.4%
Top 10 5,873 10.1% 13.8% 60.1% 59.8%11 Abbott 332 -5.1% 5.3% 4.6% 3.4%
Source: IMS Health: MIDAS, MAT September 2003
April 15, 202337
© 2002 IMS Health Incorporated or its affiliates. All rights reserved.
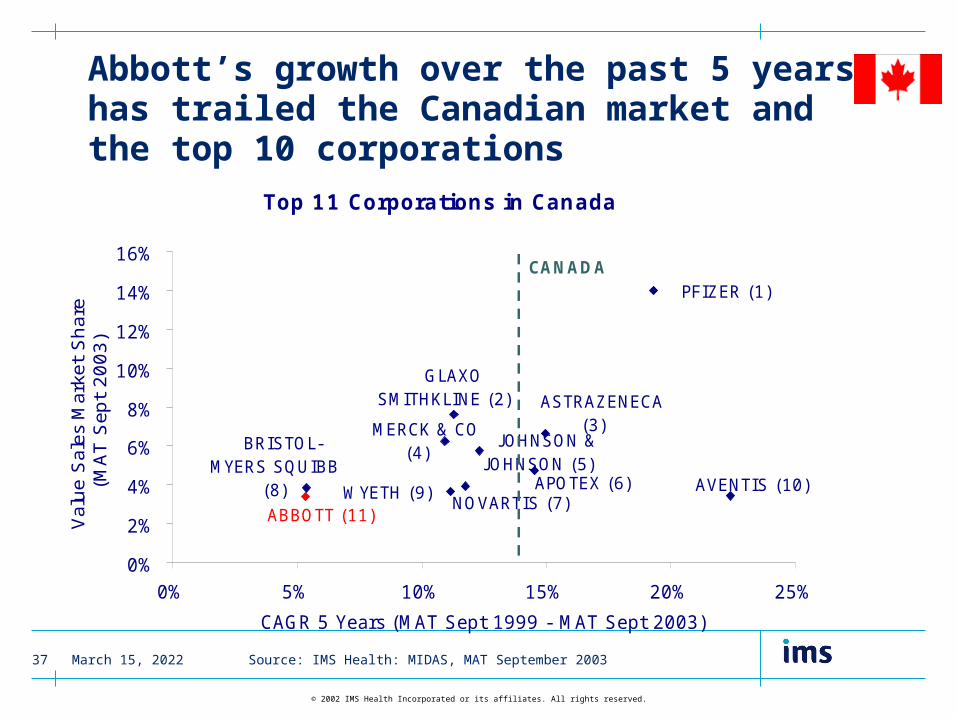
Abbott’s growth over the past 5 years has trailed the Canadian market and the top 10 corporations
Top 11 Corporations in Canada
ABBOTT (11)
AVENTIS (10) WYETH (9)
BRISTOL-MYERS SQUIBB
(8) NOVARTIS (7)
APOTEX (6)
JOHNSON & JOHNSON (5)
MERCK & CO (4)
ASTRAZENECA (3)
GLAXO SMITHKLINE (2)
PFIZER (1)
0%
2%
4%
6%
8%
10%
12%
14%
16%
0% 5% 10% 15% 20% 25%
CAGR 5 Years (MAT Sept 1999 - MAT Sept 2003)
Val
ue
Sal
es M
arke
t S
har
e(M
AT
Sep
t 2
00
3)
CANADA
Source: IMS Health: MIDAS, MAT September 2003
April 15, 202338
© 2002 IMS Health Incorporated or its affiliates. All rights reserved.
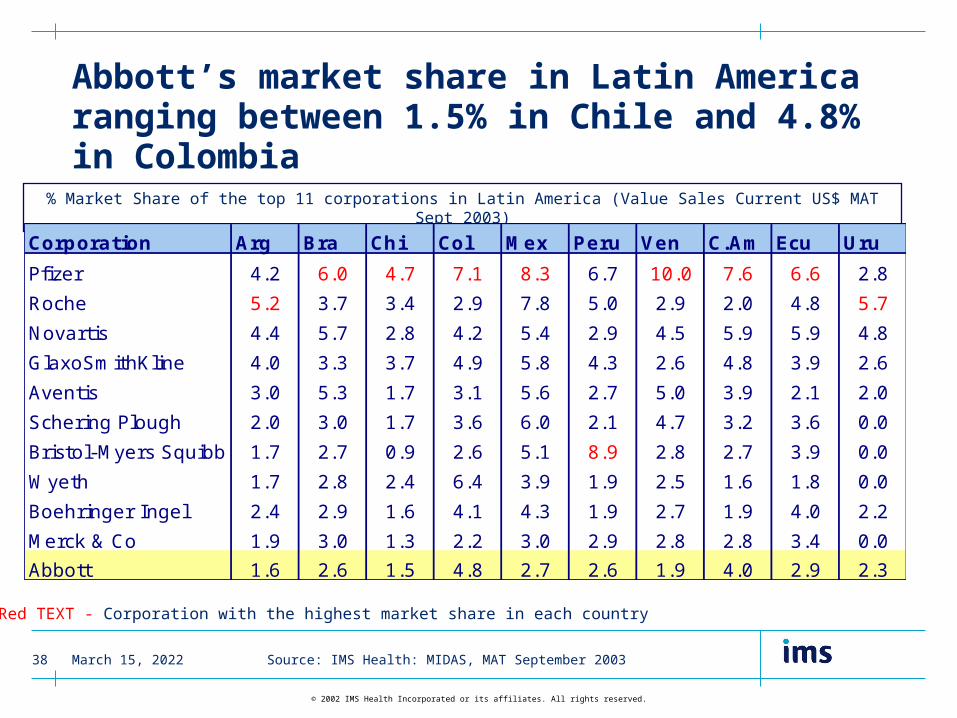
Abbott’s market share in Latin America ranging between 1.5% in Chile and 4.8% in Colombia
% Market Share of the top 11 corporations in Latin America (Value Sales Current US$ MAT Sept 2003)
Corporation Arg Bra Chi Col Mex Peru Ven C.Am Ecu Uru
Pfizer 4.2 6.0 4.7 7.1 8.3 6.7 10.0 7.6 6.6 2.8
Roche 5.2 3.7 3.4 2.9 7.8 5.0 2.9 2.0 4.8 5.7
Novartis 4.4 5.7 2.8 4.2 5.4 2.9 4.5 5.9 5.9 4.8
GlaxoSmithKline 4.0 3.3 3.7 4.9 5.8 4.3 2.6 4.8 3.9 2.6
Aventis 3.0 5.3 1.7 3.1 5.6 2.7 5.0 3.9 2.1 2.0
Schering Plough 2.0 3.0 1.7 3.6 6.0 2.1 4.7 3.2 3.6 0.0
Bristol-Myers Squibb 1.7 2.7 0.9 2.6 5.1 8.9 2.8 2.7 3.9 0.0
Wyeth 1.7 2.8 2.4 6.4 3.9 1.9 2.5 1.6 1.8 0.0
Boehringer Ingel 2.4 2.9 1.6 4.1 4.3 1.9 2.7 1.9 4.0 2.2
Merck & Co 1.9 3.0 1.3 2.2 3.0 2.9 2.8 2.8 3.4 0.0
Abbott 1.6 2.6 1.5 4.8 2.7 2.6 1.9 4.0 2.9 2.3
Red TEXT - Corporation with the highest market share in each country
Source: IMS Health: MIDAS, MAT September 2003
April 15, 202339
© 2002 IMS Health Incorporated or its affiliates. All rights reserved.
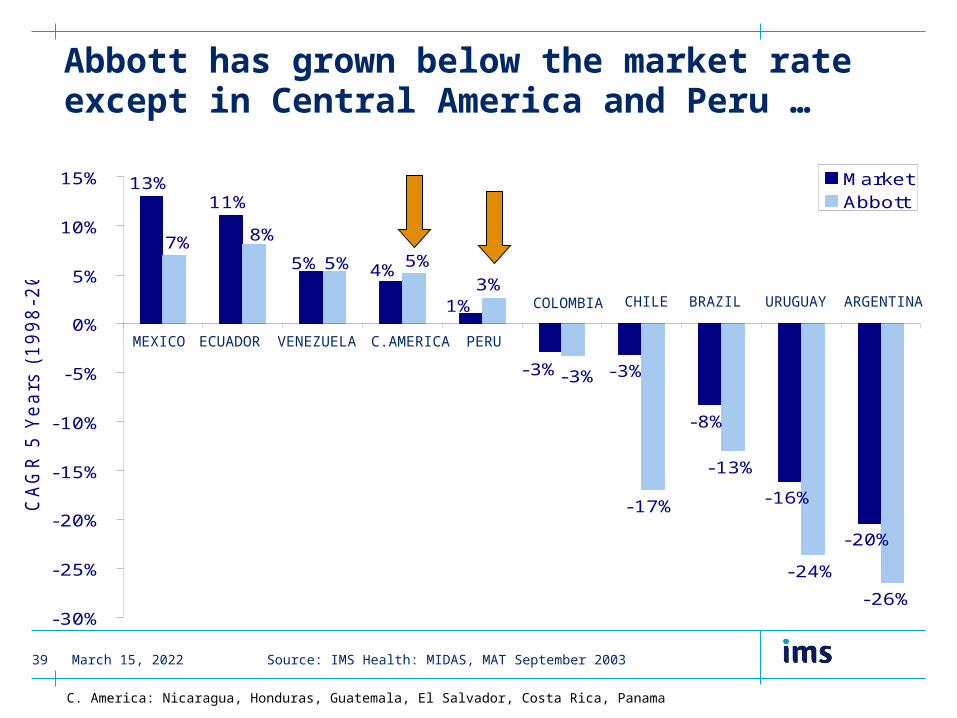
Abbott has grown below the market rate except in Central America and Peru …
13%11%
-3%
-8%
-16%
-20%
3%
-17%
-13%
-24%
-26%
-3%
5% 4%
1%
-3%
5% 5%
8%7%
-30%
-25%
-20%
-15%
-10%
-5%
0%
5%
10%
15%
CA
GR
5 Y
ears
(1998-2
003)
MarketAbbott
MEXICO ECUADOR VENEZUELA C.AMERICA PERU
COLOMBIA CHILE BRAZIL URUGUAY ARGENTINA
Source: IMS Health: MIDAS, MAT September 2003
C. America: Nicaragua, Honduras, Guatemala, El Salvador, Costa Rica, Panama
April 15, 202340
© 2002 IMS Health Incorporated or its affiliates. All rights reserved.
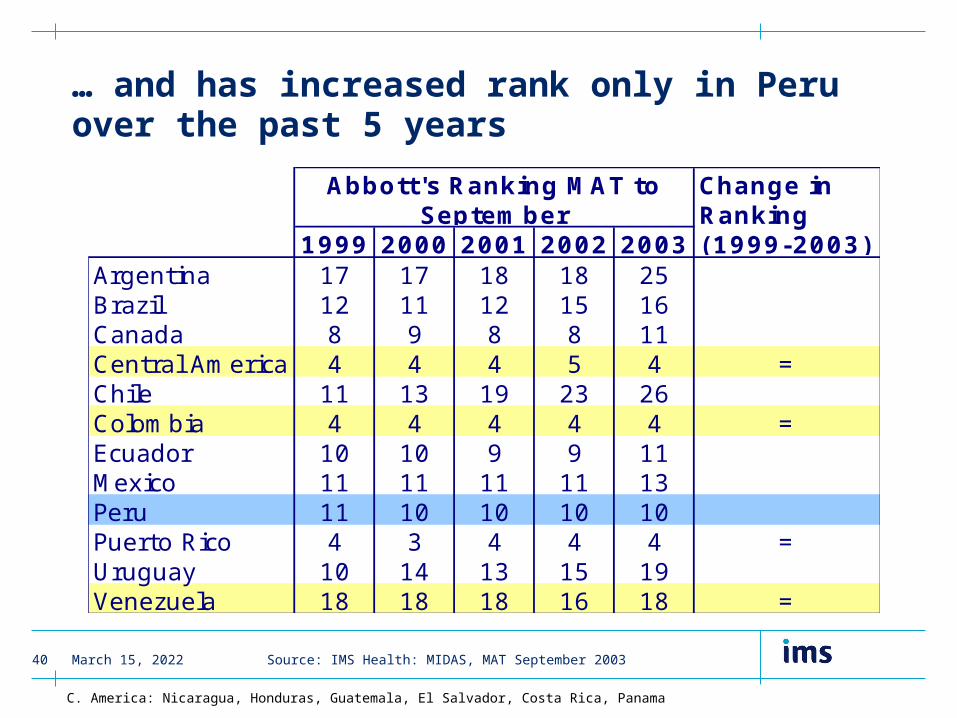
… and has increased rank only in Peru over the past 5 years
1999 2000 2001 2002 2003Argentina 17 17 18 18 25Brazil 12 11 12 15 16Canada 8 9 8 8 11Central America 4 4 4 5 4 =Chile 11 13 19 23 26Colombia 4 4 4 4 4 =Ecuador 10 10 9 9 11Mexico 11 11 11 11 13Peru 11 10 10 10 10Puerto Rico 4 3 4 4 4 =Uruguay 10 14 13 15 19Venezuela 18 18 18 16 18 =
Abbott's Ranking MAT to September
Change in Ranking (1999-2003)
Source: IMS Health: MIDAS, MAT September 2003
C. America: Nicaragua, Honduras, Guatemala, El Salvador, Costa Rica, Panama
April 15, 202341
© 2002 IMS Health Incorporated or its affiliates. All rights reserved.
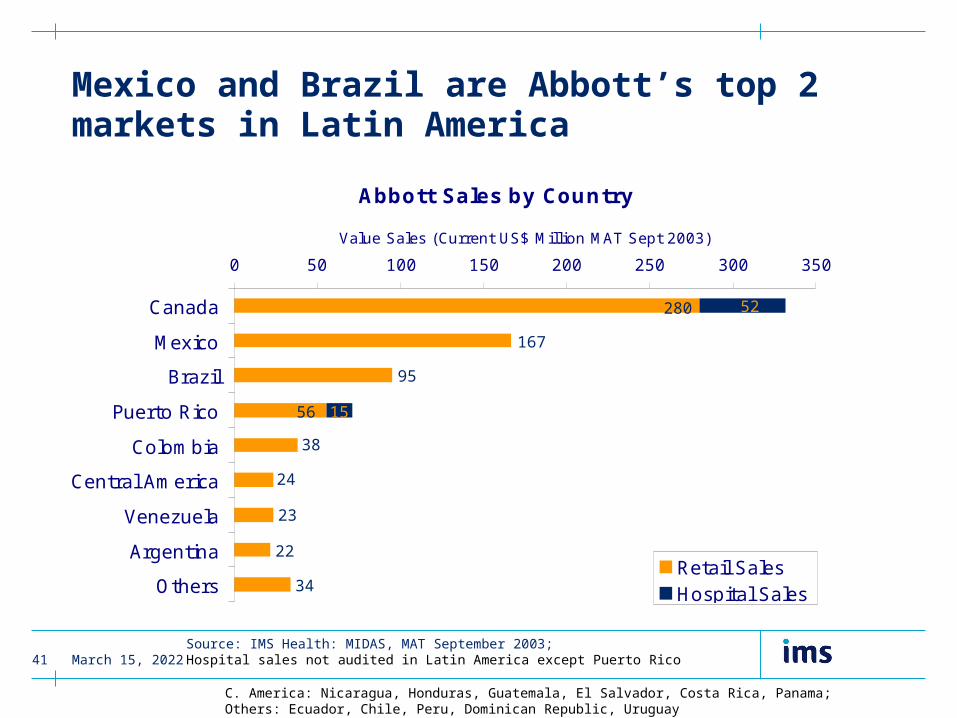
Mexico and Brazil are Abbott’s top 2 markets in Latin America
Abbott Sales by Country
0 50 100 150 200 250 300 350
Canada
Mexico
Brazil
Puerto Rico
Colombia
Central America
Venezuela
Argentina
Others
Value Sales (Current US$ Million MAT Sept 2003)
Retail SalesHospital Sales
Source: IMS Health: MIDAS, MAT September 2003;Hospital sales not audited in Latin America except Puerto Rico
C. America: Nicaragua, Honduras, Guatemala, El Salvador, Costa Rica, Panama;Others: Ecuador, Chile, Peru, Dominican Republic, Uruguay
167
95
280 52
38
24
23
22
34
56 15

April 15, 202342
© 2002 IMS Health Incorporated or its affiliates. All rights reserved.
Abbott Latin American country mix benchmark vs top 20 corporations
100% = Total Sales (current US$) by Abbott in Latin America MAT to Sept 2003 = US$473 Million
100% = Total Sales (current US$) of the top 20 global corporations in Latin America MAT to Sept 2003 = US$ 9,884 Million
Abbott's Sales in Latin America
MEXICO35%
BRAZIL20%
PUERTO RICO15%
COLOMBIA8%
CENTRAL AMERICA
5%
VENEZUELA5%
ARGENTINA5%
OTHERS 7%
Top 20 Global Corporation Sales in Latin America
MEXICO43%
BRAZIL20%
PUERTO RICO10%
VENEZUELA7%
ARGENTINA6%
COLOMBIA5%
CENTRAL AMERICA
3%
OTHERS6%
Source: IMS Health: MIDAS, MAT September 2003
Others: Chile, Ecuador, Peru, Uruguay, Dominican Republic

April 15, 202343
© 2002 IMS Health Incorporated or its affiliates. All rights reserved.
Top 20 corporations more weighted towards Mexico while Abbott’s mix inclined towards Puerto Rico by 5.1%
Source: IMS Health: MIDAS, MAT September 2003
Others: Chile, Ecuador, Peru, Uruguay, Dominican Republic
Abbott's relative presence by countryvs top 20 corporation
-9.1%
0.2%
5.1%
1.5%
-0.6%
0.2%
1.6%1.1%
-10.0%
-8.0%
-6.0%
-4.0%
-2.0%
0.0%
2.0%
4.0%
6.0%
Devia
tion f
rom
Top 2
0 a
vera
ge
Mexico
Brazil PuertoRico
Colombia
CentralAmerica
Venezuela Argen-tina
Others
April 15, 202344
© 2002 IMS Health Incorporated or its affiliates. All rights reserved.
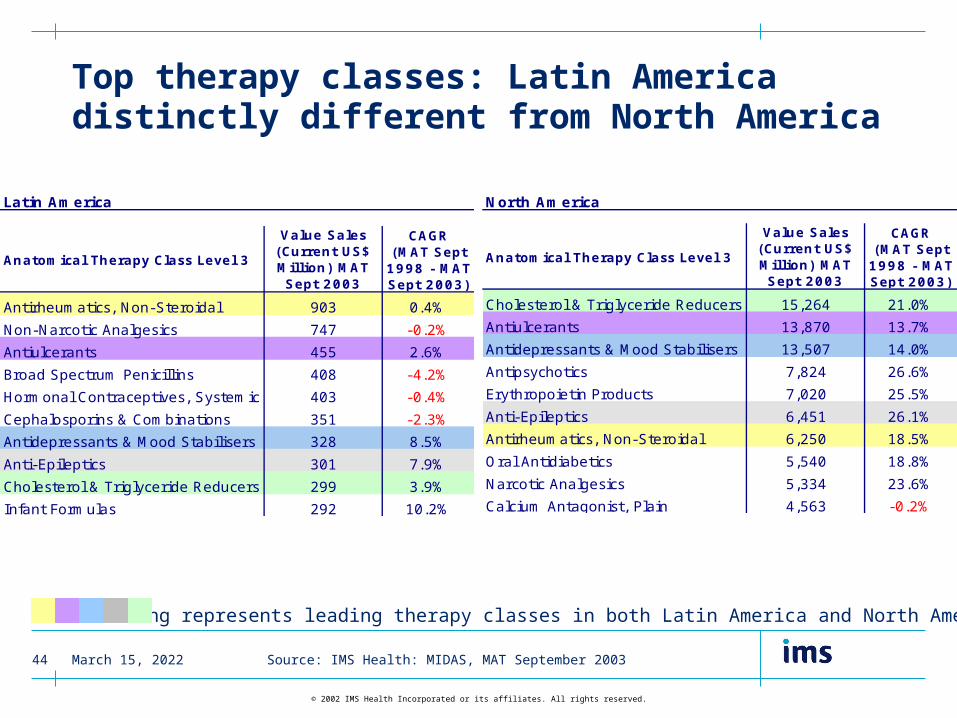
Top therapy classes: Latin America distinctly different from North America
Shading represents leading therapy classes in both Latin America and North America
Source: IMS Health: MIDAS, MAT September 2003
Latin America
Anatomical Therapy Class Level 3
Value Sales (Current US$ Million) MAT Sept 2003
CAGR (MAT Sept
1998 - MAT Sept 2003)
Antirheumatics, Non-Steroidal 903 0.4%
Non-Narcotic Analgesics 747 -0.2%
Antiulcerants 455 2.6%
Broad Spectrum Penicillins 408 -4.2%
Hormonal Contraceptives, Systemic 403 -0.4%
Cephalosporins & Combinations 351 -2.3%
Antidepressants & Mood Stabilisers 328 8.5%
Anti-Epileptics 301 7.9%
Cholesterol & Triglyceride Reducers 299 3.9%
Infant Formulas 292 10.2%
North America
Anatomical Therapy Class Level 3
Value Sales (Current US$ Million) MAT Sept 2003
CAGR (MAT Sept
1998 - MAT Sept 2003)
Cholesterol & Triglyceride Reducers 15,264 21.0%
Antiulcerants 13,870 13.7%
Antidepressants & Mood Stabilisers 13,507 14.0%
Antipsychotics 7,824 26.6%
Erythropoietin Products 7,020 25.5%
Anti-Epileptics 6,451 26.1%
Antirheumatics, Non-Steroidal 6,250 18.5%
Oral Antidiabetics 5,540 18.8%
Narcotic Analgesics 5,334 23.6%
Calcium Antagonist, Plain 4,563 -0.2%
April 15, 202345
© 2002 IMS Health Incorporated or its affiliates. All rights reserved.
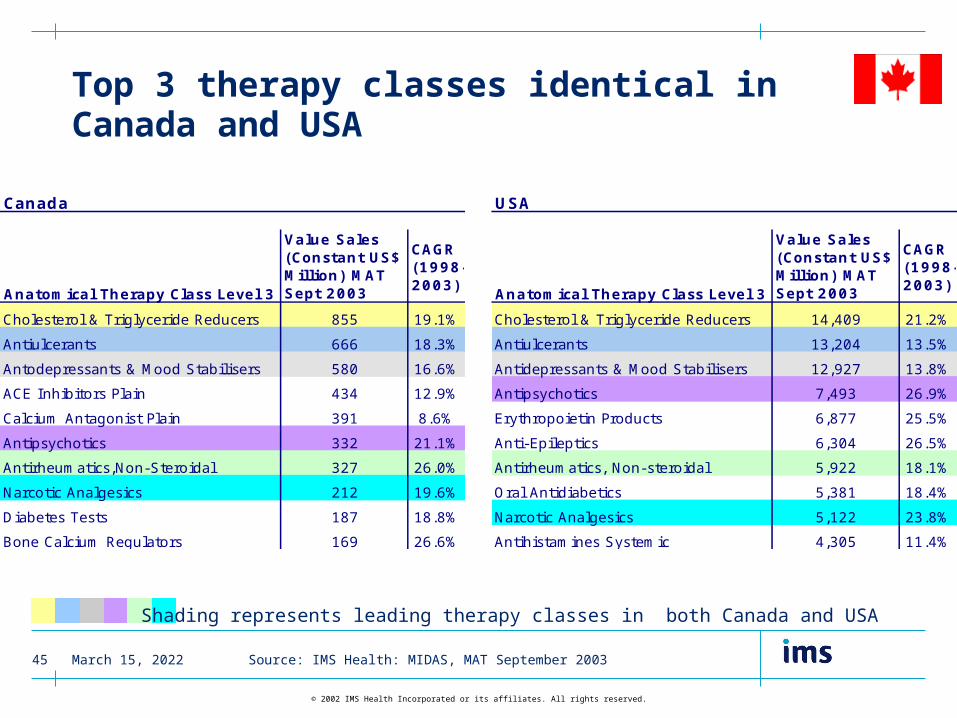
Top 3 therapy classes identical in Canada and USA
Canada
Anatomical Therapy Class Level 3
Value Sales (Constant US$ Million) MAT Sept 2003
CAGR (1998-2003)
Cholesterol & Triglyceride Reducers 855 19.1%
Antiulcerants 666 18.3%
Antodepressants & Mood Stabilisers 580 16.6%
ACE Inhibitors Plain 434 12.9%
Calcium Antagonist Plain 391 8.6%
Antipsychotics 332 21.1%
Antirheumatics,Non-Steroidal 327 26.0%
Narcotic Analgesics 212 19.6%
Diabetes Tests 187 18.8%
Bone Calcium Regulators 169 26.6%
USA
Anatomical Therapy Class Level 3
Value Sales (Constant US$ Million) MAT Sept 2003
CAGR (1998-2003)
Cholesterol & Triglyceride Reducers 14,409 21.2%
Antiulcerants 13,204 13.5%
Antidepressants & Mood Stabilisers 12,927 13.8%
Antipsychotics 7,493 26.9%
Erythropoietin Products 6,877 25.5%
Anti-Epileptics 6,304 26.5%
Antirheumatics, Non-steroidal 5,922 18.1%
Oral Antidiabetics 5,381 18.4%
Narcotic Analgesics 5,122 23.8%
Antihistamines Systemic 4,305 11.4%
Shading represents leading therapy classes in both Canada and USA
Source: IMS Health: MIDAS, MAT September 2003
April 15, 202346
© 2002 IMS Health Incorporated or its affiliates. All rights reserved.
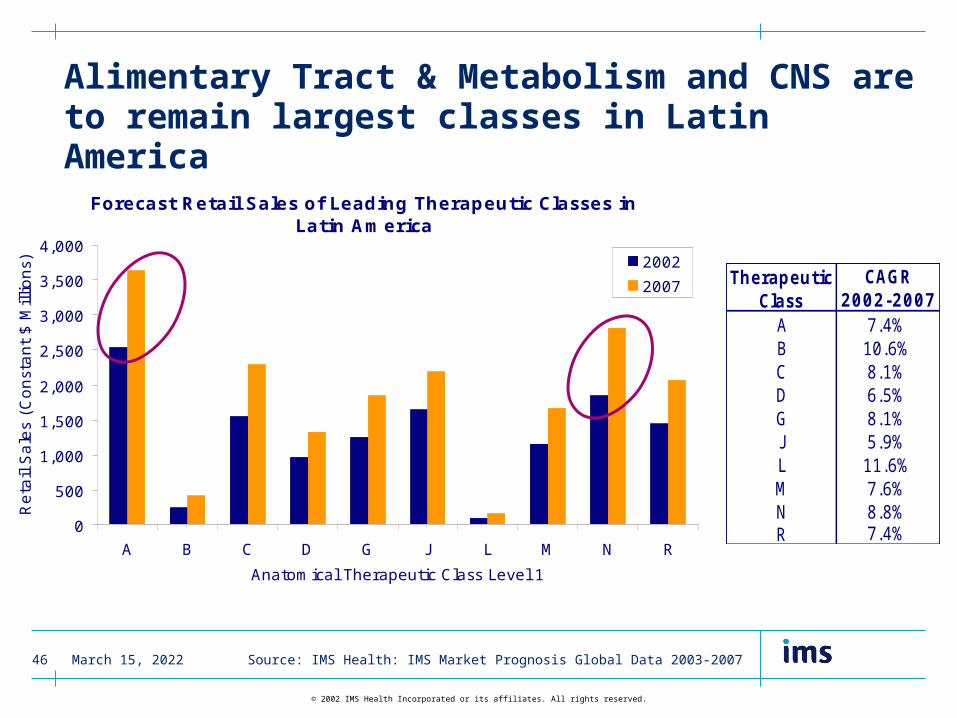
Alimentary Tract & Metabolism and CNS are to remain largest classes in Latin America
Source: IMS Health: IMS Market Prognosis Global Data 2003-2007
Therapeutic Class
CAGR 2002-2007
A 7.4%B 10.6%C 8.1%D 6.5%G 8.1%J 5.9%L 11.6%M 7.6%N 8.8%R 7.4%
Forecast Retail Sales of Leading Therapeutic Classes in Latin America
0
500
1,000
1,500
2,000
2,500
3,000
3,500
4,000
A B C D G J L M N R
Anatomical Therapeutic Class Level 1
Reta
il S
ale
s (C
onst
ant
$ M
illio
ns) 2002
2007

April 15, 202347
© 2002 IMS Health Incorporated or its affiliates. All rights reserved.
Cardiovascular System and CNS are to remain largest therapy classes in Canada
Therapeutic Class
CAGR 2002-2007
A 12.1%B 13.8%C 12.8%D 10.2%G 11.8%J 11.7%L 15.0%M 11.8%N 13.9%R 10.1%
Forecast Retail and Hospital Sales of Leading Therapeutic Classes in Canada
0.0
0.5
1.0
1.5
2.0
2.5
3.0
3.5
4.0
A B C D G J L M N R
Anatomical Therapeutic Class Level 1
Hosp
ital and R
eta
il S
ale
s (U
S$ B
illion)
20022007
Source: IMS Health: IMS Market Prognosis Global Data 2003-2007
April 15, 202348
© 2002 IMS Health Incorporated or its affiliates. All rights reserved.
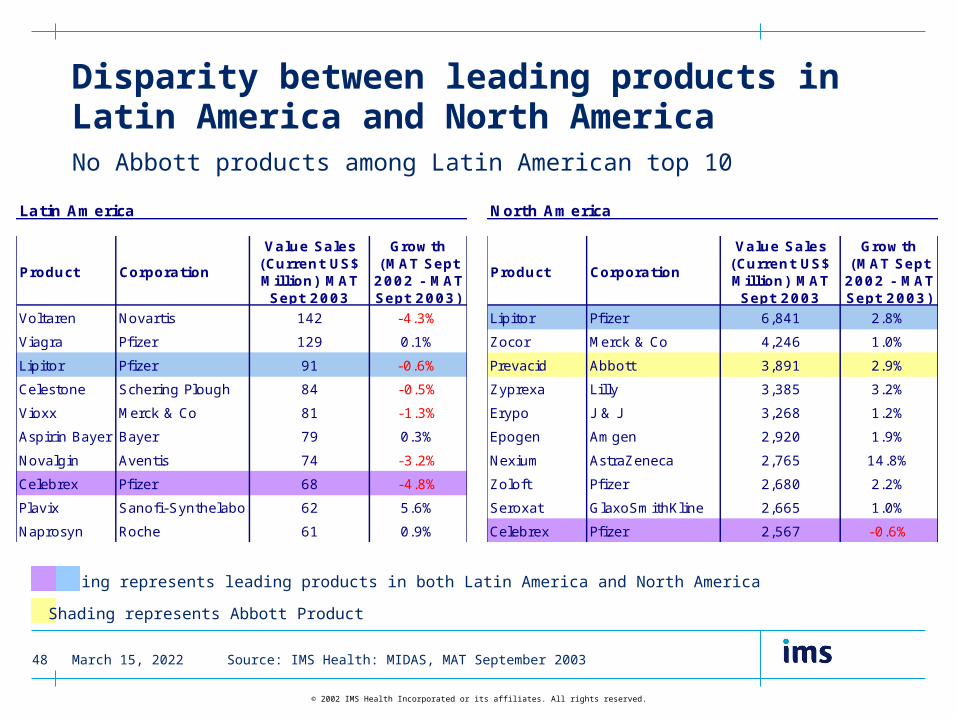
Disparity between leading products in Latin America and North AmericaNo Abbott products among Latin American top 10
Shading represents leading products in both Latin America and North America
Source: IMS Health: MIDAS, MAT September 2003
Shading represents Abbott Product
Latin America
Product Corporation
Value Sales (Current US$ Million) MAT Sept 2003
Growth (MAT Sept
2002 - MAT Sept 2003)
Voltaren Novartis 142 -4.3%
Viagra Pfizer 129 0.1%
Lipitor Pfizer 91 -0.6%
Celestone Schering Plough 84 -0.5%
Vioxx Merck & Co 81 -1.3%
Aspirin Bayer Bayer 79 0.3%
Novalgin Aventis 74 -3.2%
Celebrex Pfizer 68 -4.8%
Plavix Sanofi-Synthelabo 62 5.6%
Naprosyn Roche 61 0.9%
North America
Product Corporation
Value Sales (Current US$ Million) MAT Sept 2003
Growth (MAT Sept
2002 - MAT Sept 2003)
Lipitor Pfizer 6,841 2.8%
Zocor Merck & Co 4,246 1.0%
Prevacid Abbott 3,891 2.9%
Zyprexa Lilly 3,385 3.2%
Erypo J & J 3,268 1.2%
Epogen Amgen 2,920 1.9%
Nexium AstraZeneca 2,765 14.8%
Zoloft Pfizer 2,680 2.2%
Seroxat GlaxoSmithKline 2,665 1.0%
Celebrex Pfizer 2,567 -0.6%
April 15, 202349
© 2002 IMS Health Incorporated or its affiliates. All rights reserved.
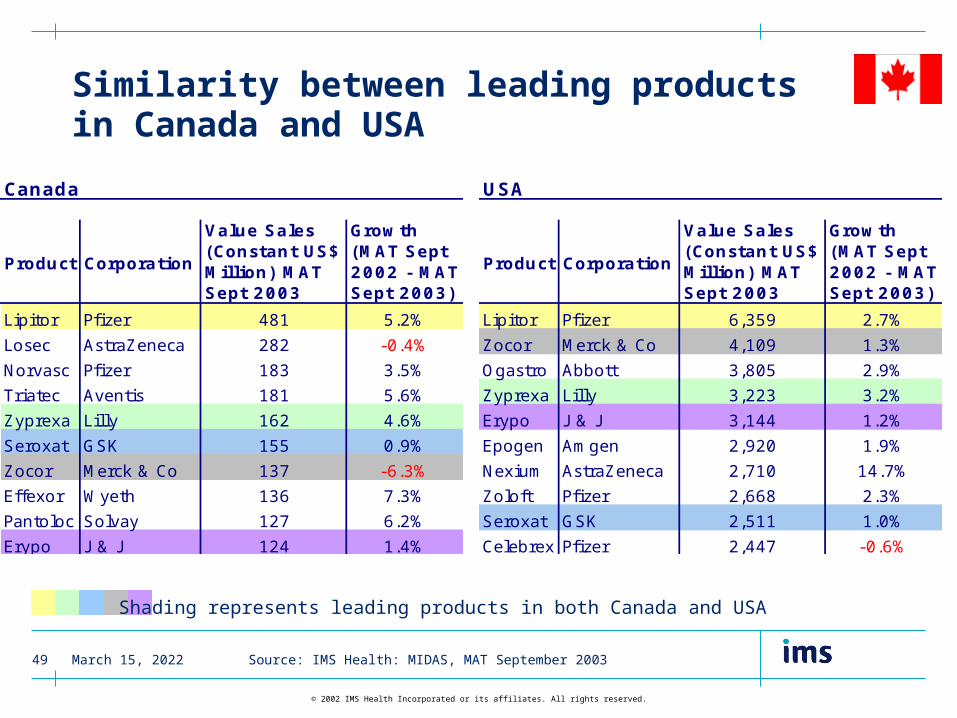
Similarity between leading products in Canada and USA
USA
Product Corporation
Value Sales (Constant US$ Million) MAT Sept 2003
Growth (MAT Sept 2002 - MAT Sept 2003)
Lipitor Pfizer 6,359 2.7%
Zocor Merck & Co 4,109 1.3%
Ogastro Abbott 3,805 2.9%
Zyprexa Lilly 3,223 3.2%
Erypo J & J 3,144 1.2%
Epogen Amgen 2,920 1.9%
Nexium AstraZeneca 2,710 14.7%
Zoloft Pfizer 2,668 2.3%
Seroxat GSK 2,511 1.0%
Celebrex Pfizer 2,447 -0.6%
Canada
Product Corporation
Value Sales (Constant US$ Million) MAT Sept 2003
Growth (MAT Sept 2002 - MAT Sept 2003)
Lipitor Pfizer 481 5.2%
Losec AstraZeneca 282 -0.4%
Norvasc Pfizer 183 3.5%
Triatec Aventis 181 5.6%
Zyprexa Lilly 162 4.6%
Seroxat GSK 155 0.9%
Zocor Merck & Co 137 -6.3%
Effexor Wyeth 136 7.3%
Pantoloc Solvay 127 6.2%
Erypo J & J 124 1.4%
Shading represents leading products in both Canada and USA
Source: IMS Health: MIDAS, MAT September 2003

April 15, 202350
© 2002 IMS Health Incorporated or its affiliates. All rights reserved.
Pedialyte, an oral electrolyte solution for fluid maintenance in infants & children, is Abbott’s top selling product in Latin America
Top 11 Abbott Products in Latin America
Rank Product Anatomical Therapy Class Level 3
Value Sales MAT Sept 2003 (US$ Million)
Growth (MAT Sept 2002 - MAT Sept 2003)
% of Abbott Sales in Latin America
1 Pedialyte Oral Electyrolyte Replacer 45.9 -6.5% 9.7%2 Ensure Protein Supplement 34.4 -10.1% 7.3%3 Reductil Anti-Obesity Preparations
exc. Dietetics33.6 -15.4% 7.1%
4 Klacid Macrolides & Similar Types 32.1 -12.7% 6.8%5 Lanzoprazole Antiulcerants 31.0 13.1% 6.6%6 Neosaldina* Anti-Migraine Preparations 22.6 -11.9% 4.8%7 Valcote Anti-Epileptics 19.2 12.7% 4.1%8 Similac Advance Infant Formulas 17.3 -11.6% 3.7%9 Lupron Cytostatic Hormones 16.9 -32.2% 3.6%10 Synthroid Thyroid Preparations 14.4 19.5% 3.1%11 Isoptin Calcium Antagonist 13.3 -13.8% 2.8%
Total Abbott Sales in Latin America 473.4 -9.3% 100.0%
Source: IMS Health: MIDAS, MAT September 2003
* sold recently
April 15, 202351
© 2002 IMS Health Incorporated or its affiliates. All rights reserved.
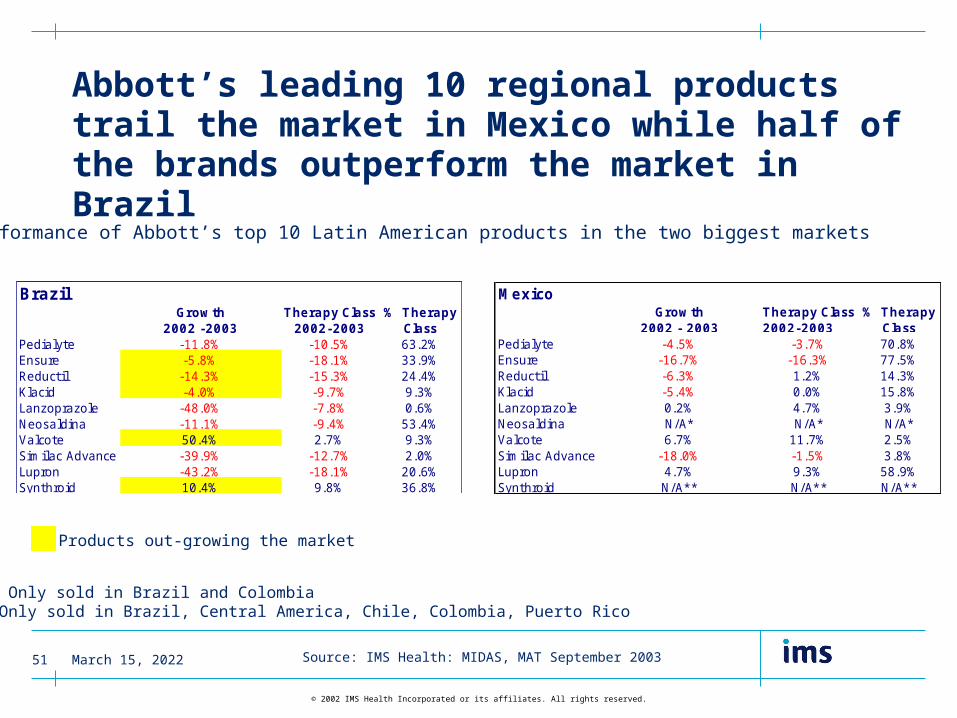
Abbott’s leading 10 regional products trail the market in Mexico while half of the brands outperform the market in Brazil
BrazilGrowth
2002 -2003Therapy Class
2002-2003% Therapy
ClassPedialyte -11.8% -10.5% 63.2%Ensure -5.8% -18.1% 33.9%Reductil -14.3% -15.3% 24.4%Klacid -4.0% -9.7% 9.3%Lanzoprazole -48.0% -7.8% 0.6%Neosaldina -11.1% -9.4% 53.4%Valcote 50.4% 2.7% 9.3%Similac Advance -39.9% -12.7% 2.0%Lupron -43.2% -18.1% 20.6%Synthroid 10.4% 9.8% 36.8%
MexicoGrowth
2002 - 2003Therapy Class2002-2003
% Therapy Class
Pedialyte -4.5% -3.7% 70.8%Ensure -16.7% -16.3% 77.5%Reductil -6.3% 1.2% 14.3%Klacid -5.4% 0.0% 15.8%Lanzoprazole 0.2% 4.7% 3.9%Neosaldina N/A* N/A* N/A*Valcote 6.7% 11.7% 2.5%Similac Advance -18.0% -1.5% 3.8%Lupron 4.7% 9.3% 58.9%Synthroid N/A** N/A** N/A**
Performance of Abbott’s top 10 Latin American products in the two biggest markets
* Only sold in Brazil and Colombia ** Only sold in Brazil, Central America, Chile, Colombia, Puerto Rico
Source: IMS Health: MIDAS, MAT September 2003
Products out-growing the market
April 15, 202354
© 2002 IMS Health Incorporated or its affiliates. All rights reserved.
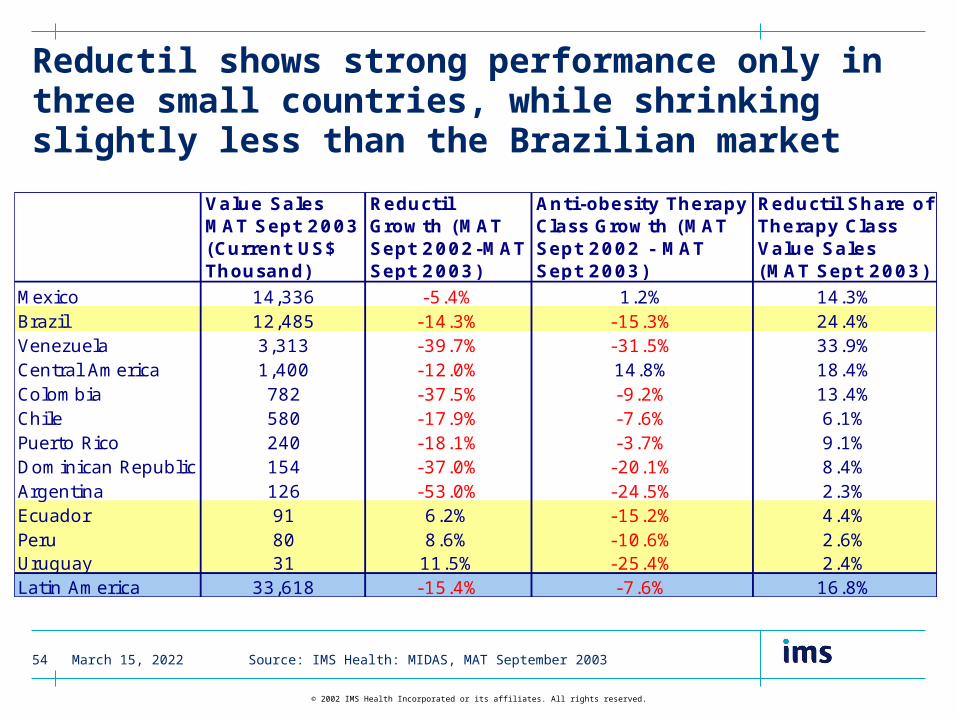
Reductil shows strong performance only in three small countries, while shrinking slightly less than the Brazilian market
Value Sales MAT Sept 2003 (Current US$ Thousand)
Reductil Growth (MAT Sept 2002-MAT Sept 2003)
Anti-obesity Therapy Class Growth (MAT Sept 2002 - MAT Sept 2003)
Reductil Share of Therapy Class Value Sales (MAT Sept 2003)
Mexico 14,336 -5.4% 1.2% 14.3%Brazil 12,485 -14.3% -15.3% 24.4%Venezuela 3,313 -39.7% -31.5% 33.9%Central America 1,400 -12.0% 14.8% 18.4%Colombia 782 -37.5% -9.2% 13.4%Chile 580 -17.9% -7.6% 6.1%Puerto Rico 240 -18.1% -3.7% 9.1%Dominican Republic 154 -37.0% -20.1% 8.4%Argentina 126 -53.0% -24.5% 2.3%Ecuador 91 6.2% -15.2% 4.4%Peru 80 8.6% -10.6% 2.6%Uruguay 31 11.5% -25.4% 2.4%Latin America 33,618 -15.4% -7.6% 16.8%
Source: IMS Health: MIDAS, MAT September 2003

April 15, 202355
© 2002 IMS Health Incorporated or its affiliates. All rights reserved.
Except in Brazil, Klacid under-performs relative to the macrolide therapy class
Value Sales MAT Sept 2003 (Current US$ Thousand)
Klacid Growth (MAT Sept 2002-MAT Sept 2003)
Macrolide Therapy Class Growth (MAT Sept 2002-MAT Sept 2003)
Klacid Share of Therapy Class Value Sales (MAT Sept 2003)
Mexico 16,033 -6.3% 0.0% 15.8%Brazil 3,156 -4.0% -9.7% 9.3%Puerto Rico 3,058 -4.8% 5.9% 14.7%Argentina 2,249 -33.8% -4.5% 13.3%Central America 1,998 -1.9% 7.1% 15.9%Venezuela 1,711 -29.0% -18.0% 8.3%Colombia 1,413 -18.4% -9.1% 13.6%Ecuador 849 -30.1% 2.2% 10.4%Peru 666 -13.9% -12.2% 12.8%Chile 478 -38.4% -10.7% 6.5%Dominican Republic 305 -41.1% -22.8% 9.0%Uruguay 168 -37.2% -25.1% 28.3%Latin America 32,087 -12.7% -4.2% 13.3%
Source: IMS Health: MIDAS, MAT September 2003
April 15, 202356
© 2002 IMS Health Incorporated or its affiliates. All rights reserved.
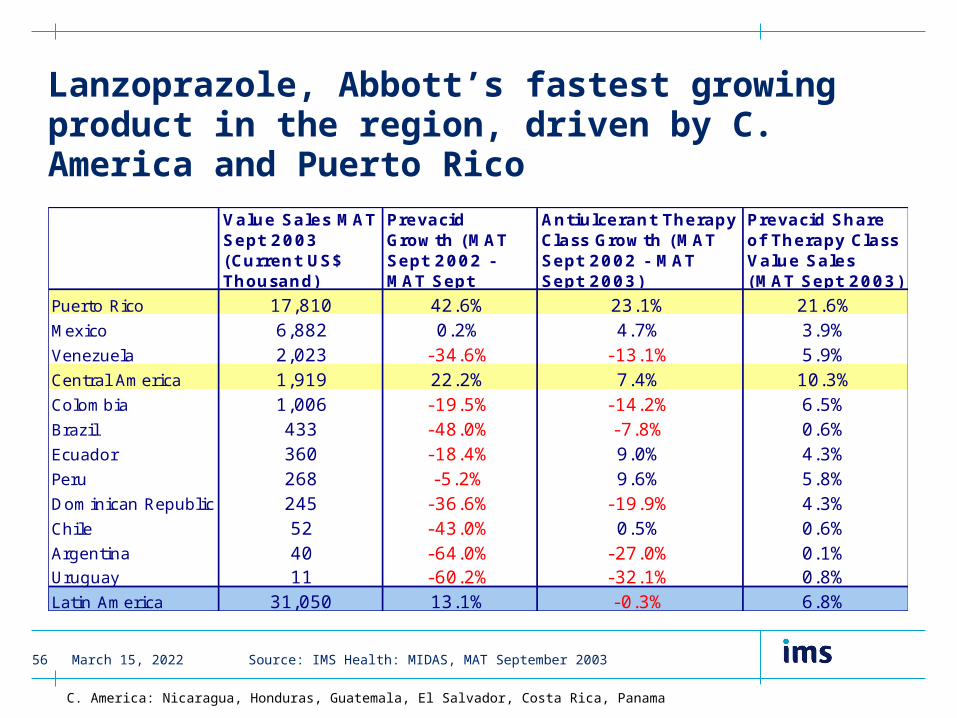
Lanzoprazole, Abbott’s fastest growing product in the region, driven by C. America and Puerto Rico
Value Sales MAT Sept 2003 (Current US$ Thousand)
Prevacid Growth (MAT Sept 2002 - MAT Sept
Antiulcerant Therapy Class Growth (MAT Sept 2002 - MAT Sept 2003)
Prevacid Share of Therapy Class Value Sales (MAT Sept 2003)
Puerto Rico 17,810 42.6% 23.1% 21.6%Mexico 6,882 0.2% 4.7% 3.9%Venezuela 2,023 -34.6% -13.1% 5.9%Central America 1,919 22.2% 7.4% 10.3%Colombia 1,006 -19.5% -14.2% 6.5%Brazil 433 -48.0% -7.8% 0.6%Ecuador 360 -18.4% 9.0% 4.3%Peru 268 -5.2% 9.6% 5.8%Dominican Republic 245 -36.6% -19.9% 4.3%Chile 52 -43.0% 0.5% 0.6%Argentina 40 -64.0% -27.0% 0.1%Uruguay 11 -60.2% -32.1% 0.8%Latin America 31,050 13.1% -0.3% 6.8%
Source: IMS Health: MIDAS, MAT September 2003
C. America: Nicaragua, Honduras, Guatemala, El Salvador, Costa Rica, Panama
April 15, 202357
© 2002 IMS Health Incorporated or its affiliates. All rights reserved.
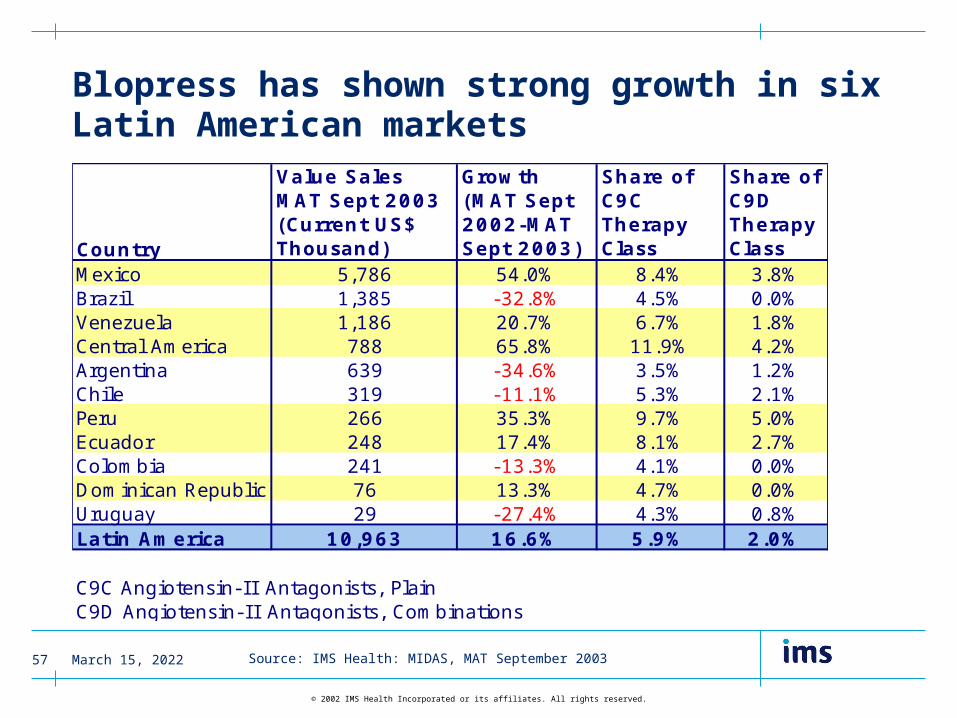
Blopress has shown strong growth in six Latin American markets
Country
Value Sales MAT Sept 2003 (Current US$ Thousand)
Growth (MAT Sept 2002-MAT Sept 2003)
Share of C9C Therapy Class
Share of C9D Therapy Class
Mexico 5,786 54.0% 8.4% 3.8%Brazil 1,385 -32.8% 4.5% 0.0%Venezuela 1,186 20.7% 6.7% 1.8%Central America 788 65.8% 11.9% 4.2%Argentina 639 -34.6% 3.5% 1.2%Chile 319 -11.1% 5.3% 2.1%Peru 266 35.3% 9.7% 5.0%Ecuador 248 17.4% 8.1% 2.7%Colombia 241 -13.3% 4.1% 0.0%Dominican Republic 76 13.3% 4.7% 0.0%Uruguay 29 -27.4% 4.3% 0.8%Latin America 10,963 16.6% 5.9% 2.0%
C9C Angiotensin- I I Antagonists, PlainC9D Angiotensin- I I Antagonists, Combinations
Source: IMS Health: MIDAS, MAT September 2003

April 15, 202358
© 2002 IMS Health Incorporated or its affiliates. All rights reserved.
Abbott’s Humira ranked #4 in the Latin American M1C market in 2003
Rank Product Corporation Value Sales MAT Sept 2003 (Current US$ Thousand)
Share of Therapy Class
Growth (MAT Sept 2002-MAT Sept 2003)
1 Arava Aventis 10,581 38.6% -5.1%2 Enbrel Amgen 9,503 34.7% 82.6%3 Plaquenil Sanofi-Synthelabo 4,085 14.9% 34.9%4 Humira Abbott 534 1.9% *5 Filartros Ivax Corp. 459 1.7% 28.2%6 Evoquin Ivax Corp. 409 1.5% -9.2%7 Ervemin Ivax Corp. 334 1.2% -1.6%8 Polirreumin TRB Chemedica 300 1.1% 77.9%9 Sufortan Sanfer 265 1.0% 0.1%10 Dimard Metlen Pharma 204 0.7% -10.5%
27,408 100.0% 25%
* No Sales in MAT Sept 2002
Specific Anti-Rheumatics Agents in Latin America
Source: IMS Health: MIDAS, MAT September 2003

April 15, 202359
© 2002 IMS Health Incorporated or its affiliates. All rights reserved.
Kaletra has been Abbott’s fastest growing drug in Canada
Top 10 Abbott Products in Canada
Rank Product Anatomical Therapy Class Level 3
Value Sales MAT Sept 2003 (Constant US$ Million)
Growth (MAT Sept 2002 - MAT Sept 2003)
% of Abbott Sales in Canada
1 Prevacid Antiulcerants 85.9 17.2% 25.9%
2 Klacid Macrolides & Similar Types 51.9 -1.7% 15.7%
3 Lupron Cytostatic Hormones 32.5 2.8% 9.8%
4 Ensure Other Nutrients 18.9 0.0% 5.7%
5 Synthroid Thyroid Preparations 17.0 11.7% 5.1%
6 Kaletra HIV Antivirals 15.7 37.5% 4.7%
7 Precision Plus Diabetes Tests 13.0 -31.1% 3.9%
8 Precision Xtra Diabetes Tests 9.6 72.6% 2.9%
9 Similac Advance Infant Formulas 7.7 -0.2% 2.3%10 Reductil Anti-Obesity Preparations
Exc. Dietetics7.1 -13.0% 2.1%
331.7 -5.1% 100.0%Total Abbott Sales in Canada
Source: IMS Health: MIDAS, MAT September 2003
April 15, 202360
© 2002 IMS Health Incorporated or its affiliates. All rights reserved.
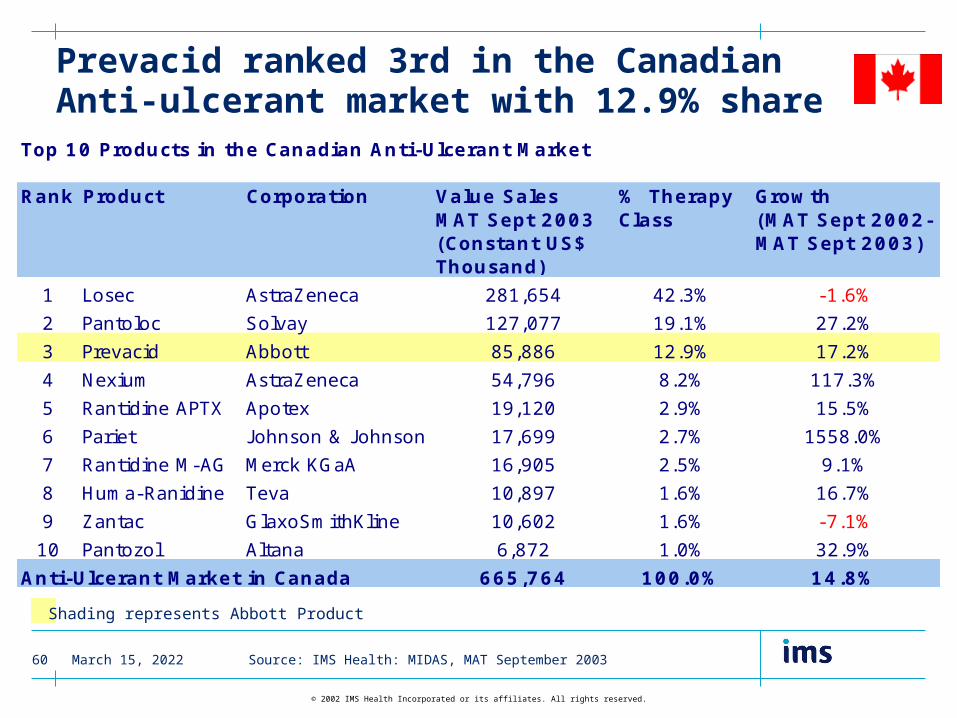
Prevacid ranked 3rd in the Canadian Anti-ulcerant market with 12.9% share
Top 10 Products in the Canadian Anti-Ulcerant Market
Rank Product Corporation Value Sales MAT Sept 2003 (Constant US$ Thousand)
% Therapy Class
Growth (MAT Sept 2002-MAT Sept 2003)
1 Losec AstraZeneca 281,654 42.3% -1.6%
2 Pantoloc Solvay 127,077 19.1% 27.2%
3 Prevacid Abbott 85,886 12.9% 17.2%
4 Nexium AstraZeneca 54,796 8.2% 117.3%
5 Rantidine APTX Apotex 19,120 2.9% 15.5%
6 Pariet J ohnson & J ohnson 17,699 2.7% 1558.0%
7 Rantidine M-AG Merck KGaA 16,905 2.5% 9.1%
8 Huma-Ranidine Teva 10,897 1.6% 16.7%
9 Zantac GlaxoSmithKline 10,602 1.6% -7.1%
10 Pantozol Altana 6,872 1.0% 32.9%
Anti-Ulcerant Market in Canada 665,764 100.0% 14.8%
Source: IMS Health: MIDAS, MAT September 2003
Shading represents Abbott Product
April 15, 202361
© 2002 IMS Health Incorporated or its affiliates. All rights reserved.
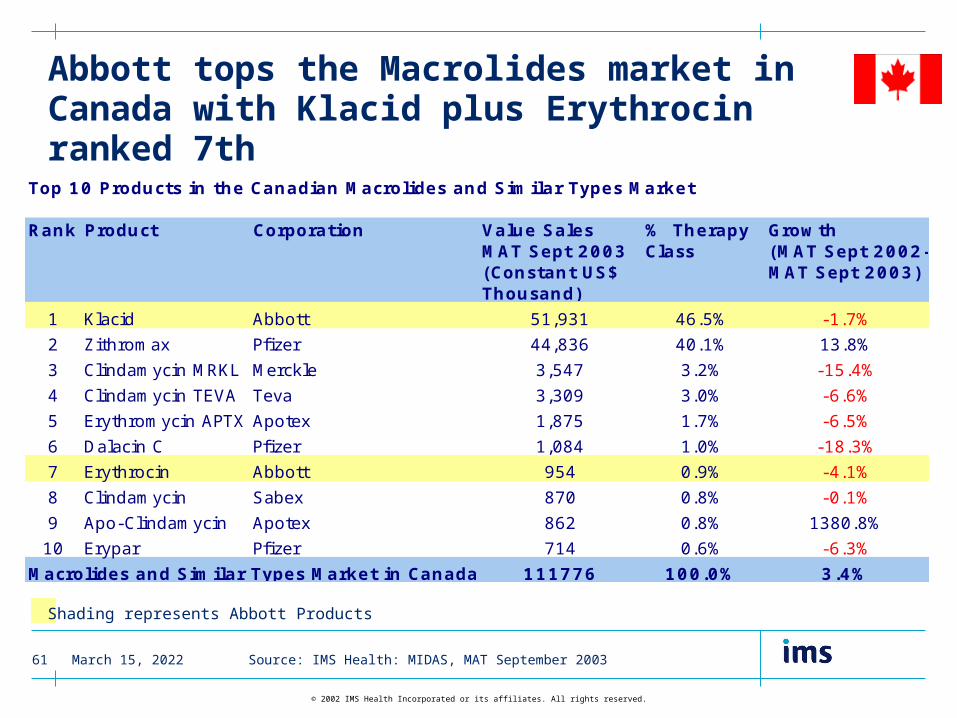
Abbott tops the Macrolides market in Canada with Klacid plus Erythrocin ranked 7th
Top 10 Products in the Canadian Macrolides and Similar Types Market
Rank Product Corporation Value Sales MAT Sept 2003 (Constant US$ Thousand)
% Therapy Class
Growth (MAT Sept 2002-MAT Sept 2003)
1 Klacid Abbott 51,931 46.5% -1.7%
2 Zithromax Pfizer 44,836 40.1% 13.8%
3 Clindamycin MRKL Merckle 3,547 3.2% -15.4%
4 Clindamycin TEVA Teva 3,309 3.0% -6.6%
5 Erythromycin APTX Apotex 1,875 1.7% -6.5%
6 Dalacin C Pfizer 1,084 1.0% -18.3%
7 Erythrocin Abbott 954 0.9% -4.1%
8 Clindamycin Sabex 870 0.8% -0.1%
9 Apo-Clindamycin Apotex 862 0.8% 1380.8%
10 Erypar Pfizer 714 0.6% -6.3%
111776 100.0% 3.4%Macrolides and Similar Types Market in Canada
Source: IMS Health: MIDAS, MAT September 2003
Shading represents Abbott Products

April 15, 202362
© 2002 IMS Health Incorporated or its affiliates. All rights reserved.
Lupron ranked 2nd with 37.4% share of the Canadian cytostatic hormone marketTop 10 Products in the Canadian Cytostatic Hormone Market
Rank Product Corporation Value Sales MAT Sept 2003 (Constant US$ Thousand)
% Therapy Class
Growth (MAT Sept 2002-MAT Sept 2003)
1 Zoladex AstraZeneca 38044 43.8% 4.2%
2 Lupron Abbott 32466 37.4% 2.8%
3 Suprefact Aventis 12925 14.9% 28.0%
4 Megestrol APTX Apotex 1994 2.3% 43.1%
5 Megace Bristol-Myers Squibb 527 0.6% -33.1%
6 Depo Provera Pfizer 344 0.4% -10.2%
7 Megestrol B-MS Bristol-Myers Squibb 314 0.4% -50.8%
8 Veraplex Teva 232 0.3% -87.0%
9 Honvan Viatris 2 0.0% 2.6%
10 Megestrol Pro Doc 2 0.0% -88.4%
Cytostatic Hormone Market in Canada 86850 100.0% 4.4%
Source: IMS Health: MIDAS, MAT September 2003
Shading represents Abbott Product

April 15, 202363
© 2002 IMS Health Incorporated or its affiliates. All rights reserved.
Challenges for Abbott in the Latin America/ Canada region
• Performance across the region: How to close the gap and grow at least with the market? Which therapy classes and products, current and future, would drive growth?
• As markets continue to open up, where are opportunities for partnerships and licensing?
April 15, 202364
© 2002 IMS Health Incorporated or its affiliates. All rights reserved.
Appendix:
Latin America - Country Deep Dive
April 15, 202365
© 2002 IMS Health Incorporated or its affiliates. All rights reserved.
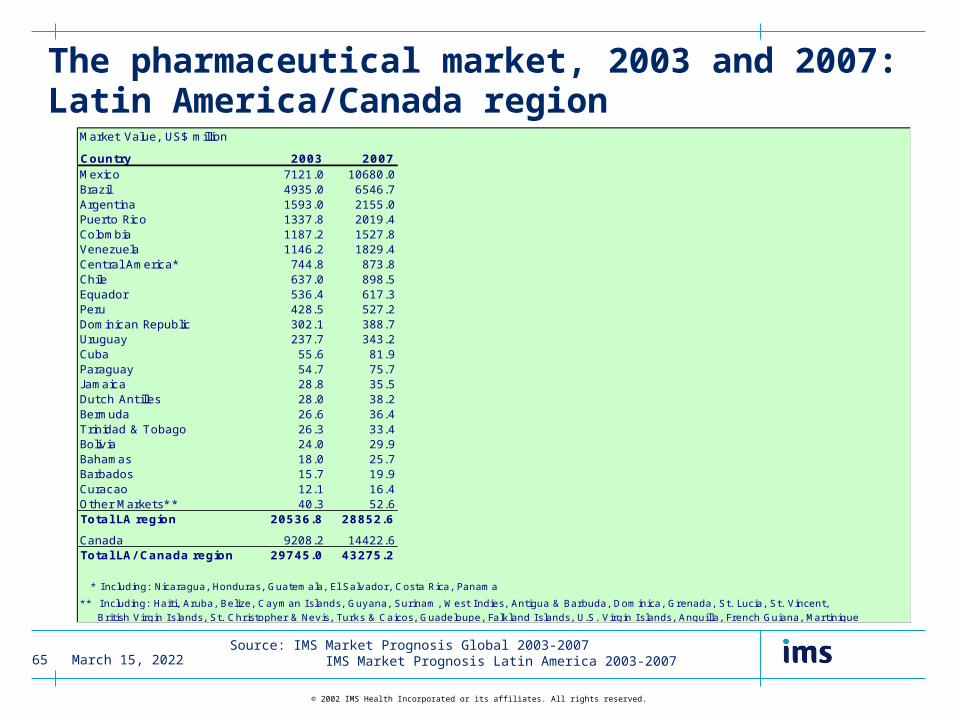
The pharmaceutical market, 2003 and 2007: Latin America/Canada region
Market Value, US$ million
Country 2003 2007Mexico 7121.0 10680.0Brazil 4935.0 6546.7Argentina 1593.0 2155.0Puerto Rico 1337.8 2019.4Colombia 1187.2 1527.8Venezuela 1146.2 1829.4Central America* 744.8 873.8Chile 637.0 898.5Equador 536.4 617.3Peru 428.5 527.2Dominican Republic 302.1 388.7Uruguay 237.7 343.2Cuba 55.6 81.9Paraguay 54.7 75.7J amaica 28.8 35.5Dutch Antilles 28.0 38.2Bermuda 26.6 36.4Trinidad & Tobago 26.3 33.4Bolivia 24.0 29.9Bahamas 18.0 25.7Barbados 15.7 19.9Curacao 12.1 16.4Other Markets* * 40.3 52.6Total LA region 20536.8 28852.6
Canada 9208.2 14422.6Total LA/ Canada region 29745.0 43275.2
* I ncluding: Nicaragua, Honduras, Guatemala, El Salvador, Costa Rica, Panama
** I ncluding: Haiti, Aruba, Belize, Cayman I slands, Guyana, Surinam, West I ndies, Antigua & Barbuda, Dominica, Grenada, St. Lucia, St. Vincent,
British Virgin I slands, St. Christopher & Nevis, Turks & Caicos, Guadeloupe, Falkland I slands, U.S. Virgin I slands, Anguilla, French Guiana, Martinique
Source: IMS Market Prognosis Global 2003-2007 IMS Market Prognosis Latin America 2003-2007
April 15, 202366
© 2002 IMS Health Incorporated or its affiliates. All rights reserved.
Argentina
April 15, 202367
© 2002 IMS Health Incorporated or its affiliates. All rights reserved.
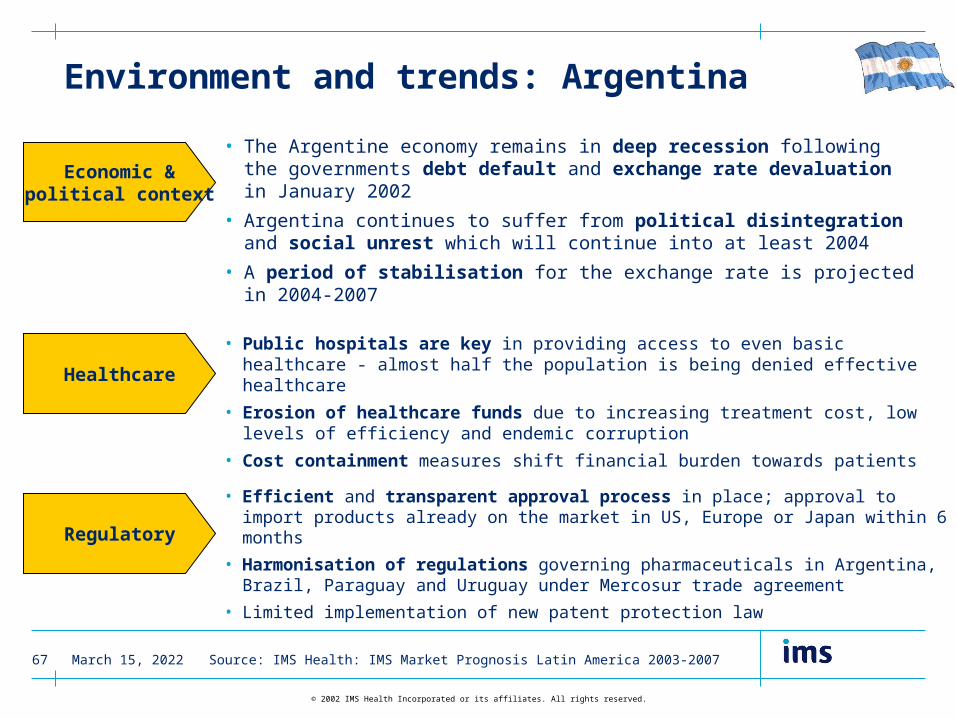
Environment and trends: Argentina
Source: IMS Health: IMS Market Prognosis Latin America 2003-2007
Economic &political context
Healthcare
Regulatory
• The Argentine economy remains in deep recession following the governments debt default and exchange rate devaluation in January 2002
• Argentina continues to suffer from political disintegration and social unrest which will continue into at least 2004
• A period of stabilisation for the exchange rate is projected in 2004-2007
• Public hospitals are key in providing access to even basic healthcare - almost half the population is being denied effective healthcare
• Erosion of healthcare funds due to increasing treatment cost, low levels of efficiency and endemic corruption
• Cost containment measures shift financial burden towards patients
• Efficient and transparent approval process in place; approval to import products already on the market in US, Europe or Japan within 6 months
• Harmonisation of regulations governing pharmaceuticals in Argentina, Brazil, Paraguay and Uruguay under Mercosur trade agreement
• Limited implementation of new patent protection law
April 15, 202368
© 2002 IMS Health Incorporated or its affiliates. All rights reserved.
Pharmaceutical business environment
Source: IMS Health: IMS Market Prognosis Latin America 2003-2007
• A number of multinationals pulled out of the Argentinean pharmaceutical market and have found it difficult to regain previously held market shares on their return
• Despite Roemmers and Bago heading the sales rankings in Argentina, the local industry is highly fragmented
• A true Argentinean generics market has yet to emerge; lack of regulations seen as major barrier
• OTC medicines account for <10% of the Argentine market by value
• The complex nature of the distribution system in Argentina limits the margins of individual players, compromises efficiency and encourages corruption
• Widespread discounting as marketing strategy since collapse of the economy

April 15, 202369
© 2002 IMS Health Incorporated or its affiliates. All rights reserved.
Local manufacturers well representedin the top 10 - Bago, Roemmers, Gador, Elea
Domestic Companies
Rank CorporationValue Sales MAT Sept 2003 (Current US$ Million)
CAGR 5 Years (1998-2003)
Market Share
Argentina 1,398.2 -20.4% 100.0%
1 Bago 109.1 -19.5% 7.8%
2 Roemmers 100.4 -21.0% 7.2%
3 Roche 73.0 -21.8% 5.2%
4 Novartis 61.8 -22.4% 4.4%
5 Pfizer 58.9 -24.9% 4.2%
6 GlaxoSmithKline 55.6 -17.6% 4.0%
7 Ivax Corp 51.9 -17.3% 3.7%
8 Gador 50.9 -13.6% 3.6%
9 Elea 46.8 -18.1% 3.3%
10 Aventis 42.5 -22.9% 3.0%
Top 10 650.8 -20.3% 46.5%
Source: IMS Health: MIDAS, MAT September 2003

April 15, 202370
© 2002 IMS Health Incorporated or its affiliates. All rights reserved.
Abbott ranked 25th in Argentina and has negative growth beyond the market Rank Corporation
Value Sales MAT Sept 2003 (Current US$ Million)
CAGR 5 Years (1998-2003)
Market Share
Argentina 1,398.2 -20.4% 100.0%
11 Phoenix 39.6 -18.9% 2.8%
12 Bayer 37.6 -19.5% 2.7%
13 Beta 34.2 -19.1% 2.4%
14 Boehringer Ingel 33.1 -22.4% 2.4%
15 Schering Plough 27.9 -21.2% 2.0%
16 Schering Ag 26.8 -18.7% 1.9%
17 Casasco 26.2 -18.1% 1.9%
18 Merck & Co 25.9 -26.2% 1.9%
19 Bristol-Myers Squibb 23.8 -26.5% 1.7%
20 Microsules/Bernabo 23.6 -20.0% 1.7%
Top 20 949.5 -20.6% 67.9%
25 Abbott 21.7 -26.4% 1.6%
Domestic Companies
Source: IMS Health: MIDAS, MAT September 2003
April 15, 202371
© 2002 IMS Health Incorporated or its affiliates. All rights reserved.
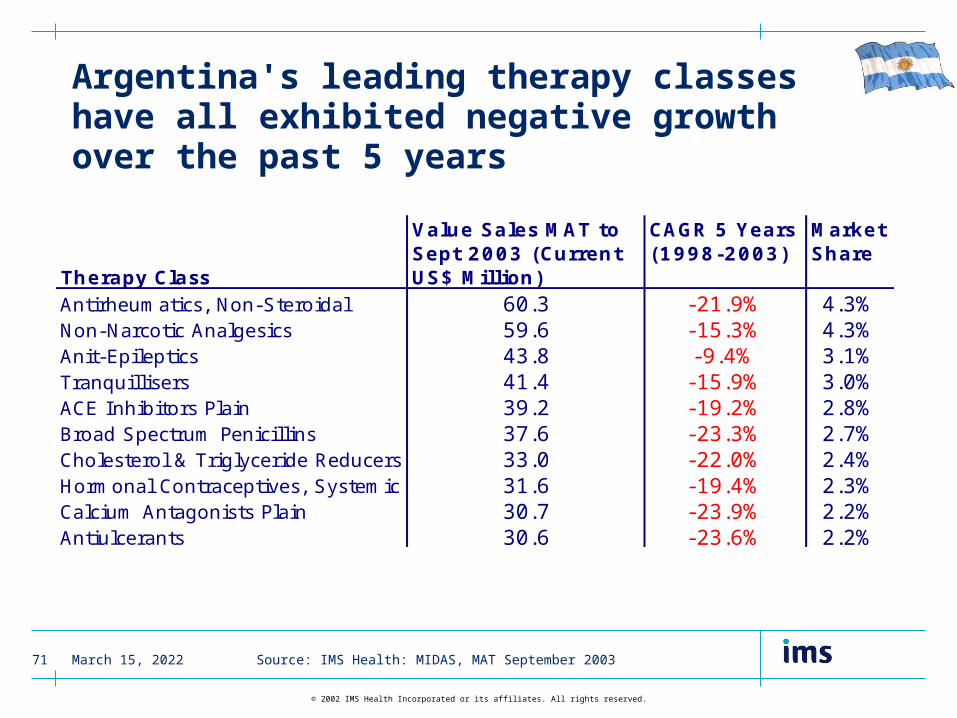
Argentina's leading therapy classes have all exhibited negative growth over the past 5 years
Therapy Class
Value Sales MAT to Sept 2003 (Current US$ Million)
CAGR 5 Years (1998-2003)
Market Share
Antirheumatics, Non-Steroidal 60.3 -21.9% 4.3%Non-Narcotic Analgesics 59.6 -15.3% 4.3%Anit-Epileptics 43.8 -9.4% 3.1%Tranquillisers 41.4 -15.9% 3.0%ACE Inhibitors Plain 39.2 -19.2% 2.8%Broad Spectrum Penicillins 37.6 -23.3% 2.7%Cholesterol & Triglyceride Reducers 33.0 -22.0% 2.4%Hormonal Contraceptives, Systemic 31.6 -19.4% 2.3%Calcium Antagonists Plain 30.7 -23.9% 2.2%Antiulcerants 30.6 -23.6% 2.2%
Source: IMS Health: MIDAS, MAT September 2003
April 15, 202372
© 2002 IMS Health Incorporated or its affiliates. All rights reserved.
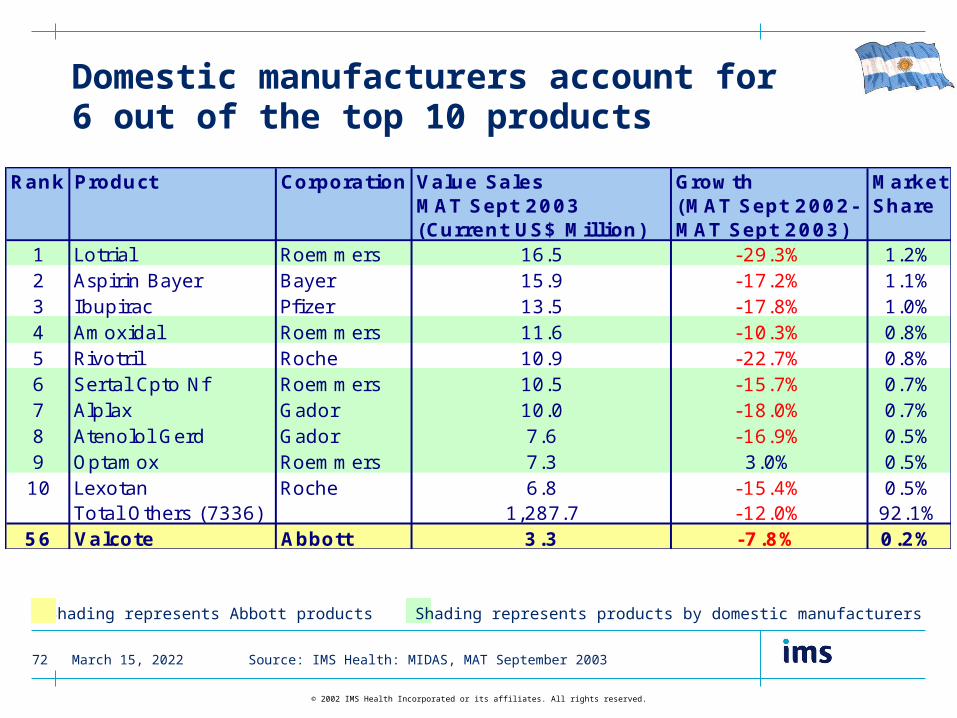
Domestic manufacturers account for 6 out of the top 10 products
Shading represents Abbott products Shading represents products by domestic manufacturers
Rank Product Corporation Value Sales MAT Sept 2003 (Current US$ Million)
Growth (MAT Sept 2002-MAT Sept 2003)
Market Share
1 Lotrial Roemmers 16.5 -29.3% 1.2%2 Aspirin Bayer Bayer 15.9 -17.2% 1.1%3 Ibupirac Pfizer 13.5 -17.8% 1.0%4 Amoxidal Roemmers 11.6 -10.3% 0.8%5 Rivotril Roche 10.9 -22.7% 0.8%6 Sertal Cpto Nf Roemmers 10.5 -15.7% 0.7%7 Alplax Gador 10.0 -18.0% 0.7%8 Atenolol Gerd Gador 7.6 -16.9% 0.5%9 Optamox Roemmers 7.3 3.0% 0.5%10 Lexotan Roche 6.8 -15.4% 0.5%
Total Others (7336) 1,287.7 -12.0% 92.1%56 Valcote Abbott 3.3 -7.8% 0.2%
Source: IMS Health: MIDAS, MAT September 2003
April 15, 202373
© 2002 IMS Health Incorporated or its affiliates. All rights reserved.
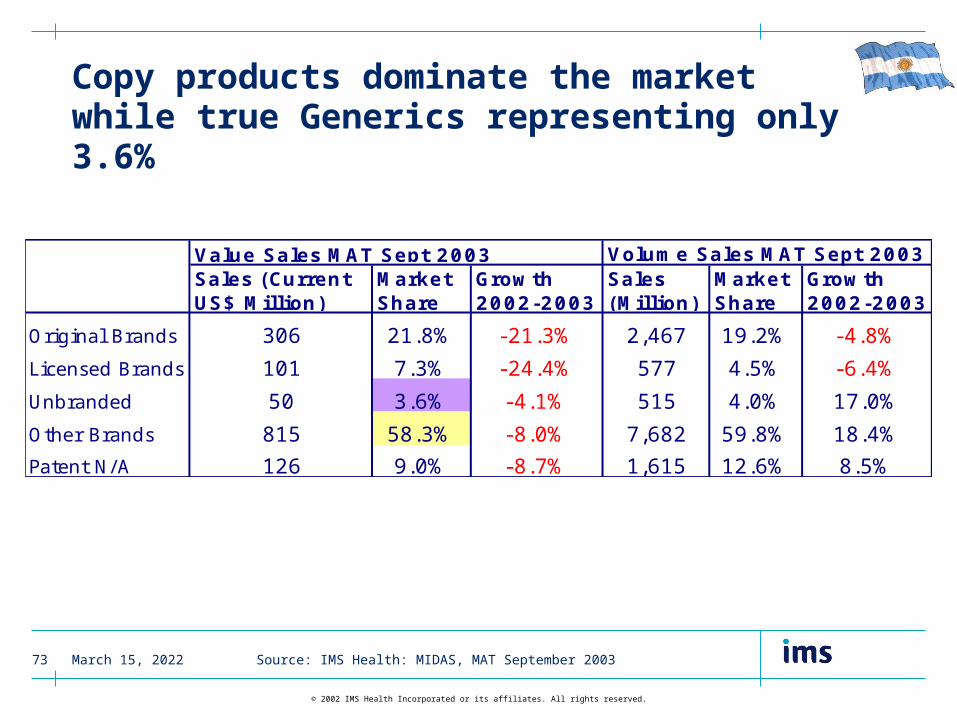
Copy products dominate the marketwhile true Generics representing only 3.6%
Volume Sales MAT Sept 2003Sales (Current US$ Million)
Market Share
Growth 2002-2003
Sales (Million)
Market Share
Growth 2002-2003
Original Brands 306 21.8% -21.3% 2,467 19.2% -4.8%
Licensed Brands 101 7.3% -24.4% 577 4.5% -6.4%
Unbranded 50 3.6% -4.1% 515 4.0% 17.0%
Other Brands 815 58.3% -8.0% 7,682 59.8% 18.4%
Patent N/A 126 9.0% -8.7% 1,615 12.6% 8.5%
Value Sales MAT Sept 2003
Source: IMS Health: MIDAS, MAT September 2003
April 15, 202374
© 2002 IMS Health Incorporated or its affiliates. All rights reserved.
Brazil
April 15, 202375
© 2002 IMS Health Incorporated or its affiliates. All rights reserved.
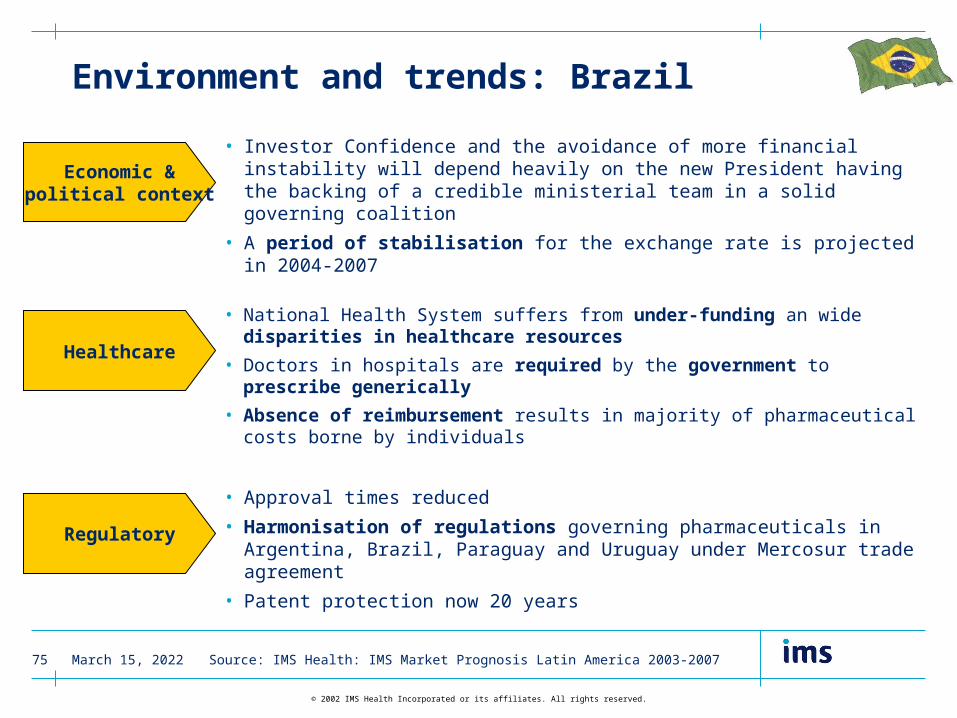
Environment and trends: Brazil
Source: IMS Health: IMS Market Prognosis Latin America 2003-2007
Economic &political context
Healthcare
Regulatory
• Investor Confidence and the avoidance of more financial instability will depend heavily on the new President having the backing of a credible ministerial team in a solid governing coalition
• A period of stabilisation for the exchange rate is projected in 2004-2007
• National Health System suffers from under-funding an wide disparities in healthcare resources
• Doctors in hospitals are required by the government to prescribe generically
• Absence of reimbursement results in majority of pharmaceutical costs borne by individuals
• Approval times reduced
• Harmonisation of regulations governing pharmaceuticals in Argentina, Brazil, Paraguay and Uruguay under Mercosur trade agreement
• Patent protection now 20 years
April 15, 202376
© 2002 IMS Health Incorporated or its affiliates. All rights reserved.
Pharmaceutical business environment
Source: IMS Health: IMS Market Prognosis Latin America 2003-2007
• Generic companies gaining market share from original brand manufacturers
• Bioequivalent generics have achieved 5% of total retail market value and 4.5% of volume sales in 2 years
• OTC market ill-defined - many prescription only products sold by pharmacies without a prescription
• Prices frozen since 1999 - government drive to reduce healthcare costs - with occasional prices increases permitted
• Fragmented distribution system moving towards consolidation

April 15, 202377
© 2002 IMS Health Incorporated or its affiliates. All rights reserved.
Two Brazilian companies among top 10: Ache Labs and EMS, ranked 2nd and 6th
Domestic Companies
Rank CorporationValue Sales MAT Sept 2003 (Current US$ Million)
CAGR 5 Years (1998-2003)
Market Share
Brazil 3,722.0 -8.3% 100.0%
1 Pfizer 223.4 -7.9% 6.0%
2 Ache Labs 213.4 -10.2% 5.7%
3 Novartis 213.1 -12.4% 5.7%
4 Aventis 196.2 -13.1% 5.3%
5 Roche 136.5 -12.4% 3.7%
6 EMS 128.5 11.5% 3.5%
7 GlaxoSmithKline 123.8 -16.0% 3.3%
8 Merck & Co 111.2 -12.9% 3.0%
9 Schering Plough 111.0 -10.6% 3.0%
10 Schering Ag 109.7 -2.2% 2.9%
Top 10 1,566.8 -10.1% 42.1%
Source: IMS Health: MIDAS, MAT September 2003
April 15, 202378
© 2002 IMS Health Incorporated or its affiliates. All rights reserved.
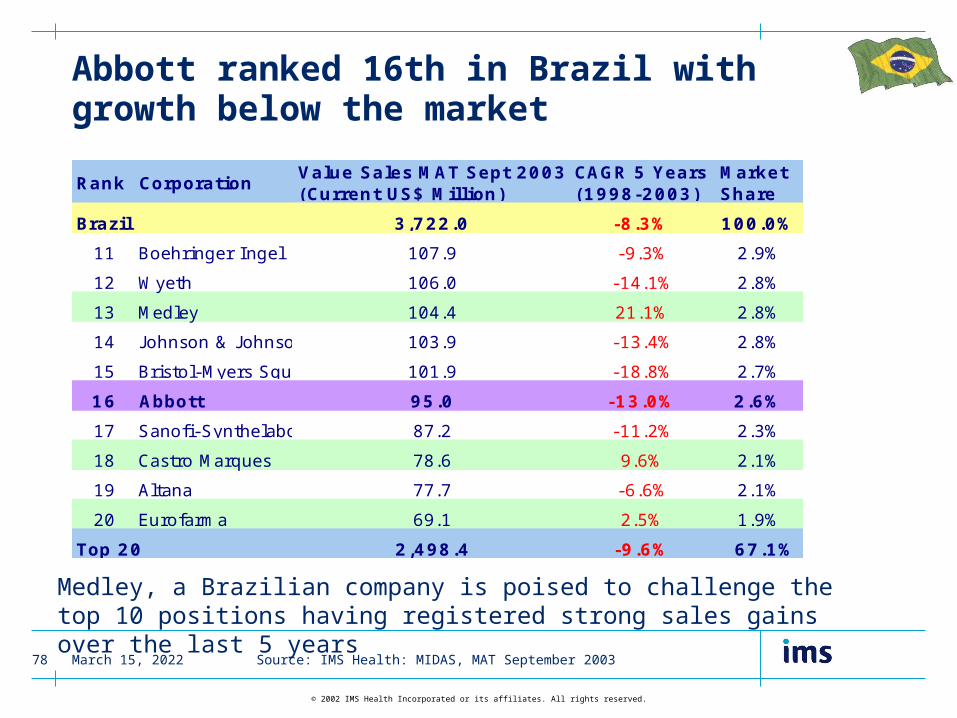
Abbott ranked 16th in Brazil with growth below the market
Medley, a Brazilian company is poised to challenge the top 10 positions having registered strong sales gains over the last 5 years
Rank CorporationValue Sales MAT Sept 2003 (Current US$ Million)
CAGR 5 Years (1998-2003)
Market Share
Brazil 3,722.0 -8.3% 100.0%
11 Boehringer Ingel 107.9 -9.3% 2.9%
12 Wyeth 106.0 -14.1% 2.8%
13 Medley 104.4 21.1% 2.8%
14 J ohnson & J ohnson 103.9 -13.4% 2.8%
15 Bristol-Myers Squibb 101.9 -18.8% 2.7%
16 Abbott 95.0 -13.0% 2.6%
17 Sanofi-Synthelabo 87.2 -11.2% 2.3%
18 Castro Marques 78.6 9.6% 2.1%
19 Altana 77.7 -6.6% 2.1%
20 Eurofarma 69.1 2.5% 1.9%
Top 20 2,498.4 -9.6% 67.1%
Source: IMS Health: MIDAS, MAT September 2003

April 15, 202379
© 2002 IMS Health Incorporated or its affiliates. All rights reserved.
Other Urological Preparations are the only class to have shown strong positive growth over the last 5 years
Therapy Class
Value Sales MAT to Sept 2003 (Current US$ Million)
CAGR 5 Years (1998-2003)
Market Share
Antirheumatics, Non-Steroidal 187.3 -11.8% 5.0%Hormonal Contraceptives, Systemic 173.7 -2.9% 4.7%Non-Narcotic Analgesics 157.7 -9.5% 4.2%Antidepressants & Mood Stabilisers 106.9 0.6% 2.9%Tranquillisers 73.8 -7.7% 2.0%Other Urological Preparations 69.8 17.7% 1.9%Cholesterol & Triglyceride Reducers 69.6 -2.0% 1.9%Antiulcerants 69.1 -13.2% 1.9%Broad Spectrum Penicillins 62.6 -15.2% 1.7%Topical Nasal Preparations 61.4 -10.5% 1.6%
Source: IMS Health: MIDAS, MAT September 2003

April 15, 202380
© 2002 IMS Health Incorporated or its affiliates. All rights reserved.
Abbott has the 8th highest selling product in Brazil - Neosaldina, a migraine treatment launched in 1972
Shading represents Abbott product
Rank Product Corporation Value Sales MAT Sept 2003(Current US$ Million)
Growth (MAT Sept 2002-MAT Sept 2003)
Market Share
1 Viagra Pfizer 52.6 1.0% 1.4%2 Voltaren Novartis 49.5 -22.5% 1.3%3 Miotan Aventis 32.0 -3.4% 0.9%4 Tylenol J & J 30.1 -25.3% 0.8%5 Vioxx Merck & Co 24.8 3.6% 0.7%6 Lipitor Pfizer 22.0 0.2% 0.6%7 Diane Schering AG 20.7 -0.6% 0.6%8 Neosaldina Abbott 19.9 -11.1% 0.5%9 Lexotan Roche 18.7 -18.5% 0.5%10 Novalgin Aventis 17.6 -20.4% 0.5%
Total Others (7336) 3,434.0 -8.6% 92.3%
Source: IMS Health: MIDAS, MAT September 2003
April 15, 202381
© 2002 IMS Health Incorporated or its affiliates. All rights reserved.
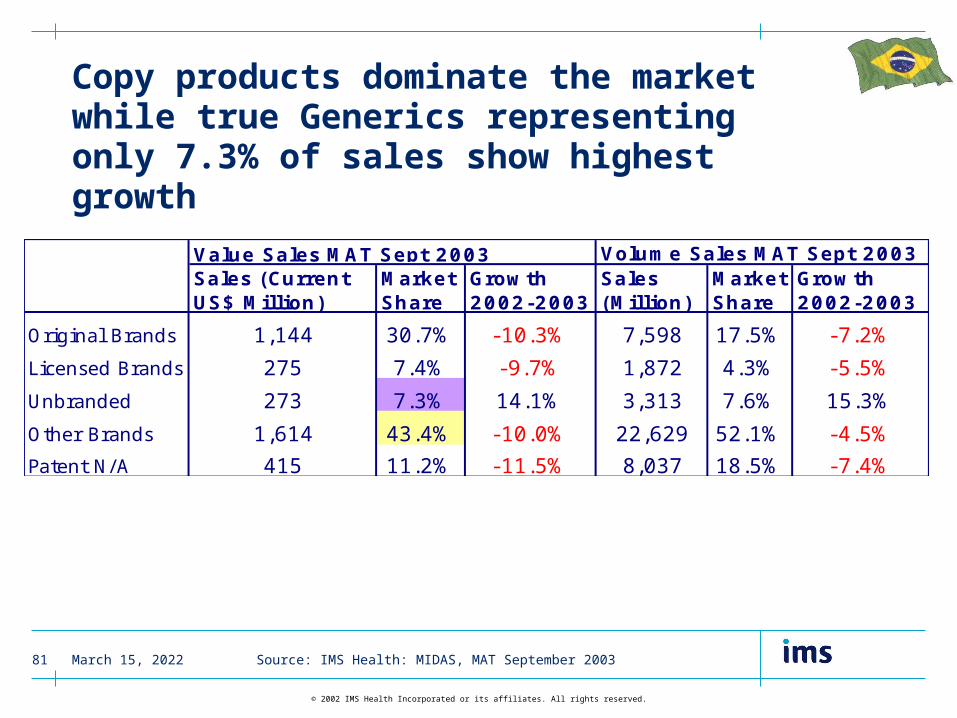
Copy products dominate the marketwhile true Generics representing only 7.3% of sales show highest growth
Volume Sales MAT Sept 2003Sales (Current US$ Million)
Market Share
Growth 2002-2003
Sales (Million)
Market Share
Growth 2002-2003
Original Brands 1,144 30.7% -10.3% 7,598 17.5% -7.2%
Licensed Brands 275 7.4% -9.7% 1,872 4.3% -5.5%
Unbranded 273 7.3% 14.1% 3,313 7.6% 15.3%
Other Brands 1,614 43.4% -10.0% 22,629 52.1% -4.5%
Patent N/A 415 11.2% -11.5% 8,037 18.5% -7.4%
Value Sales MAT Sept 2003
Source: IMS Health: MIDAS, MAT September 2003
April 15, 202382
© 2002 IMS Health Incorporated or its affiliates. All rights reserved.
Chile
April 15, 202383
© 2002 IMS Health Incorporated or its affiliates. All rights reserved.
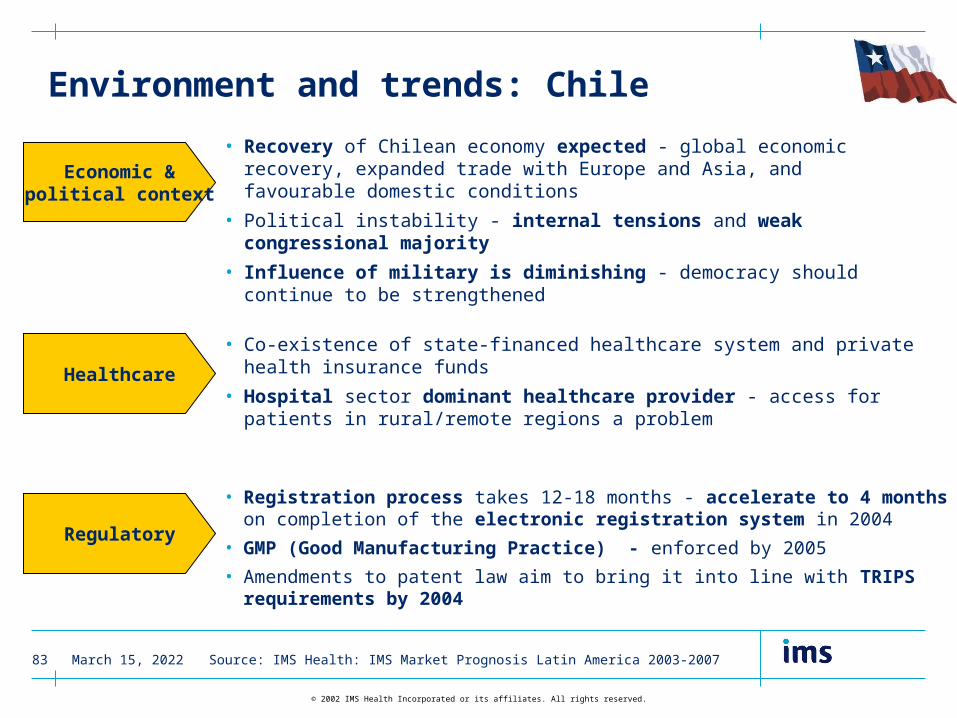
Environment and trends: Chile
Source: IMS Health: IMS Market Prognosis Latin America 2003-2007
Economic &political context
Healthcare
Regulatory
• Recovery of Chilean economy expected - global economic recovery, expanded trade with Europe and Asia, and favourable domestic conditions
• Political instability - internal tensions and weak congressional majority
• Influence of military is diminishing - democracy should continue to be strengthened
• Co-existence of state-financed healthcare system and private health insurance funds
• Hospital sector dominant healthcare provider - access for patients in rural/remote regions a problem
• Registration process takes 12-18 months - accelerate to 4 months on completion of the electronic registration system in 2004
• GMP (Good Manufacturing Practice) - enforced by 2005
• Amendments to patent law aim to bring it into line with TRIPS requirements by 2004

April 15, 202384
© 2002 IMS Health Incorporated or its affiliates. All rights reserved.
Pharmaceutical business environment
Source: IMS Health: IMS Market Prognosis Latin America 2003-2007
• No signs of recovery for pharmaceutical market - depressed economic climate and shift in buying patterns to cheaper drugs
• Local industry thriving - 55% of Chilean market by value and 78% by volume - but threatened by globalisation trend
• Survival option - Local industry to seek alliances/licensing agreements with international companies
• Legislation governing generic substitution is ambiguous - practise of substitution widespread
• OTC market represents 19.4% of value sales and 27.7% of volume sales - good growth predicted
• High level of discounting in retail market is unsustainable in the long run
April 15, 202385
© 2002 IMS Health Incorporated or its affiliates. All rights reserved.
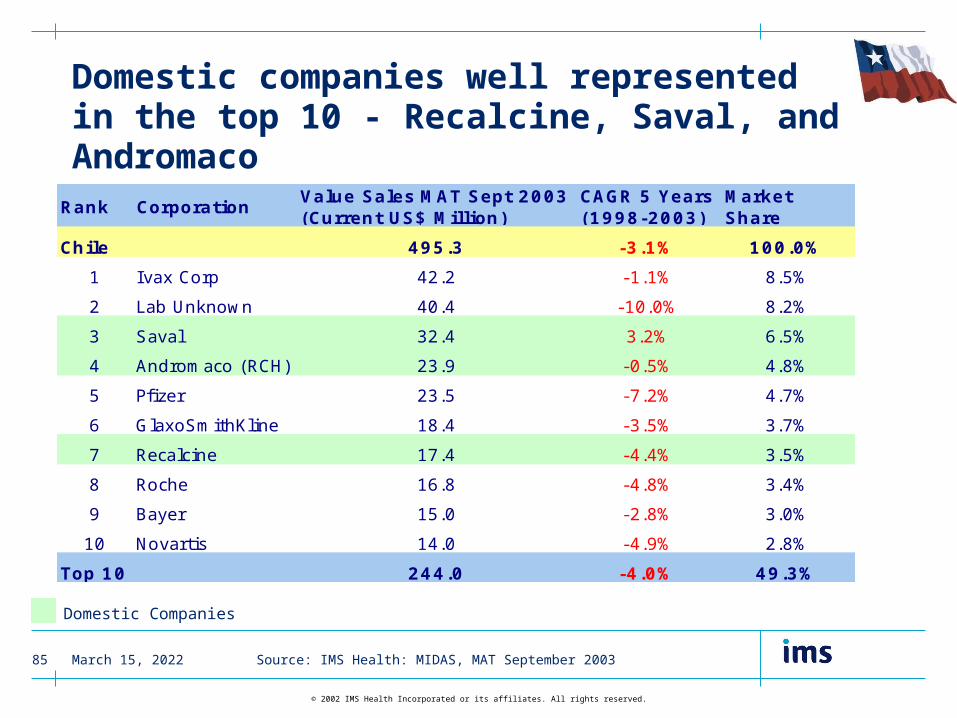
Domestic companies well representedin the top 10 - Recalcine, Saval, and Andromaco
Domestic Companies
Rank CorporationValue Sales MAT Sept 2003 (Current US$ Million)
CAGR 5 Years (1998-2003)
Market Share
Chile 495.3 -3.1% 100.0%
1 Ivax Corp 42.2 -1.1% 8.5%
2 Lab Unknown 40.4 -10.0% 8.2%
3 Saval 32.4 3.2% 6.5%
4 Andromaco (RCH) 23.9 -0.5% 4.8%
5 Pfizer 23.5 -7.2% 4.7%
6 GlaxoSmithKline 18.4 -3.5% 3.7%
7 Recalcine 17.4 -4.4% 3.5%
8 Roche 16.8 -4.8% 3.4%
9 Bayer 15.0 -2.8% 3.0%
10 Novartis 14.0 -4.9% 2.8%
Top 10 244.0 -4.0% 49.3%
Source: IMS Health: MIDAS, MAT September 2003
April 15, 202386
© 2002 IMS Health Incorporated or its affiliates. All rights reserved.
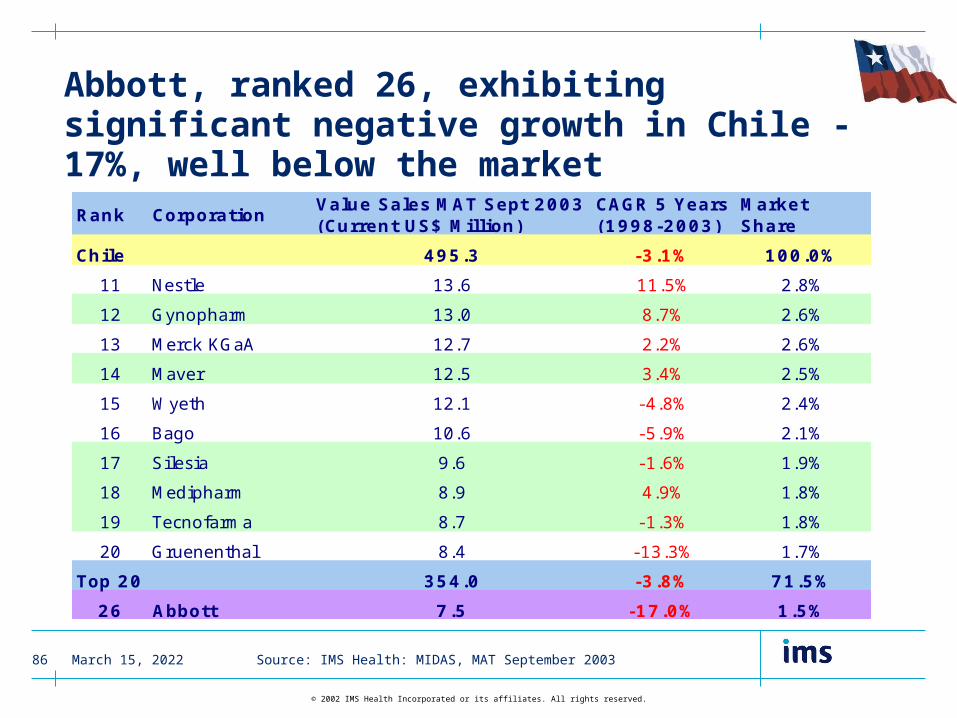
Abbott, ranked 26, exhibiting significant negative growth in Chile -17%, well below the market
Rank CorporationValue Sales MAT Sept 2003 (Current US$ Million)
CAGR 5 Years (1998-2003)
Market Share
Chile 495.3 -3.1% 100.0%
11 Nestle 13.6 11.5% 2.8%
12 Gynopharm 13.0 8.7% 2.6%
13 Merck KGaA 12.7 2.2% 2.6%
14 Maver 12.5 3.4% 2.5%
15 Wyeth 12.1 -4.8% 2.4%
16 Bago 10.6 -5.9% 2.1%
17 Silesia 9.6 -1.6% 1.9%
18 Medipharm 8.9 4.9% 1.8%
19 Tecnofarma 8.7 -1.3% 1.8%
20 Gruenenthal 8.4 -13.3% 1.7%
Top 20 354.0 -3.8% 71.5%
26 Abbott 7.5 -17.0% 1.5%
Source: IMS Health: MIDAS, MAT September 2003

April 15, 202387
© 2002 IMS Health Incorporated or its affiliates. All rights reserved.
Non-narcotic analgesics top therapyclass but anti-epileptics and infant formulas have exhibited the highest growth
Therapy Class
Value Sales MAT to Sept 2003 (Current US$ Million)
CAGR 5 Years (1998-2003)
Market Share
Non-Narcotic Analgesics 27.3 -3.8% 5.5%Antirheumatics, Non-Steroidal 24.2 -2.8% 4.9%Hormonal Contraceptives, Systemic 22.4 -1.8% 4.5%Antidepressants & Mood Stabilisers 18.0 1.7% 3.6%Infant Formulas 13.3 12.4% 2.7%Cholesterol & Triglyceride Reducers 12.2 0.0% 2.5%Cold Preparations 10.6 -4.2% 2.1%Anti-Epileptics 9.7 12.9% 2.0%Anti-Obesity Preparations exc Dietetics 9.5 -6.9% 1.9%Antiulcerants 9.3 -8.4% 1.9%
Source: IMS Health: MIDAS, MAT September 2003
April 15, 202388
© 2002 IMS Health Incorporated or its affiliates. All rights reserved.
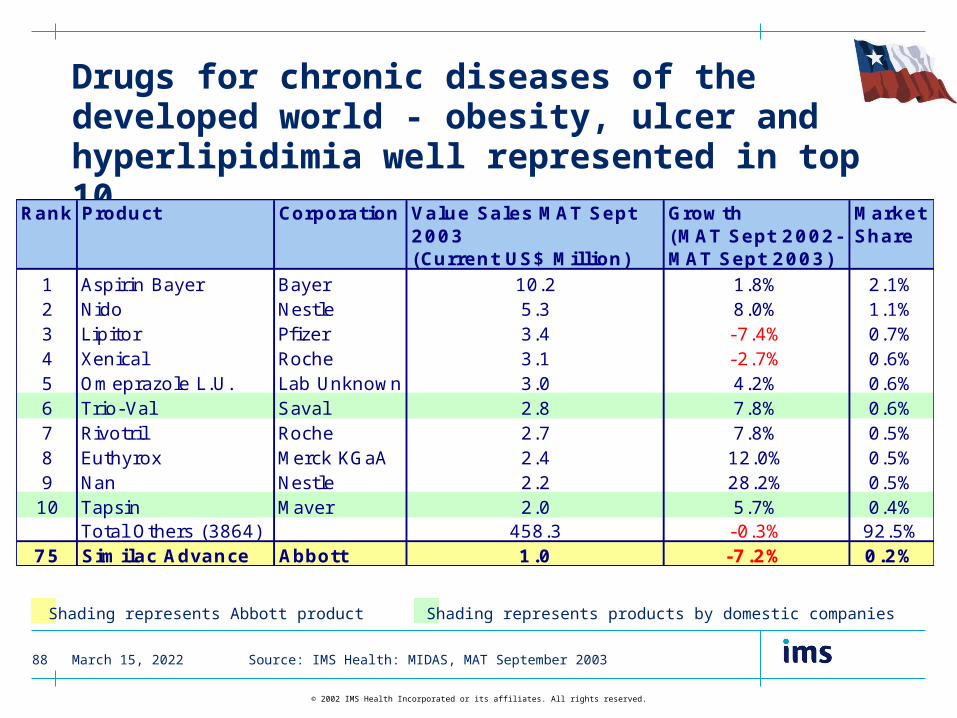
Drugs for chronic diseases of the developed world - obesity, ulcer and hyperlipidimia well represented in top 10
Rank Product Corporation Value Sales MAT Sept 2003(Current US$ Million)
Growth (MAT Sept 2002-MAT Sept 2003)
Market Share
1 Aspirin Bayer Bayer 10.2 1.8% 2.1%2 Nido Nestle 5.3 8.0% 1.1%3 Lipitor Pfizer 3.4 -7.4% 0.7%4 Xenical Roche 3.1 -2.7% 0.6%5 Omeprazole L.U. Lab Unknown 3.0 4.2% 0.6%6 Trio-Val Saval 2.8 7.8% 0.6%7 Rivotril Roche 2.7 7.8% 0.5%8 Euthyrox Merck KGaA 2.4 12.0% 0.5%9 Nan Nestle 2.2 28.2% 0.5%10 Tapsin Maver 2.0 5.7% 0.4%
Total Others (3864) 458.3 -0.3% 92.5%75 Similac Advance Abbott 1.0 -7.2% 0.2%
Shading represents products by domestic companies
Source: IMS Health: MIDAS, MAT September 2003
Shading represents Abbott product
April 15, 202389
© 2002 IMS Health Incorporated or its affiliates. All rights reserved.
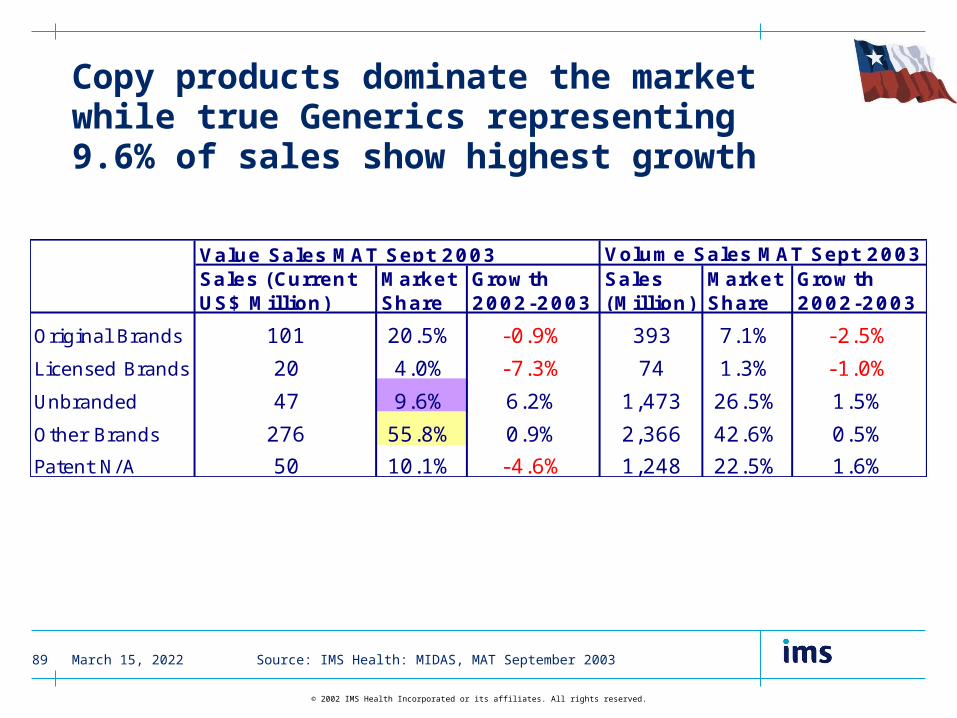
Copy products dominate the marketwhile true Generics representing 9.6% of sales show highest growth
Volume Sales MAT Sept 2003Sales (Current US$ Million)
Market Share
Growth 2002-2003
Sales (Million)
Market Share
Growth 2002-2003
Original Brands 101 20.5% -0.9% 393 7.1% -2.5%
Licensed Brands 20 4.0% -7.3% 74 1.3% -1.0%
Unbranded 47 9.6% 6.2% 1,473 26.5% 1.5%
Other Brands 276 55.8% 0.9% 2,366 42.6% 0.5%
Patent N/A 50 10.1% -4.6% 1,248 22.5% 1.6%
Value Sales MAT Sept 2003
Source: IMS Health: MIDAS, MAT September 2003
April 15, 202390
© 2002 IMS Health Incorporated or its affiliates. All rights reserved.
Colombia

April 15, 202391
© 2002 IMS Health Incorporated or its affiliates. All rights reserved.
Environment and trends: Colombia
Source: IMS Health: IMS Market Prognosis Latin America 2003-2007
Economic &political context
Healthcare
Regulatory
• The Colombian economy remains sluggish
• Long running Colombian civil war continues - attacks from rebel armed forces aimed at destabilising the political environment
• Currency depreciation risks remain - renewed rebel violence and widening public sector debt
• Healthcare reforms high on the governments agenda - expand healthcare coverage
• GP referral system introduced - shortage of doctors affects rural areas
• 7% of population have private health insurance
• Bioavailability and bioequivalence studies mandatory for generics - uncertainty about which products to comply
• Harmonisation of regulations governing pharmaceuticals in Bolivia, Colombia, Ecuador, Peru and Venezuela under the Andean Pact
• Improved intellectual property protection of pharmaceutical patents

April 15, 202392
© 2002 IMS Health Incorporated or its affiliates. All rights reserved.
Pharmaceutical business environment
Source: IMS Health: IMS Market Prognosis Latin America 2003-2007
• Colombian pharmaceutical market driven by price rather than volume growth
• Local pharmaceutical industry developed strongly - ability to copy new products
• Manufacturing by multinationals driven out - lawlessness and civil war
• Generics culture - doctors in public sector legally obliged to prescribe generically - generics companies gaining market share from original brand manufacturers
• Illegal OTC dispensing of prescription drugs - adoption of International Classification System for OTC medicines should help

April 15, 202393
© 2002 IMS Health Incorporated or its affiliates. All rights reserved.
Abbott ranked 4th in Colombia with below market growth
Rank CorporationValue Sales MAT Sept 2003 (Current US$ Million)
CAGR 5 Years (1998-2003)
Market Share
Colombia 798.5 -2.9% 100.0%
1 Pfizer 56.7 -8.9% 7.1%
2 Wyeth 50.7 -2.5% 6.4%
3 GlaxoSmithKline 39.3 -4.1% 4.9%
4 Abbott 38.2 -3.3% 4.8%
5 Novartis 33.2 -2.9% 4.2%
6 Boehringer Ingel 32.4 -4.8% 4.1%
7 Nestle 31.6 2.7% 4.0%
8 Schering Ag 31.6 5.5% 4.0%
9 Schering Plough 28.4 -4.3% 3.6%
10 Bayer 26.7 -8.3% 3.3%
Top 10 368.8 -3.8% 46.2%
Source: IMS Health: MIDAS, MAT September 2003

April 15, 202394
© 2002 IMS Health Incorporated or its affiliates. All rights reserved.
Domestic/regional players are the only companies ranked 11-20 to exhibit positive growth
Domestic Companies
Rank CorporationValue Sales MAT Sept 2003 (Current US$ Million)
CAGR 5 Years (1998-2003)
Market Share
Colombia 798.5 -2.9% 100.0%
11 Aventis 24.5 -9.4% 3.1%
12 Genfar 23.8 2.9% 3.0%
13 Roche 23.5 -3.0% 2.9%
14 Bristol-Myers Squibb 21.2 -10.6% 2.6%
15 Lafrancol 18.4 6.7% 2.3%
16 Sanofi-Synthelabo 18.2 -1.6% 2.3%
17 Merck & Co 17.9 -2.8% 2.2%
18 Tecnoquimicas 14.9 3.2% 1.9%
19 Merck KGaA 13.8 -2.6% 1.7%
20 Grupo Farma 12.8 4.8% 1.6%
Top 20 557.7 -3.4% 69.8%
Source: IMS Health: MIDAS, MAT September 2003
Venezuelan Company
April 15, 202395
© 2002 IMS Health Incorporated or its affiliates. All rights reserved.
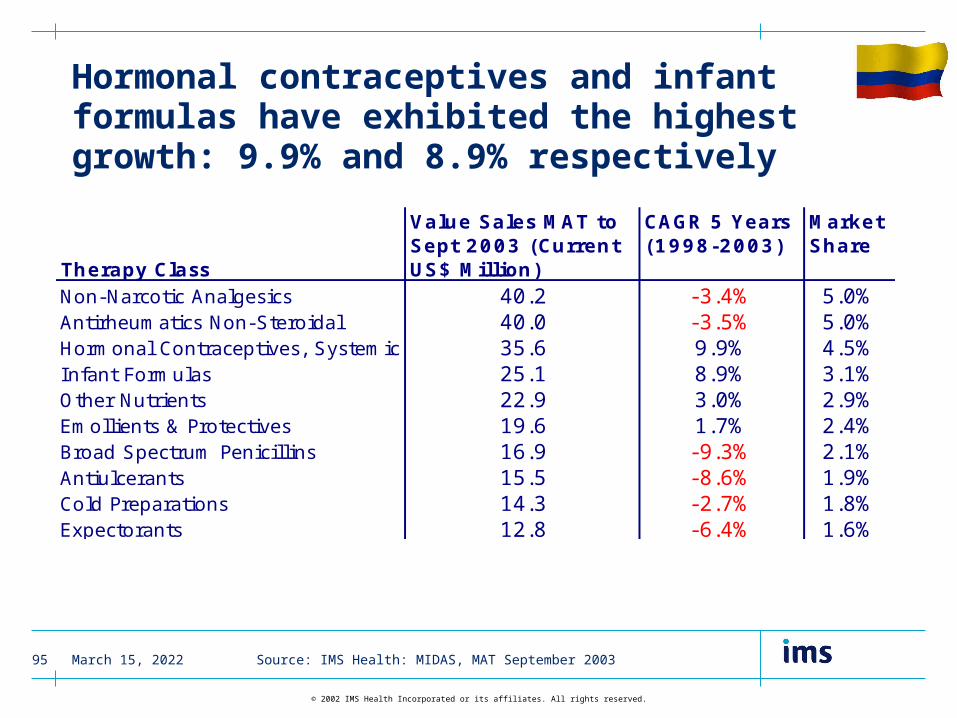
Hormonal contraceptives and infant formulas have exhibited the highest growth: 9.9% and 8.9% respectively
Therapy Class
Value Sales MAT to Sept 2003 (Current US$ Million)
CAGR 5 Years (1998-2003)
Market Share
Non-Narcotic Analgesics 40.2 -3.4% 5.0%Antirheumatics Non-Steroidal 40.0 -3.5% 5.0%Hormonal Contraceptives, Systemic 35.6 9.9% 4.5%Infant Formulas 25.1 8.9% 3.1%Other Nutrients 22.9 3.0% 2.9%Emollients & Protectives 19.6 1.7% 2.4%Broad Spectrum Penicillins 16.9 -9.3% 2.1%Antiulcerants 15.5 -8.6% 1.9%Cold Preparations 14.3 -2.7% 1.8%Expectorants 12.8 -6.4% 1.6%
Source: IMS Health: MIDAS, MAT September 2003
April 15, 202396
© 2002 IMS Health Incorporated or its affiliates. All rights reserved.
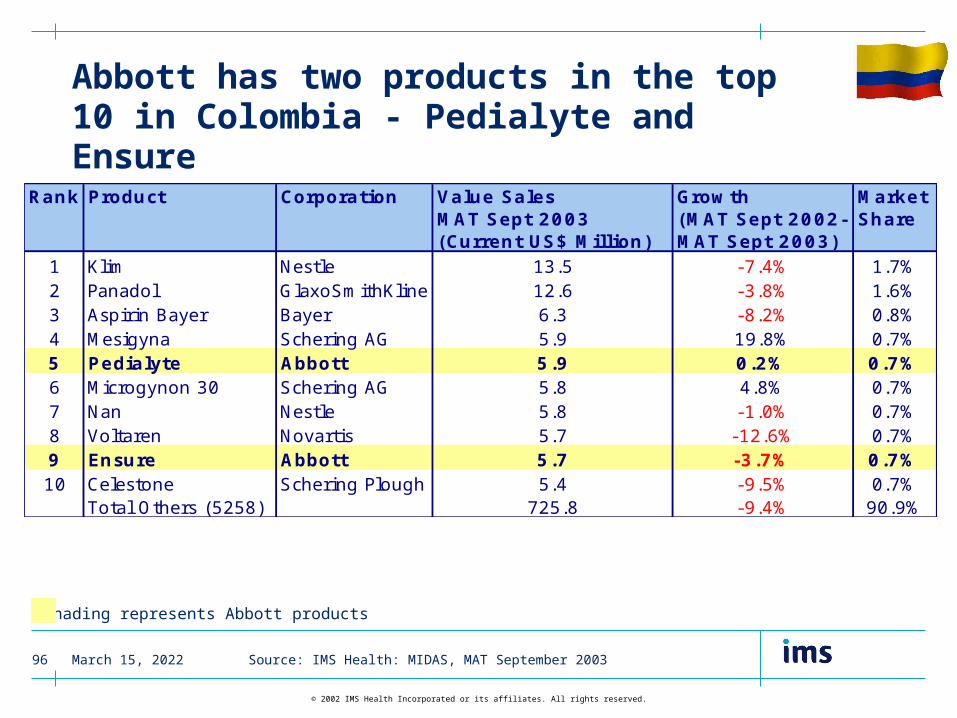
Abbott has two products in the top 10 in Colombia - Pedialyte and Ensure
Shading represents Abbott products
Rank Product Corporation Value Sales MAT Sept 2003 (Current US$ Million)
Growth (MAT Sept 2002-MAT Sept 2003)
Market Share
1 Klim Nestle 13.5 -7.4% 1.7%2 Panadol GlaxoSmithKline 12.6 -3.8% 1.6%3 Aspirin Bayer Bayer 6.3 -8.2% 0.8%4 Mesigyna Schering AG 5.9 19.8% 0.7%5 Pedialyte Abbott 5.9 0.2% 0.7%6 Microgynon 30 Schering AG 5.8 4.8% 0.7%7 Nan Nestle 5.8 -1.0% 0.7%8 Voltaren Novartis 5.7 -12.6% 0.7%9 Ensure Abbott 5.7 -3.7% 0.7%10 Celestone Schering Plough 5.4 -9.5% 0.7%
Total Others (5258) 725.8 -9.4% 90.9%
Source: IMS Health: MIDAS, MAT September 2003
April 15, 202397
© 2002 IMS Health Incorporated or its affiliates. All rights reserved.
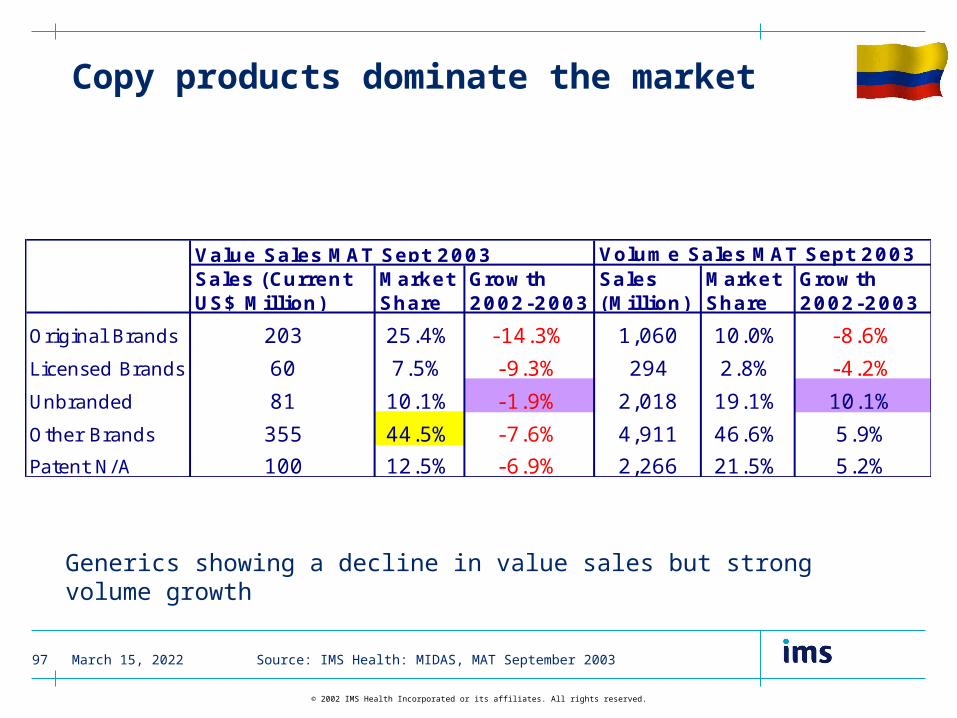
Copy products dominate the market
Generics showing a decline in value sales but strong volume growth
Volume Sales MAT Sept 2003Sales (Current US$ Million)
Market Share
Growth 2002-2003
Sales (Million)
Market Share
Growth 2002-2003
Original Brands 203 25.4% -14.3% 1,060 10.0% -8.6%
Licensed Brands 60 7.5% -9.3% 294 2.8% -4.2%
Unbranded 81 10.1% -1.9% 2,018 19.1% 10.1%
Other Brands 355 44.5% -7.6% 4,911 46.6% 5.9%
Patent N/A 100 12.5% -6.9% 2,266 21.5% 5.2%
Value Sales MAT Sept 2003
Source: IMS Health: MIDAS, MAT September 2003
April 15, 202398
© 2002 IMS Health Incorporated or its affiliates. All rights reserved.
Mexico
April 15, 202399
© 2002 IMS Health Incorporated or its affiliates. All rights reserved.
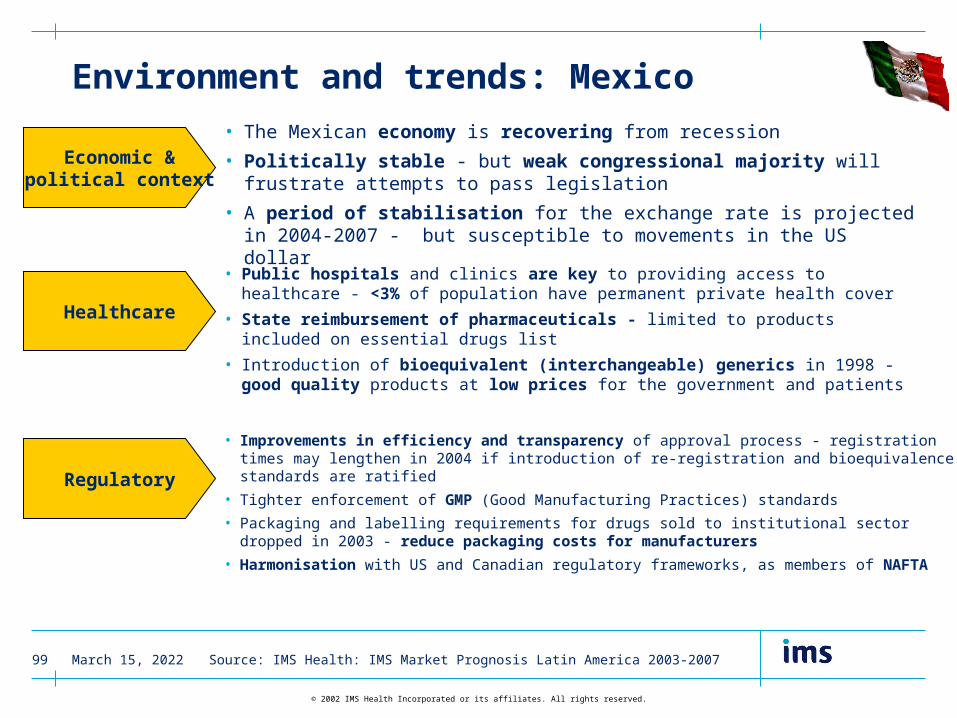
Environment and trends: Mexico
Source: IMS Health: IMS Market Prognosis Latin America 2003-2007
Economic &political context
Healthcare
Regulatory
• The Mexican economy is recovering from recession
• Politically stable - but weak congressional majority will frustrate attempts to pass legislation
• A period of stabilisation for the exchange rate is projected in 2004-2007 - but susceptible to movements in the US dollar
• Public hospitals and clinics are key to providing access to healthcare - <3% of population have permanent private health cover
• State reimbursement of pharmaceuticals - limited to products included on essential drugs list
• Introduction of bioequivalent (interchangeable) generics in 1998 - good quality products at low prices for the government and patients
• Improvements in efficiency and transparency of approval process - registration times may lengthen in 2004 if introduction of re-registration and bioequivalence standards are ratified
• Tighter enforcement of GMP (Good Manufacturing Practices) standards
• Packaging and labelling requirements for drugs sold to institutional sector dropped in 2003 - reduce packaging costs for manufacturers
• Harmonisation with US and Canadian regulatory frameworks, as members of NAFTA
April 15, 2023100
© 2002 IMS Health Incorporated or its affiliates. All rights reserved.
Pharmaceutical business environment
Source: IMS Health: IMS Market Prognosis Latin America 2003-2007
• Mexican pharmaceutical market remains an attractive target for foreign multinationals - despite recent slow-down in volume growth
• Local manufacturers halved over past decade - represent <20% of market in value terms
• Deliveries to retail pharmacies via wholesalers dominates pharmaceutical distribution
• OTC sales affected by recent economic downturn
• Physicians remain major promotional target - detailing visits typically brief and promotional strategies relatively basic
• Discounting remains widespread throughout distribution chain - driven by competition for market share
April 15, 2023101
© 2002 IMS Health Incorporated or its affiliates. All rights reserved.
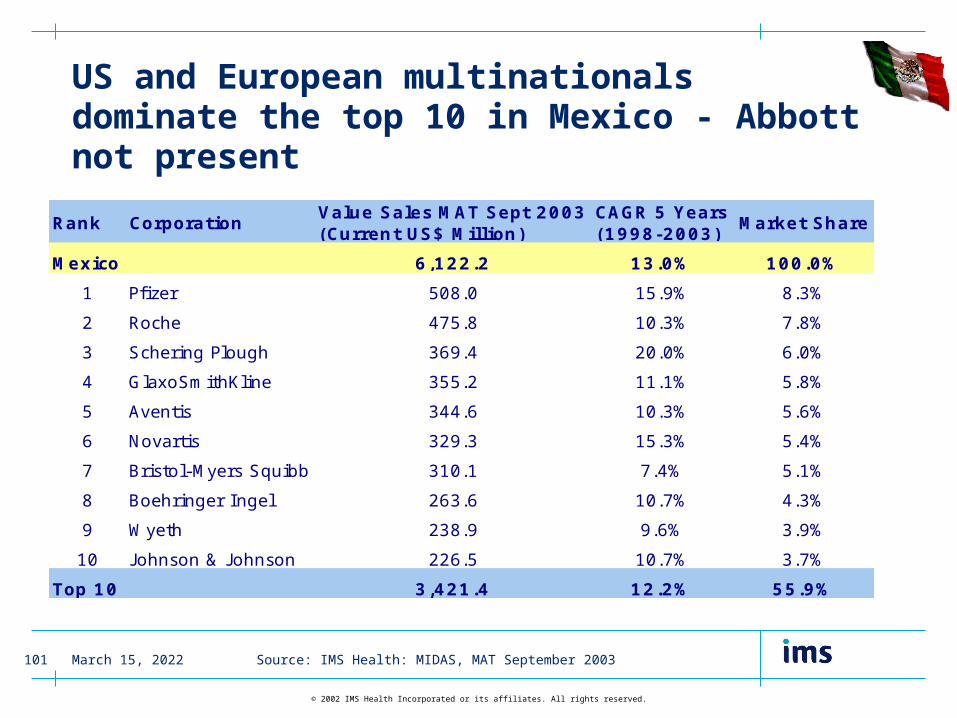
US and European multinationals dominate the top 10 in Mexico - Abbott not present
Rank CorporationValue Sales MAT Sept 2003 (Current US$ Million)
CAGR 5 Years (1998-2003)
Market Share
Mexico 6,122.2 13.0% 100.0%
1 Pfizer 508.0 15.9% 8.3%
2 Roche 475.8 10.3% 7.8%
3 Schering Plough 369.4 20.0% 6.0%
4 GlaxoSmithKline 355.2 11.1% 5.8%
5 Aventis 344.6 10.3% 5.6%
6 Novartis 329.3 15.3% 5.4%
7 Bristol-Myers Squibb 310.1 7.4% 5.1%
8 Boehringer Ingel 263.6 10.7% 4.3%
9 Wyeth 238.9 9.6% 3.9%
10 J ohnson & J ohnson 226.5 10.7% 3.7%
Top 10 3,421.4 12.2% 55.9%
Source: IMS Health: MIDAS, MAT September 2003

April 15, 2023102
© 2002 IMS Health Incorporated or its affiliates. All rights reserved.
Abbott ranked 13th but trails the market in terms of growth
Rank CorporationValue Sales MAT Sept 2003 (Current US$ Million)
CAGR 5 Years (1998-2003)
Market Share
Mexico 6,122.2 13.0% 100.0%
11 Merck & Co 185.6 25.4% 3.0%
12 Bayer 171.8 9.1% 2.8%
13 Abbott 166.5 7.0% 2.7%
14 Altana 160.1 18.2% 2.6%
15 Senosiain 151.5 12.8% 2.5%
16 AstraZeneca 133.4 18.1% 2.2%
17 Merck KGaA 120.6 14.8% 2.0%
18 Sanofi-Synthelabo 117.7 12.6% 1.9%
19 ICN 114.5 11.2% 1.9%
20 Lilly 107.8 20.0% 1.8%
Top 20 4,850.9 12.8% 79.2%
Source: IMS Health: MIDAS, MAT September 2003
Domestic Companies
April 15, 2023103
© 2002 IMS Health Incorporated or its affiliates. All rights reserved.
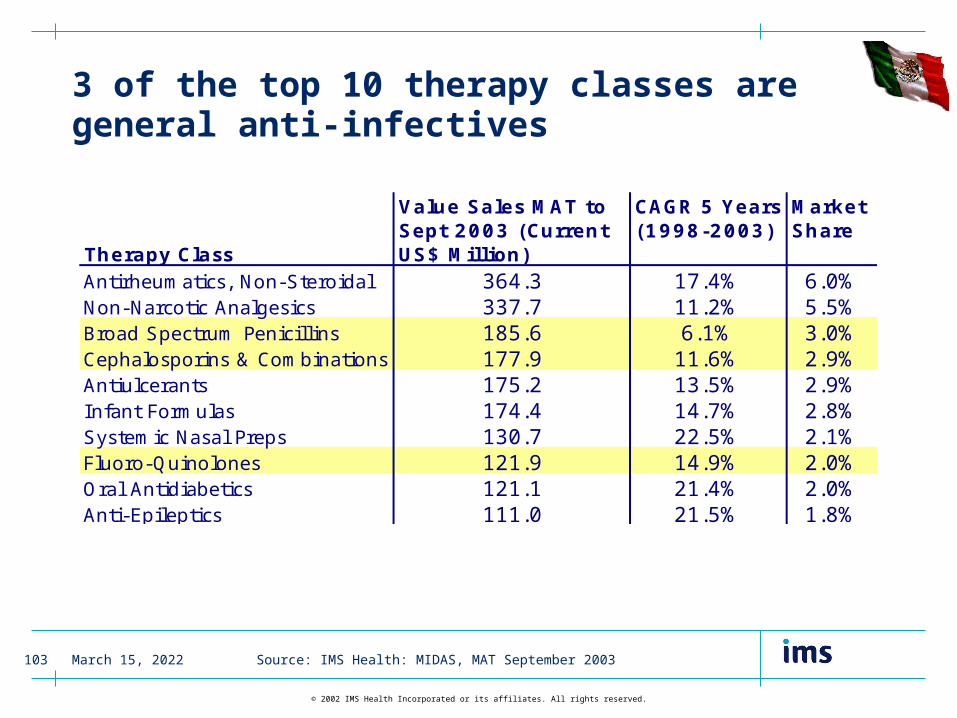
3 of the top 10 therapy classes are general anti-infectives
Therapy Class
Value Sales MAT to Sept 2003 (Current US$ Million)
CAGR 5 Years (1998-2003)
Market Share
Antirheumatics, Non-Steroidal 364.3 17.4% 6.0%Non-Narcotic Analgesics 337.7 11.2% 5.5%Broad Spectrum Penicillins 185.6 6.1% 3.0%Cephalosporins & Combinations 177.9 11.6% 2.9%Antiulcerants 175.2 13.5% 2.9%Infant Formulas 174.4 14.7% 2.8%Systemic Nasal Preps 130.7 22.5% 2.1%Fluoro-Quinolones 121.9 14.9% 2.0%Oral Antidiabetics 121.1 21.4% 2.0%Anti-Epileptics 111.0 21.5% 1.8%
Source: IMS Health: MIDAS, MAT September 2003
April 15, 2023104
© 2002 IMS Health Incorporated or its affiliates. All rights reserved.
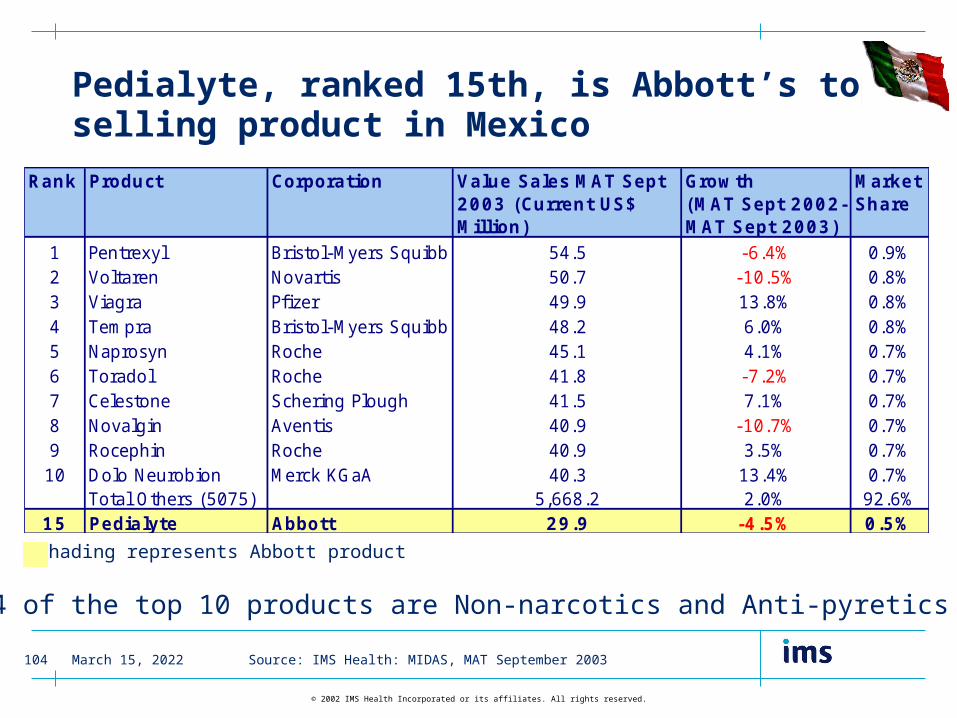
Pedialyte, ranked 15th, is Abbott’s top selling product in Mexico
Shading represents Abbott product
4 of the top 10 products are Non-narcotics and Anti-pyretics
Rank Product Corporation Value Sales MAT Sept 2003 (Current US$ Million)
Growth (MAT Sept 2002-MAT Sept 2003)
Market Share
1 Pentrexyl Bristol-Myers Squibb 54.5 -6.4% 0.9%2 Voltaren Novartis 50.7 -10.5% 0.8%3 Viagra Pfizer 49.9 13.8% 0.8%4 Tempra Bristol-Myers Squibb 48.2 6.0% 0.8%5 Naprosyn Roche 45.1 4.1% 0.7%6 Toradol Roche 41.8 -7.2% 0.7%7 Celestone Schering Plough 41.5 7.1% 0.7%8 Novalgin Aventis 40.9 -10.7% 0.7%9 Rocephin Roche 40.9 3.5% 0.7%10 Dolo Neurobion Merck KGaA 40.3 13.4% 0.7%
Total Others (5075) 5,668.2 2.0% 92.6%15 Pedialyte Abbott 29.9 -4.5% 0.5%
Source: IMS Health: MIDAS, MAT September 2003
April 15, 2023105
© 2002 IMS Health Incorporated or its affiliates. All rights reserved.
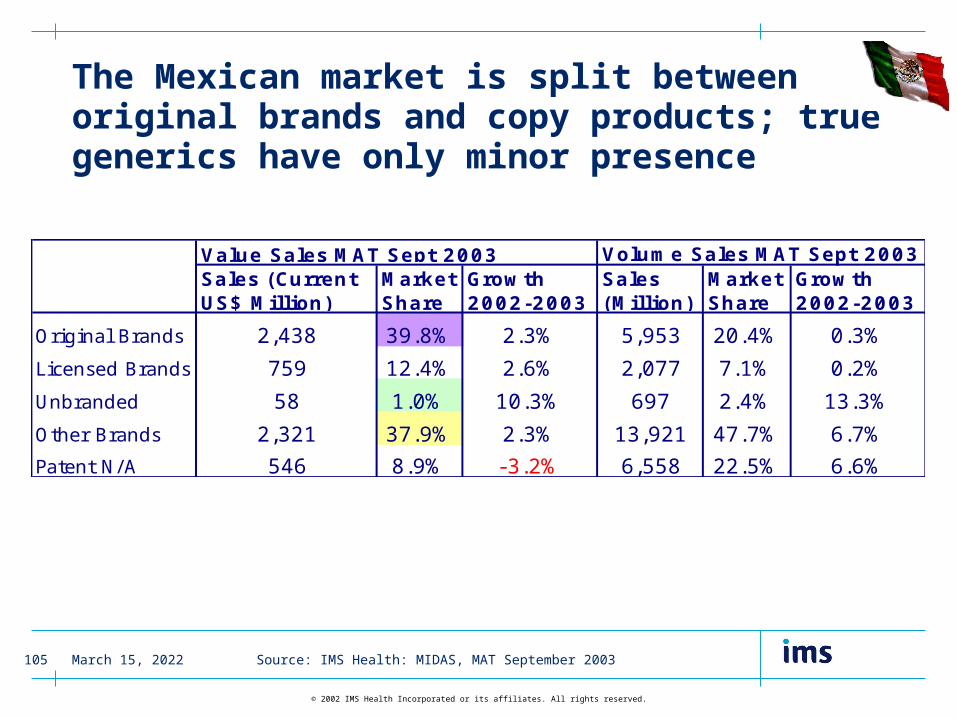
The Mexican market is split between original brands and copy products; true generics have only minor presence
Volume Sales MAT Sept 2003Sales (Current US$ Million)
Market Share
Growth 2002-2003
Sales (Million)
Market Share
Growth 2002-2003
Original Brands 2,438 39.8% 2.3% 5,953 20.4% 0.3%
Licensed Brands 759 12.4% 2.6% 2,077 7.1% 0.2%
Unbranded 58 1.0% 10.3% 697 2.4% 13.3%
Other Brands 2,321 37.9% 2.3% 13,921 47.7% 6.7%
Patent N/A 546 8.9% -3.2% 6,558 22.5% 6.6%
Value Sales MAT Sept 2003
Source: IMS Health: MIDAS, MAT September 2003

April 15, 2023106
© 2002 IMS Health Incorporated or its affiliates. All rights reserved.
Peru
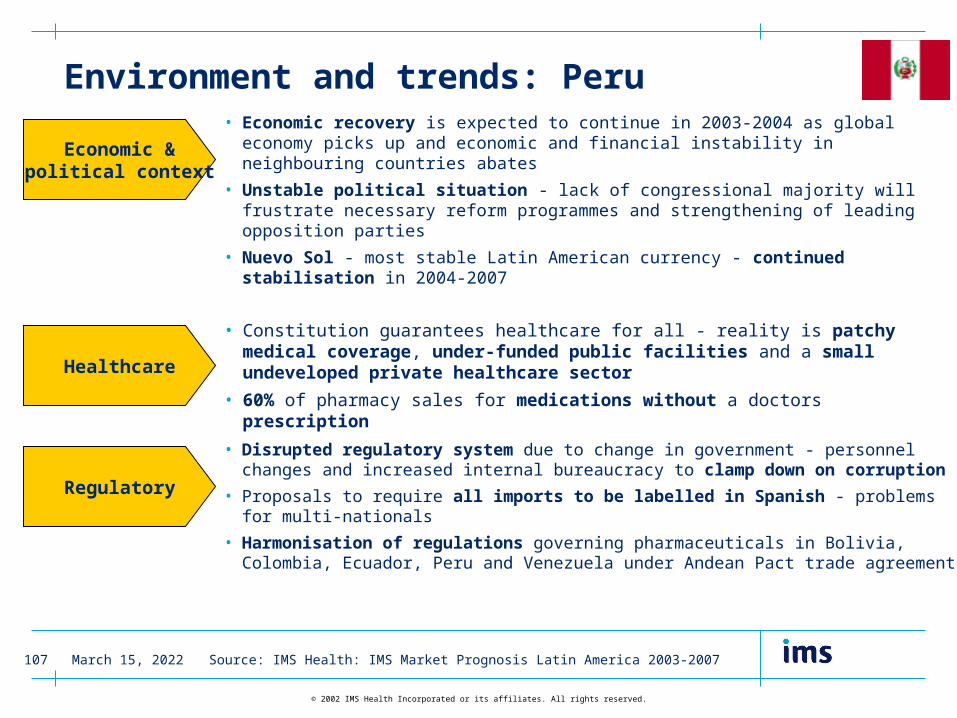
April 15, 2023107
© 2002 IMS Health Incorporated or its affiliates. All rights reserved.
Environment and trends: Peru
Source: IMS Health: IMS Market Prognosis Latin America 2003-2007
Economic &political context
Healthcare
Regulatory
• Economic recovery is expected to continue in 2003-2004 as global economy picks up and economic and financial instability in neighbouring countries abates
• Unstable political situation - lack of congressional majority will frustrate necessary reform programmes and strengthening of leading opposition parties
• Nuevo Sol - most stable Latin American currency - continued stabilisation in 2004-2007
• Constitution guarantees healthcare for all - reality is patchy medical coverage, under-funded public facilities and a small undeveloped private healthcare sector
• 60% of pharmacy sales for medications without a doctors prescription
• Disrupted regulatory system due to change in government - personnel changes and increased internal bureaucracy to clamp down on corruption
• Proposals to require all imports to be labelled in Spanish - problems for multi-nationals
• Harmonisation of regulations governing pharmaceuticals in Bolivia, Colombia, Ecuador, Peru and Venezuela under Andean Pact trade agreement

April 15, 2023108
© 2002 IMS Health Incorporated or its affiliates. All rights reserved.
Pharmaceutical business environment
Source: IMS Health: IMS Market Prognosis Latin America 2003-2007
• Stable operating climate for pharmaceutical companies
• Generics companies will benefit from cost-containment measures - but concerns over generic quality mar reputation
• Increasing competition among generic manufacturers is driving overall market prices down
• Preferential bidding conditions in institutional sector for local producers - multinationals complain of discrimination
• Discounting - growing strength of pharmacy chains puts pressure on manufacturers to cut prices - trend to intensify
• Marketing and advertising loosely regulated

April 15, 2023109
© 2002 IMS Health Incorporated or its affiliates. All rights reserved.
Abbott, ranked 10th, considerably out-performs the market in terms of growth
Rank CorporationValue Sales MAT Sept 2003 (Current US$ Million)
CAGR 5 Years (1998-2003)
Market Share
Peru 284.1 1.1% 100.0%
1 Bristol-Myers Squibb 25.4 -1.3% 8.9%
2 Pfizer 19.1 -4.4% 6.7%
3 Farmindustria 15.0 3.5% 5.3%
4 Roche 14.2 0.0% 5.0%
5 GlaxoSmithKline 12.3 -1.8% 4.3%
6 Medifarma 8.8 -4.1% 3.1%
7 Novartis 8.1 -7.0% 2.9%
8 Merck & Co 8.1 9.4% 2.9%
9 Aventis 7.7 -8.2% 2.7%
10 Abbott 7.3 2.6% 2.6%
Top 10 125.9 -1.6% 44.3%
Source: IMS Health: MIDAS, MAT September 2003
Domestic Companies
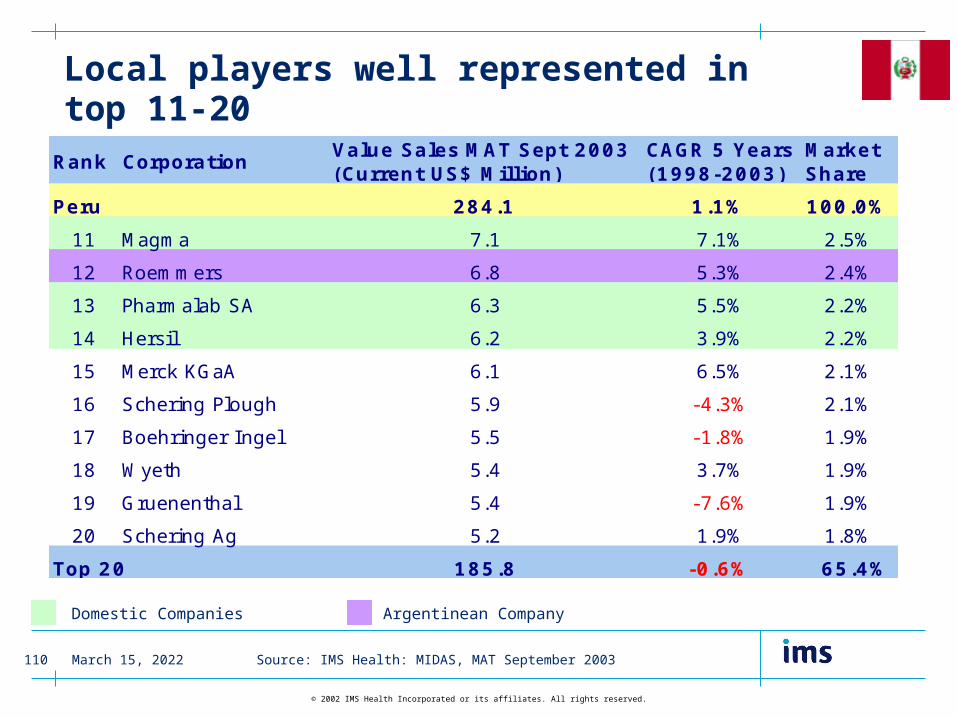
April 15, 2023110
© 2002 IMS Health Incorporated or its affiliates. All rights reserved.
Local players well represented in top 11-20
Rank CorporationValue Sales MAT Sept 2003 (Current US$ Million)
CAGR 5 Years (1998-2003)
Market Share
Peru 284.1 1.1% 100.0%
11 Magma 7.1 7.1% 2.5%
12 Roemmers 6.8 5.3% 2.4%
13 Pharmalab SA 6.3 5.5% 2.2%
14 Hersil 6.2 3.9% 2.2%
15 Merck KGaA 6.1 6.5% 2.1%
16 Schering Plough 5.9 -4.3% 2.1%
17 Boehringer Ingel 5.5 -1.8% 1.9%
18 Wyeth 5.4 3.7% 1.9%
19 Gruenenthal 5.4 -7.6% 1.9%
20 Schering Ag 5.2 1.9% 1.8%
Top 20 185.8 -0.6% 65.4%
Source: IMS Health: MIDAS, MAT September 2003
Domestic Companies Argentinean Company

April 15, 2023111
© 2002 IMS Health Incorporated or its affiliates. All rights reserved.
Anti-rheumatics by far the biggest therapy class; infant formulas showing double-digit growth
Therapy Class
Value Sales MAT to Sept 2003 (Current US$ Million)
CAGR 5 Years (1998-2003)
Market Share
Antirheumatics, Non-Steroidal 21.8 4.3% 7.7%Infant Formulas 9.8 19.7% 3.4%Non-Narcotic Analgesics 8.8 -1.6% 3.1%Cough/Cold Preparations with Anti- Infectives 7.1 0.2% 2.5%Broad Spectrum Penicillins 6.6 -7.7% 2.3%Cold Preparations without Anti- Infectives 5.5 4.2% 1.9%Macrolides & similar types 5.2 -3.4% 1.8%Topical Corticosteroid Combinations 4.8 2.6% 1.7%Cephalosporins & Combinations 4.7 -5.8% 1.7%Antiulcerants 4.7 0.8% 1.6%
Source: IMS Health: MIDAS, MAT September 2003

April 15, 2023112
© 2002 IMS Health Incorporated or its affiliates. All rights reserved.
Abbott’s leading product in Peru is Ensure, growing at 22% last years
Shading represents Abbott product
Bristol-Myers-Squibb’s antirheumatic, Dolocordralan, remained the best-selling product despite a value sales decline of 2.9% reversing a period of robust growth in the previous two years
Rank Product Corporation Value Sales MAT Sept 2003 (Current US$ Million)
Growth (MAT Sept 2002-MAT Sept 2003)
Market Share
1 Dolo Cordralan Bristol-Myers Squibb 3.8 -7.1% 1.3%2 Naprosyn Roche 3.3 19.4% 1.2%3 Bactrim Roche 2.1 21.1% 0.7%4 Notil Bristol-Myers Squibb 1.8 5.9% 0.6%5 Nan Nestle 1.7 -5.3% 0.6%6 Megacillin Gruenenthal 1.6 13.3% 0.6%7 Hepabionta Merck KGaA 1.6 2.2% 0.6%8 Vioxx Merck & Co 1.6 -6.3% 0.6%9 Enfamil Bristol-Myers Squibb 1.5 109.3% 0.5%10 Xenical Roche 1.3 -18.3% 0.5%
Total Others (4760) 263.7 0.2% 92.8%15 Ensure Abbott 1217.0 22.1% 0.4%
Source: IMS Health: MIDAS, MAT September 2003

April 15, 2023113
© 2002 IMS Health Incorporated or its affiliates. All rights reserved.
Copy products account for half of the market in Peru
Volume Sales MAT Sept 2003Sales (Current US$ Million)
Market Share
Growth 2002-2003
Sales (Million)
Market Share
Growth 2002-2003
Original Brands 68 23.9% -3.1% 234 11.6% -4.5%
Licensed Brands 18 6.5% 0.5% 58 2.9% -0.7%
Unbranded 19 6.9% -3.0% 385 19.1% 14.5%
Other Brands 147 51.8% 2.2% 1,048 52.1% -4.8%
Patent N/A 31 10.9% 4.2% 287 14.2% -2.1%
Value Sales MAT Sept 2003
Source: IMS Health: MIDAS, MAT September 2003
April 15, 2023114
© 2002 IMS Health Incorporated or its affiliates. All rights reserved.
Venezuela
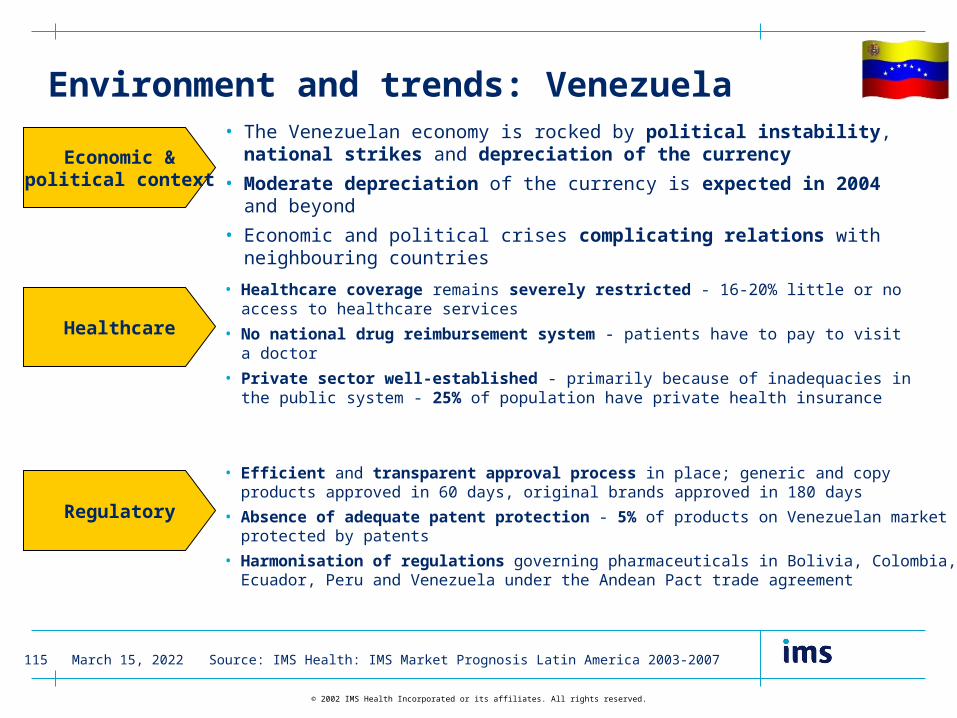
April 15, 2023115
© 2002 IMS Health Incorporated or its affiliates. All rights reserved.
Environment and trends: Venezuela
Source: IMS Health: IMS Market Prognosis Latin America 2003-2007
Economic &political context
Healthcare
Regulatory
• The Venezuelan economy is rocked by political instability, national strikes and depreciation of the currency
• Moderate depreciation of the currency is expected in 2004 and beyond
• Economic and political crises complicating relations with neighbouring countries
• Healthcare coverage remains severely restricted - 16-20% little or no access to healthcare services
• No national drug reimbursement system - patients have to pay to visit a doctor
• Private sector well-established - primarily because of inadequacies in the public system - 25% of population have private health insurance
• Efficient and transparent approval process in place; generic and copy products approved in 60 days, original brands approved in 180 days
• Absence of adequate patent protection - 5% of products on Venezuelan market protected by patents
• Harmonisation of regulations governing pharmaceuticals in Bolivia, Colombia, Ecuador, Peru and Venezuela under the Andean Pact trade agreement

April 15, 2023116
© 2002 IMS Health Incorporated or its affiliates. All rights reserved.
Pharmaceutical business environment
Source: IMS Health: IMS Market Prognosis Latin America 2003-2007
• Pharmaceutical companies have seen sharp falls in volume and value sales - economic recession and devaluation of the bolivar
• New law states any imported medicine with copies in Venezuela subject to VAT at 16%
• Few multinationals have manufacturing bases in Venezuela - others have established plants in neighbouring countries - greater social and political stability
• Doctors prefer to prescribe by brand - lack of confidence in generics quality
• Wholesalers maintain important role in distribution of pharmaceuticals
• OTC market hardest hit by depressed economy - non-essential status of OTC products - strong growth in sales of natural products
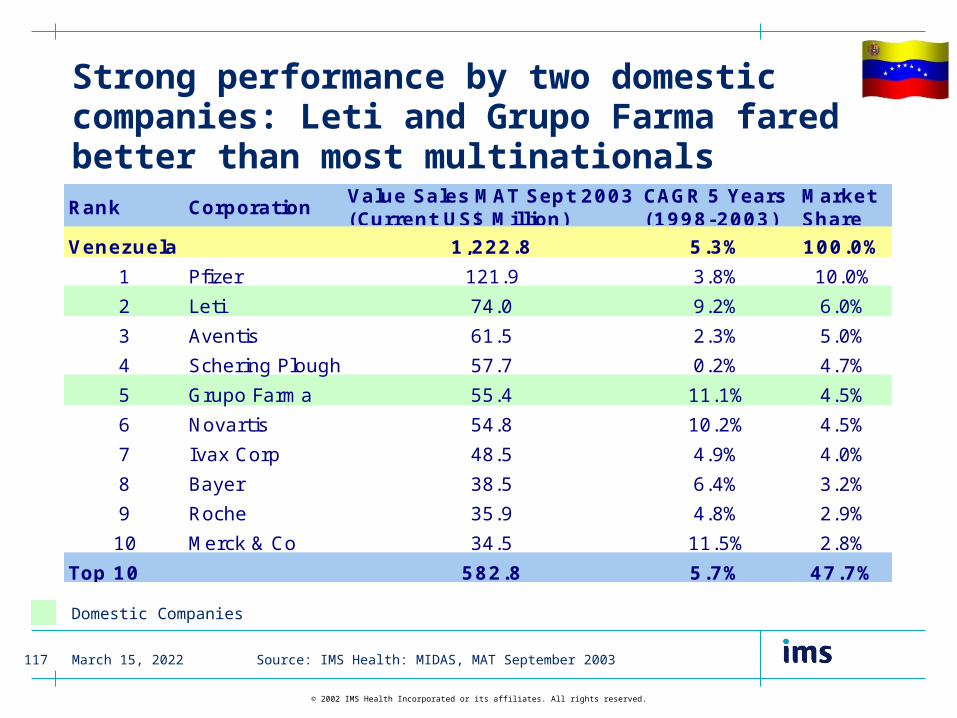
April 15, 2023117
© 2002 IMS Health Incorporated or its affiliates. All rights reserved.
Strong performance by two domestic companies: Leti and Grupo Farma fared better than most multinationalsRank Corporation
Value Sales MAT Sept 2003 (Current US$ Million)
CAGR 5 Years (1998-2003)
Market Share
Venezuela 1,222.8 5.3% 100.0%
1 Pfizer 121.9 3.8% 10.0%
2 Leti 74.0 9.2% 6.0%
3 Aventis 61.5 2.3% 5.0%
4 Schering Plough 57.7 0.2% 4.7%
5 Grupo Farma 55.4 11.1% 4.5%
6 Novartis 54.8 10.2% 4.5%
7 Ivax Corp 48.5 4.9% 4.0%
8 Bayer 38.5 6.4% 3.2%
9 Roche 35.9 4.8% 2.9%
10 Merck & Co 34.5 11.5% 2.8%
Top 10 582.8 5.7% 47.7%
Source: IMS Health: MIDAS, MAT September 2003
Domestic Companies
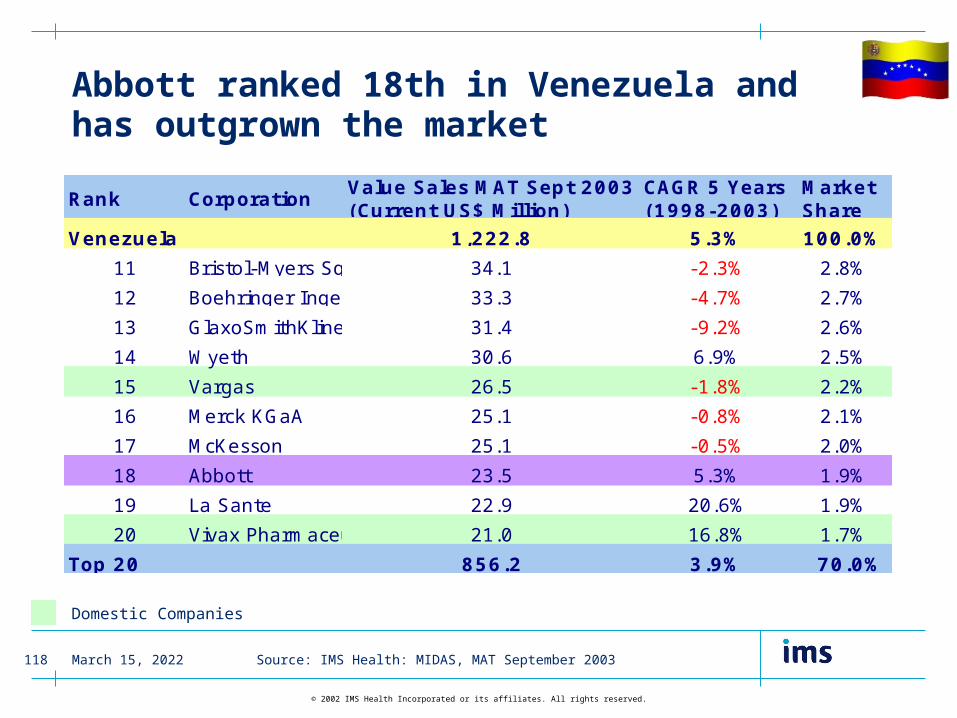
April 15, 2023118
© 2002 IMS Health Incorporated or its affiliates. All rights reserved.
Abbott ranked 18th in Venezuela and has outgrown the market
Rank CorporationValue Sales MAT Sept 2003 (Current US$ Million)
CAGR 5 Years (1998-2003)
Market Share
Venezuela 1,222.8 5.3% 100.0%
11 Bristol-Myers Squibb 34.1 -2.3% 2.8%
12 Boehringer Ingel 33.3 -4.7% 2.7%
13 GlaxoSmithKline 31.4 -9.2% 2.6%
14 Wyeth 30.6 6.9% 2.5%
15 Vargas 26.5 -1.8% 2.2%
16 Merck KGaA 25.1 -0.8% 2.1%
17 McKesson 25.1 -0.5% 2.0%
18 Abbott 23.5 5.3% 1.9%
19 La Sante 22.9 20.6% 1.9%
20 Vivax Pharmaceutic 21.0 16.8% 1.7%
Top 20 856.2 3.9% 70.0%
Source: IMS Health: MIDAS, MAT September 2003
Domestic Companies
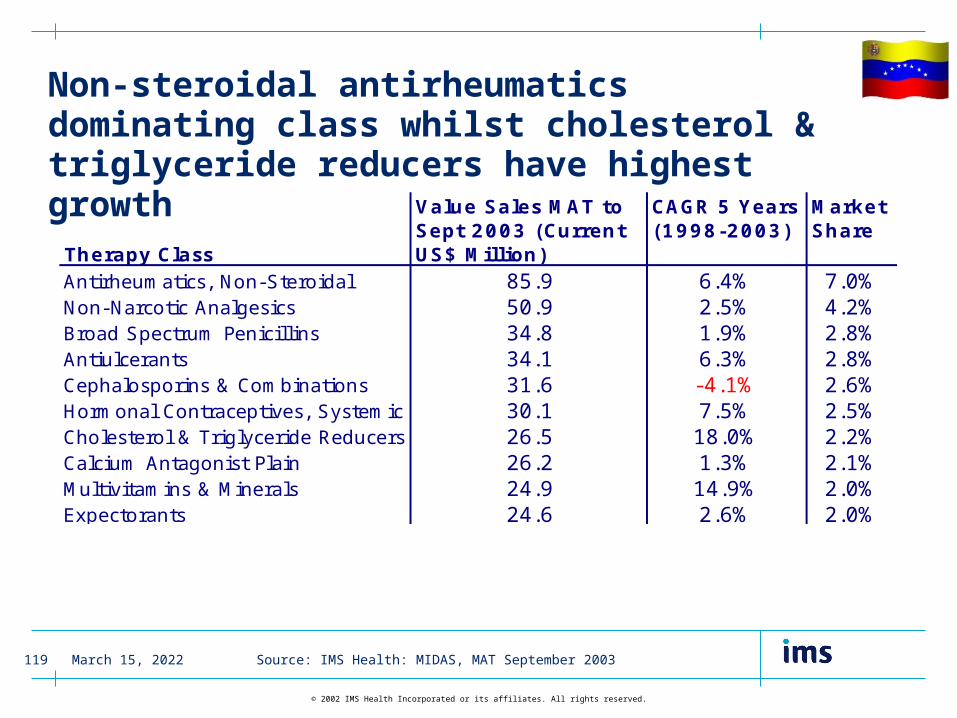
April 15, 2023119
© 2002 IMS Health Incorporated or its affiliates. All rights reserved.
Non-steroidal antirheumatics dominating class whilst cholesterol & triglyceride reducers have highest growth
Therapy Class
Value Sales MAT to Sept 2003 (Current US$ Million)
CAGR 5 Years (1998-2003)
Market Share
Antirheumatics, Non-Steroidal 85.9 6.4% 7.0%Non-Narcotic Analgesics 50.9 2.5% 4.2%Broad Spectrum Penicillins 34.8 1.9% 2.8%Antiulcerants 34.1 6.3% 2.8%Cephalosporins & Combinations 31.6 -4.1% 2.6%Hormonal Contraceptives, Systemic 30.1 7.5% 2.5%Cholesterol & Triglyceride Reducers 26.5 18.0% 2.2%Calcium Antagonist Plain 26.2 1.3% 2.1%Multivitamins & Minerals 24.9 14.9% 2.0%Expectorants 24.6 2.6% 2.0%
Source: IMS Health: MIDAS, MAT September 2003
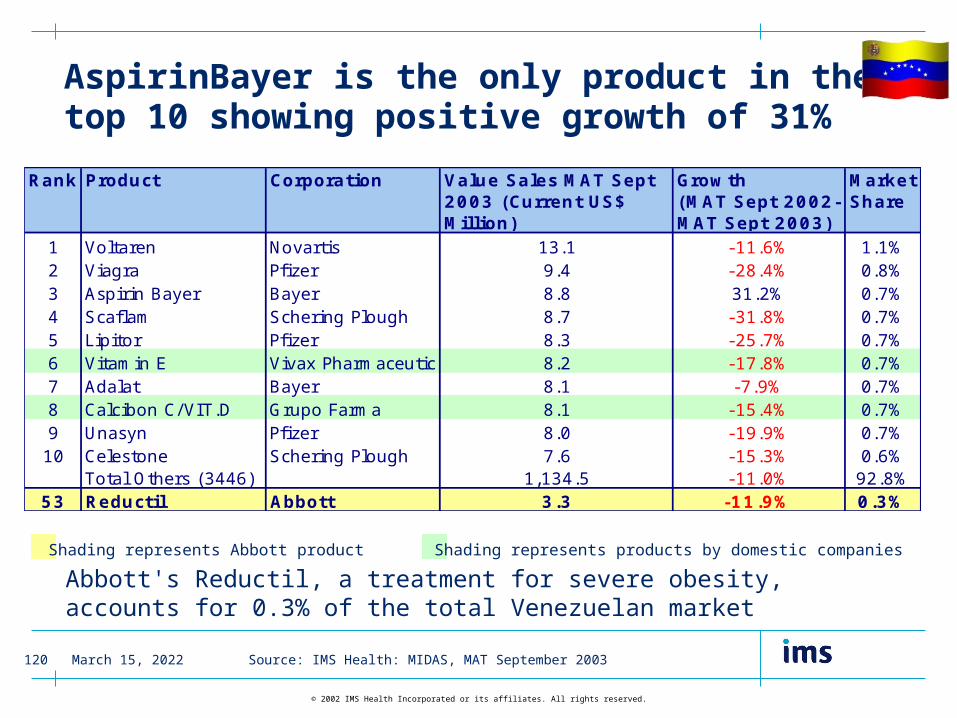
April 15, 2023120
© 2002 IMS Health Incorporated or its affiliates. All rights reserved.
AspirinBayer is the only product in the top 10 showing positive growth of 31%
Abbott's Reductil, a treatment for severe obesity, accounts for 0.3% of the total Venezuelan market
Rank Product Corporation Value Sales MAT Sept 2003 (Current US$ Million)
Growth (MAT Sept 2002-MAT Sept 2003)
Market Share
1 Voltaren Novartis 13.1 -11.6% 1.1%2 Viagra Pfizer 9.4 -28.4% 0.8%3 Aspirin Bayer Bayer 8.8 31.2% 0.7%4 Scaflam Schering Plough 8.7 -31.8% 0.7%5 Lipitor Pfizer 8.3 -25.7% 0.7%6 Vitamin E Vivax Pharmaceutic 8.2 -17.8% 0.7%7 Adalat Bayer 8.1 -7.9% 0.7%8 Calcibon C/VIT.D Grupo Farma 8.1 -15.4% 0.7%9 Unasyn Pfizer 8.0 -19.9% 0.7%10 Celestone Schering Plough 7.6 -15.3% 0.6%
Total Others (3446) 1,134.5 -11.0% 92.8%53 Reductil Abbott 3.3 -11.9% 0.3%
Shading represents Abbott product
Source: IMS Health: MIDAS, MAT September 2003
Shading represents products by domestic companies
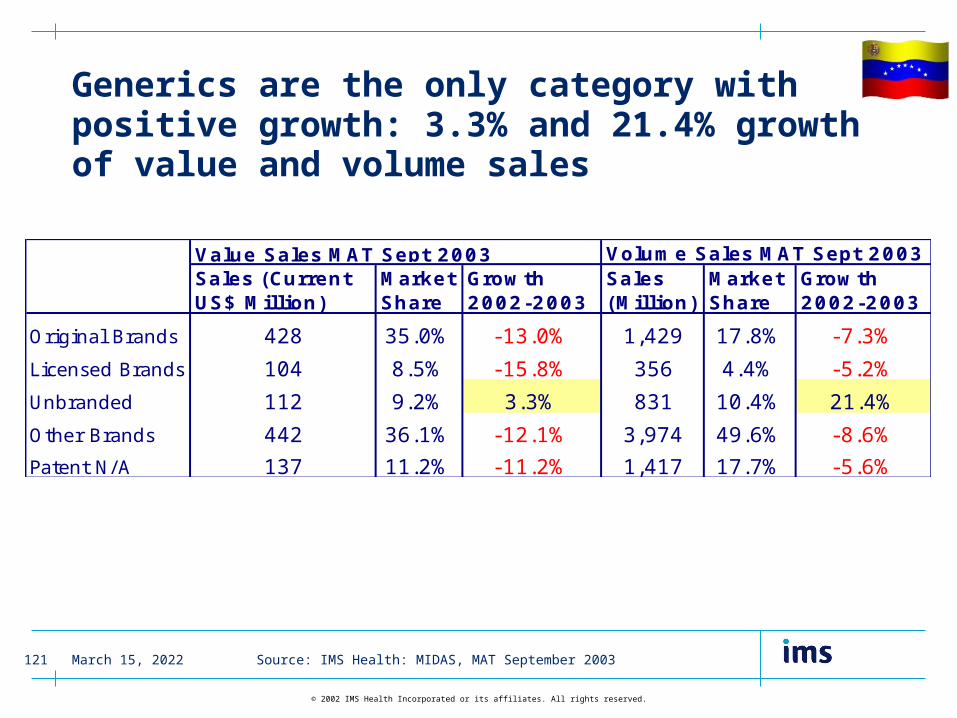
April 15, 2023121
© 2002 IMS Health Incorporated or its affiliates. All rights reserved.
Generics are the only category with positive growth: 3.3% and 21.4% growth of value and volume sales
Volume Sales MAT Sept 2003Sales (Current US$ Million)
Market Share
Growth 2002-2003
Sales (Million)
Market Share
Growth 2002-2003
Original Brands 428 35.0% -13.0% 1,429 17.8% -7.3%
Licensed Brands 104 8.5% -15.8% 356 4.4% -5.2%
Unbranded 112 9.2% 3.3% 831 10.4% 21.4%
Other Brands 442 36.1% -12.1% 3,974 49.6% -8.6%
Patent N/A 137 11.2% -11.2% 1,417 17.7% -5.6%
Value Sales MAT Sept 2003
Source: IMS Health: MIDAS, MAT September 2003
April 15, 2023122
© 2002 IMS Health Incorporated or its affiliates. All rights reserved.
Central America• Costa Rica
• El Salvador
• Guatemala
• Honduras
• Nicaragua
• Panama
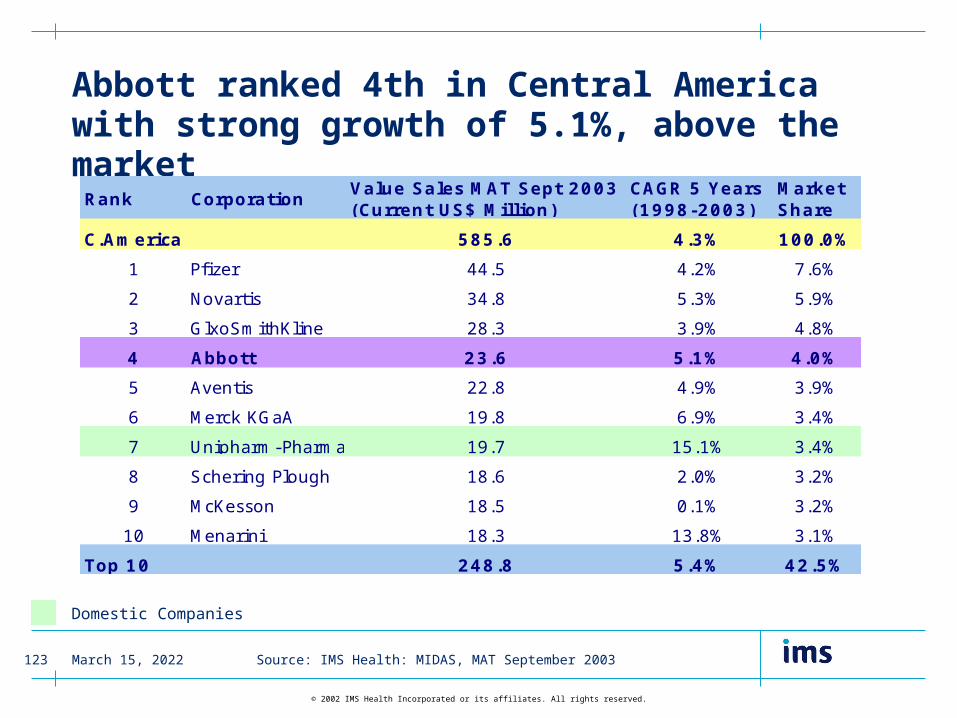
April 15, 2023123
© 2002 IMS Health Incorporated or its affiliates. All rights reserved.
Abbott ranked 4th in Central America with strong growth of 5.1%, above the market
Rank CorporationValue Sales MAT Sept 2003 (Current US$ Million)
CAGR 5 Years (1998-2003)
Market Share
C.America 585.6 4.3% 100.0%
1 Pfizer 44.5 4.2% 7.6%
2 Novartis 34.8 5.3% 5.9%
3 GlxoSmithKline 28.3 3.9% 4.8%
4 Abbott 23.6 5.1% 4.0%
5 Aventis 22.8 4.9% 3.9%
6 Merck KGaA 19.8 6.9% 3.4%
7 Unipharm-Pharmanov 19.7 15.1% 3.4%
8 Schering Plough 18.6 2.0% 3.2%
9 McKesson 18.5 0.1% 3.2%
10 Menarini 18.3 13.8% 3.1%
Top 10 248.8 5.4% 42.5%
Source: IMS Health: MIDAS, MAT September 2003
Domestic Companies
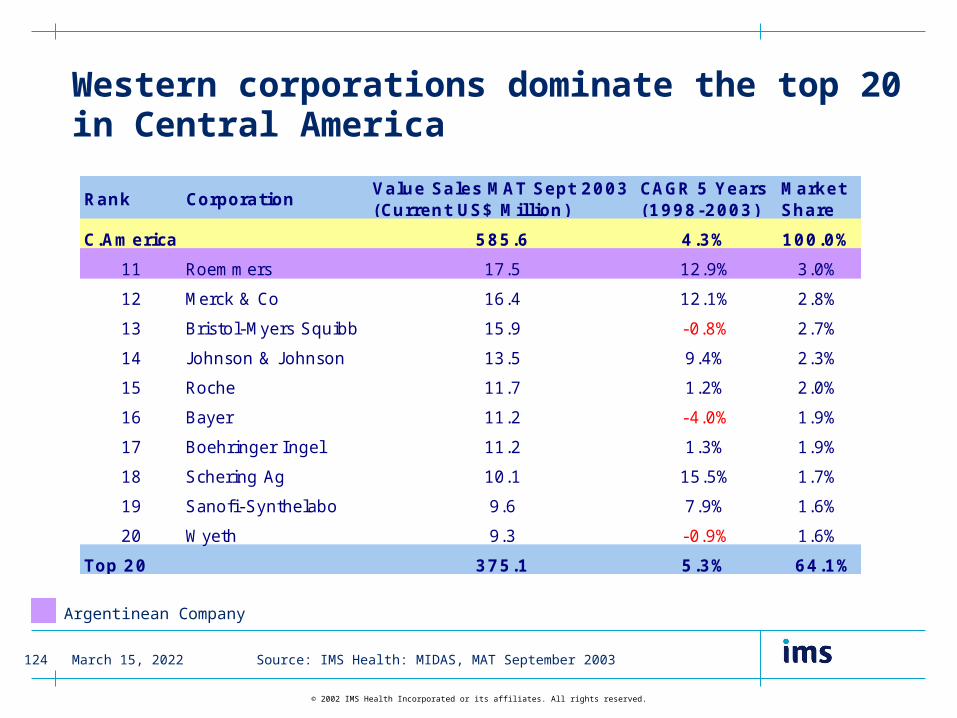
April 15, 2023124
© 2002 IMS Health Incorporated or its affiliates. All rights reserved.
Western corporations dominate the top 20 in Central America
Rank CorporationValue Sales MAT Sept 2003 (Current US$ Million)
CAGR 5 Years (1998-2003)
Market Share
C.America 585.6 4.3% 100.0%
11 Roemmers 17.5 12.9% 3.0%
12 Merck & Co 16.4 12.1% 2.8%
13 Bristol-Myers Squibb 15.9 -0.8% 2.7%
14 J ohnson & J ohnson 13.5 9.4% 2.3%
15 Roche 11.7 1.2% 2.0%
16 Bayer 11.2 -4.0% 1.9%
17 Boehringer Ingel 11.2 1.3% 1.9%
18 Schering Ag 10.1 15.5% 1.7%
19 Sanofi-Synthelabo 9.6 7.9% 1.6%
20 Wyeth 9.3 -0.9% 1.6%
Top 20 375.1 5.3% 64.1%
Source: IMS Health: MIDAS, MAT September 2003
Argentinean Company

April 15, 2023125
© 2002 IMS Health Incorporated or its affiliates. All rights reserved.
Antibiotics dominate the top 10 therapy classes in Central America
Therapy Class
Value Sales MAT to Sept 2003 (Current US$ Million)
CAGR 5 Years (1998-2003)
Market Share
Antirheumatic Non-Steroidal 36.1 6.1% 6.2%Non-Narcotic Analgesics 22.8 5.6% 3.9%Antiulcerants 18.6 7.5% 3.2%Infant Formulas 15.0 10.2% 2.6%Cephalosporins & Combinations 13.8 1.4% 2.4%Broad Spectrum Penicillins 12.9 1.0% 2.2%Macrolides & Similar types 12.6 2.3% 2.1%Fluoro-Quinolones 11.0 6.1% 1.9%Hormonal Contraceptives, Systemic 10.3 6.9% 1.8%Multivitamins & Minerals 10.0 0.9% 1.7%
Source: IMS Health: MIDAS, MAT September 2003
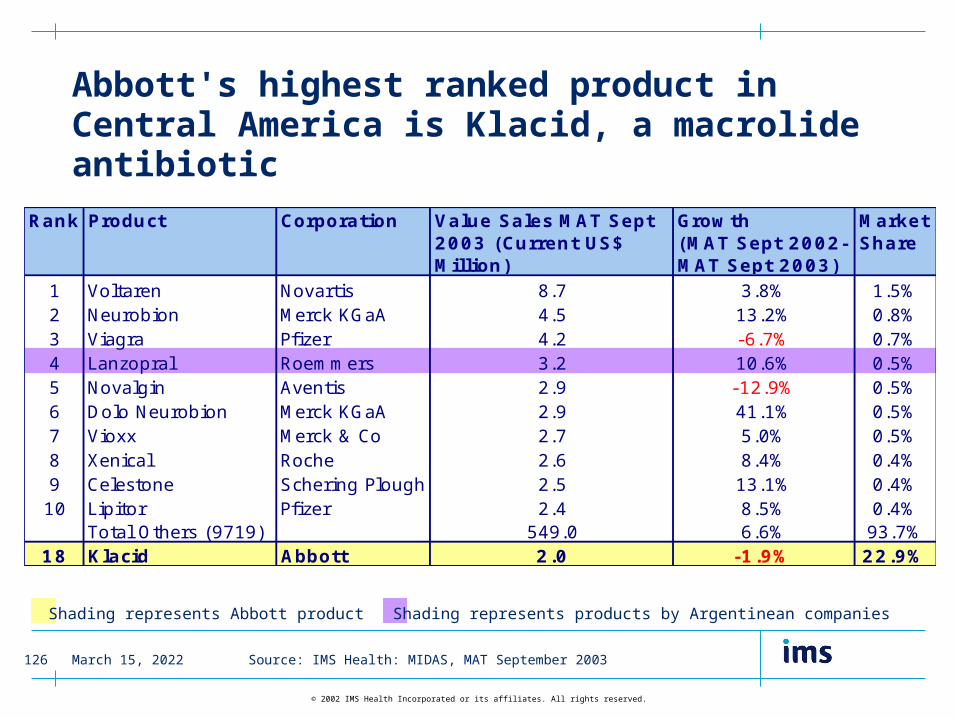
April 15, 2023126
© 2002 IMS Health Incorporated or its affiliates. All rights reserved.
Abbott's highest ranked product in Central America is Klacid, a macrolide antibiotic
Shading represents Abbott product
Rank Product Corporation Value Sales MAT Sept 2003 (Current US$ Million)
Growth (MAT Sept 2002-MAT Sept 2003)
Market Share
1 Voltaren Novartis 8.7 3.8% 1.5%2 Neurobion Merck KGaA 4.5 13.2% 0.8%3 Viagra Pfizer 4.2 -6.7% 0.7%4 Lanzopral Roemmers 3.2 10.6% 0.5%5 Novalgin Aventis 2.9 -12.9% 0.5%6 Dolo Neurobion Merck KGaA 2.9 41.1% 0.5%7 Vioxx Merck & Co 2.7 5.0% 0.5%8 Xenical Roche 2.6 8.4% 0.4%9 Celestone Schering Plough 2.5 13.1% 0.4%10 Lipitor Pfizer 2.4 8.5% 0.4%
Total Others (9719) 549.0 6.6% 93.7%18 Klacid Abbott 2.0 -1.9% 22.9%
Shading represents products by Argentinean companies
Source: IMS Health: MIDAS, MAT September 2003

April 15, 2023127
© 2002 IMS Health Incorporated or its affiliates. All rights reserved.
Copy products also dominant in Central America while Generics grow fastest
Volume Sales MAT Sept 2003Sales (Current US$ Million)
Market Share
Growth 2002-2003
Sales (Million)
Market Share
Growth 2002-2003
Original Brands 173 29.6% 8.3% 603 15.6% 11.8%
Licensed Brands 51 8.7% 8.8% 104 2.7% -3.5%
Unbranded 38 6.5% 14.2% 352 9.1% 20.2%
Other Brands 260 44.3% 4.4% 1,834 47.4% 0.6%
Patent N/A 64 10.8% 4.3% 976 25.2% -2.8%
Value Sales MAT Sept 2003
Source: IMS Health: MIDAS, MAT September 2003
April 15, 2023128
© 2002 IMS Health Incorporated or its affiliates. All rights reserved.
Ecuador
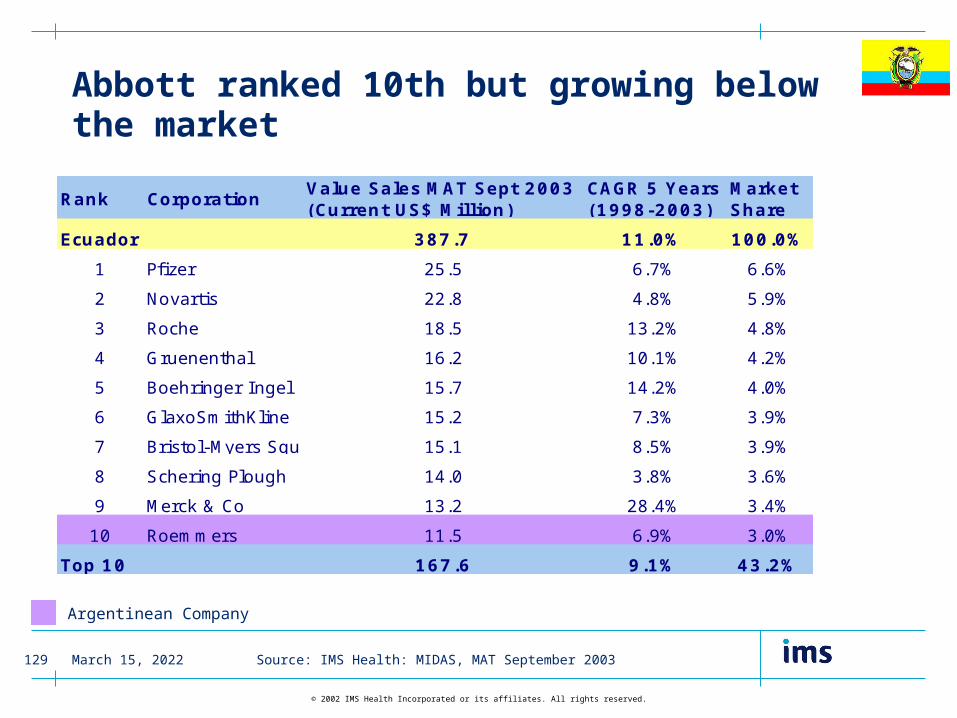
April 15, 2023129
© 2002 IMS Health Incorporated or its affiliates. All rights reserved.
Abbott ranked 10th but growing below the market
Rank CorporationValue Sales MAT Sept 2003 (Current US$ Million)
CAGR 5 Years (1998-2003)
Market Share
Ecuador 387.7 11.0% 100.0%
1 Pfizer 25.5 6.7% 6.6%
2 Novartis 22.8 4.8% 5.9%
3 Roche 18.5 13.2% 4.8%
4 Gruenenthal 16.2 10.1% 4.2%
5 Boehringer Ingel 15.7 14.2% 4.0%
6 GlaxoSmithKline 15.2 7.3% 3.9%
7 Bristol-Myers Squibb 15.1 8.5% 3.9%
8 Schering Plough 14.0 3.8% 3.6%
9 Merck & Co 13.2 28.4% 3.4%
10 Roemmers 11.5 6.9% 3.0%
Top 10 167.6 9.1% 43.2%
Source: IMS Health: MIDAS, MAT September 2003
Argentinean Company
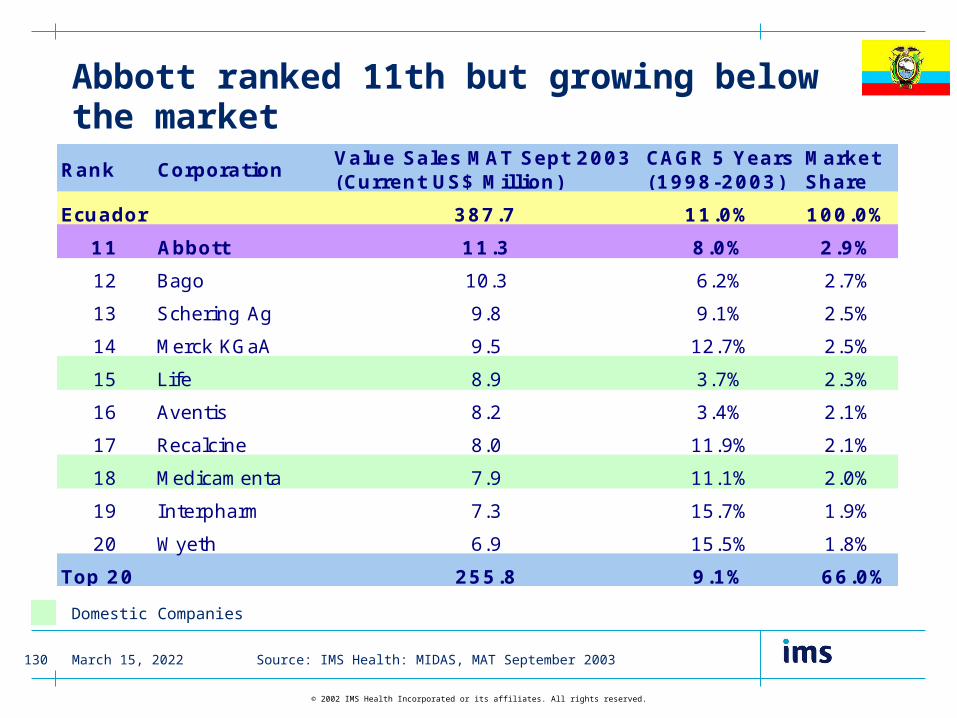
April 15, 2023130
© 2002 IMS Health Incorporated or its affiliates. All rights reserved.
Rank CorporationValue Sales MAT Sept 2003 (Current US$ Million)
CAGR 5 Years (1998-2003)
Market Share
Ecuador 387.7 11.0% 100.0%
11 Abbott 11.3 8.0% 2.9%
12 Bago 10.3 6.2% 2.7%
13 Schering Ag 9.8 9.1% 2.5%
14 Merck KGaA 9.5 12.7% 2.5%
15 Life 8.9 3.7% 2.3%
16 Aventis 8.2 3.4% 2.1%
17 Recalcine 8.0 11.9% 2.1%
18 Medicamenta 7.9 11.1% 2.0%
19 Interpharm 7.3 15.7% 1.9%
20 Wyeth 6.9 15.5% 1.8%
Top 20 255.8 9.1% 66.0%
Abbott ranked 11th but growing below the market
Source: IMS Health: MIDAS, MAT September 2003
Domestic Companies

April 15, 2023131
© 2002 IMS Health Incorporated or its affiliates. All rights reserved.
Infant formulas fastest growing class: 28% over past 5 years
Therapy Class
Value Sales MAT to Sept 2003 (Current US$ Million)
CAGR 5 Years (1998-2003)
Market Share
Antirheumatics, Non-Steroidal 35.6 11.0% 9.2%Broad Spectrum Penicillins 13.7 6.4% 3.5%Non-Narcotic Analgesics 12.9 11.1% 3.3%Multivitamins + Minerals 12.3 14.6% 3.2%Infant Formulas 12.1 28.0% 3.1%Expectorants 8.5 11.2% 2.2%Antiulcerants 8.4 12.1% 2.2%Macrolides & Similar Types 8.1 10.4% 2.1%Cephalosporins & Combinations 8.1 7.1% 2.1%Trichomonacides 7.8 7.6% 2.0%
Source: IMS Health: MIDAS, MAT September 2003
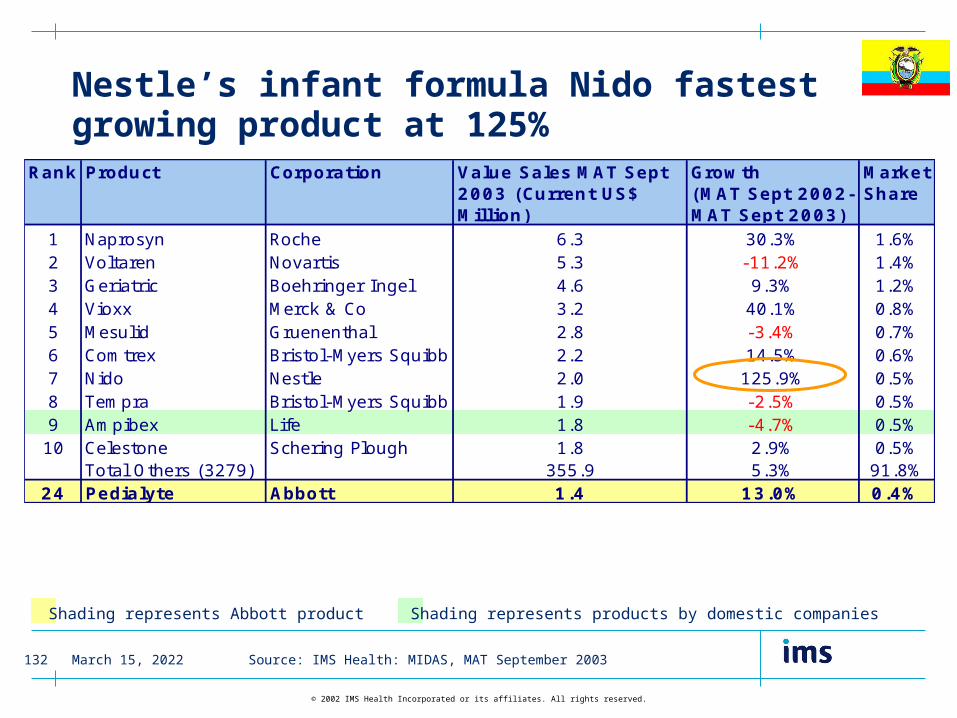
April 15, 2023132
© 2002 IMS Health Incorporated or its affiliates. All rights reserved.
Nestle’s infant formula Nido fastest growing product at 125%
Rank Product Corporation Value Sales MAT Sept 2003 (Current US$ Million)
Growth (MAT Sept 2002-MAT Sept 2003)
Market Share
1 Naprosyn Roche 6.3 30.3% 1.6%2 Voltaren Novartis 5.3 -11.2% 1.4%3 Geriatric Boehringer Ingel 4.6 9.3% 1.2%4 Vioxx Merck & Co 3.2 40.1% 0.8%5 Mesulid Gruenenthal 2.8 -3.4% 0.7%6 Comtrex Bristol-Myers Squibb 2.2 14.5% 0.6%7 Nido Nestle 2.0 125.9% 0.5%8 Tempra Bristol-Myers Squibb 1.9 -2.5% 0.5%9 Ampibex Life 1.8 -4.7% 0.5%10 Celestone Schering Plough 1.8 2.9% 0.5%
Total Others (3279) 355.9 5.3% 91.8%24 Pedialyte Abbott 1.4 13.0% 0.4%
Shading represents Abbott product Shading represents products by domestic companies
Source: IMS Health: MIDAS, MAT September 2003
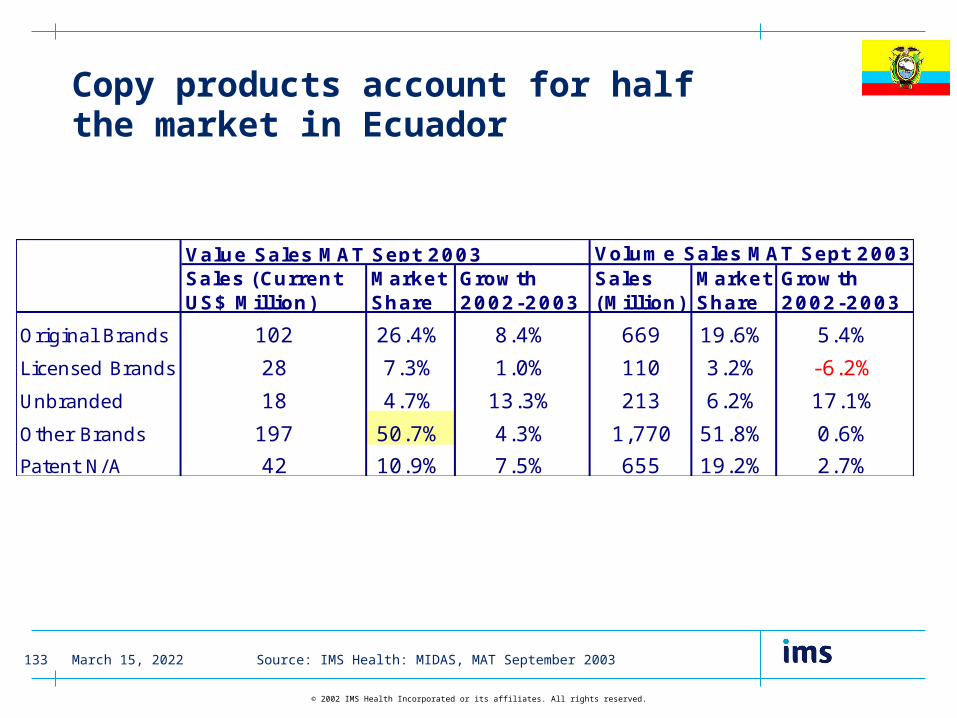
April 15, 2023133
© 2002 IMS Health Incorporated or its affiliates. All rights reserved.
Copy products account for half the market in Ecuador
Volume Sales MAT Sept 2003Sales (Current US$ Million)
Market Share
Growth 2002-2003
Sales (Million)
Market Share
Growth 2002-2003
Original Brands 102 26.4% 8.4% 669 19.6% 5.4%
Licensed Brands 28 7.3% 1.0% 110 3.2% -6.2%
Unbranded 18 4.7% 13.3% 213 6.2% 17.1%
Other Brands 197 50.7% 4.3% 1,770 51.8% 0.6%
Patent N/A 42 10.9% 7.5% 655 19.2% 2.7%
Value Sales MAT Sept 2003
Source: IMS Health: MIDAS, MAT September 2003

April 15, 2023134
© 2002 IMS Health Incorporated or its affiliates. All rights reserved.
Uruguay

April 15, 2023135
© 2002 IMS Health Incorporated or its affiliates. All rights reserved.
Domestic companies well represented in in the top 20
Rank CorporationValue Sales MAT Sept 2003 (Current US$ Million)
CAGR 5 Years (1998-2003)
Market Share
Uruguay 73.7 -16.1% 100.0%
1 Roemmers 6.3 -23.7% 8.5%
2 Roche 4.2 -15.4% 5.7%
3 Urufarma 3.9 -13.8% 5.2%
4 Schering Ag 3.6 -15.4% 5.0%
5 Novartis 3.6 -16.1% 4.8%
6 Gautier 3.3 -8.3% 4.5%
7 Bayer 3.1 -11.2% 4.2%
8 Spefar 2.8 4.5% 3.9%
9 Lazar 2.7 -9.5% 3.6%
10 Celsius 2.6 -11.4% 3.6%
Top 10 36.0 -14.7% 48.9%
Source: IMS Health: MIDAS, MAT September 2003
Domestic Companies Argentinean Company
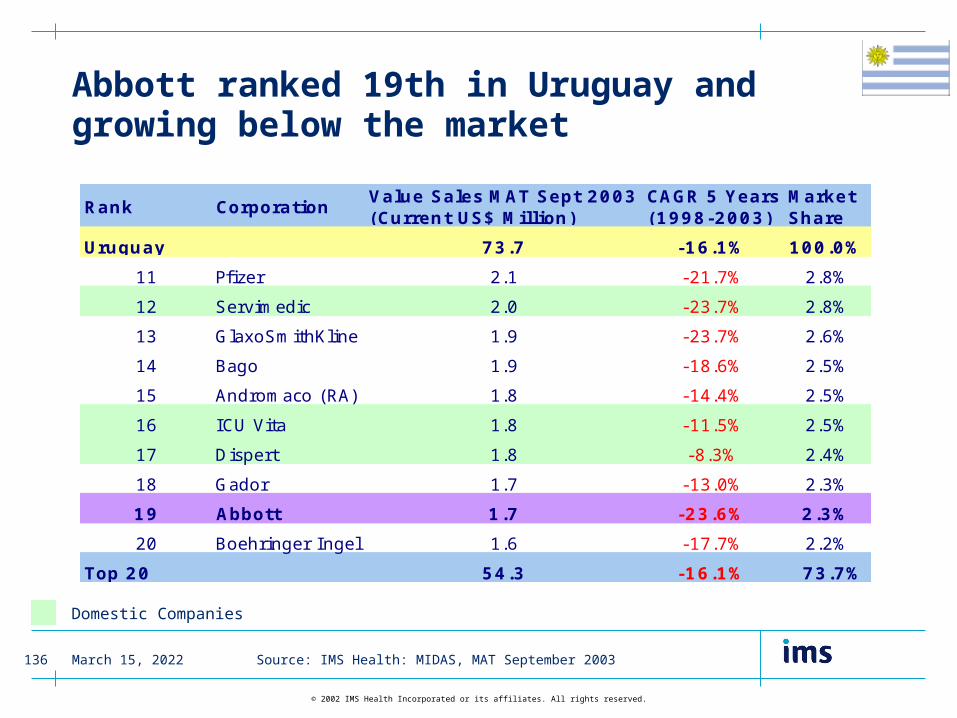
April 15, 2023136
© 2002 IMS Health Incorporated or its affiliates. All rights reserved.
Abbott ranked 19th in Uruguay and growing below the market
Rank CorporationValue Sales MAT Sept 2003 (Current US$ Million)
CAGR 5 Years (1998-2003)
Market Share
Uruguay 73.7 -16.1% 100.0%
11 Pfizer 2.1 -21.7% 2.8%
12 Servimedic 2.0 -23.7% 2.8%
13 GlaxoSmithKline 1.9 -23.7% 2.6%
14 Bago 1.9 -18.6% 2.5%
15 Andromaco (RA) 1.8 -14.4% 2.5%
16 ICU Vita 1.8 -11.5% 2.5%
17 Dispert 1.8 -8.3% 2.4%
18 Gador 1.7 -13.0% 2.3%
19 Abbott 1.7 -23.6% 2.3%
20 Boehringer Ingel 1.6 -17.7% 2.2%
Top 20 54.3 -16.1% 73.7%
Source: IMS Health: MIDAS, MAT September 2003
Domestic Companies
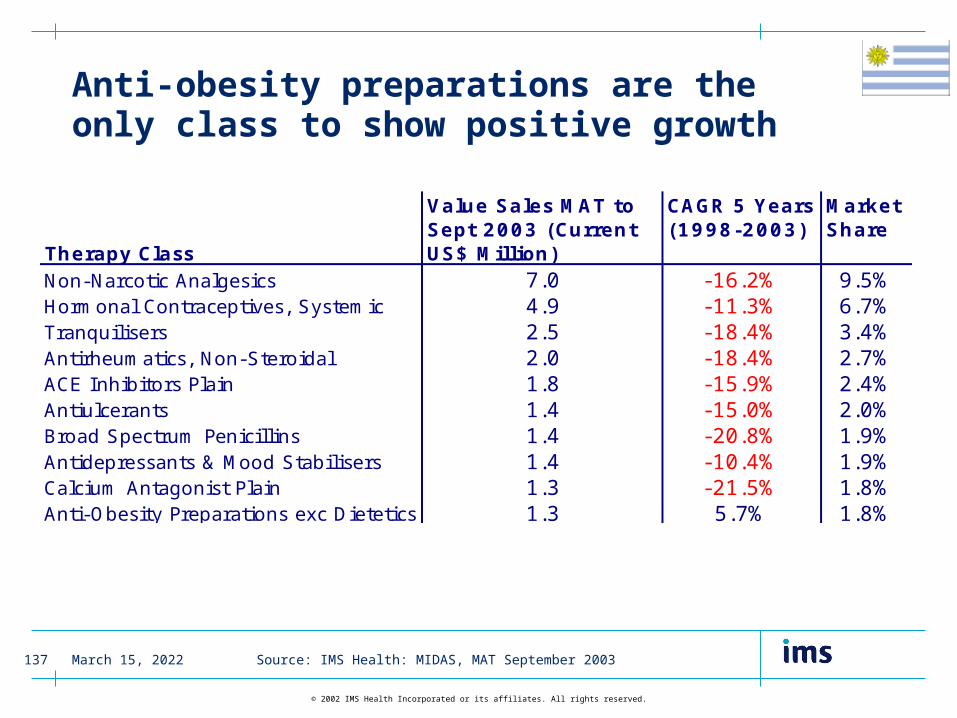
April 15, 2023137
© 2002 IMS Health Incorporated or its affiliates. All rights reserved.
Anti-obesity preparations are the only class to show positive growth
Source: IMS Health: MIDAS, MAT September 2003
Therapy Class
Value Sales MAT to Sept 2003 (Current US$ Million)
CAGR 5 Years (1998-2003)
Market Share
Non-Narcotic Analgesics 7.0 -16.2% 9.5%Hormonal Contraceptives, Systemic 4.9 -11.3% 6.7%Tranquilisers 2.5 -18.4% 3.4%Antirheumatics, Non-Steroidal 2.0 -18.4% 2.7%ACE Inhibitors Plain 1.8 -15.9% 2.4%Antiulcerants 1.4 -15.0% 2.0%Broad Spectrum Penicillins 1.4 -20.8% 1.9%Antidepressants & Mood Stabilisers 1.4 -10.4% 1.9%Calcium Antagonist Plain 1.3 -21.5% 1.8%Anti-Obesity Preparations exc Dietetics 1.3 5.7% 1.8%
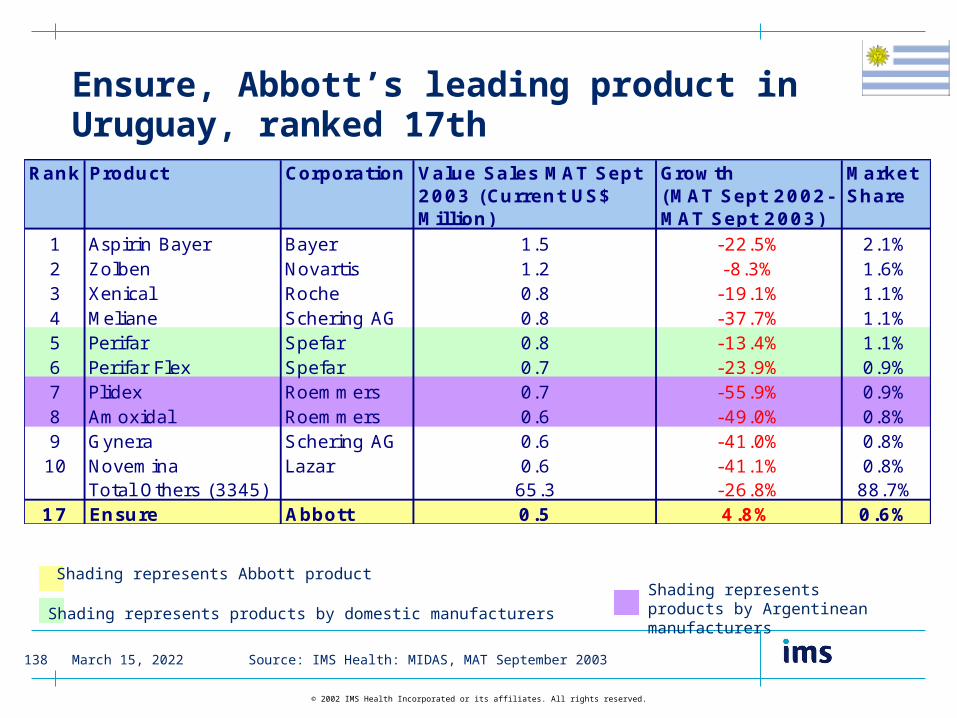
April 15, 2023138
© 2002 IMS Health Incorporated or its affiliates. All rights reserved.
Ensure, Abbott’s leading product in Uruguay, ranked 17th
Source: IMS Health: MIDAS, MAT September 2003
Rank Product Corporation Value Sales MAT Sept 2003 (Current US$ Million)
Growth (MAT Sept 2002-MAT Sept 2003)
Market Share
1 Aspirin Bayer Bayer 1.5 -22.5% 2.1%2 Zolben Novartis 1.2 -8.3% 1.6%3 Xenical Roche 0.8 -19.1% 1.1%4 Meliane Schering AG 0.8 -37.7% 1.1%5 Perifar Spefar 0.8 -13.4% 1.1%6 Perifar Flex Spefar 0.7 -23.9% 0.9%7 Plidex Roemmers 0.7 -55.9% 0.9%8 Amoxidal Roemmers 0.6 -49.0% 0.8%9 Gynera Schering AG 0.6 -41.0% 0.8%10 Novemina Lazar 0.6 -41.1% 0.8%
Total Others (3345) 65.3 -26.8% 88.7%17 Ensure Abbott 0.5 4.8% 0.6%
Shading represents Abbott product
Shading represents products by domestic manufacturers
Shading represents products by Argentinean manufacturers
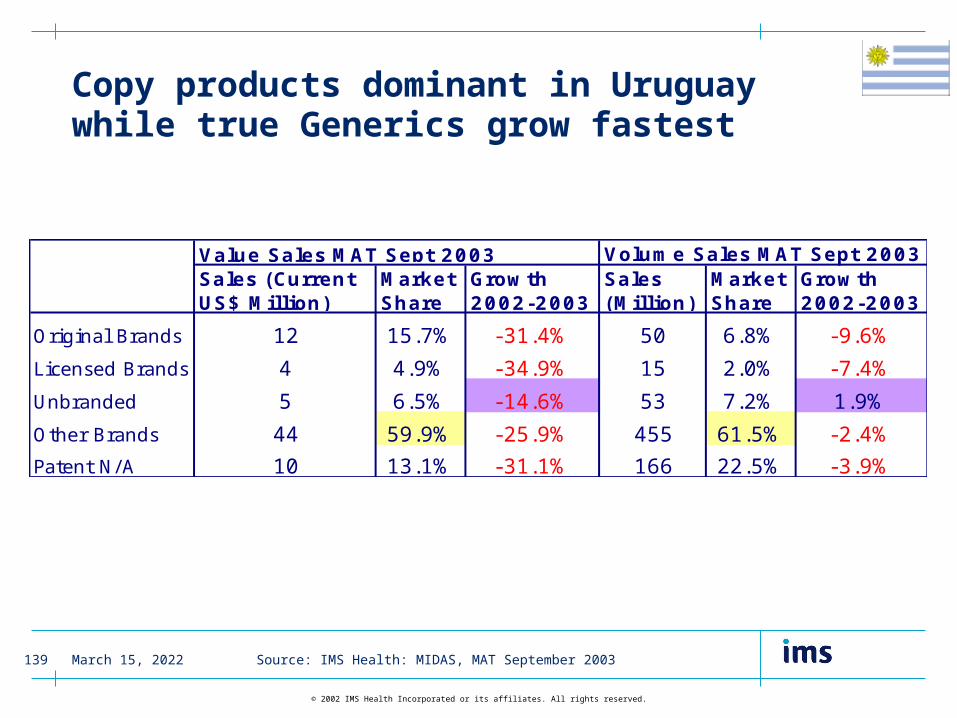
April 15, 2023139
© 2002 IMS Health Incorporated or its affiliates. All rights reserved.
Copy products dominant in Uruguay while true Generics grow fastest
Volume Sales MAT Sept 2003Sales (Current US$ Million)
Market Share
Growth 2002-2003
Sales (Million)
Market Share
Growth 2002-2003
Original Brands 12 15.7% -31.4% 50 6.8% -9.6%
Licensed Brands 4 4.9% -34.9% 15 2.0% -7.4%
Unbranded 5 6.5% -14.6% 53 7.2% 1.9%
Other Brands 44 59.9% -25.9% 455 61.5% -2.4%
Patent N/A 10 13.1% -31.1% 166 22.5% -3.9%
Value Sales MAT Sept 2003
Source: IMS Health: MIDAS, MAT September 2003
April 15, 2023140
© 2002 IMS Health Incorporated or its affiliates. All rights reserved.
© 2003. IMSWorld Publications, Ltd. All rights reserved.
The material contained in this Report is confidential and proprietary to IMSWorld Publications, Ltd., a business unit of IMS HEALTH. The material is submitted only for the purpose of the Client’s evaluation of the Report. No rights in said material are hereby transferred to the Client. The material may not be disclosed, duplicated or otherwise revealed in whole or in part without the express written permission of IMSWorld Publications, Ltd.
Information provided by you may be collected and automatically stored on our database and may be used for sending you additional information about IMS HEALTH group services. Such information also may be transferred to IMS HEALTH companies based in Switzerland and the US. If you do not wish to receive further information from IMS HEALTH, please contact IMS A.G Customer Services, 7 Harewood Avenue, London NW1 6JB.