
Improvisation of Power Quality in Power System with the ...
16
Journal of Energy Technologies and Policy www.iiste.org ISSN 2224-3232 (Paper) ISSN 2225-0573 (Online) Vol.6, No.8, 2016 23 Improvisation of Power Quality in Power System with the Integration of Renewable Energy using FACTS Devices Sohail Qureshi 1 Muhammad Salman 1 Liaqat Ali 2 Sakhi Rehman 2 Muhammad Suleman 2 Dr.N. Khan 1 1.Department of Electrical Engineering, COMSATS University of Science and Technology, Islamabad 2.Department of Electrical Engineering, University of Science and Technology Bannu Abstract The main goal in the power system is to transmit the power in a more economical way with high power quality and power factor, having a smaller possibility of system collapse or failure. Operation of power system network is going complex day by day and insecure with higher power flows without adequate control. Renewable energy when connected to the power grid can invite a lot of new problems and challenges. The output power of the wind generator is greatly affected by the variable nature of the wind speed which can cause power quality issues while integrating it to the grid network. The power quality issues include voltage fluctuation and reduced power factor. One solution is to introduce Flexible AC Transmission System (FACTS) like, Unified Power Flow Controller (UPFC), Static Synchronous Compensator (STATCOM) and Static Synchronous convertors. The main objective of power electronic convertors is to integrate renewable energy or any distributed generation to the standard of grid power factor. However, the troubles like injecting additional harmonics to the system due to the high switching frequency can cause immense power quality issues [1]. Custom power devices (CPD), which includes Shunt controllers like Static Synchronous Compensator or Static Var Compensator (STATCOM or SVC), Series Controllers like Static Synchronous Series Compensator (SSSC or TCSC), Combination of Series and Shunt Controller like Unified Power Flow Controller (UPFC) are used to interface devices between distributed generation and Series Compensator (SSSC) to improve the power factor and regulate the terminal voltage by installing it at the critical locations. MATLAB/PSAT is used to simulate the FACTS devices control scheme connected with the Wind turbine. And the effectiveness of the FACTS devices is tested by connecting the controllers at critical location of the power grid using IEEE 14 bus System. Keywords: Unified Power Flow Controller (UPFC), Static Compensator (STATCOM), Static Synchronous Series 1. Introduction Fossil fuels plays an important role in development of most industrial nations, but there are certain facts and realities that a society needs to understand while using it. A time will come when there will be a shortage of fossil fuels or it will become too expensive to use it realistically. Secondly the fossils fuels put some adverse effects on the atmosphere while running a steam turbine to generate a thermal power from it, which boost up the greenhouse gases like carbon dioxide, which warm up the earth temperature and create harmful effect on our climate, health and our environment. So the renewable energy is very much needed to integrate into the grid power system to minimize the issues related with global warming, resulting from generating power from conventional power plants. Therefore, at the present time an engineer focuses on to add more and more renewable energy into the grid, which will definitely reduce carbon dioxide emission and will increase energy efficiency. To integrate renewable energy into the grid power system we need power electronic consumer sides to minimize voltage/current fluctuations/disturbances and improve power factor by compensating the reactive power generated or absorbed by the load. The distributed generation like Wind or Solar are the most promising sources of generation having no threat to global warming. They have a lot of other advantages, like supporting voltage, reducing the power losses during transmission and distribution and improve the reliability of power system. The various power quality problems are serious threat to both the utility and consumers [2]. The custom power devices (CPD) can overcome the issue of power quality specially voltage fluctuation and improving power factor. This system is made up of combination of intelligent devices which will be able to detect and respond to various disturbances in the power system like voltage disturbances. 1.2 Problem Statement Output power of the wind turbine can be greatly affected by the variable nature of the wind speed. The electricity produced from the wind generator increases or decreases depend on the speed of the wind. Thus integrating renewable energy into the grid network is quite a challenging task as it invites a lot of power quality issues like voltage fluctuations and reduced power factor. so it is vital to have an effective grid infrastructure for integrating renewable energy into the grid station. FACTS (Flexible AC Transmission System) devices like Unified Power Flow Controller (UPFC), Static Synchronous Compensator (STATCOM) and Static Synchronous Series Compensator (SSSC) are used to
Transcript of Improvisation of Power Quality in Power System with the ...
Journal of Energy Technologies and Policy www.iiste.org
ISSN 2224-3232 (Paper) ISSN 2225-0573 (Online)
Vol.6, No.8, 2016
23
Improvisation of Power Quality in Power System with the
Integration of Renewable Energy using FACTS Devices
Sohail Qureshi1 Muhammad Salman1 Liaqat Ali2 Sakhi Rehman2 Muhammad Suleman2
Dr.N. Khan1
1.Department of Electrical Engineering, COMSATS University of Science and Technology, Islamabad
2.Department of Electrical Engineering, University of Science and Technology Bannu
Abstract
The main goal in the power system is to transmit the power in a more economical way with high power quality
and power factor, having a smaller possibility of system collapse or failure. Operation of power system network
is going complex day by day and insecure with higher power flows without adequate control. Renewable energy
when connected to the power grid can invite a lot of new problems and challenges. The output power of the wind
generator is greatly affected by the variable nature of the wind speed which can cause power quality issues while
integrating it to the grid network. The power quality issues include voltage fluctuation and reduced power factor.
One solution is to introduce Flexible AC Transmission System (FACTS) like, Unified Power Flow Controller
(UPFC), Static Synchronous Compensator (STATCOM) and Static Synchronous convertors. The main objective
of power electronic convertors is to integrate renewable energy or any distributed generation to the standard of
grid power factor. However, the troubles like injecting additional harmonics to the system due to the high
switching frequency can cause immense power quality issues [1].
Custom power devices (CPD), which includes Shunt controllers like Static Synchronous Compensator or Static
Var Compensator (STATCOM or SVC), Series Controllers like Static Synchronous Series Compensator (SSSC
or TCSC), Combination of Series and Shunt Controller like Unified Power Flow Controller (UPFC) are used to
interface devices between distributed generation and Series Compensator (SSSC) to improve the power factor
and regulate the terminal voltage by installing it at the critical locations. MATLAB/PSAT is used to simulate the
FACTS devices control scheme connected with the Wind turbine. And the effectiveness of the FACTS devices is
tested by connecting the controllers at critical location of the power grid using IEEE 14 bus System.
Keywords: Unified Power Flow Controller (UPFC), Static Compensator (STATCOM), Static Synchronous
Series
1. Introduction
Fossil fuels plays an important role in development of most industrial nations, but there are certain facts and
realities that a society needs to understand while using it. A time will come when there will be a shortage of
fossil fuels or it will become too expensive to use it realistically. Secondly the fossils fuels put some adverse
effects on the atmosphere while running a steam turbine to generate a thermal power from it, which boost up the
greenhouse gases like carbon dioxide, which warm up the earth temperature and create harmful effect on our
climate, health and our environment. So the renewable energy is very much needed to integrate into the grid
power system to minimize the issues related with global warming, resulting from generating power from
conventional power plants. Therefore, at the present time an engineer focuses on to add more and more
renewable energy into the grid, which will definitely reduce carbon dioxide emission and will increase energy
efficiency. To integrate renewable energy into the grid power system we need power electronic consumer sides
to minimize voltage/current fluctuations/disturbances and improve power factor by compensating the reactive
power generated or absorbed by the load. The distributed generation like Wind or Solar are the most promising
sources of generation having no threat to global warming. They have a lot of other advantages, like supporting
voltage, reducing the power losses during transmission and distribution and improve the reliability of power
system. The various power quality problems are serious threat to both the utility and consumers [2].
The custom power devices (CPD) can overcome the issue of power quality specially voltage fluctuation
and improving power factor. This system is made up of combination of intelligent devices which will be able to
detect and respond to various disturbances in the power system like voltage disturbances.
1.2 Problem Statement
Output power of the wind turbine can be greatly affected by the variable nature of the wind speed. The electricity
produced from the wind generator increases or decreases depend on the speed of the wind. Thus integrating
renewable energy into the grid network is quite a challenging task as it invites a lot of power quality issues like
voltage fluctuations and reduced power factor. so it is vital to have an effective grid infrastructure for integrating
renewable energy into the grid station.
FACTS (Flexible AC Transmission System) devices like Unified Power Flow Controller (UPFC), Static
Synchronous Compensator (STATCOM) and Static Synchronous Series Compensator (SSSC) are used to
Journal of Energy Technologies and Policy www.iiste.org
ISSN 2224-3232 (Paper) ISSN 2225-0573 (Online)
Vol.6, No.8, 2016
24
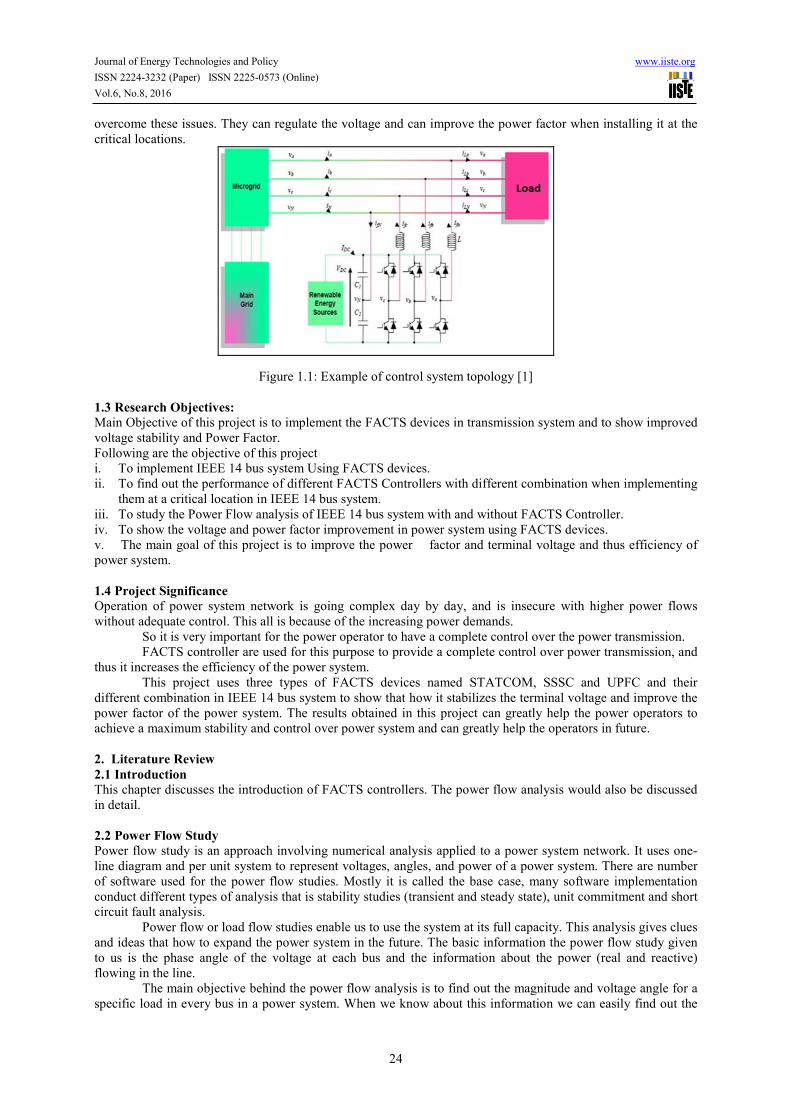
overcome these issues. They can regulate the voltage and can improve the power factor when installing it at the
critical locations.
Figure 1.1: Example of control system topology [1]
1.3 Research Objectives:
Main Objective of this project is to implement the FACTS devices in transmission system and to show improved
voltage stability and Power Factor.
Following are the objective of this project
i. To implement IEEE 14 bus system Using FACTS devices.
ii. To find out the performance of different FACTS Controllers with different combination when implementing
them at a critical location in IEEE 14 bus system.
iii. To study the Power Flow analysis of IEEE 14 bus system with and without FACTS Controller.
iv. To show the voltage and power factor improvement in power system using FACTS devices.
v. The main goal of this project is to improve the power factor and terminal voltage and thus efficiency of
power system.
1.4 Project Significance
Operation of power system network is going complex day by day, and is insecure with higher power flows
without adequate control. This all is because of the increasing power demands.
So it is very important for the power operator to have a complete control over the power transmission.
FACTS controller are used for this purpose to provide a complete control over power transmission, and
thus it increases the efficiency of the power system.
This project uses three types of FACTS devices named STATCOM, SSSC and UPFC and their
different combination in IEEE 14 bus system to show that how it stabilizes the terminal voltage and improve the
power factor of the power system. The results obtained in this project can greatly help the power operators to
achieve a maximum stability and control over power system and can greatly help the operators in future.
2. Literature Review
2.1 Introduction
This chapter discusses the introduction of FACTS controllers. The power flow analysis would also be discussed
in detail.
2.2 Power Flow Study
Power flow study is an approach involving numerical analysis applied to a power system network. It uses one-
line diagram and per unit system to represent voltages, angles, and power of a power system. There are number
of software used for the power flow studies. Mostly it is called the base case, many software implementation
conduct different types of analysis that is stability studies (transient and steady state), unit commitment and short
circuit fault analysis.
Power flow or load flow studies enable us to use the system at its full capacity. This analysis gives clues
and ideas that how to expand the power system in the future. The basic information the power flow study given
to us is the phase angle of the voltage at each bus and the information about the power (real and reactive)
flowing in the line.
The main objective behind the power flow analysis is to find out the magnitude and voltage angle for a
specific load in every bus in a power system. When we know about this information we can easily find out the
Journal of Energy Technologies and Policy www.iiste.org
ISSN 2224-3232 (Paper) ISSN 2225-0573 (Online)
Vol.6, No.8, 2016
25
reactive power in each branch as well as the reactive power of the generator.
Power flow studies are very much important analysis before connecting STATCOM, SSSC, and UPFC
in the system. To evaluate the effect of FACTS devices like STATCOM, SSSC and UPFC on voltage control in
the power system, power flow study is essential. Likewise, during the stage of finding out the ratings of these
FACTS devices called the planning stage, the load flow study should be carried out to find the exact ratings of
STATCOM, SSSC and UPFC required in the power system.
2.3 Introduction to FACTS Controllers
Flexible AC Transmission System (FACTS) is basically a power electronic based system that provides voltage
controllability and can enhance energy transfer capability [3]. It has three main types, Shunt controllers, Series
controller and combination of both shunt and series controller named Shunt-Series controller.
The shunt connected FACTS controller are is very helpful in improving transient stability, Power
oscillation damping and above all it improves the voltage profile of a particular bus. Static Synchronous
Compensator (STATCOM) and Static Var Compensator (SVC) are both Shunt connected FACTS controllers [4].
Series Connected FACTS controller is used to increase the limit of transient stability, and could
improve voltage stability limit [5]. Thyristor switched series capacitor (TSSC), Thyristor Controlled Series
capacitor (TCSC) and Static Synchronous Series Compensator are some of the examples of Series Connected
FACTS Controller.
The third one is combination of shunt and series compensators, it provides greater flexibility and
adaptability then the other two compensators. It works as a multifunctional device and provides greater control.
Unified Power Flow Controller (UPFC) and Interline Power Flow Controller (IPFC) are the examples of Shunt-
Series FACTS Controller [6].
2.3.1Theory of FACTS Controllers
The shunt connected FACTS controller regulates the voltage profile when it connected in shunt with the system
through a transformer. The capacitor in the shunt controller generate the reactive power while the inductor
absorbs it according to need of the system. These Reactive Power generators or absorbers are used to control the
reactive power of the transmission system [5]. Shunt connected FACT controller has basically three types, one is
variable impedance/reactance type, second one is switching convertor type and the third one is hybrid type.
Series Connected FACTS controller has two types, the variable impedance type and switching
convertor type. Its basic principle is to maximize the transmission power by minimizing the circuit impedance
along the line [7, 8].
The basic function of Series and Shunt Compensators are quite similar except that the series
compensator is the inverse of shunt compensator [7,8]. The third type of FACTS controller which actually mix
the principle of shunt and series controller has the ability to control all the variables which degrade the power
flow in the transmission line. The parameters which affect the power flow in the power system are impedance,
voltage and phase angle [9].
2.3.2 Operation and Control of FACT Controller
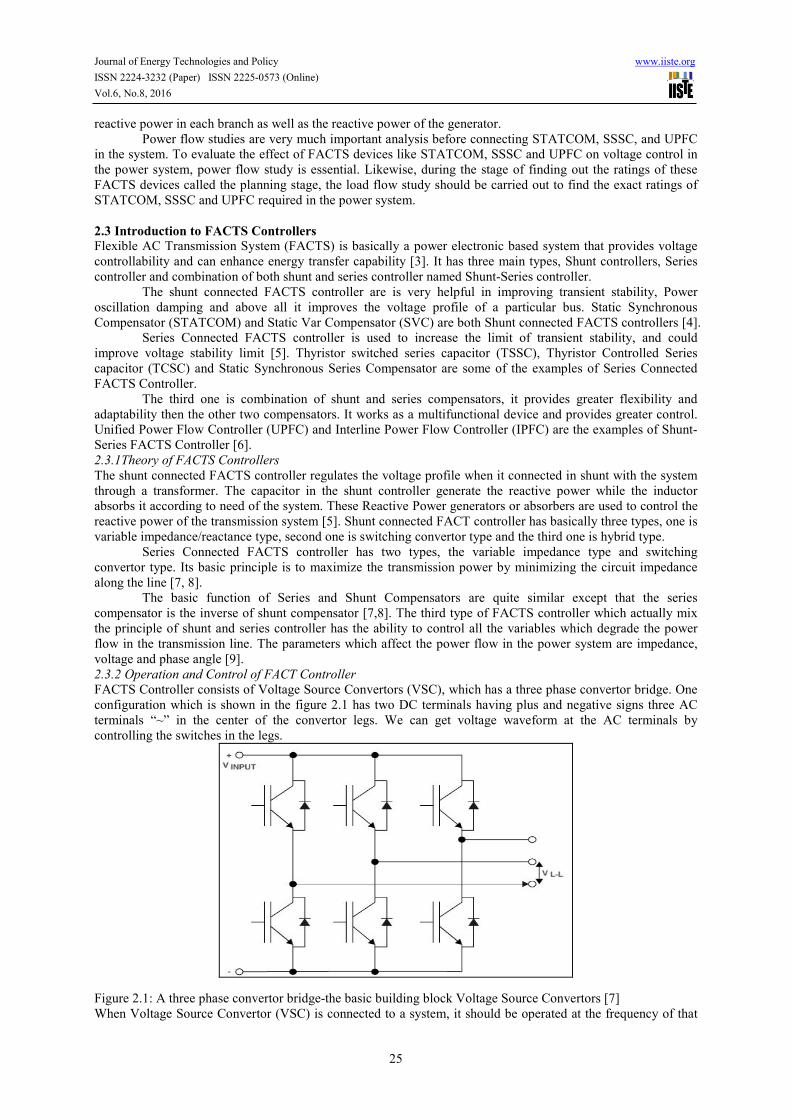
FACTS Controller consists of Voltage Source Convertors (VSC), which has a three phase convertor bridge. One
configuration which is shown in the figure 2.1 has two DC terminals having plus and negative signs three AC
terminals “~” in the center of the convertor legs. We can get voltage waveform at the AC terminals by
controlling the switches in the legs.
Figure 2.1: A three phase convertor bridge-the basic building block Voltage Source Convertors [7]
When Voltage Source Convertor (VSC) is connected to a system, it should be operated at the frequency of that
Journal of Energy Technologies and Policy www.iiste.org
ISSN 2224-3232 (Paper) ISSN 2225-0573 (Online)
Vol.6, No.8, 2016
26
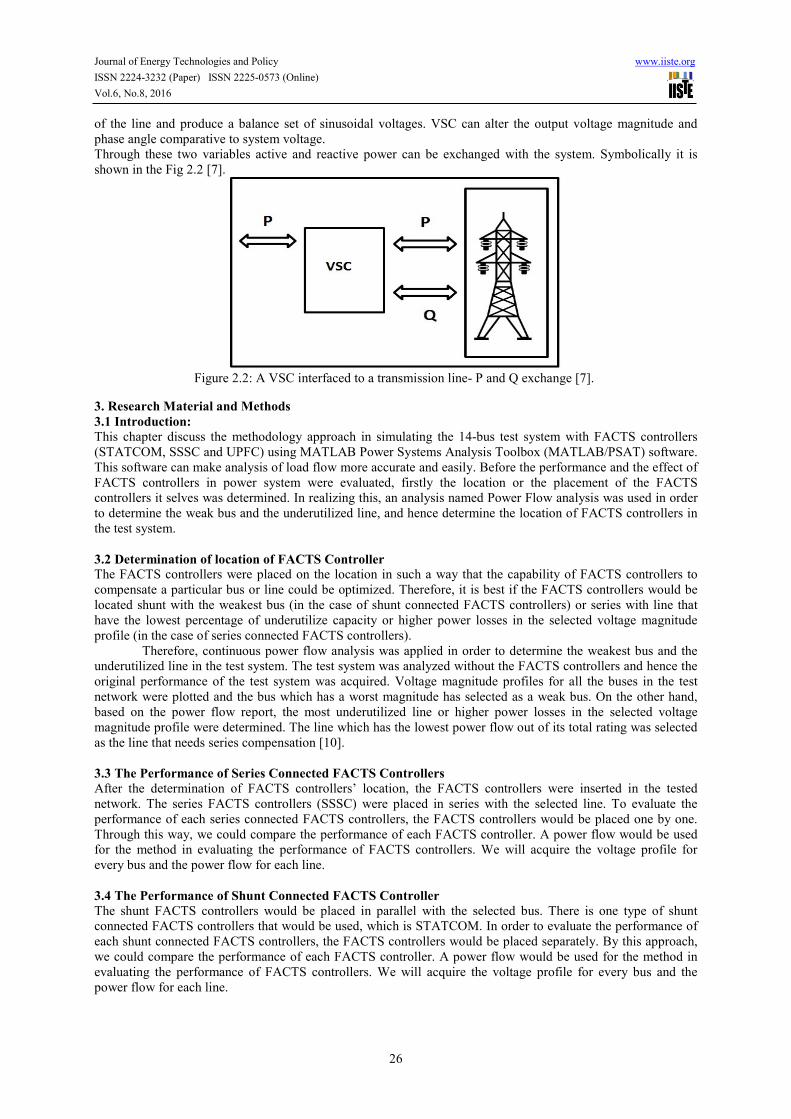
of the line and produce a balance set of sinusoidal voltages. VSC can alter the output voltage magnitude and
phase angle comparative to system voltage.
Through these two variables active and reactive power can be exchanged with the system. Symbolically it is
shown in the Fig 2.2 [7].
Figure 2.2: A VSC interfaced to a transmission line- P and Q exchange [7].
3. Research Material and Methods
3.1 Introduction:
This chapter discuss the methodology approach in simulating the 14-bus test system with FACTS controllers
(STATCOM, SSSC and UPFC) using MATLAB Power Systems Analysis Toolbox (MATLAB/PSAT) software.
This software can make analysis of load flow more accurate and easily. Before the performance and the effect of
FACTS controllers in power system were evaluated, firstly the location or the placement of the FACTS
controllers it selves was determined. In realizing this, an analysis named Power Flow analysis was used in order
to determine the weak bus and the underutilized line, and hence determine the location of FACTS controllers in
the test system.
3.2 Determination of location of FACTS Controller
The FACTS controllers were placed on the location in such a way that the capability of FACTS controllers to
compensate a particular bus or line could be optimized. Therefore, it is best if the FACTS controllers would be
located shunt with the weakest bus (in the case of shunt connected FACTS controllers) or series with line that
have the lowest percentage of underutilize capacity or higher power losses in the selected voltage magnitude
profile (in the case of series connected FACTS controllers).
Therefore, continuous power flow analysis was applied in order to determine the weakest bus and the
underutilized line in the test system. The test system was analyzed without the FACTS controllers and hence the
original performance of the test system was acquired. Voltage magnitude profiles for all the buses in the test
network were plotted and the bus which has a worst magnitude has selected as a weak bus. On the other hand,
based on the power flow report, the most underutilized line or higher power losses in the selected voltage
magnitude profile were determined. The line which has the lowest power flow out of its total rating was selected
as the line that needs series compensation [10].
3.3 The Performance of Series Connected FACTS Controllers
After the determination of FACTS controllers’ location, the FACTS controllers were inserted in the tested
network. The series FACTS controllers (SSSC) were placed in series with the selected line. To evaluate the
performance of each series connected FACTS controllers, the FACTS controllers would be placed one by one.
Through this way, we could compare the performance of each FACTS controller. A power flow would be used
for the method in evaluating the performance of FACTS controllers. We will acquire the voltage profile for
every bus and the power flow for each line.
3.4 The Performance of Shunt Connected FACTS Controller
The shunt FACTS controllers would be placed in parallel with the selected bus. There is one type of shunt
connected FACTS controllers that would be used, which is STATCOM. In order to evaluate the performance of
each shunt connected FACTS controllers, the FACTS controllers would be placed separately. By this approach,
we could compare the performance of each FACTS controller. A power flow would be used for the method in
evaluating the performance of FACTS controllers. We will acquire the voltage profile for every bus and the
power flow for each line.
Journal of Energy Technologies and Policy www.iiste.org
ISSN 2224-3232 (Paper) ISSN 2225-0573 (Online)
Vol.6, No.8, 2016
27
3.5 The Performance of Shunt-Series Connected FACTS Controllers
Based on the lowest voltage magnitude, then following by underutilized line or higher power losses in the
selected voltage magnitude profile determine earlier, we place the shunt-series on the line with series part of
compensator connected in series with the line and shunt part of compensator shunted with the line
impedance would have to divide by two. For this combined compensator we would only consider of using
only one FACTS controller, which is the UPFC. The performance analyzing method is actually similar with
the previous method used for series and shunt connected FACTS controllers. With this approach, voltage
profile for every buses and the power flow for each line and hence we would obtain enough data to compare
with.
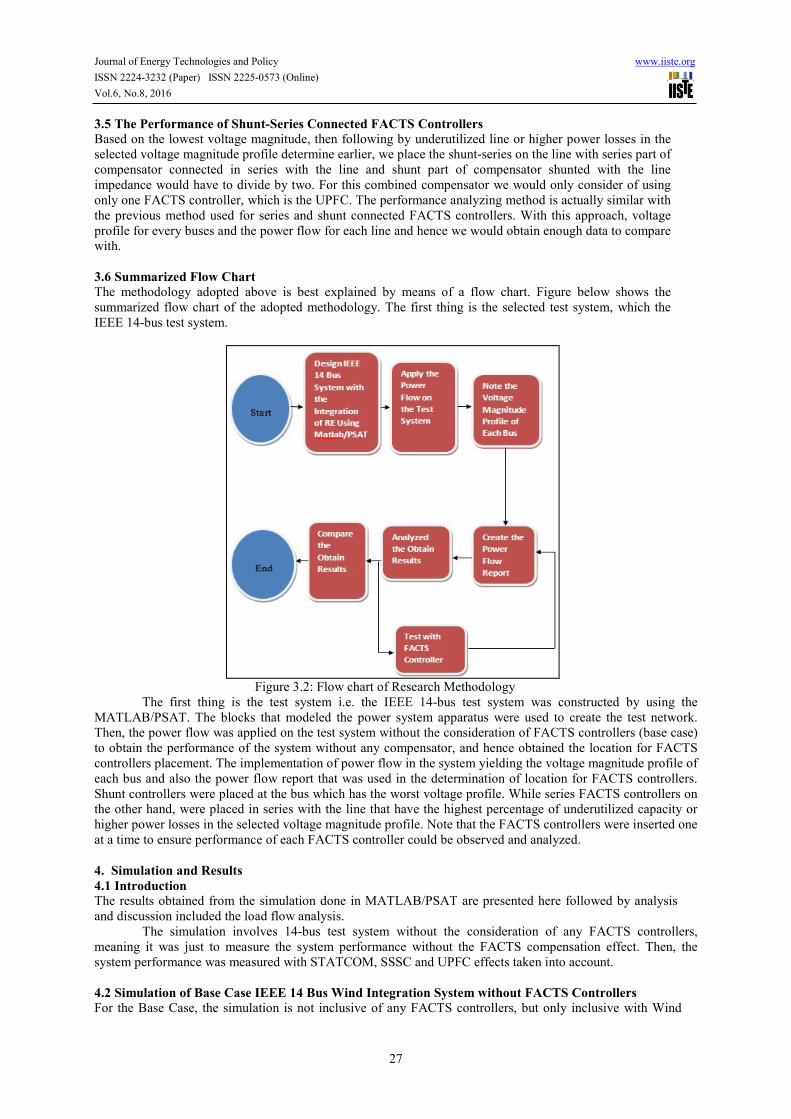
3.6 Summarized Flow Chart
The methodology adopted above is best explained by means of a flow chart. Figure below shows the
summarized flow chart of the adopted methodology. The first thing is the selected test system, which the
IEEE 14-bus test system.
Figure 3.2: Flow chart of Research Methodology
The first thing is the test system i.e. the IEEE 14-bus test system was constructed by using the
MATLAB/PSAT. The blocks that modeled the power system apparatus were used to create the test network.
Then, the power flow was applied on the test system without the consideration of FACTS controllers (base case)
to obtain the performance of the system without any compensator, and hence obtained the location for FACTS
controllers placement. The implementation of power flow in the system yielding the voltage magnitude profile of
each bus and also the power flow report that was used in the determination of location for FACTS controllers.
Shunt controllers were placed at the bus which has the worst voltage profile. While series FACTS controllers on
the other hand, were placed in series with the line that have the highest percentage of underutilized capacity or
higher power losses in the selected voltage magnitude profile. Note that the FACTS controllers were inserted one
at a time to ensure performance of each FACTS controller could be observed and analyzed.
4. Simulation and Results
4.1 Introduction
The results obtained from the simulation done in MATLAB/PSAT are presented here followed by analysis
and discussion included the load flow analysis.
The simulation involves 14-bus test system without the consideration of any FACTS controllers,
meaning it was just to measure the system performance without the FACTS compensation effect. Then, the
system performance was measured with STATCOM, SSSC and UPFC effects taken into account.
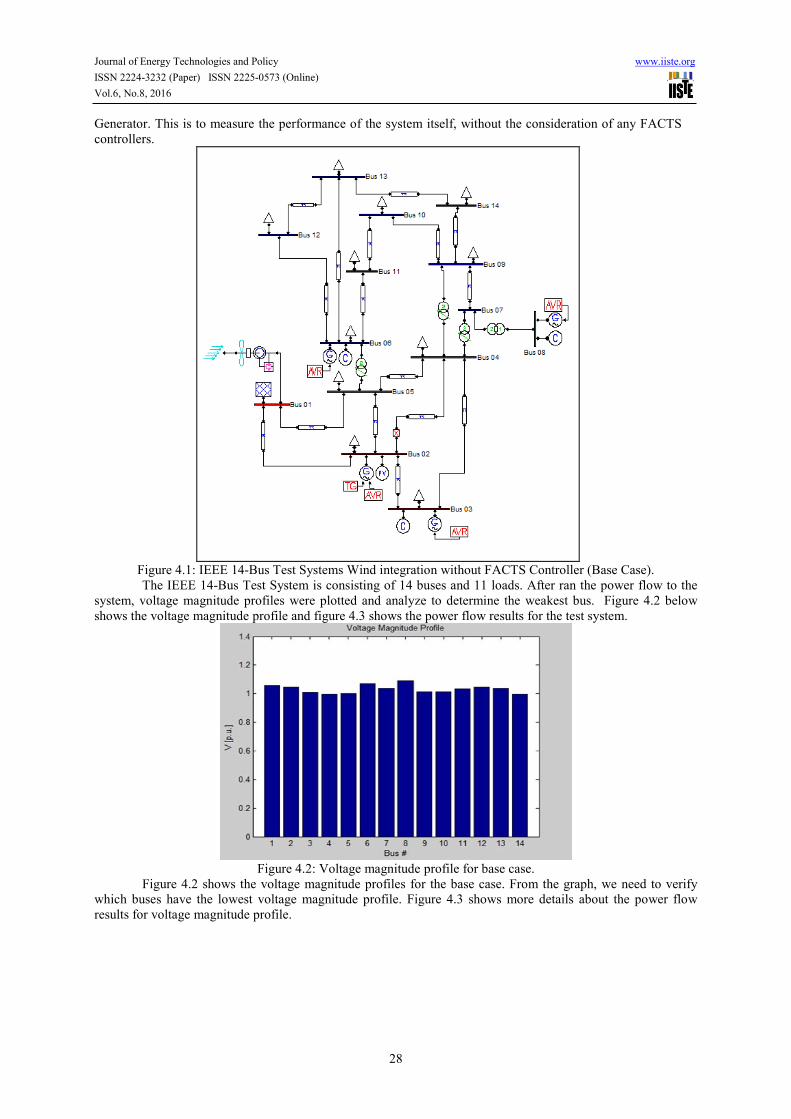
4.2 Simulation of Base Case IEEE 14 Bus Wind Integration System without FACTS Controllers
For the Base Case, the simulation is not inclusive of any FACTS controllers, but only inclusive with Wind
Journal of Energy Technologies and Policy www.iiste.org
ISSN 2224-3232 (Paper) ISSN 2225-0573 (Online)
Vol.6, No.8, 2016
28
Generator. This is to measure the performance of the system itself, without the consideration of any FACTS
controllers.
Figure 4.1: IEEE 14-Bus Test Systems Wind integration without FACTS Controller (Base Case).
The IEEE 14-Bus Test System is consisting of 14 buses and 11 loads. After ran the power flow to the
system, voltage magnitude profiles were plotted and analyze to determine the weakest bus. Figure 4.2 below
shows the voltage magnitude profile and figure 4.3 shows the power flow results for the test system.
Figure 4.2: Voltage magnitude profile for base case.
Figure 4.2 shows the voltage magnitude profiles for the base case. From the graph, we need to verify
which buses have the lowest voltage magnitude profile. Figure 4.3 shows more details about the power flow
results for voltage magnitude profile.

Journal of Energy Technologies and Policy www.iiste.org
ISSN 2224-3232 (Paper) ISSN 2225-0573 (Online)
Vol.6, No.8, 2016
29
Figure 4.3: Power Flow Results for Base Case
In Figure 4.3, there are two buses that have voltage magnitude below 1p.u. The lowest voltage
magnitude is 0. 99659p.u which is bus 14, following by bus 4 with 0.99782p.u. From the figure above it is
shown that bus number 14 and 4 was severely collapsed. With this, bus 14 and bus 4 was selected to be the
location of FACTS controllers’ placement. Three testing method will be used to analyzed the result. The method
is explained as below:
i. Testing method 1:
Install STATCOM at bus 14 and SSSC at bus 4
ii. Testing method 2:
Install STATCOM and SSSC at bus 14.
iii. Testing method 3
Install UPFC at bus 14.

Journal of Energy Technologies and Policy www.iiste.org
ISSN 2224-3232 (Paper) ISSN 2225-0573 (Online)
Vol.6, No.8, 2016
30
Figure 4.4: Line Flow Results for Base Case
From Figure 4.4, the highest power loss in bus 14 is 0.2943p.u. which is in line 9, following by bus 4
with 0.2112p.u. in line 16. These values used to determine the location of FACTS controllers for the testing in
method 1. For STATCOM, it will be placed at bus 14, while SSSC will be placed at line 16.
4.3 Simulation of IEEE 14 bus wind integration system with STATCOM and SSSC testing method 1
Based on the base case result, the weakest bus in the system was at bus 4 and bus 14. Therefore, STATCOM
will be placed at bus 14, while SSSC will be placed at bus 4, to simulate the effect and the performance of
shunt and series FACTS controllers to the system. The one-line diagram of constructed Simulink with
consideration of shunt and series FACTS controllers were shows below.

Journal of Energy Technologies and Policy www.iiste.org
ISSN 2224-3232 (Paper) ISSN 2225-0573 (Online)
Vol.6, No.8, 2016
31
Figure 4.5: Testing method 1 with STATCOM and SSSC
Figure 4.5 shows that the FACTS controllers were shunted at bus 14 and series at bus 4. The Simulink
models were simulated using the power flow method. After simulating the models, the voltage magnitude profile
of the system was plotted and compared with the base case and each other. The voltage magnitude profile is
shown in the figures below:
a) Without FACTS Controllers b) With FACTS Controllers
Figure 4.6: Voltage magnitude profile after installing FACTS Controllers
Figure 4.6 shows the voltage magnitude profiles for the wind integration system with and without
STATCOM and SSSC using testing method 1. From the graph, we can see the voltage magnitude was improved
after injected with FACTS controllers. Figure 4.8 shows more details about the power flow results for voltage
magnitude profile.
Journal of Energy Technologies and Policy www.iiste.org
ISSN 2224-3232 (Paper) ISSN 2225-0573 (Online)
Vol.6, No.8, 2016
32
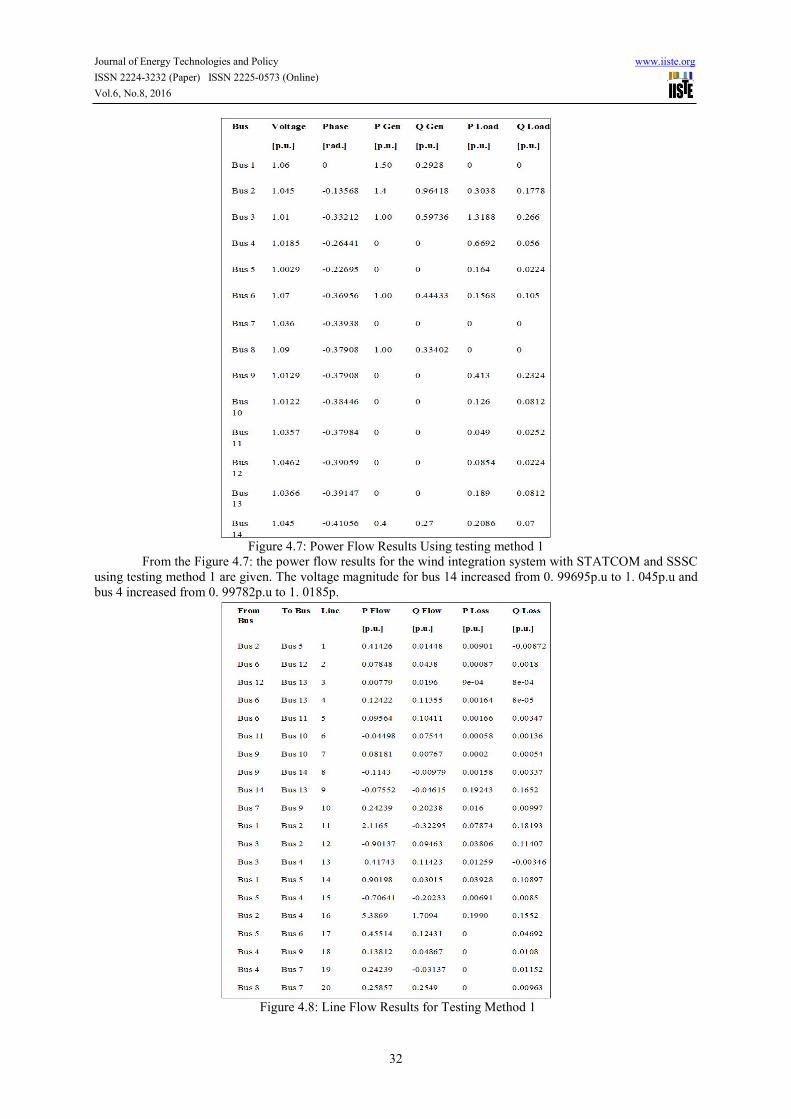
Figure 4.7: Power Flow Results Using testing method 1
From the Figure 4.7: the power flow results for the wind integration system with STATCOM and SSSC
using testing method 1 are given. The voltage magnitude for bus 14 increased from 0. 99695p.u to 1. 045p.u and
bus 4 increased from 0. 99782p.u to 1. 0185p.
Figure 4.8: Line Flow Results for Testing Method 1
Journal of Energy Technologies and Policy www.iiste.org
ISSN 2224-3232 (Paper) ISSN 2225-0573 (Online)
Vol.6, No.8, 2016
33
Figure 4.8 shows the power losses at line 9 are decreased from 0.2943p.u. to 0.19243p.u. while power
losses at line 16 are decreased from 0.2112 p.u. to 0.1990p.u. These values shows that the FACTS controllers
have improve the power flow in the 14-bus test system.
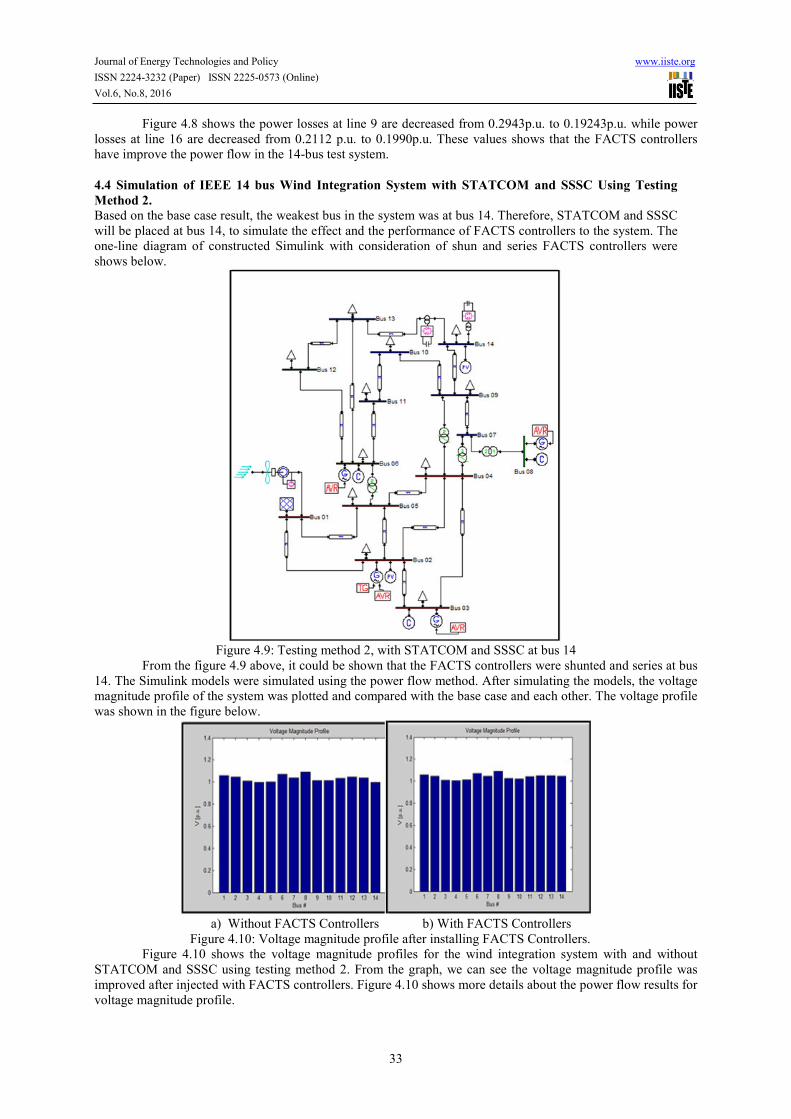
4.4 Simulation of IEEE 14 bus Wind Integration System with STATCOM and SSSC Using Testing
Method 2.
Based on the base case result, the weakest bus in the system was at bus 14. Therefore, STATCOM and SSSC
will be placed at bus 14, to simulate the effect and the performance of FACTS controllers to the system. The
one-line diagram of constructed Simulink with consideration of shun and series FACTS controllers were
shows below.
Figure 4.9: Testing method 2, with STATCOM and SSSC at bus 14
From the figure 4.9 above, it could be shown that the FACTS controllers were shunted and series at bus
14. The Simulink models were simulated using the power flow method. After simulating the models, the voltage
magnitude profile of the system was plotted and compared with the base case and each other. The voltage profile
was shown in the figure below.
a) Without FACTS Controllers b) With FACTS Controllers
Figure 4.10: Voltage magnitude profile after installing FACTS Controllers.
Figure 4.10 shows the voltage magnitude profiles for the wind integration system with and without
STATCOM and SSSC using testing method 2. From the graph, we can see the voltage magnitude profile was
improved after injected with FACTS controllers. Figure 4.10 shows more details about the power flow results for
voltage magnitude profile.

Journal of Energy Technologies and Policy www.iiste.org
ISSN 2224-3232 (Paper) ISSN 2225-0573 (Online)
Vol.6, No.8, 2016
34
Figure 4.10: Power Flow Results Using Testing Method 2
Figure 4.10 shows the power flow results for the wind integration system with STATCOM and SSSC
using testing method 2. We can see the voltage magnitude for bus 14 increased from 0. 99695p.u from base case
to 1.045p.u.
Figure 4.11: Line Flow Results Using Testing Method 2
Figure 4.11 shows the power losses at line 9 are decreased from 0.2943p.u. from base case to
0.22513p.u. These values shows that the FACTS controllers have improve the power flow in the 14-bus test
system.
4.5 Simulation of IEEE 14 bus Wind Integration System with UPFC Using Testing Method 3
Based on the base case result, the weakest bus in the system was at bus 14. Therefore, UPFC will be placed
Journal of Energy Technologies and Policy www.iiste.org
ISSN 2224-3232 (Paper) ISSN 2225-0573 (Online)
Vol.6, No.8, 2016
35
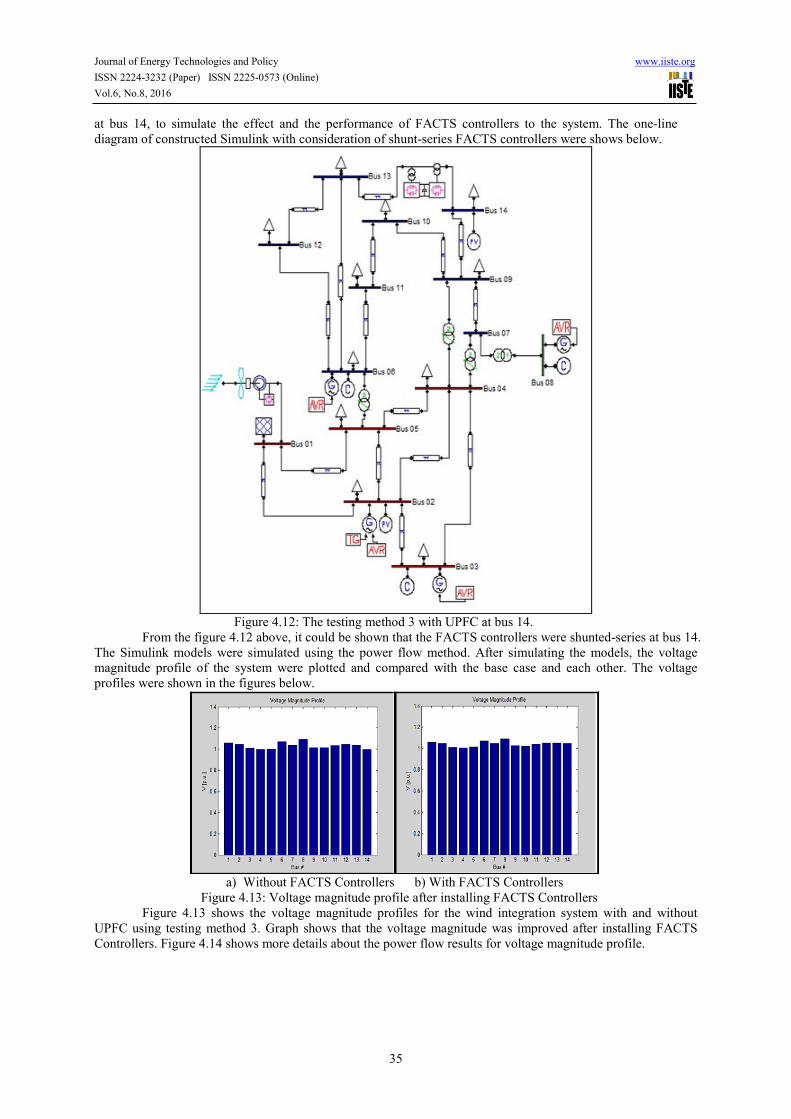
at bus 14, to simulate the effect and the performance of FACTS controllers to the system. The one-line
diagram of constructed Simulink with consideration of shunt-series FACTS controllers were shows below.
Figure 4.12: The testing method 3 with UPFC at bus 14.
From the figure 4.12 above, it could be shown that the FACTS controllers were shunted-series at bus 14.
The Simulink models were simulated using the power flow method. After simulating the models, the voltage
magnitude profile of the system were plotted and compared with the base case and each other. The voltage
profiles were shown in the figures below.
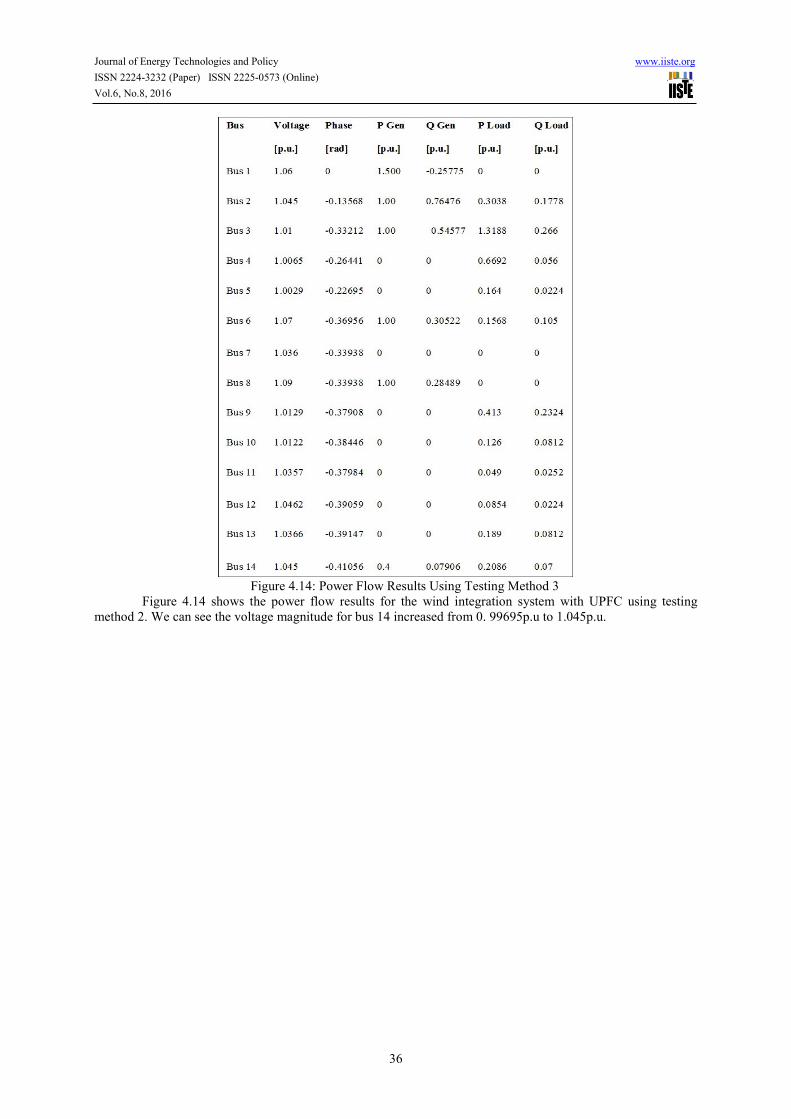
a) Without FACTS Controllers b) With FACTS Controllers
Figure 4.13: Voltage magnitude profile after installing FACTS Controllers
Figure 4.13 shows the voltage magnitude profiles for the wind integration system with and without
UPFC using testing method 3. Graph shows that the voltage magnitude was improved after installing FACTS
Controllers. Figure 4.14 shows more details about the power flow results for voltage magnitude profile.
Journal of Energy Technologies and Policy www.iiste.org
ISSN 2224-3232 (Paper) ISSN 2225-0573 (Online)
Vol.6, No.8, 2016
36
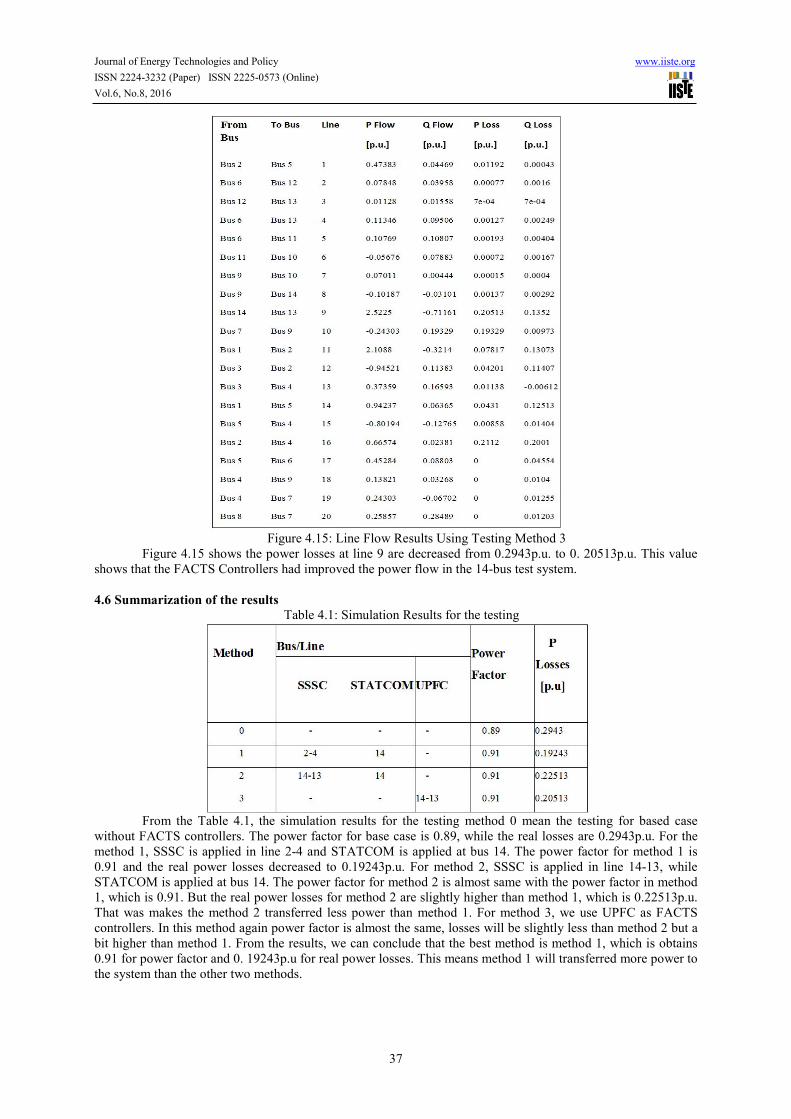
Figure 4.14: Power Flow Results Using Testing Method 3
Figure 4.14 shows the power flow results for the wind integration system with UPFC using testing
method 2. We can see the voltage magnitude for bus 14 increased from 0. 99695p.u to 1.045p.u.
Journal of Energy Technologies and Policy www.iiste.org
ISSN 2224-3232 (Paper) ISSN 2225-0573 (Online)
Vol.6, No.8, 2016
37
Figure 4.15: Line Flow Results Using Testing Method 3
Figure 4.15 shows the power losses at line 9 are decreased from 0.2943p.u. to 0. 20513p.u. This value
shows that the FACTS Controllers had improved the power flow in the 14-bus test system.
4.6 Summarization of the results
Table 4.1: Simulation Results for the testing
From the Table 4.1, the simulation results for the testing method 0 mean the testing for based case
without FACTS controllers. The power factor for base case is 0.89, while the real losses are 0.2943p.u. For the
method 1, SSSC is applied in line 2-4 and STATCOM is applied at bus 14. The power factor for method 1 is
0.91 and the real power losses decreased to 0.19243p.u. For method 2, SSSC is applied in line 14-13, while
STATCOM is applied at bus 14. The power factor for method 2 is almost same with the power factor in method
1, which is 0.91. But the real power losses for method 2 are slightly higher than method 1, which is 0.22513p.u.
That was makes the method 2 transferred less power than method 1. For method 3, we use UPFC as FACTS
controllers. In this method again power factor is almost the same, losses will be slightly less than method 2 but a
bit higher than method 1. From the results, we can conclude that the best method is method 1, which is obtains
0.91 for power factor and 0. 19243p.u for real power losses. This means method 1 will transferred more power to
the system than the other two methods.

Journal of Energy Technologies and Policy www.iiste.org
ISSN 2224-3232 (Paper) ISSN 2225-0573 (Online)
Vol.6, No.8, 2016
38
5. Conclusion
5.1 Research Conclusion:
The purpose of this project is to identify the effect of hybrid FACTS controllers in term of power factor and
power quality improvement when implement it in power system. Three methods are used and several
simulations have been run in MATLAB/PSAT to test the 14-bus system with and without FACTS controllers.
The performance of each FACTS controllers used have been evaluated. Therefore, it could be concluded that
specific type of FACTS controllers would improves some of the power system parameters, by placing it at
the critical locations. This project has successfully tested at the 14-bus test system and optimal location of
STATCOM, SSSC and UPFC also had been determined refer to the voltage magnitude and power losses.
The performance of the power system with different location of the device had been analyzed and found that
SSSC and STATCOM give better results when installing them at two different locations having low voltage
magnitudes than UPFC. Because UFPC can be installed just at single location of low voltages, but
STATCOM and SSSC can be installed at two different location having low voltages magnitudes.
5.2 Future Recommendation
There are few recommendations for future work for improving this project. These are follow:
• Test the system using others FACTS controllers such as SVC and TCSC because different device
can show different effect for power factor improvement.
• Test the system using other simulation software like PSCAD, POWERWORLD, and other software
because different software using different coding and different method.
• Test the FACTS controllers on a very large network, to view its capability handling complex
network. Find and develop new method to improve power system delivery quality for reduce losses
and improve power factor, voltage stability and other.
References
[1] S. K. Khadem, M. Basu and M.F. Conlon,"Power quality in grid connected renewable energy
systems,"Role of Custom Power Devices. School of Electrical Engineering Systems. Dublin Institute of
Technology. 2010.
[2] I.El-Samahy, El-Saadany,"The effect of DG on power quality in a deregulated environment,"IEEE Power
Engineering Society General Meeting 2005. 2969-2976.
[3] F. Wu, X. Zhang and Ping Ju,"Impact of wind turbines on power system stability,"Bulk Power System
Dynamics and Control - VII. Revitalizing Operational Reliability, 2007 iREP Symposium, Charleston, SC,
2007, pp. 1-7.doi: 10.1109/IREP.2007.4410535
[5] G.Fandi, Z. Muller,L. Straka and J. Svec,"FACTS devices influence on power losses in transmission
systems,"Electric Power Engineering (EPE), Proccedings of the 2014 15th International Scientific
Conference on, Brno, 2014, pp. 29-33.doi: 10.1109/EPE.2014.6839431
[5] B.Gopinath and C.Keerthana,"Simultaneous tuning of power system damping controllers using Pi
controller,"International Journal of Communications and Engineering. Volume 04 – No.4. Issue: 04
March2012. 24-30.
[6] L. Gyugyi,"The Unified Power Flow Controller a new approach to power transmission controller,"IEEE
Transaction of Power Delivery. Volume 10, No. 2, April 1995, 1085-1097.
[7] N.G. Hingorani,L. Gyugyi,"Understanding FACTS, concepts and technology of Flexible AC
Transmission Systems,"IEEE Press 2000.
[8] S. Amara and H. Abdallah Hsan,"Power system stability improvement by FACTS devices: A comparison
between STATCOM, SSSC and UPFC,"2012 First International Conference on Renewable Energies and
Vehicular Technology, Hammamet, 2012, pp. 360-365.doi: 10.1109/REVET. 2012.6195297
[9] A. Kumar Sahoo,"An Improved UPFC control to enhance power system stability,"Modern Applied
Science. Vol. 4, No. 6; June 2010. 37-48
[10] L.A.S. Pilotto, W.F. Long and A. Edris."Determination of needed FACTS controllers that increase asset
utilization of power systems,"IEEE Transactions on Power Delivery, Vol. 12, No 1, January 1997. 364-371.


![Power Quality Improvement using Voltage Source Converter ... · power quality offered by the harmonic sensitive loads [5]. 2. THE UNIFIED POWER QUALITY CONDITIONER nified Power Quality](https://static.fdocuments.net/doc/165x107/5ed3578b4e15b65b4670b614/power-quality-improvement-using-voltage-source-converter-power-quality-offered.jpg)