Improving Visitor Evaluation at the British Museum · British Museum could use to track visitors....
60
Improving Visitor Evaluation at the British Museum by Karla Cuellar Erinn Jambor Parshon Sorornejad Samuel Talpey May 12 th , 2020
Transcript of Improving Visitor Evaluation at the British Museum · British Museum could use to track visitors....

Improving Visitor Evaluation at the British Museum
by
Karla Cuellar
Erinn Jambor
Parshon Sorornejad
Samuel Talpey
May 12th, 2020

Improving Visitor Evaluation at the British Museum
An Interactive Qualifying Project
submitted to the Faculty of
WORCESTER POLYTECHNIC INSTITUTE
in partial fulfillment of the requirements for the
degree of Bachelor of Science
by
Karla Cuellar
Erinn Jambor
Parshon Sorornejad
Samuel Talpey
Date:
May 12th, 2020
Report Submitted to:
Stuart Frost
Head of Interpretation
British Museum
Dominic Golding and Suzanne LePage
Worcester Polytechnic Institute
This report represents the work of WPI undergraduate students submitted to the faculty as evidence of
completion of a degree requirement. WPI routinely publishes these reports on its website without
editorial or peer review. For more information about the projects program at WPI, please see
http://www.wpi.edu/academics/ugradstudies/project-learning.html

i
Abstract
The purpose of this project was to collaborate with the Interpretation Team at the British
Museum to streamline the process of visitor evaluation. We reviewed best practices and
technologies used in visitor evaluation by museums in general and the British Museum in
particular. We developed an innovative toolkit for conducting visitor evaluation studies and
visualizing the results in easy and intuitive ways. We used a temporary display room, Room 3, as
the baseline for our approach. The team devised a README file to instruct the Museum staff and
volunteers how to bridge the tools together. We recommend the British Museum use tools like
Microsoft Excel and Visio and SurveyJS to obtain the necessary materials to gather, analyze, and
visualize data using our prototype toolkit application.

ii
Acknowledgments
We would like to recognize the individuals who have supported our team during the past
seven weeks, especially due to the presence of the COVID-19 pandemic during the time of this
project. Their guidance and advice were greatly appreciated throughout the remote implementation
of our project.
We would first and foremost like to thank our sponsoring organization, the British
Museum, for partnering with Worcester Polytechnic Institute and giving us the opportunity to work
with them despite the unexpected circumstances. We would like to especially thank Stuart Frost,
Head of Interpretation, for his guidance and dedication.
We would also like to thank one of our fellow WPI students, Revant Mahajan, for
recommending key libraries that were used in development. His explanation of his own similarly
focused work was of great use in designing our application.
Finally, we would like to acknowledge the faculty from Worcester Polytechnic Institute
who advised us throughout this project from beginning to end. Thank you to Professors Dominic
Golding and Suzanne LePage for their constant guidance and efforts to help us successfully
implement this project. We are thankful for the work that they have done to make our project
possible and to keep our project on the right path during the last seven weeks. Their continued
support and dedication to advising not only our team but all of the London project groups during
these challenging times helped make this process as seamless as possible.
Thank you.

iii
Executive Summary
Museums are using visitor experience and audience studies to learn more about visitor
interests and expectations so they can improve the entire visitor experience and enhance learning.
The British Museum aims to better understand the impact that the Museum has on its visitors and
to do so, it requires better and more practical tracking tools that would also allow them to analyze
this data. For larger galleries and special exhibitions, the Museum typically hires outside
consultants to conduct evaluations using best practices. Many other smaller evaluations are
conducted in-house by staff, students, and volunteers. Due to a lack of resources and technology,
most of these in-house evaluations use pen-and-paper methods to collect observational and exit
survey data. These methods necessitate cumbersome and time-consuming data entry and analysis.
Thus, the Museum is seeking an innovative digital tool to help streamline this process of data
collection, analysis, and visualization. The goal of this project was to develop this tool. Our project
had two objectives:
1. Review best practices and available technologies used in museum visitor evaluation
2. Develop and suggest an innovative toolkit for use in easily conducting visitor evaluation
studies and visualizing the gathered data
We used an understanding of visitor evaluation and tracking techniques as well as software
available across multiple platforms to complete these objectives.
We first sought information on visitor observation and tracking methods and potential
software tools used by museums to analyze and visualize gathered data. Originally, we set out to
conduct interviews with experts in the field of visitor studies to gather their insight on potential
tools or ideas for innovative evaluation tools. However, given the circumstances of COVID-19,
our research was limited to reviewing previous evaluation studies conducted by the British
Museum and peer reviewed literature written by museum and visitor evaluation experts.
We identified multiple methods, including Bluetooth, GPS, LIDAR sensors, radio
frequency identification (RFID), ultra-wideband (UWB), and ultrasound, as possible tools that the
British Museum could use to track visitors. None of these tools would be a realistic option for the
Museum, however, due to their lack of accessibility, cost, and difficulty to implement and maintain
(Montanes, Rodriguez, & Prieto, 2013).
Once data is collected, there are many different options for visualizing visitor movement
data depending on the desired analysis. One way visitor movements can be shown is through

iv
having each visitor be represented by a different color when their path is tracked. This shows the
complete movement of each visitor, nor the holding power of each object or area. Heat maps are
another way visitor movement can be visualized. Heat maps are beneficial because they intuitively
and concisely show the holding power of areas and objects. Another way to visualize tracking data
is by using decay curves or other analytical graphs. Decay curves can show the dwell time of the
visitors and how long they remained in the exhibit.
Following our review of best practices, we obtained information on the current protocols
that the Museum staff and volunteers follow for their visitor evaluation studies. The most pressing
issue with the Museum’s current visitor evaluation system is that the pen-and-paper evaluation
sheets must be completed by hand and then manually input into a system for data visualization.
This method of visitor evaluation leads to several intermediate steps that are required for data to
be gathered, processed, and then visually depicted for accurate understanding. Thus, we aimed for
finding improved methods that would expedite transition between data entry and data
visualization. To complete this task, we opted to focus on a small-scale example to create a
foundation for developing and testing tools that could be used in a larger scale setting. Therefore,
we targeted Room 3 as the baseline to develop and test the toolkit.
Using the gathered information from our research on the Museum’s current practices, we
developed a set of design criteria. We needed a toolkit that would be able to handle all aspects of
visitor evaluation, including the gathering and analysis of data pertaining to interviews,
observations, and visitor tracking. Most importantly, the Museum desired tools that would not only
streamline the process of gathering and analyzing data, but also visualizing the data so that the
entirety of the Museum staff would understand the information. To do so, we needed to find tools
that were easily accessible to both our team and the Museum.
Due to the Museum’s relatively low budget on software, we required tools that were
inexpensive and/or readily available on almost all devices. In the case of the British Museum, the
Microsoft Office Suite is available on all of their systems, which meshed well with our design
criteria and solved the issue of both budget and availability for features such as designing floor
plans. It was essential that we devised a toolkit that was not only easily manipulated, but that could
be picked up and used by all Museum staff and volunteers.
Microsoft Visio was explored as a potential software for use in streamlining the process of
gathering and visualizing tracking data. Visio provides a simplistic toolkit that can be used to

v
create floor plans in a short amount of time. The program uses a scaled measuring system to allow
the user to make designs as accurate as possible. Visio’s ease of use may be useful for the Museum,
for it provides the Interpretation Team with a platform to design, create, and modify floor plans
for its different galleries and exhibits. Although Visio has a function that allows data to be
attributed to different objects in a floor plan, it does not provide an intuitive or visually exciting
way of representing the data.
Microsoft Power Map was explored as a possibility for creating dynamic 3D maps that
display data in an intuitive way over existing floor plans. This is because Power Map provides
more insight than a 2D map and better visual representation of information. It allows for spatial
and temporal data to be visible on custom maps created with images of floor plans. Ideally, this
tool provides the Museum with an innovative and different way of presenting the information they
seek with their tracking studies for their own analysis and evaluations.
Additionally, we explored another important aspect of visitor evaluation, which includes a
better way of conducting exit interviews and surveys digitally. Multiple survey tools were
considered and compared according to criteria discussed verbally on multiple occasions with
Stuart Frost. We considered that the three best options are Survey Monkey, Survey Legend, and
Survey Anyplace.
However, as we moved towards integrating spatial tracking with volunteer observations,
we learned of SurveyJS. SurveyJS is an online tool that allows for surveys and forms to be added
into a website or app by producing code that can be easily implemented into the backend code of
the web application. It allows for:
● Different options of question formatting that can be edited at any point
● Offline collection of data if the application running the survey allows for it
● Unlimited responses that can be exported if the application allows for it
● No cost to the Museum
Most importantly, SurveyJS allowed us to potentially incorporate observations and surveys
into a tracking application. Given these advantages, we selected this tool moving forward.
Development of the toolkit and a unifying application changed in scope multiple times
throughout this project, eventually becoming a prototype for our toolkit application thanks to new
information. In order to use the toolkit as a cohesive unit, it was designed as a static webpage that
displays all the information and tools necessary for tracking.
vi
The app was designed with modularity in mind, such that users can change the survey or
floor plan within the tool with ease; all a user must do is move the proper files (e.g. image,
coordinates, survey) into the same folder as the application, or into a file for storing said
information. This way, users require no technical knowledge to be able to use the toolkit. The
application is also able to upload the results of a tracking study to a spreadsheet at the user’s
request, preventing the need for manual entry of observations and exit interview results. As the
app is only a prototype, it is restricted in some ways. For example, the tool is designed to upload
one study at a time, i.e., the user must create and insert new floor plans for every room they wish
to study. Once the tools were assembled and operational, the team devised a README file
(Appendix A) to instruct the Museum staff and volunteers on how to prepare and use the suggested
tools for future evaluation studies. In addition to in-line commenting within the code itself, so as
to improve readability and comprehension for future editors, the README document also
provides information on how to utilize the application and its accompanying tools.

vii
Authorship
Title Primary
Author
Secondary
Author
Primary
Editor
Secondary
Editor
Abstract All PS EJ
Acknowledgments PS, EJ & KC
Executive Summary All PS EJ
Authorship PS, EJ & KC
Table of Contents KC PS
Introduction PS, EJ & KC EJ & KC PS
Background All All
Section 2.1 EJ ST PS
Section 2.2 PS & ST ST PS
Section 2.3 All ST PS
Methodology EJ ST All
Section 3.1 PS All
Section 3.2 PS All
Section 3.3 ST PS All
Findings ST All
Section 4.1 EJ & KC All
Section 4.2 PS, ST & KC All
Conclusions and
Recommendations
PS All
Aside from the writing and editing of this report, the team did a considerable amount of
work to complete this project and provide the British Museum with useful and functional tools.
Erinn researched the pros and cons of several tools used in the museum sector today. Karla and
Parshon explored readily available tools from the Microsoft Office Suite like Excel and Visio.
Once the tools were assembled, they were worked into a prototype web application that was mainly
designed and developed by Sam. Karla aided in the prototype development by using SurveyJS to
write and format the survey script and acquire the necessary code.
viii
Table of Contents Abstract .........................................................................................................................................................................i
Acknowledgments ....................................................................................................................................................... ii
Executive Summary ................................................................................................................................................... iii
Authorship................................................................................................................................................................. vii
Table of Contents ..................................................................................................................................................... viii
List of Figures .............................................................................................................................................................ix
List of Tables ................................................................................................................................................................ x
Chapter 1: Introduction .............................................................................................................................................. 1
Chapter 2: Background ............................................................................................................................................... 2
2.1 The Functions and Evolutions of Museums ........................................................................................................ 2
2.2 The Growth of Visitor Studies ............................................................................................................................ 3
2.2.1 Importance of Visitor Studies ...................................................................................................................... 4
2.2.2 Understanding Visitor Motivations .............................................................................................................. 5
2.2.3 Visitor Demographics .................................................................................................................................. 5
2.2.4 Practices in Visitor Studies .......................................................................................................................... 6
2.3 Visitor Tracking at the British Museum .............................................................................................................. 9
Chapter 3: Methodology ........................................................................................................................................... 10
3.1 The Effects of COVID-19 On Our Project Methodology ................................................................................. 10
3.2 Objective 1: Review Best Practices and Available Technologies Used in Museum
Visitor Evaluation ............................................................................................................................................. 11
3.3 Objective 2: Develop and Suggest an Innovative Toolkit for Use in Easily Conducting
Visitor Evaluation Studies and Visualizing the Gathered Data ......................................................................... 12
Chapter 4: Findings ................................................................................................................................................... 13
4.1 Objective 1: Review Best Practices in Visitor Evaluation Used in the Museum Sector and Current
Technologies Available ..................................................................................................................................... 13
4.1.1 Existing Tools and Best Practices .............................................................................................................. 13
4.1.2 Visualizing Data......................................................................................................................................... 16
4.1.3 Survey Tools .............................................................................................................................................. 18
4.2 Objective 2: Develop and Suggest an Innovative Toolkit for Use in Easily Conducting
Visitor Evaluation Studies and Visualizing the Gathered Data ......................................................................... 19
4.2.1 Improving the Process of Gathering, Recording, and Analyzing Data ...................................................... 20
4.2.2 Toolkit Design Criteria .............................................................................................................................. 23
4.2.3 Microsoft Visio .......................................................................................................................................... 23
4.2.4 Power Map for Microsoft Excel ................................................................................................................. 24
4.2.5 Assembling the Toolkit .............................................................................................................................. 25
Chapter 5: Conclusions and Recommendations ..................................................................................................... 28
References .................................................................................................................................................................. 29
Appendix A: Evaluation Toolkit README ............................................................................................................ 33

ix
List of Figures
Figure 1: Project Goal and Objectives 10
Figure 2: Trace Map of a Visitor in an Exhibit 16
Figure 3: Heat Map of Visitor Flow in the British Museum 17
Figure 4: Decay Curve of Dwell Time 17
Figure 5: Room 3 Location on Level 0 of the British Museum 21
Figure 6: Application Screen When Recording Observations 25
Figure 7: Application Screen Upon Completing Exit Survey 27

x
List of Tables
Table 1: Timing and tracking study variables 7
Table 2: Advantages and Disadvantages of Existing Tracking Tools 15
Table 3: Comparison of Survey Tools 18
Table 4: Standard iPad Survey Questions Used for Every Show in Room 3 22
Table 5: Toolkit Design Criteria 23

1
Chapter 1: Introduction
Using visitor evaluation studies, museums improve the visitor experience and gain a better
understanding of how galleries and exhibits convey information. Through observation, tracking,
and surveys, museums gather data on visitors that they can use to generate powerful visuals that
describe how visitors interact with the Museum’s objects. Museums use a variety of methods to
conduct visitor evaluations, ranging from the use of visitor tracking technology such as Bluetooth
and GPS, to conducting pen-and-paper evaluations using face-to-face interviews and surveys.
Using this data, museums seek to generate powerful visuals that display the collected data in an
easily understandable and interesting way.
Currently, the British Museum uses two main methods of conducting visitor evaluations:
consultant-led evaluations of large galleries and smaller in-house studies. While the large-scale
evaluations provide the Museum with an easy method of gathering data and quickly receiving an
analysis of that data, the in-house studies are much more tedious to perform. According to Stuart
Frost, Head of Interpretation at the British Museum, the current pen and paper tracking methods
in use at the Museum are not time-efficient and lead to difficulties in processing and visualizing
the gathered data. Although the Interpretation Team works on a relatively small budget with
limited resources, the Museum sought to improve its methods of visitor evaluation to obtain a
better grasp of the visitor experience.
The goal of this project is to help the British Museum improve its methods of visitor
evaluation. To accomplish this goal, we identified two objectives:
1. Review best practices and available technologies used in museum visitor evaluation
2. Develop and suggest an innovative toolkit for use in easily conducting visitor evaluation
studies and visualizing the gathered data
To accomplish these objectives and our overall goal, we conducted research on current and
best practices used at the British Museum and other museums, respectively. We also developed
design criteria through discussions with Stuart Frost and by reviewing available software to
develop and suggest an innovative toolkit. We then designed the toolkit using open-source
software and proprietary software packages, including Microsoft Excel and Visio and SurveyJS.
We compiled our observations and findings into a README file (Appendix A) that was provided
to the Interpretation Team to further improve their methods of evaluating visitors.

2
Chapter 2: Background
In this chapter, we discuss the primary functions of museums and explore how museums
have evolved to meet changing visitor needs and expectations. Museums continue to implement
visitor evaluation studies to better understand visitor behaviors and preferences so they can
improve the visitor experience.
2.1 The Functions and Evolutions of Museums
Over the centuries, museums developed from single room collections closed off to the
general public, into major tourist attractions housing thousands of artifacts in large buildings.
Although museums evolved dramatically in the last 150 years, the main purpose has remained the
same: to enlighten people (Weil, 1999). The missions of individual museums range from research
to social impact, but the primary underlying purpose is to inform and educate the public through
their collections, research, exhibits, and programs. Every museum accomplishes its mission
through different means, but the end result is the same; sharing the knowledge that has been
carefully accumulated and curated.
Museums are shifting away from a collection-focused model towards a new model that
better serves the public. Museums are working to make positive contributions to their visitor’s
quality of life and to enhance the community at large (Weil, 1999). Museums are now viewed as
places of communal empowerment where visitors can experience the past to better understand the
future. According to the International Council of Museums (2019), museums “work in active
partnership with and for diverse communities to collect, preserve, research, interpret, exhibit, and
enhance understandings of the world, aiming to contribute to human dignity and social justice,
global equality, and planetary wellbeing.” Museums are much more than a building, they are places
of knowledge, learning, and appreciation. Each individual that visits the museum is impacted by
the experience and the learning that takes place therein. Falk and Dierking (2018) suggest that
“learning is an ongoing dialogue between the whole individual, and the physical and sociocultural
world they are in” (p. 7). The three learning contexts of personal, sociocultural, and physical are
not separable but instead add layers to the gradual process of not just learning, but understanding.
Learning is more than cognitive development but entails also changes in awareness, attitudes, and
skills (Falk and Dierking, 2018). Every aspect of the museum is deliberated to ensure that learning
in all three contexts is achievable for every individual. The exhibits are designed to maximize

3
learning potential; and even the design of the museum buildings and galleries affects the learning
experience. From the moment the visitor first lays eyes on the exterior of the museum, an
impression and impact are made.
Museums are continuously evolving to better meet the needs and expectations of visitors.
What used to be a silent building of white walls and polished stone is now becoming noisy, vibrant,
engaging, and interactive. Museums like the Exploratorium in San Francisco and the Museums of
Science and Industry in Chicago are changing the way visitor engagement is perceived and
encouraged. Griffin (2008) states that museums have now become “engaging, educational and
entrepreneurial organizations that are dedicated to building audiences and collections” (p. 46). The
ways people learn are expanding, and new technologies allow for visitors to interact with exhibits
in ways never before imagined (Griffin, 2008). Museums are continuously looking for ways to
allow and encourage visitor engagement, be that through museum apps, audio guides, online
exhibits, and even physically interacting with the exhibit itself.
To improve the visitor experience, museums need to be reflective of their exhibits,
understand their audiences, and listen to their needs (Trofanenko & Segall, 2014). Improving
visitor experience also depends on how the collection is managed as well as the research on the
collection, as both contribute towards delivering a quality experience to the visitors (Griffin, 2008).
Understanding and communicating with visitors is essential to the development of public programs
that can make a museum successful. The goal of museums is to enlighten the public, and learning
is more successful when the experience is memorable and enjoyable (Griffin, 2008).
2.2 The Growth of Visitor Studies
Most systematic observation conducted in museums goes back to the 1990s, with relatively
little before then (Yalowitz & Bronnenkant, 2009). The work that most consider being the first in
the field was conducted in the 1930s. The original research conducted by William S. Robinson and
Arthur W. Melton introduced the concept of evaluating visitors via psychology, their academic
field of study, focusing on behavioral characteristics (Hein, 1998). In 1935, Melton conducted the
first detailed study of timing and tracking visitors, opening up what is now a common form of
visitor evaluation. Several of Melton’s findings ring true today, such as the notions of the attracting
power and holding power of exhibits, as well as the observation that most visitors spend minimal
amounts of time in galleries or at specific exhibits (Hein, 1998). Melton and Robinson

4
demonstrated the value of visitor studies for improving the design of exhibits and galleries, but
surprisingly little additional visitor research was conducted until the 1980s. Since the 1980s,
however, visitor or audience research has become an integral part of museum operations. An
enormous amount of research has been conducted on numerous aspects of visitors and their
behaviors in museums, especially regarding how visitors interact with exhibits and how they travel
throughout museums (Yalowitz & Bronnenkant, 2009). The field of visitor studies has shifted
museums from an expert-centric view to a more visitor-centric view; museums are focusing on
their visitors and how to provide the best experience for them, as opposed to dictating the flow and
medium of information themselves. This can take the form of restructuring galleries, adding new
educational programs, or creating interactive methods of learning.
2.2.1 Importance of Visitor Studies
Serrell (1997) suggests that “part of a museum practitioner’s job is to encourage diverse
populations in the activities of learning and discovery and to adapt their exhibitions to reach the
largest possible audience” (p. 108). Without understanding how an audience will react to a
particular exhibit, it is difficult for museum practitioners to know how effectively their exhibitions
convey their intended message or information. Although early visitor studies initiatives,
particularly those in the United States, were used to “measure the outputs of exhibitions and
educational programs for funders and sponsors” (Hooper-Greenhill, 2007, p. 366), the field has
since evolved. As Serrell (1997) notes, observing the behavior, understanding, and movement of
visitors within exhibitions provides museum practitioners with useful data in their efforts to expand
their reach to a larger audience (p. 108).
The information that museum practitioners learn through visitor studies allows them to
identify and improve upon ineffective or confusing areas of exhibitions, gallery designs, and
facilities such as the cafe and bathrooms. In doing so, museum practitioners are able to provide an
exhibition design that better matches visitor expectations. As Sheng and Chen (2012) claim, visitor
expectations are an important but neglected area of visitor studies (p. 53). Understanding visitor
expectations is important to museums because gauging the expectations of those who come to see
the museum prior to their time inside makes studying the visitor experience during a given visit
simpler and more concise (p. 53). This is because visitor experience is not a static process, but
rather one that changes as time progresses during a museum visit (Falk & Dierking, 2012).
5
The concept of an actively changing visitor experience means that museums should strive
to keep visitors satisfied with constant improvements where and when possible. The information
that visitor observation provides allows museum practitioners to do so by making exhibitions both
more informative as well as more intellectually and physically accessible to future visitors.
Hooper-Greenhill (2007) describes how knowing a visitor’s level of understanding of an exhibition
is useful to those who design the exhibitions, allowing them to better assist visitors in
understanding the purpose and scope of an exhibition (p. 366). Satisfaction goes beyond the
experience within the exhibitions themselves, for Sheng and Chen (2012) suggest that the visitor
experience “usually includes visitors’ opinions of functions (e.g., food and transportation), sensory
stimulation (e.g., the attraction of buildings), and emotional description” (p. 53). As we observe
the visitor experience within the entirety of the British Museum, it is important to understand that
these concepts are key aspects of the visitor experience.
2.2.2 Understanding Visitor Motivations
Learning is a major reason why people visit museums. Museums provide the opportunity
to learn something new by immersing oneself in the topic. Visitors are looking to sate their
curiosity and many of them feel self-fulfillment from learning something new (Slater, 2007).
However, people visit museums for far more reasons than merely to learn or experience something
new. Museums are often used as an escape from everyday life. Leisure is a large part of people's
lives and museums are becoming more popular as a source of relaxation. Many people use
recreational time as a way to better understand themselves and the world, which is why many are
choosing to visit museums. In America, museums rank as one of the most popular leisure
experiences outside of the home (Falk & Dierking, 2018). People also visit museums to satisfy a
personal or sociocultural need that can only be met through a museum experience (Falk &
Dierking, 2012). Museums allow for family and friends to spend quality time together, as well as
to experience and learn something new.
2.2.3 Visitor Demographics
Falk (2009) concluded that individuals who visit museums are typically “better educated,
more affluent, and hold better-paying jobs than the average citizen” (p. 28). Adults between the
ages of 25 and 44 account for nearly half of the total visitation at the Museum, and family groups
6
are a dominant demographic group within museums (Falk, 2009, p. 28; Sheng & Chen, 2012, p.
59). The role of family groups within museums is important, for Sheng and Chen (2012) emphasize
that visitor expectations and motivation for visiting museums are based on family life cycles.
Falk and Dierking (2012) note that demographic composition may change over time and
that museums must cater to the expectations and interests of a wide variety of ages, ethnicities,
and generations (p. 189). Demographics analysis is useful, but due to its changing nature, it does
not provide comprehensive insight into the overall visitor experience. Hooper-Greenhill (2007)
suggests that “in order to understand the sense that visitors make in museums, it is not enough to
observe what people do, and it is not enough to ask demographic questions” (p. 373). Instead, the
focus should be placed on understanding how visitors frame their experience rather than improving
methods of observation (p. 373). Falk (2009) agrees with this idea, stating that “variables like age,
gender, race/ethnicity, and generation do tell us something about individuals but they tell virtually
nothing about how these individuals might relate to museums” (p. 31).
2.2.4 Practices in Visitor Studies
Visitor evaluation is an evolving field. Most of the early visitor studies were summative
evaluations (Korn, 1994). Summative evaluation is the process of collecting information after an
exhibit is installed or a program has ended to assess performance against expectations and identify
opportunities for improvement. As the field progressed, other forms of evaluation developed
including both formative and front-end evaluation. These methods differ in the time of evaluation.
Formative evaluation focuses on collecting information for the design process, whereas front-end
evaluation collects information during planning and development. In the discussion below we
focus on timing & tracking studies that are often used in summative evaluations (Korn, 1994).
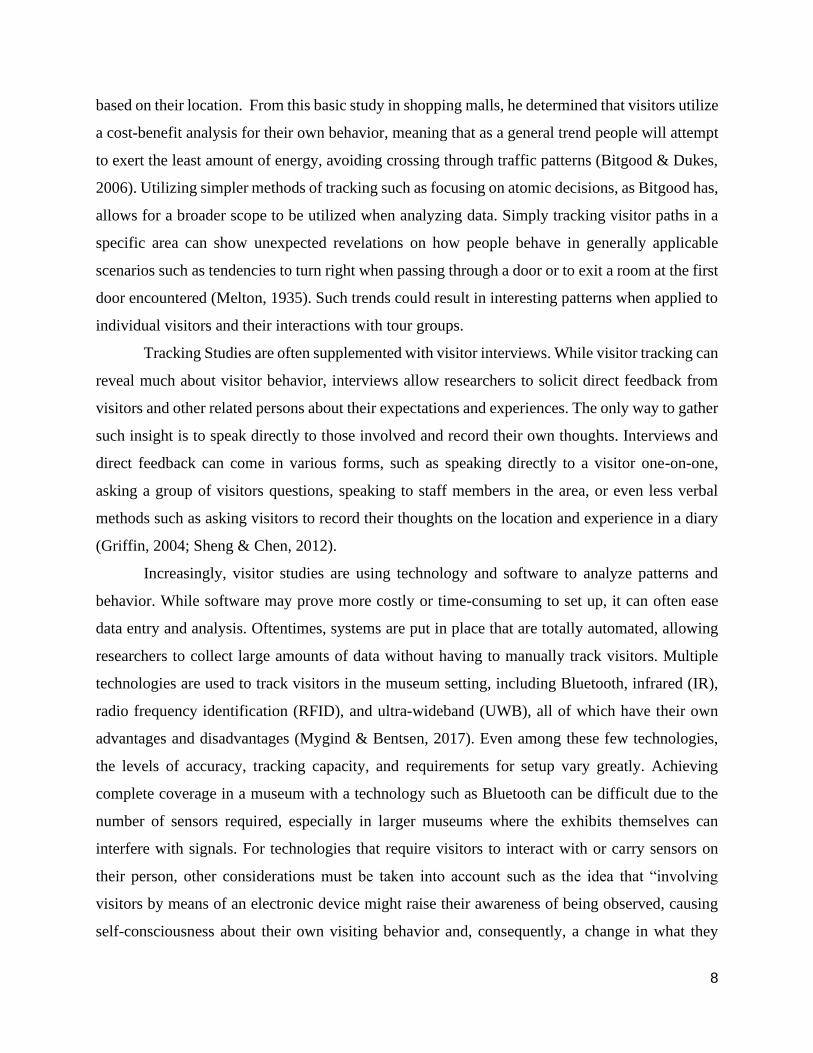
The variables that are typically observed in tracking and timing studies “fall into four
categories [see Table 1]: 1) stopping behaviors, 2) other behaviors, 3) observable demographic
variables, and 4) situational variables” (Yalowitz & Bronnenkant, 2009, p. 49). Stopping behaviors
that are typically recorded range from the time spent at a specific exhibit, to the time spent in a
gallery or even the time spent in the museum as a whole. Since it is often difficult to measure
learning associated with a particular exhibit or museum visit, researchers have often assumed that
‘dwell times’ are good surrogate measures of visitor engagement. The longer visitors stay at an
exhibit, the more we assume they are engaged. In turn, the more visitors are engaged, the more we

7
assume they are learning (Lanir et al., 2016). Other behaviors of visitors (Table 1) refer to
interactions with the museum and persons within it. Researchers often trace the paths that visitors
take through a museum, to infer which exhibits are more attractive, to identify bottlenecks that
impede visitor flow, and to identify improvements in wayfinding or signage. Social interactions
with other visitors as well as museum staff or volunteers are also important factors. Conversations
among and between group members have been used as indicators of the level of interest and
engagement among visitors (Leinhardt, Knutson, & Crowley, 2003). Outside of visitor behavior,
there are other variables to consider such as demographics. Demographics can provide potential
insight to the actions of visitors and their behavior due to various factors such as age, culture or
gender. When recording demographic information, it is important to factor the margin of error into
any observations or conclusions made. When observing visitors, guesswork must be done to
assume certain variables without interacting with the persons and thus altering their behavior.
Context must always be taken into account, and in this case, it is described through situational
variables. These are part of a very broad category composing of most anything that could affect
visitors depending on the situation. Anything from levels of foot traffic to the month or day or
even time of day can all affect visitor behavior. Other factors such as museum staff, facilities, or
other experiences/programs available can also change the actions visitors take (Yalowitz &
Bronnenkant, 2009).
Table 1: Timing and tracking study variables. Adapted from Yalowitz & Bronnenkant (2009, pp. 49-50)
Yalowitz & Bronnenkant (2009) state that one of the leading researchers in the field during
the early surge of visitor studies was Dr. Stephen Bitgood (p. 47). One of the more fundamental
studies he conducted was on the simple interaction of what pedestrians will do at an intersection
8
based on their location. From this basic study in shopping malls, he determined that visitors utilize
a cost-benefit analysis for their own behavior, meaning that as a general trend people will attempt
to exert the least amount of energy, avoiding crossing through traffic patterns (Bitgood & Dukes,
2006). Utilizing simpler methods of tracking such as focusing on atomic decisions, as Bitgood has,
allows for a broader scope to be utilized when analyzing data. Simply tracking visitor paths in a
specific area can show unexpected revelations on how people behave in generally applicable
scenarios such as tendencies to turn right when passing through a door or to exit a room at the first
door encountered (Melton, 1935). Such trends could result in interesting patterns when applied to
individual visitors and their interactions with tour groups.
Tracking Studies are often supplemented with visitor interviews. While visitor tracking can
reveal much about visitor behavior, interviews allow researchers to solicit direct feedback from
visitors and other related persons about their expectations and experiences. The only way to gather
such insight is to speak directly to those involved and record their own thoughts. Interviews and
direct feedback can come in various forms, such as speaking directly to a visitor one-on-one,
asking a group of visitors questions, speaking to staff members in the area, or even less verbal
methods such as asking visitors to record their thoughts on the location and experience in a diary
(Griffin, 2004; Sheng & Chen, 2012).
Increasingly, visitor studies are using technology and software to analyze patterns and
behavior. While software may prove more costly or time-consuming to set up, it can often ease
data entry and analysis. Oftentimes, systems are put in place that are totally automated, allowing
researchers to collect large amounts of data without having to manually track visitors. Multiple
technologies are used to track visitors in the museum setting, including Bluetooth, infrared (IR),
radio frequency identification (RFID), and ultra-wideband (UWB), all of which have their own
advantages and disadvantages (Mygind & Bentsen, 2017). Even among these few technologies,
the levels of accuracy, tracking capacity, and requirements for setup vary greatly. Achieving
complete coverage in a museum with a technology such as Bluetooth can be difficult due to the
number of sensors required, especially in larger museums where the exhibits themselves can
interfere with signals. For technologies that require visitors to interact with or carry sensors on
their person, other considerations must be taken into account such as the idea that “involving
visitors by means of an electronic device might raise their awareness of being observed, causing
self-consciousness about their own visiting behavior and, consequently, a change in what they

9
believe to be desirable” (Mygind & Bentsen, 2017). When comparing software and technologies
to manual visitor tracking, it is often hard to determine if one is more effective or efficient than
the other. Even when set up, all technological systems are limited by the technology powering
them. In fact, the accuracy of many systems is easily achievable by manual methods, as the sensors
can only be so precise when covering such a large area (Mygind & Bentsen, 2017). While these
kinds of technologies offer many promising advantages for future tracking studies, direct
observation with pencil and paper tracking remains the dominant approach in the field.
2.3 Visitor Tracking at the British Museum
Museums are using visitor experience and audience studies to learn more about visitor
interests and expectations so they can improve the entire visitor experience and enhance learning.
The British Museum aims to better understand the impact that the Museum has on its visitors and
to do so, it requires better and more practical tracking tools that would also allow them to analyze
this data. Currently, the British Museum uses pen and paper tracking to gather the majority of its
information on the visitor experience. In larger galleries, the Museum opts for consultant-led
evaluations due to their ability to quickly gather information and submit reports to the Museum
staff for review. However, in smaller settings like exhibits, the Museum chooses to conduct in-
house evaluations. Due to a lack of resources and updated technology, the Museum struggles to
find data analysis and visualization tools to suit its needs for in-house evaluations.
The Museum is seeking an innovative data analysis and visualization digital tool for use in
tracking how visitors move throughout the building, their usage of Museum facilities, and how
visitors interact with the objects within its galleries. The aim is to understand the visitor experience
in order to provide insight on how to best redisplay, redesign, and reevaluate the Museum over the
next 20 years.

10
Chapter 3: Methodology
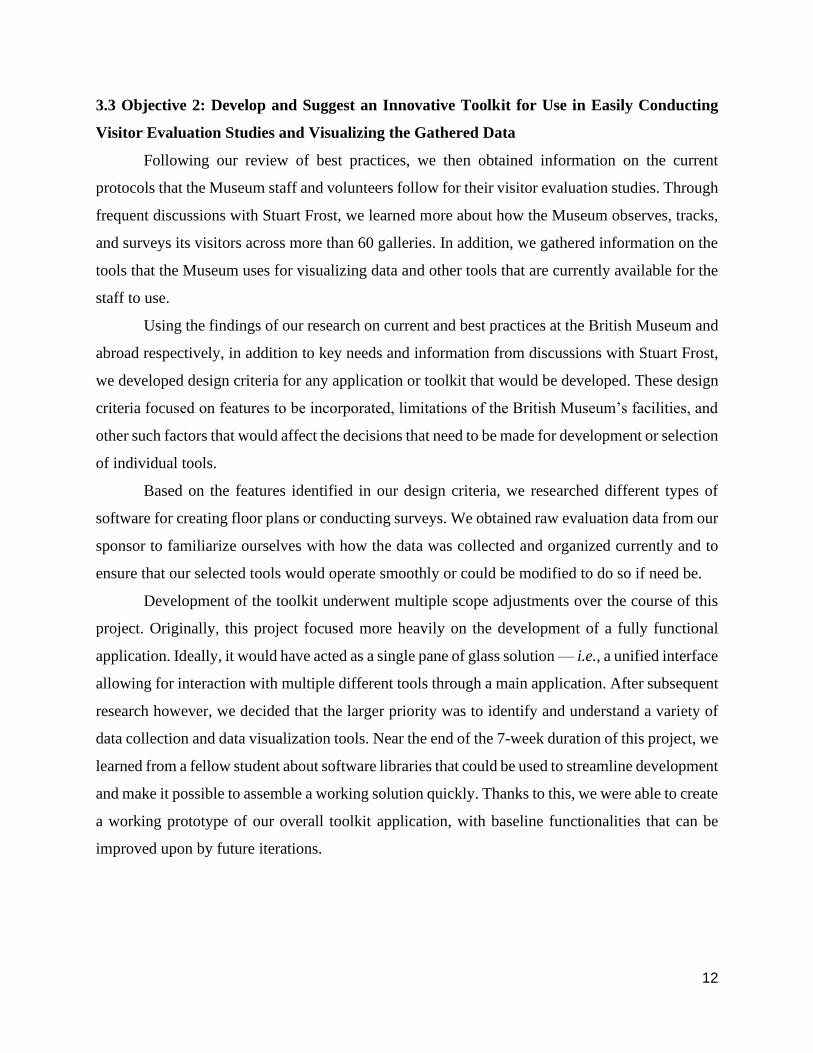
The goal of this project was to help the British Museum in improving its methods of visitor
evaluation. To achieve this, we pinpointed the following objectives:
1. Review best practices and available technologies used in museum visitor evaluation
2. Develop and suggest an innovative toolkit for use in easily conducting visitor evaluation
studies and visualizing the gathered data
We used an understanding of visitor evaluation and tracking techniques as well as software
available across multiple platforms to complete these objectives. Figure 1 outlines the objective
and the associated tasks needed to achieve that goal.
Figure 1. Project Goal and Objectives
3.1 The Effects of COVID-19 On Our Project Methodology
Due to circumstances presented by the COVID-19 pandemic during the implementation of
this project’s methodology, we did not conduct the project as initially intended. Initially, the plan
Help the British
Museum in improving
its methods of visitor
evaluation
Develop and suggest an
innovative toolkit for use
in easily conducting
visitor evaluation studies
and visualizing the
gathered data
Review available
software solutions
Review current
practices/tools at the
British Museum
Develop design criteria
Develop toolkit
Extend background
research on best practices
Review best practices
and available
technologies used in
visitor evaluation

11
was to complete this project on-site in the British Museum. However, as a result of COVID-19,
we conducted the entirety of this project remotely using services such as email and video calling
through the application Zoom.
Without the ability to physically or virtually work within the British Museum and observe
its visitor evaluation protocol, we based our analysis solely on literature review and consultation
with our sponsor liaison, Stuart Frost. We researched tracking tools that are currently being used
in the museum sector by reviewing literature through journals, museum studies, and databases. We
compiled a list of potential tools, including the advantages and disadvantages of each, and
evaluated them to determine if they would be a possibility for this project. Additionally, we were
unable to pre-test our tools to see how the information would be gathered, recorded, and visualized
in a live visitor evaluation study using our tools. Instead, we developed the tools using a set of
design criteria based on previous visitor evaluation data gathered from the British Museum
archives and the information gathered from our research of best practices in the museum sector.
Since we were not able to show the Museum staff and volunteers how the tools functioned
and the necessary steps to begin their use, we created a “How-To” document to provide a step-by-
step guide for preparing and using each of these tools for visitor evaluation studies. We also
provided components of a unified toolkit that we aimed to develop if more time and resources
were available to do so. We hope that these components may serve as a platform for a future team
to further develop so that the Museum may have an innovative tool to serve its needs in the future.
3.2 Objective 1: Review Best Practices and Available Technologies Used in Museum Visitor
Evaluation
Before we began the development of visitor evaluation tools, we first sought information
on the current best practices that museums use for conducting visitor evaluation studies. This
included information on visitor observation and tracking methods and potential software tools used
by museums to analyze and visualize gathered data. Originally, we set out to conduct interviews
with experts in the field of visitor studies to gather their insight on potential tools or ideas for
innovative evaluation tools. However, given the circumstances of COVID-19, our research was
limited to reviewing previous evaluation studies conducted by the British Museum and peer
reviewed literature written by museum and visitor evaluation experts.
12
3.3 Objective 2: Develop and Suggest an Innovative Toolkit for Use in Easily Conducting
Visitor Evaluation Studies and Visualizing the Gathered Data
Following our review of best practices, we then obtained information on the current
protocols that the Museum staff and volunteers follow for their visitor evaluation studies. Through
frequent discussions with Stuart Frost, we learned more about how the Museum observes, tracks,
and surveys its visitors across more than 60 galleries. In addition, we gathered information on the
tools that the Museum uses for visualizing data and other tools that are currently available for the
staff to use.
Using the findings of our research on current and best practices at the British Museum and
abroad respectively, in addition to key needs and information from discussions with Stuart Frost,
we developed design criteria for any application or toolkit that would be developed. These design
criteria focused on features to be incorporated, limitations of the British Museum’s facilities, and
other such factors that would affect the decisions that need to be made for development or selection
of individual tools.
Based on the features identified in our design criteria, we researched different types of
software for creating floor plans or conducting surveys. We obtained raw evaluation data from our
sponsor to familiarize ourselves with how the data was collected and organized currently and to
ensure that our selected tools would operate smoothly or could be modified to do so if need be.
Development of the toolkit underwent multiple scope adjustments over the course of this
project. Originally, this project focused more heavily on the development of a fully functional
application. Ideally, it would have acted as a single pane of glass solution — i.e., a unified interface
allowing for interaction with multiple different tools through a main application. After subsequent
research however, we decided that the larger priority was to identify and understand a variety of
data collection and data visualization tools. Near the end of the 7-week duration of this project, we
learned from a fellow student about software libraries that could be used to streamline development
and make it possible to assemble a working solution quickly. Thanks to this, we were able to create
a working prototype of our overall toolkit application, with baseline functionalities that can be
improved upon by future iterations.

13
Chapter 4: Findings
This chapter details the results of our research, as well as the selection of individual tools
for our final goal. These pieces each serve their own purpose as part of an overall toolkit and were
selected based on various features outlined in our design criteria or other qualities such as using
tools that are innately compatible with each other.
4.1 Objective 1: Review Best Practices in Visitor Evaluation Used in the Museum Sector and
Current Technologies Available
Prior to beginning the development of our proposed toolkit, we required additional
background research on best practices regarding visitor evaluation in the museum sector at large.
We gathered information on visitor evaluation studies from a variety of sources, including peer-
reviewed literature, evaluation studies conducted by visitor evaluation experts, and information
gathered by previous WPI teams who conducted studies within the museum sector. Expanding our
research on best practices provided us with an understanding of the industry standard for
conducting well-developed visitor evaluation studies and how to obtain and visualize important
data.
4.1.1 Existing Tools and Best Practices
Existing tools that are currently used in museums were researched along with other tools
that are used to track visitors. Multiple methods, including Bluetooth, GPS, LIDAR sensors, radio
frequency identification (RFID), ultra-wideband (UWB), and ultrasound, were identified as
possible tools that the British Museum could use to track visitors.
One major tool that is already widely used to track visitors in museums is Bluetooth.
Bluetooth is inexpensive because no sensors need to be bought or installed. It accurately tracks
people and can be used over both large and small tracking spaces. One study that used Bluetooth
to track people in the London Zoo took time intervals of the visitors and was able to then create
data visualizations of the path the visitor took along with heat maps of the dwell time of the visitors
(Moussouri & Roussos, 2014). The ability of Bluetooth data to easily be converted to a visual
platform would be ideal for the British Museums tracking studies. Bluetooth is also inexpensive,
which is also something the Museum is looking for in a tracking tool. Although Bluetooth works
well in some respects, many information technologies, Bluetooth included, are moving towards a

14
BYOD (Bring Your Own Device) approach (Moussouri & Roussos, 2014). Instead of the museum
offering a device, visitors can download an app that tracks them throughout the museum. In our
work with researching a possible way to streamline tracking visitors, this was an approach that the
British Museum advised against because they do not want the visitors downloading an app to
collect data. If visitors must download an app to collect data, there would likely be less
participation because not everyone would be willing to download an app.
GPS is a very accessible and easy way to track people. Similar to Bluetooth, it can be added
to a variety of devices for a low cost and can be accessed through a free app. GPS offers a lot of
coverage, but it cannot be used indoors.
Another tracking tool that museums are using to track visitors are Light detection and
ranging (LIDAR) sensors. LIDAR sensors use light to track distances and movement. In one study,
a museum used LIDAR to detect the positions and body orientation of visitors in art galleries. They
positioned the sensors on shoulder height poles in several places around the gallery. When the
LIDAR sensed movement, it mapped the data on a two-dimensional image plane (Rashed et al.,
2016). The LIDAR system is inexpensive (sensors can be as low as 19 dollars), but the data is hard
to analyze once collected. This is because the data needs to be processed using multiple formulas
that account for the accuracy of the data (“LIDAR,” n.d.). For the purpose of our project, we did
not look at placing sensors such as the LIDAR in galleries because the British Museum is not
interested in purchasing and installing sensors (Rashed et al., 2016).
RFID can be used in complex indoor environments and it is inexpensive; a typical RFID
sensor can cost as low as 29 dollars (“Atlas RFID Store,” n.d.). However, RFID sensors need
numerous infrastructure components, such as operating software, to be installed to support the
RFID. In addition to installing components, the system needs to be regularly maintained.
UWB has a high accuracy, large coverage range, and is scalable. However, UWB is
difficult to install because multiple sensors are needed on the ceiling of the room where data is
being collected. UWB is also more expensive than the other tools that were researched, as it
requires multiple sensors that are of higher cost, and they need to be recalibrated frequently (Curran
et al., 2011).
Ultrasound sensors are another tracking tool that is inexpensive and priced similarly to
RFID and LIDAR (“Ultrasonic Sensors,” n.d.). Ultrasound has a large coverage area, but multiple
sensors need to be installed and calibrated, and it is less accurate when tracking people than the

15
other tools available. All of these tools would not be a realistic possibility for the Museum to use
due to their lack of accessibility and difficulty to implement and maintain (Montanes, Rodriguez,
& Prieto, 2013). Table 2 presents all the tools that were researched along with their advantages
and disadvantages.
Table 2. Advantages and Disadvantages of Existing Tracking Tools
Tool Advantages Disadvantages
Bluetooth ● Implemented in various
devices (mobile phone, laptop,
desktop, etc.)
● Inexpensive*
● Can be used over large and
small tracking spaces
● Limited accuracy
● BYOD to collect data
GPS ● Offers maximum coverage
● Can be added to various
devices
● Inexpensive*
● Cannot be used indoors
LIDAR ● Inexpensive* ● Data is difficult to analyze
● Multiple sensors need to be
installed and maintained
RFID ● Can be used in complex indoor
environments
● Inexpensive*
● Multiple infrastructure
components need to be
installed and maintained
Ultrasound ● Inexpensive*
● High system coverage area
● Complex Installation
● Lower accuracy
UWB ● High accuracy
● Large coverage range
● Scalable
● Complex installation
● Expensive*
● Recalibration of sensors
need to happen numerous
times
● Multiple sensors need to be
installed and maintained
*The price varies depending on the features and capabilities of the tool

16
4.1.2 Visualizing Data
Once data is collected, it needs to be analyzed and visualized in a way that is easy to
understand for the appropriate audience. There are many different options for visualizing visitor
movement data depending on the desired analysis. One way visitor movements can be shown is
through having each visitor be represented by a different color when their path is tracked. This
shows the complete movement of each visitor, but it does not show when each visitor visited each
area, nor the holding power of each object or area. There is open source software available that
will compute this data and visualize it in this format. One such example of open source software,
QGIS, has many different options for analyzing and visualizing data. In a study done on visualizing
museum visitors’ behavior, the path that an individual visitor took was shown in Figure 2 (Lanir
et al., 2016). Notice how this portrays where the visitor went but does not indicate which exhibits
were the most engaging.
Figure 2. Trace Map of a Visitor in an Exhibit (Lanir et al., 2016)
Heat maps are another way visitor movement can be visualized. Heat maps are beneficial
because they intuitively and concisely show the holding power of areas and objects. There are
many different types of software available that can create heat maps for free depending on the
features one is looking for. One study that visualized visitor flow in the British Museum used an
open source software called DepthmapX from the University College London. DepthmapX is
available through Github, a hosting site for code repositories. The DepthmapX software is shown
in Figure 3, the warmer the color the more visitors visited that area. The red and orange areas
represent a high visitor flow, while the green and blue areas represent a lower visitor flow
(Moussouri & Roussos, 2014).

17
Figure 3. Heat Map of Visitor Flow in the British Museum (Moussouri & Roussos, 2014)
Another way to visualize tracking data is by using decay curves, or other analytical graphs.
Decay curves can show the dwell time of the visitors and how long they remained in the exhibit.
These types of graphs can directly compare exhibits, the longer the dwell time is, the higher the
holding power is for that exhibit. One previous IQP used a decay curve to show the dwell time of
the visitors in various exhibits in the Museum of New Zealand Te Papa Tongarewa. The generated
decay curve is shown in Figure 4 (Harrington et al., 2017). In this decay curve, the exhibits were
directly compared to each other, the Squid in 3-D exhibit had the longest dwell time, but the
number of visitors that visited that exhibit is lower than the other exhibits. Ideally exhibits should
have a high volume of visitors and a long dwell time, this shows the success of the exhibit.
Figure 4. Decay Curve of Dwell Time (Harringtonr et al., 2017)

18
4.1.3 Survey Tools
Multiple stand-alone survey tools were considered and compared in Table 3 according to
criteria discussed verbally on multiple occasions with Stuart Frost. Across the Museum, a WiFi
connection is unreliable, and therefore we needed to consider survey providers that allowed for
offline data collection. Two online-only options were also considered as a reference and as
potential options if the internet connection throughout the Museum were to change in the future.
We included both free tools and priced options to provide the Museum with an array of options.
We also considered what tools the Museum already has available and the tools that would better
meet their demand.
Table 3. Comparison of Survey Tools
Tool Mode Cost Questions Answers Export Data Comments
Survey
Monkey
Offline
through the
app and
online
Limited
free
version
Only 10
questions
with free
version
100
responses
Exporting data
unavailable
with free
version
Museum
already has
an account
Survey
Anyplace
Offline
through the
app and
online (web
app)
Starting
at $33
monthly
Unlimited 400
monthly
responses
CSV, Excel,
Forms
Online only Free Unlimited Unlimited Automatic
collection in
Spreadsheets
Survey
Planet
Online only Limited
free
version
Unlimited Unlimited Only Pro can
export to
Excel
Pro starting
at $20
monthly
Survey
Legend
Online and
offline
versions
Limited
free
version
Unlimited Unlimited Only Pro can
export data
Pro starting
at $15
monthly
Table 3 summarizes a variety of independent survey tool options available to the British
Museum, and how the tools partially their needs. These tools are great for the collection of data
but do not allow for the unification of a single toolkit or web application. However, as we moved

19
towards integrating spatial tracking with volunteer observations, we learned of SurveyJS from a
fellow classmate. SurveyJS is an online tool that allows for surveys and forms to be added into a
website or app by producing code that can be easily implemented into the backend code of the web
application. It allows for:
● Different options of question formatting that can be edited at any point
● Offline collection of data if the application running the survey allows for it
● Unlimited responses that can be exported if the application allows for it
● No cost to the Museum
Given this, we considered the four best options of survey tools to be:
● Survey Monkey given that the Museum already owns an account
● Survey Legend since the Pro version is of a lower cost than most other options
● Survey Anyplace since it works on an app format that can be downloaded into any tablet
regardless of the operating system.
● SurveyJS since it allowed us to potentially incorporate observations and surveys into a
tracking application
Given these advantages of SurveyJS, we selected this tool moving forward. This selection
was made in accordance with what resources the Museum had available at the time of this study.
4.2 Objective 2: Develop and Suggest an Innovative Toolkit for Use in Easily Conducting
Visitor Evaluation Studies and Visualizing the Gathered Data
The process of visitor evaluation involves a wide range of practices, including observation,
visitor tracking, and surveying in addition to visualizing the data gathered. According to Stuart
Frost, the Interpretation Team at the Museum currently uses a pen-and-paper method for visitor
tracking and surveys, and this targets mainly individual visitors and small family groups. The
evaluation protocols used by the British Museum vary based on the area, gallery, or type of
exhibition that is being studied, for different methods are used in large galleries and smaller
exhibits, respectively. For larger galleries and special exhibitions, the Museum typically hires
outside consultants to conduct evaluations using best practices. Many other smaller evaluations
are conducted in-house by staff, students, and volunteers. Due to a lack of resources and
technology, most of these in-house evaluations use pen-and-paper methods to collect observational
and exit survey data. These methods necessitate cumbersome and time-consuming data entry and

20
analysis. Although the paper-based tracking system is easily comprehensible by all staff members
and volunteers, the outdated system is especially inefficient for a museum as popular and large as
the British Museum. As noted by Stuart Frost, the vast amount of paper used for conducting the
tracking studies and surveys results in overwhelming stacks that must be manually analyzed and
sorted page-by-page by members of the Interpretation Team staff. Within its current tracking
procedures, we identified two areas of interest that would be of substantial help to the Museum’s
visitor evaluation protocol: streamlining the interview process and technologically improving the
process of analyzing and visualizing evaluation data.
4.2.1 Improving the Process of Gathering, Recording, and Analyzing Data
The most pressing issue with the Museum’s current visitor evaluation system is that the
pen-and-paper evaluation sheets must be completed by hand and then manually input into a system
for data analysis and visualization. This method of visitor evaluation leads to several intermediate
steps that are required for data to be gathered, processed, and then visually depicted for accurate
understanding. Thus, we aimed for finding improved methods that would expedite transition
between data entry, analysis, and visualization. To complete this task, we opted to focus on a small-
scale example to create a foundation for developing and testing tools that could be used in a larger
scale setting. Therefore, in conjunction with Stuart Frost’s recommendation, we targeted Room 3
(Figure 5) as the baseline for the toolkit, for it was a relatively small space with readily available
information for designing the desired tools.

21
Figure 5. Room 3 Location on Level 0 of the British Museum
We sought to improve upon the pen-and-paper method of data collection by creating a
simplified, electronic observational sheet that would expedite the collection of data and eliminate
the additional work of transferring handwritten data to an electronic platform for data analysis.
Through our discussions with our Stuart Frost, we gathered information on how the British
Museum currently handles the process of interviewing and surveying visitors to gather data on
their experience. This process varies mainly due to the size of the gallery or the exhibit that the
visitor evaluation study is being conducted in. In cases where the study is taking place in a large
gallery or new exhibit, the surveying process is conducted mainly by large evaluation companies
who develop the survey tools and protocols with the Museum staff. The Museum often works with
Morris Hargreaves McIntyre and survey management specialists like Snap Surveys to create,
record, and analyze the survey data so that it may be reviewed by the Museum. For the past eight

22
years, Morris Hargreaves McIntyre has worked with the British Museum to conduct evaluations
of their exhibits, and in doing so they improved the Museum’s understanding of how their visitors
interact with the exhibits (“Grayson Perry: Culture Segments in Action,” n.d.). Through Snap
Surveys, the Museum has access to services that help create, analyze, and provide feedback on
surveys in addition to generating multi-language surveys (“About Snap Surveys: Management
Team,” 2020). These services provide the Museum with a relatively streamlined and effective
way of gathering data on large galleries, but they are not the method of choice for conducting
smaller, in-house evaluations.
In cases where the evaluation study is taking place in a smaller gallery or room, however,
there is room for improvement in the Museum’s evaluation process. In a smaller setting like Room
3, the Museum Interpretation Team collects visitor feedback primarily in two ways: self-completed
surveys at a kiosk and face-to-face interviews with visitors. In both cases, the Museum has a list
of standard questions that it uses in all evaluations, but there is an additional set of questions that
pertains to the contents of the room or gallery where the study is taking place. The kiosk, which
typically consists of an iPad with integrated survey questions, serves as a way for visitors to give
quick feedback and answer the general questions that the Museum would like answers to for every
study. Table 4 below contains the five questions that the kiosk has at every show that is held in
Room 3.
Table 4. Standard iPad Survey Questions Used for Every Show in Room 3
1. Please enter three words that you feel best describe this display.
2. How clear was the overall theme, narrative, or message of this display? (0-5)
3. On a scale on 0-5 to what extent do you feel you learned something new as a result of
visiting *name of show* (0 = lowest, 5 = highest)?
4. On a scale of 0-5 how innovative and experimental did you feel this display was?
5. How satisfied are you with this display overall? (Excellent, Good, Fair, OK, Poor, Very
Poor)
The face-to-face interviews supplement the standard set of questions with additional, more
detailed questions regarding the current exhibit. Despite this, both sets of data from these methods
are gathered separately and therefore must be individually entered into a spreadsheet before the
information can be analyzed. This is where the process is largely ineffective, and a system where
the data can be gathered and processed simultaneously would be ideal for the Museum.
23
4.2.2 Toolkit Design Criteria
Using the gathered information from our research on the Museum’s current practices, we
developed a set of design criteria. We needed a toolkit that would be able to handle all aspects of
visitor evaluation, including the gathering and analysis of data pertaining to interviews,
observations, and visitor tracking. Most importantly, the Museum desired tools that would not only
streamline the process of gathering and analyzing data, but also visualizing the data so that the
entirety of the Museum staff would understand the information. To do so, we needed to find tools
that were easily accessible to both our team and the Museum.
Due to the Museum’s relatively low budget on software, we required tools that were
inexpensive and/or readily available on almost all devices. In the case of the British Museum, the
Microsoft Office Suite is available on all of their systems, which meshed well with our design
criteria and solved the issue of both budget and availability for features such as designing floor
plans. It was essential that we devised a toolkit that was not only easily manipulated, but that could
be picked up and used by all Museum staff and volunteers. Devising a set of design criteria allowed
us to develop an easy-to-use set of innovative and effective tools that met the needs and concerns
of the British Museum. A summary of our design criteria is displayed in Table 5 below.
Table 5. Toolkit Design Criteria
Goals Constraints
Track visitor movement and dwell times Lack of budget, minimize costs
Create custom floor plans efficiently Lack of portable technology (e.g., tablets)
Utilize existing resources where possible Poor network connection in the Museum
Streamline visualization of data External software verification
Improve accessibility and intuitiveness Inability to test in the field
4.2.3 Microsoft Visio
Microsoft Visio was explored as a potential software for use in streamlining the process of
gathering and visualizing tracking data. Visio provides a simplistic toolkit that can be used to
create floor plans in a short amount of time. The program uses a scaled measuring system to allow
the user to make designs as accurate as possible. Visio’s ease of use may be useful for the Museum,
24
for it provides the Interpretation Team with a platform to design, create, and modify floor plans
for its different galleries and exhibits.
Although Visio has a function that allows data to be attributed to different objects in a floor
plan, it does not provide an intuitive or visually exciting way of representing the data. The data
remains as simply numerical or textual data. Therefore, Visio serves well as a tool for Museum
staff or volunteers to efficiently make floor plan designs for areas that they are evaluating.
However, Visio does not provide the necessary tools for making significant improvements to the
Museum’s data visualization protocols.
4.2.4 Power Map for Microsoft Excel
We considered many options to create dynamic floor plans for the Museum that could
represent different sets of information that are of interest to this organization. Ultimately, due to
potential software accessibility issues and the need for cheap and readily available easy to use
options, we opted for an option that the Museum already had available as part of the Microsoft
Office Suite subscription, as described in the design criteria.
Microsoft Power Map was explored as a possibility for creating dynamic 3D maps that
display data in an intuitive way over existing floor plans. This is because Power Map provides
more insight than a 2D map and better visual representation of information. It allows for spatial
and temporal data to be visible on custom maps created with images of floor plans. Ideally, this
tool provides the Museum with an innovative and different way of presenting the information they
seek with their tracking studies for their own analysis and evaluations. It could portray information
such as the time spent by a visitor in front of different displays and the popularity of each case or
wall display in the form of heat maps, columns, or bubbles in 3D.
Using Room 3 as a trial, we obtained an image of the gallery’s floor plan from previous
reports provided by Stuart Frost. In order to use Power Map, we identified the coordinates of each
display within the given floor map. To do this, we used Microsoft Paint, an accessible graphics
editor included in all versions of Microsoft Windows. We chose this tool to pinpoint coordinates
due to its advantage of locating pixel coordinates in an efficient way and the accuracy of its
measurement translation when scaled. Once the coordinates were precisely identified by placing
the cursor on top of each object, they were manually inputted in an Excel worksheet and labeled
appropriately.

25
Standard protocols for creating a custom map were followed as instructed in Microsoft’s
Support webpage (Get started with Power Map. (n.d.)) and a step-by-step manual is attached for
reference. Once the map was created, a layer with the XY coordinates was added to the floor plan
image and the accuracy of the locations given by the worksheet coordinates was adjusted to match
the pixel location of the objects within the map. Initially, this program appeared promising, but its
capabilities proved difficult to explore given that there exists very limited information regarding
how it works.
4.2.5 Assembling the Toolkit
Combined with our research on individual tools, we considered how to join these tools
together and intuitively utilize the entire kit to conduct visitor tracking and evaluation studies. In
order to use the toolkit as a cohesive unit, it was designed as a static webpage that displays all the
information and tools necessary for tracking. Figure 6 below shows the application’s screen when
entering observational data.
Figure 6. Application Screen When Recording Observations
The app was designed with modularity in mind, such that users can change the survey or
floor plan within the tool with ease; all a user must do is move the proper files (e.g. image,

26
coordinates, survey) into the same folder as the application, or into a file for storing said
information. This way, users require no technical knowledge to be able to use the toolkit. The
application is also able to upload the results of a tracking study to a spreadsheet at the user’s
request, preventing the need for manual entry of observations and exit interview results. As the
app is only a prototype, it is restricted in some ways. For example, the tool is designed to upload
one study at a time, i.e., the user must connect to the network and upload the results after each
group or visitor they track, up through and including the exit survey. In addition to in-line
commenting within the code itself, so as to improve readability and comprehension for future
editors, the README document (Appendix A) also provides information on how to utilize the
application and its accompanying tools. The general process of using the toolkit is summarized in
the README as follows:
First a floor plan must be made using software such as Microsoft Visio and saved in an
image file format (e.g. PNG, JPEG, etc.). To make this process easier, the team created a Visio
template that can be modified for each individual study. This floor plan must have display numbers
marked for each display that is to be tracked. After the image is saved, it must be opened in a photo
manipulation software such as Microsoft Paint. The user will then record the pixel size of the
image into the configuration file, as well as the pixel coordinates of each individual display
number. The coordinates must have the headers “display”, “x”, and “y” in order to be read by the
program. These coordinates should be saved as a CSV file from any spreadsheet program, and then
placed along with the floor plan image into the same folder as the webpage (i.e. the Github
repository). Both the names of these files should also be recorded in the configuration file.
Following creation of a floor plan image and corresponding coordinates, the user must then
create the survey they wish to use. If the user wishes to change the survey in the application, they
may copy the survey JSON from the configuration file into the JSON editor of the SurveyJS creator
site. They may then change whatever aspects they like and recopy the JSON data back to the
configuration file. To make a new survey, simply use the SurveyJS creator.
Once all information is copied into the configuration file and into the directory, the user
can connect to the app through a network connection and begin utilizing the app either online or
offline. The user can freely switch between live observations and exit surveys, with a responsive
floor plan to track where visitors are. All observations are automatically tagged with the current
name and an accurate timestamp upon creation. Whenever the user is ready to upload, they can

27
send all of their collected data to an online spreadsheet at the press of a button, where it will be
automatically processed and inserted into organized sheets. Figure 7 below shows what the
application looks like after completing an exit survey.
Figure 7. Application Screen Upon Completing Exit Survey

28
Chapter 5: Conclusions and Recommendations
The goal of our project was to help the British Museum in improving its methods of visitor
evaluation. We developed a toolkit to be used for conducting future evaluation studies using open-
source software and other proprietary software packages, including Microsoft Excel and Visio and
SurveyJS. Our toolkit provides the British Museum with an immediate and innovative solution
that streamlines the visitor evaluation process and eliminates the need for antiquated pen-and-
paper evaluation methods. The toolkit also serves as a valuable baseline for future teams who may
aim to further improve the Museum’s evaluation methods.
Although we successfully provided these tools to the Museum, we must address the
limitations in our research and development. Due to circumstances presented by the COVID-19
pandemic during the implementation of this project’s methodology, we were unable to conduct the
project on-site at the British Museum as initially intended. Therefore, we conducted the entirety of
this project remotely using services such as email and video calling through the application Zoom.
Our research was limited to reviewing previous evaluation studies conducted by the British
Museum and peer reviewed literature written by museum and visitor evaluation experts. Given the
circumstances, we were unable to contact other museums and evaluation experts to gather
additional information on visitor evaluation protocols. Additionally, we were unable to pre-test
our toolkit to aid in the developmental process.
Since we were unable to pre-test our toolkit, we recommend that the Museum test the
toolkit with a variety of visitors in a variety of situations. By testing the toolkit in different exhibits
and galleries, the Museum can identify potential issues and improvements that may be necessary
for future use. We recommend that the Museum work with a future WPI team to make these
potential improvements and refine and polish the toolkit further based on feedback from users. A
future WPI team will be able to use our toolkit as a baseline for making additional improvements
to the Museum’s evaluation methods.
Despite the limitations, we provided the British Museum with a functional toolkit along
with a README file (Appendix A) that described the necessary steps for using each individual
tool. The Museum now has an improved method of gathering information from its visitors. We are
honored to have had the opportunity to assist the British Museum in conducting its research and
improving its evaluation methods, and to further its goal of educating the public in the most
effective and meaningful ways.

29
References
About Snap Surveys: Management Team. (2020). Retrieved from
https://www.snapsurveys.com/about/
Atlas RFID Store - Helping Companies Build RFID Systems Since 2008. (n.d.). Retrieved from
https://www.atlasrfidstore.com/
Best, K. (2012). Making Museum Tours Better: Understanding What a Guided Tour Really is
and What a Tour Guide Really Does. Museum Management and Curatorship, 27(1), 35–
52. doi: 10.1080/09647775.2012.644695
Bitgood, S., & Dukes, S. (2006). Not Another Step! Economy of Movement and Pedestrian
Choice Point Behavior in Shopping Malls. Environment and Behavior, 38(3), 394–405.
doi: 10.1177/0013916505280081
Curran, K., Furey, E., Lunney, T., Santos, J., Woods, D., McCaughey, A., (2011) An Evaluation
of Indoor Location Determination Technologies, Journal of Location Based Services, 5:2,
61-78, doi: 10.1080/17489725.2011.562927
Delgorio, P., Pandey, S., Russell, M., Wiesenberg, R. (2015). Evaluating Visitor Experience in
Gallery 67: The Korea Foundation Gallery. Worcester Polytechnic Institute. Retrieved
January 20th from
https://digitalcommons.wpi.edu/cgi/viewcontent.cgi?article=2647&context=iqp-all
Falk, J. (2009). Identity and the Museum Visitor Experience. Walnut Creek, Calif: Left Coast
Press.
Falk, J., & Dierking, L. (2018). Learning from museums. Lanham: Rowman & Littlefield.
Falk, J., & Dierking, L. (2012). The museum experience revisited. Walnut Creek, Calif: Left
Coast Press.

30
Get started with Power Map. (n.d.). Retrieved from
https://support.office.com/en-us/article/get started-with-power-map-88a28df6-8258-40aa-
b5cc-577873fb0f4a
Grayson Perry: Culture Segments in Action. (n.d.). Retrieved from
https://mhminsight.com/articles/grayson-perry-culture-segments-in-action-2196
Griffin, Des (2008) Advancing museums, Museum Management and Curatorship, 23(1), 43-61,
doi: 10.1080/09647770701757716
Griffin, J. (2004). Research on students and museums: Looking more closely at the students in
school groups. Science Education, 88(S1). doi: 10.1002/sce.20018
Gu, Y., Lo, A., Niemegeers, I. (2009) A Survey of Indoor Positioning Systems for Wireless
Personal Networks. IEEE Communications Surveys & Tutorials, vol. 11, no. 1, pp. 13-32
Harrington, S., Klepper, B., Moffat, S., Perron, K. (2017) Assessing Visitor Experience for the
Te Papa Natural Environment Zone Renewal. Retrieved from
https://wp.wpi.edu/newzealand/projects/2017-2/assessing-visitor-experience-for-the-te-pa
natural-environment-zone-renewal/
Hein, G. E. 1998. Learning in the museum, London: Routledge. International Council of
Museums (n.d.). Museum Definition. Retrieved February 15, 2020, from
https://icom.museum/en/activities/standards-guidelines/museum-definition/
Korn, R. (1994). Studying Your Visitors: Where to Begin. History News, 49(2), 23-26. Retrieved
February 15, 2020, from www.jstor.org/stable/42652293
Lanir, J., Kuflik, T., Sheidin, J., Yavin, N., Leiderman, K., & Segal, M. (2016). Visualizing
museum visitors’ behavior: Where do they go and what do they do there? Personal and
Ubiquitous Computing, 21(2), 313–326. doi: 10.1007/s00779-016-0994-9
Leinhardt, G., Knutson, K., Crowley K. (2003). Museum Learning Colloborative Redux. Journal
of Museum Education, 28(1), 23-31, doi: 10.1080/10598650.2003.11510472

31
LIDAR. (n.d.). Retrieved from
https://www.dfrobot.com/search-LIDAR.html
Melton, A. W. (1935). Studies in museum education: Vol. 14. Problems of installation in
museums of art. American Association of Museums. doi: 10.1037/11526-000
Montanes, J. A. P., Rodriguez, A. M., Prieto, I. S. (2013). Smart Indoor Positioning/Location and
Navigation: a Lightweight Approach. International Journal of Interactive Multimedia
and Artificial Intelligence, 2(2), 43+. Retrieved from
https://link-gale-com.ezpxy-web-p
u01.wpi.edu/apps/doc/A347294292/AONE?u=mlin_c_worp
ly&sid=AONE&xid=b935f2ea
Moussouri, T. and Roussos, George (2015). Conducting Visitor Studies Using Smartphone-based
Location Sensing. ACM J. Comput. Cult. Herit. 8, 3, Article 12, doi:
http://dx.doi.org/10.1145/2677083
Moussouri, T. and Roussos, George (2014). Mobile Sensing, BYOD and Big Data Analytics:
New Technologies for Audience Research in Museums. Participations: Journal of
Audience and Reception Studies 11 (1), pp.270-285. ISSN 1749-8716
Mygind, L., & Bentsen, P. (2017). Reviewing Automated Sensor-Based Visitor Tracking
Studies: Beyond Traditional Observational Methods? Visitor Studies, 20(2), 202–217.
doi: 10.1080/10645578.2017.1404351
Rashed, M.G., Suzuki, R., Yonezawa, T., Lam, A., Kobayashi, Y., Kuno, Y. (2016) Tracking
Visitors in a Real Museum for Behavioral Analysis, 2016 Joint 8th International
Conference on Soft Computing and Intelligent Systems (SCIS) and 17th International
Symposium on Advanced Intelligent Systems (ISIS), Sapporo, 2016, pp. 80-85.
Sheng, C.-W., & Chen, M.-C. (2012). A study of experience expectations of museum visitors.
Tourism Management, 33(1), 53–60. doi: 10.1016/j.tourman.2011.01.023

32
Single line text - Text question, jQuery Survey Library Example. (n.d.). Retrieved from
https://surveyjs.io/Examples/Library/?id=questiontype-
text&platform=jQuery&theme=modern
Slater, A. (2007). ‘Escaping to the gallery’: understanding the motivations of visitors to galleries.
International Journal of Nonprofit and Voluntary Sector Marketing, 12(2), 149-162. doi:
10.1002/nvsm.282
Survey Creator - Create survey, quiz, forms without registration. (n.d.). Retrieved from
https://surveyjs.io/create-survey
Trofanenko, B., & Segall, A. (2014). Beyond Pedagogy Reconsidering the Public Purpose of
Museums. Rotterdam: SensePublishers. Retrieved February 3, 2020 from
https://ebookcentral-proquest-com.ezpxy-web-p-
u01.wpi.edu/lib/wpi/reader.action?docID=455 127
Ultrasonic Sensors - Allied Electronics & Automation (n.d.) Retrieved from
https://www.alliedelec.com/view/search/?keyword=ultrasonic%20sensors&sort=price_ret
ailasc
Weil, S. (1999). From Being about Something to Being for Somebody: The Ongoing
Transformation of the American Museum. Daedalus, 128(3), 229-258. Retrieved
February 16, 2020, from www.jstor.org/stable/20027573
Yalowitz, S. S., & Bronnenkant, K. (2009). Timing and Tracking: Unlocking Visitor Behavior.
Visitor Studies, 12(1), 47-64. doi: 10.1080/10645570902769134

33
Appendix A: Evaluation Toolkit README
Improving Visitor Evaluation at the British
Museum
Evaluation Toolkit README
By
Karla Cuellar
Erinn Jambor
Parshon Sorornejad
Samuel Talpey
This README file was created in order to provide the Interpretation Team staff and
volunteers at the British Museum with gathering the necessary materials from the recommended
tools to use in our prototype web application. Steps for inputting, saving, and submitting data into
the web application are detailed for each tool in the toolkit.

34
Table of Contents
General Summary 35
Microsoft Visio 36
Microsoft Paint 41
SurveyJS 43
Power Map Through Microsoft Excel 46

35
General Summary
First a floor plan must be made using software such as Microsoft Visio and saved in an
image file format (e.g. PNG, JPEG, etc). This floor plan must have display numbers marked. After
the image is saved, it must be opened in a photo manipulation software such as Microsoft Paint.
The user will then record the pixel size of the image into the configuration file, as well as the pixel
coordinates of each individual display number. The coordinates must have the headers “display”,
“x”, and “y” in order to be read by the program. These coordinates should be saved as a CSV file
from any spreadsheet program, and then placed along with the floor plan image into the same
folder as the webpage (i.e. the Github repository). Both the names of these files should also be
recorded in the configuration file.
Following creation of a floor plan image and corresponding coordinates, the user must then
create the survey they wish to use. If the user wishes to change the survey in the application, they
may copy the survey JSON from the configuration file into the JSON editor of the SurveyJS creator
site. They may then change whatever aspects they like and recopy the JSON data back to the
configuration file. To make a new survey, simply use the creator.
Once all information is copied into the configuration file and into the directory, the user
can connect to the app through a network connection and begin utilizing the app either online or
offline. The user can freely switch between live observations and exit surveys, with a responsive
floor plan to track where visitors are. All observations are automatically tagged with the current
name and an accurate timestamp upon creation. Whenever the user is ready to upload, they can
send all of their collected data to an online spreadsheet at the press of a button, where it will be
automatically processed and inserted into organized sheets.

36
Microsoft Visio
The provided template has a basic outline for a room with the most pertinent objects already
selected and ready for use immediately. The template can be modified and then saved as a for all
future floor plan designs. Once the template is opened, a default floor plan will be on the canvas.
To increase the size of the canvas, use the following steps:
1. On the top toolbar, click on the “Design” tab
2. On the top left under the “Page Setup” bar, click on the “Size” button. When the menu
opens, click on “More Page Sizes” at the bottom of the list.
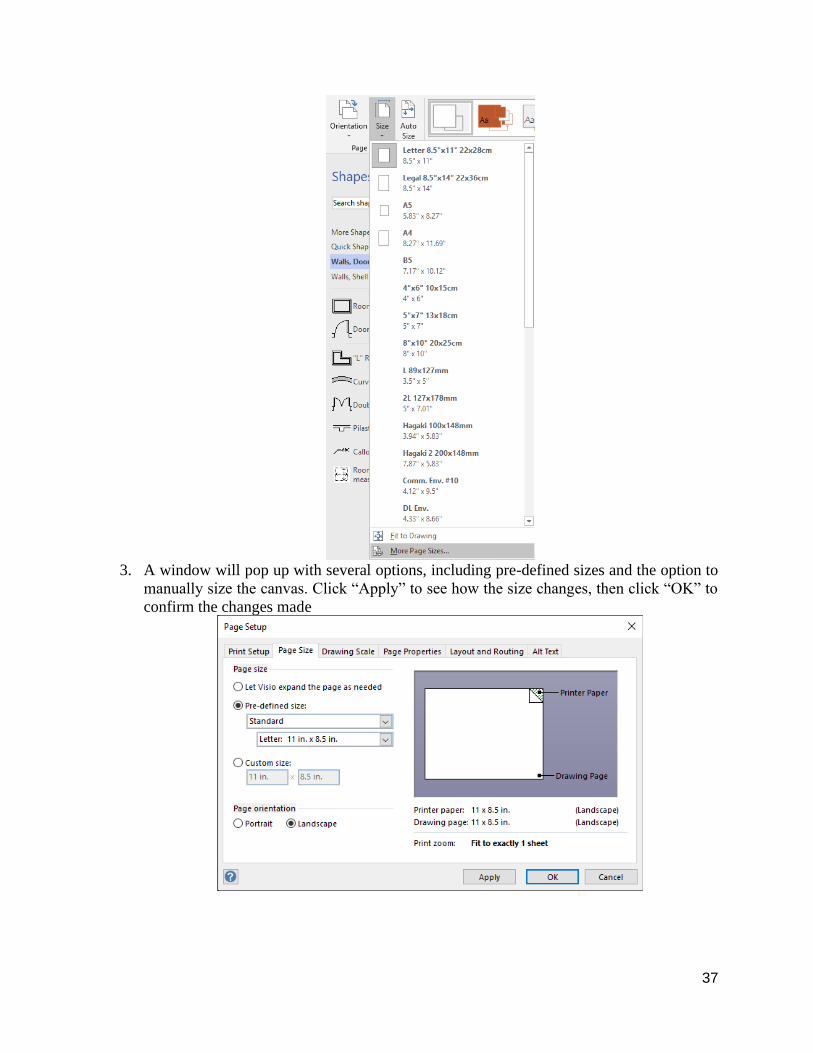
37
3. A window will pop up with several options, including pre-defined sizes and the option to
manually size the canvas. Click “Apply” to see how the size changes, then click “OK” to
confirm the changes made

38
The available shape options can be explored on the left of the interface.
To add an object, simply click-and-drag the object onto the canvas. Objects can be placed over
each other to connect them and form unified structures, indicated by the “glue to geometry” note

39
The easiest and most common shape to use to represent an object in the museum is the “space”
shape. For ease of use,“space” objects have already been placed on the template, and they can be
resized, relabeled, or copied. Below is a zoomed-in image of a space object that is on the template.
The “Object” labels on these objects can be edited using the following steps:
1. Right-click the object to open the editing options
2. Highlight the “edit text” option and click it
3. The label will turn grey, and it now can be modified to whatever text is necessary
4. Click on a space away from the object to save the new label
Once the floor plan is complete, the file must be saved properly for us in the following steps. To
do so, follow the steps below:
1. On the top toolbar, click on the “File” tab

40
2. Click on the “Save As” option, and choose/browse for an appropriate location to save the
file
3. Once the location is selected, a window will pop up to save the file. Name the file
appropriately
4. Under the “Save as type” option, locate “JPEG File Interchange Format” and select it
5. Click the “Save” button, and now the file is properly saved for the following steps
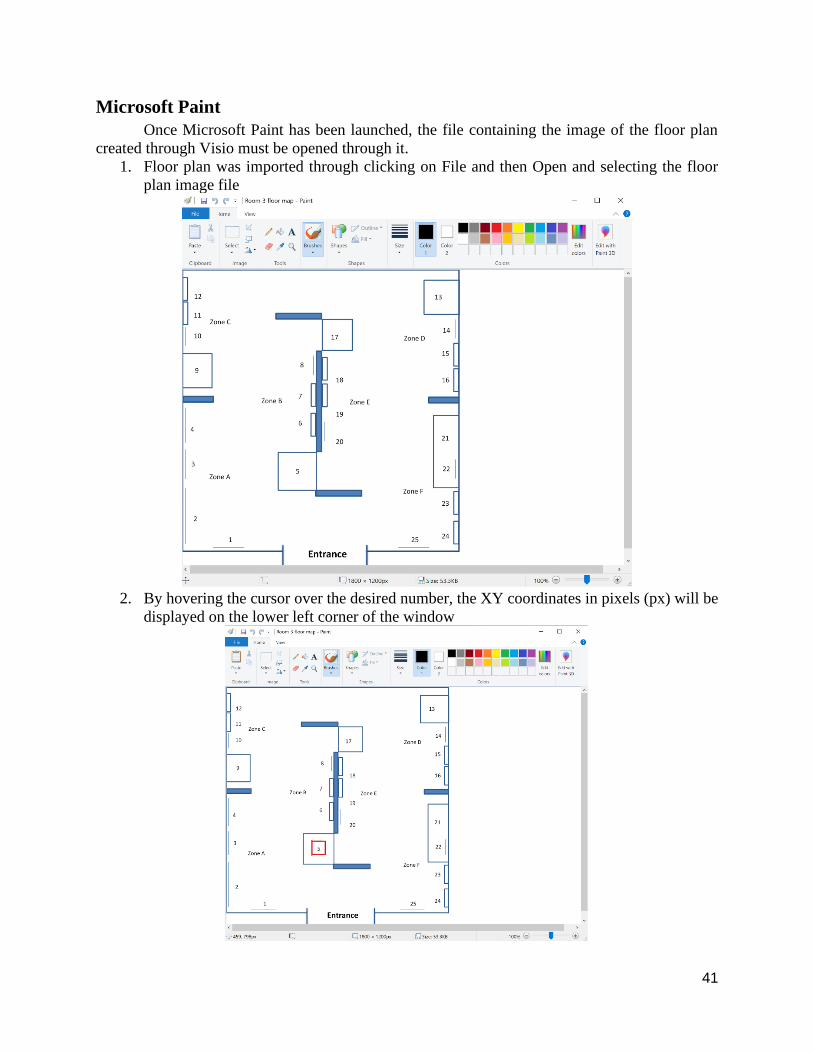
41
Microsoft Paint
Once Microsoft Paint has been launched, the file containing the image of the floor plan
created through Visio must be opened through it.
1. Floor plan was imported through clicking on File and then Open and selecting the floor
plan image file
2. By hovering the cursor over the desired number, the XY coordinates in pixels (px) will be
displayed on the lower left corner of the window

42
3. The XY coordinates must be manually inputted into a Microsoft Excel document or a
Google Spreadsheets document with the following headers: display, x, y, in order for the
program to read the data
4. Once completed, the file containing the coordinates must be saved as or exported as a CSV
file (comma-separated value)

43
SurveyJS
Webpage can be accessed by clicking on the following link: https://surveyjs.io/create-survey
1. An account must be set up in order to save surveys, but is not necessary to create/modify
a. Account can be created by clicking on the following:
2. Once the account has been set up, click on Create Survey. Each new survey should be
labeled and added to My Surveys in order for it to be saved

44
3. The column on the left side of the window labeled Toolbox offers the different types of
formatting that are available for each question within a survey. For a question to be created,
the desired format should be selected by clicking on it on the left or by dragging it from
the Toolbox
As a reference, the question formats used in the Disposable Survey Questionnaire were as follows:
• Single input: for short answers such as name/date/email
• Checkbox: for multiple choice questions with more than one potential answers
• Radiogroup: for multiple choice questions with only one potential answer
• Comment: for longer written answers than the Single input option such as
opinions/suggestions
• Rating: for rating on a customizable scale
• Boolean: for yes/no questions or questions with only two options that could lead to further
interrogation depending on the answer

45
For a full list of descriptions of each question format and examples of each refer to:
https://surveyjs.io/Examples/Library/?id=questiontype-text&platform=jQuery&theme=modern
4. Type in or insert the question in the Title box on the Question Properties column at the
right of the window
a. Each question can be edited at any time by clicking on Survey Settings or the pencil
icon on the survey body

46
Power Map Through Microsoft Excel
Standard protocols for creating a custom map can be followed as instructed in the Microsoft
Support webpage (Get started with Power Map. (n.d.)). This tool potentially will allow for the data
collected to be displayed in an innovative way with further exploration. Within this manual, basic
instructions for custom map creation as a template for Room 3 are described.
1. The workbook created specifically to display the tracking data that contains the coordinate
system for the specific floor plan must be open in Excel
2. Click insert and then select 3D Map
3. In Power Map click New Tour

47
4. Click New Scene and select New Custom Map
5. In the Custom Map Options window, browse for the background picture and select the
floor plan.
a. If the coordinates are in pixels, select Pixel Space
b. Otherwise, select Auto Fit to obtain the most accurate fit and click the Lock current
coordinate values box
6. Once the selections are made, add the desired data in the Layer pane and select visualization
preferences and adjust the corresponding fields
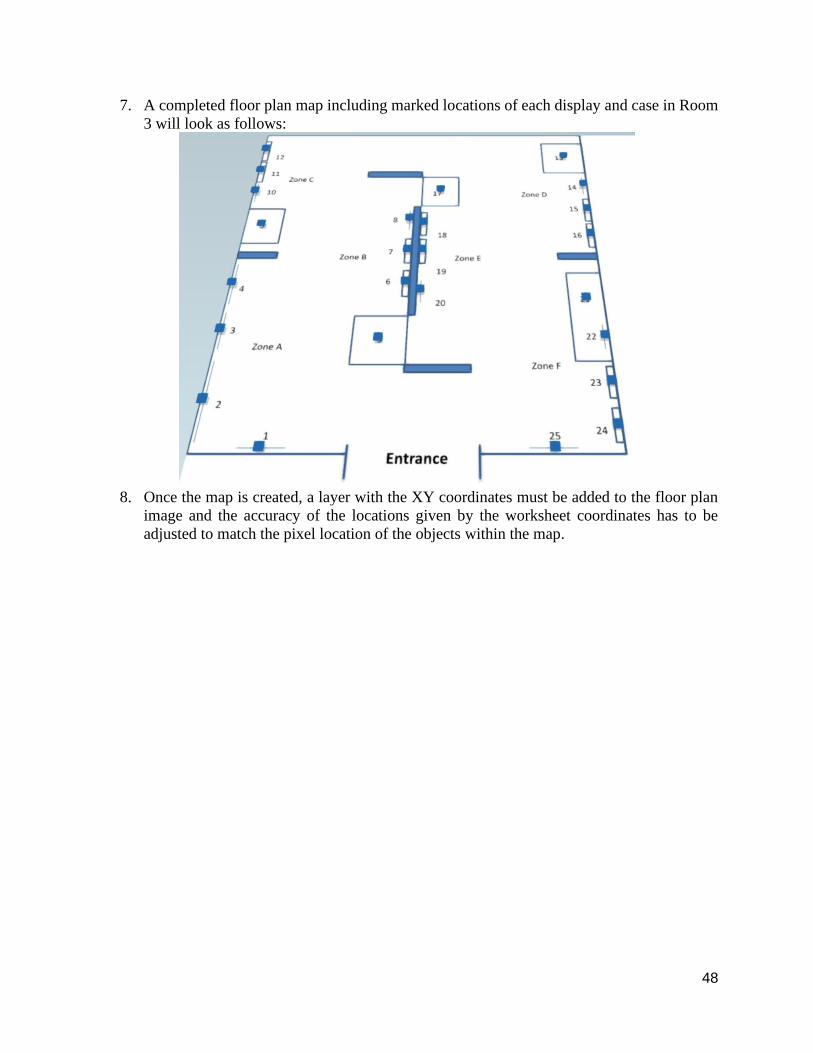
48
7. A completed floor plan map including marked locations of each display and case in Room
3 will look as follows:
8. Once the map is created, a layer with the XY coordinates must be added to the floor plan
image and the accuracy of the locations given by the worksheet coordinates has to be
adjusted to match the pixel location of the objects within the map.