Improving Value for Money in our urban sanitation portfolio in...
13
Improving Value for Money in our urban sanitation portfolio in Kenya Alexis Morcrette (Programme Coordinator for Urban Services, Practical Action) [email protected] Measuring Value for Money of WASH sector investments London School of Hygiene and Tropical Medicine 12 th May 2015
Transcript of Improving Value for Money in our urban sanitation portfolio in...
Improving Value for Money in our
urban sanitation portfolio in Kenya
Alexis Morcrette (Programme Coordinator for
Urban Services, Practical Action)
Measuring Value for Money of WASH sector investments
London School of Hygiene and Tropical Medicine
12th May 2015
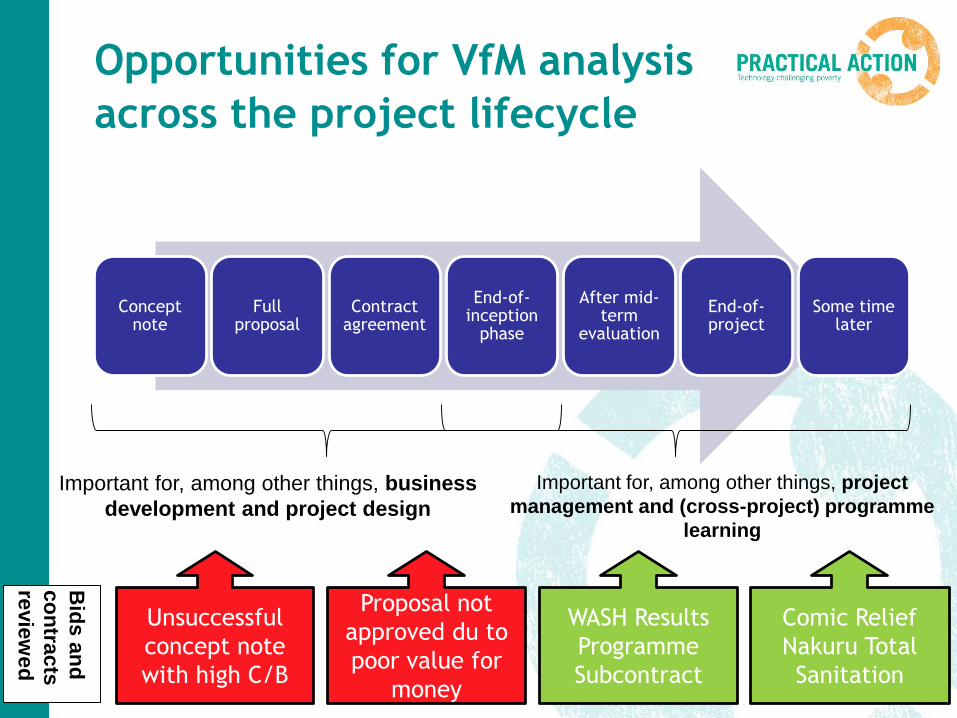
Opportunities for VfM analysis
across the project lifecycle
Concept note
Full proposal
Contract agreement
End-of-inception
phase
After mid-term
evaluation
End-of-project
Some time later
Important for, among other things, business
development and project design
Important for, among other things, project
management and (cross-project) programme
learning
Unsuccessful
concept note
with high C/B
Proposal not
approved du to
poor value for
money
WASH Results
Programme
Subcontract
Comic Relief
Nakuru Total
Sanitation
Bid
s a
nd
co
ntra
cts
revie
we
d
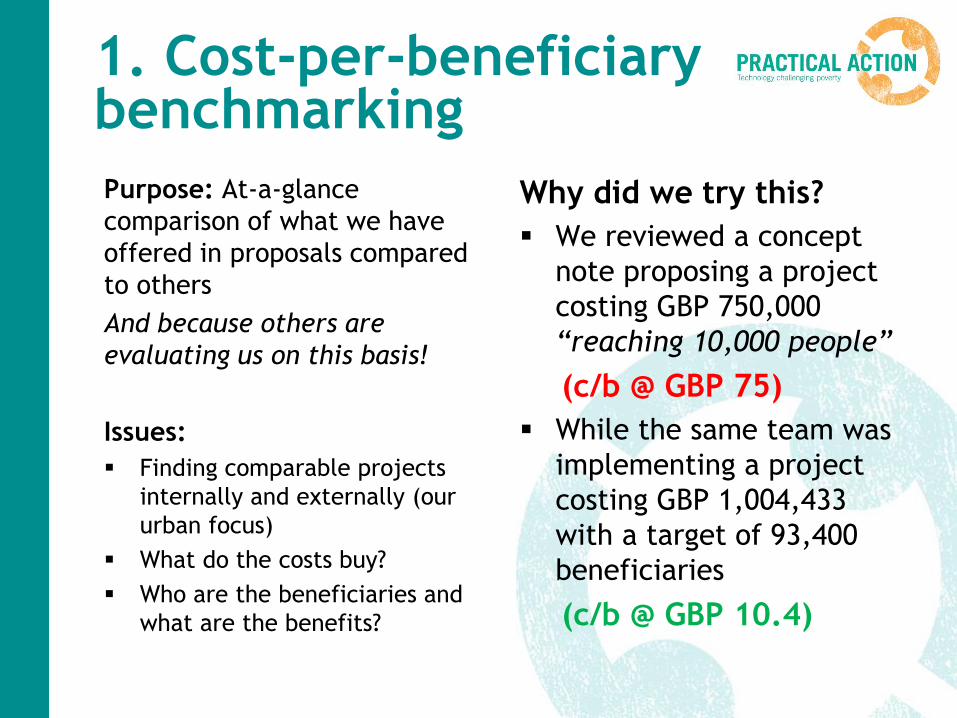
1. Cost-per-beneficiary benchmarking
Purpose: At-a-glance
comparison of what we have
offered in proposals compared
to others
And because others are
evaluating us on this basis!
Issues:
Finding comparable projects
internally and externally (our
urban focus)
What do the costs buy?
Who are the beneficiaries and
what are the benefits?
Why did we try this?
We reviewed a concept
note proposing a project
costing GBP 750,000
“reaching 10,000 people”
(c/b @ GBP 75)
While the same team was
implementing a project
costing GBP 1,004,433
with a target of 93,400
beneficiaries
(c/b @ GBP 10.4)
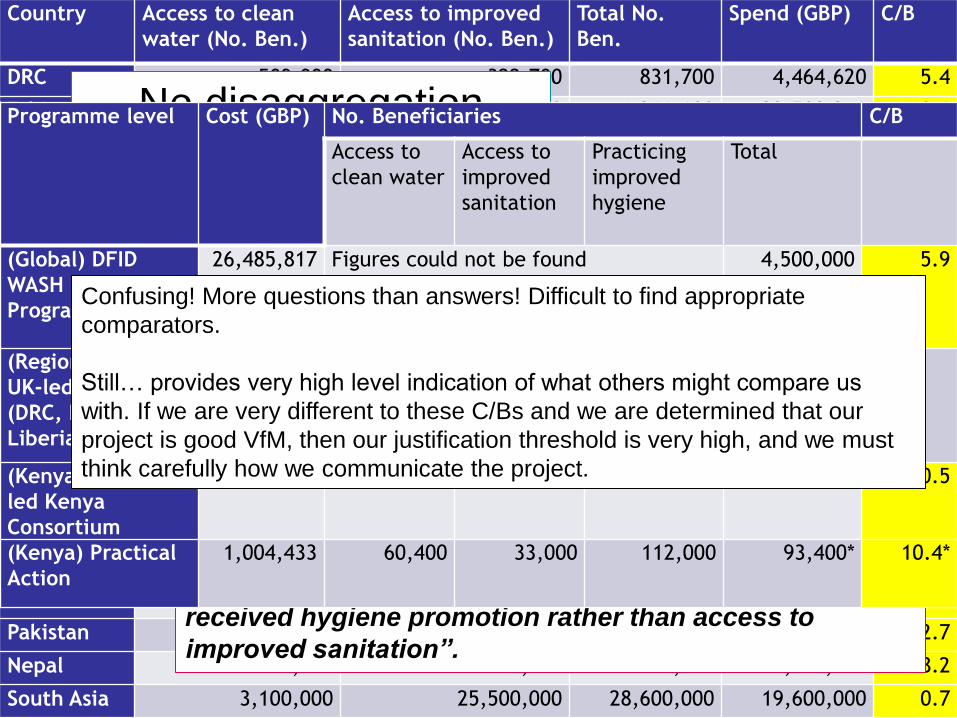
Country Access to clean
water (No. Ben.)
Access to improved
sanitation (No. Ben.)
Total No.
Ben.
Spend (GBP) C/B
DRC 509,000 322,700 831,700 4,464,620 5.4
Ethiopia 760,000 506,600 1,266,600 23,508,216 18.6
Malawi 618,500 149,100 767,600 868,435 1.1
Mozambiqu
e
80,000 30,000 110,000 40,550 0.4
Nigeria 500,000 170,000 670,000 3,909,503 5.8
Sierra
Leone
50,600 545,800 596,400 2,862,312 4.8
Sudan 51,000 2,300 53,300 5,443,134 102.1
Tanzania 112,900 62,000 174,900 4,997,223 28.6
Zambia 23,100 23,100 46,200 692,500 15.0
Zimbabwe 39,200 1,200 40,400 5,706,707 141.3
Africa 2,700,000 1,800,000 4,500,000 41,300,000 9.2
Afghanistan 361,900 361,977 723,877 4,039,099 5.6
Bangladesh 1,913,000 13,684,000 15,597,000 10,477,470 0.7
India 270,000 11,270,000 11,540,000 3,201,717 0.3
Pakistan 500,000 200,000 700,000 1,879,298 2.7
Nepal 34,000 34,000 68,000 3,955,414 58.2
South Asia 3,100,000 25,500,000 28,600,000 19,600,000 0.7
No disaggregation
between rural and
urban WASH
“High numbers in South Asia is principally due to the way in
which sanitation figures were measured during this
period. Beneficiaries in communities in which Community Led
Total Sanitation (CLTS) or Community Approaches to
Sanitation (CATS) had taken place were assumed to have
gained access to improved sanitation. Country offices have
now become more rigorous about how access to improved
sanitation is measured. With new methods of
measurement, it is likely that many of the beneficiaries
recorded here would have been recorded as having
received hygiene promotion rather than access to
improved sanitation”.
DFID WASH Programme
Bangla
desh
DR
C
India
Mala
wi
Mozam
biq
ue
Nepal
Nig
eria
O. P
ale
stinia
n T
.
Sie
rra L
eone
Tanzania
Vie
tnam
Zam
bia
C/B 9 9 4.5 24 25 50 1.5 60 52 15.7 25 15.2
Programme level Cost (GBP) No. Beneficiaries C/B
Access to
clean water
Access to
improved
sanitation
Practicing
improved
hygiene
Total
(Global) DFID
WASH Results
Programme
26,485,817 Figures could not be found 4,500,000 5.9
(Regional) Oxfam
UK-led SWIFT
(DRC, Kenya,
Liberia)
Figures could not be found
(Kenya) Oxfam-
led Kenya
Consortium
5,644,432 201,300 75,100 330,000 275,000 20.5
(Kenya) Practical
Action
1,004,433 60,400 33,000 112,000 93,400* 10.4*
Confusing! More questions than answers! Difficult to find appropriate
comparators.
Still… provides very high level indication of what others might compare us
with. If we are very different to these C/Bs and we are determined that our
project is good VfM, then our justification threshold is very high, and we must
think carefully how we communicate the project.
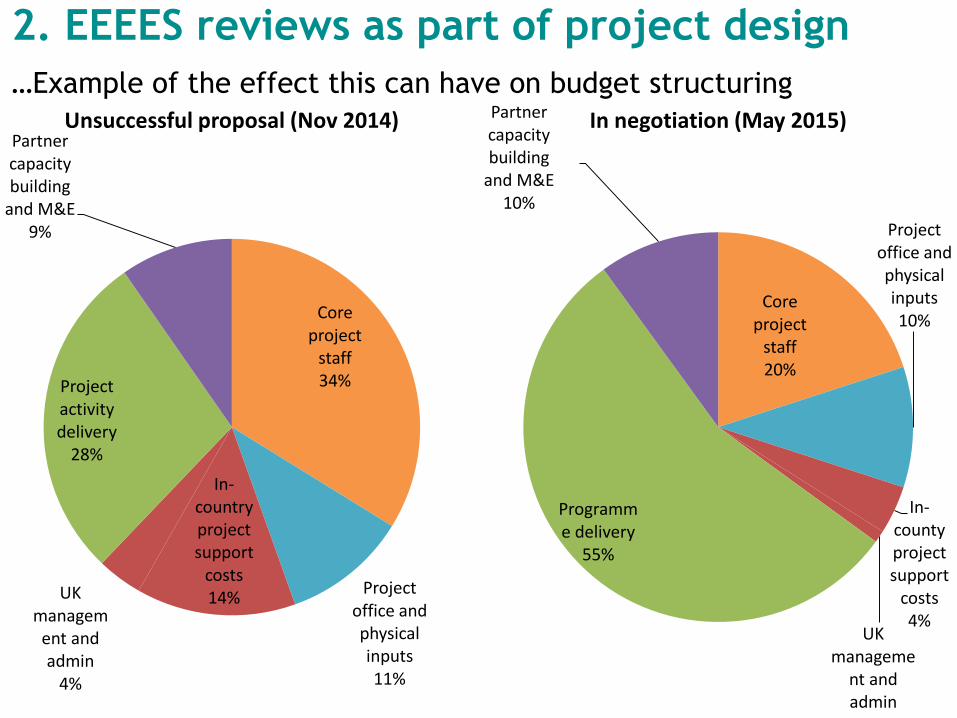
Core project
staff34%
Project office and physical inputs11%
In-country project support
costs14%UK
management and admin
4%
Project activity delivery
28%
Partner capacity building
and M&E9%
Unsuccessful proposal (Nov 2014)
Core project
staff20%
Project office and physical inputs10%
In-county project support
costs4%
UK manageme
nt and admin
1%
Programme delivery
55%
Partner capacity building
and M&E10%
In negotiation (May 2015)
2. EEEES reviews as part of project design
…Example of the effect this can have on budget structuring
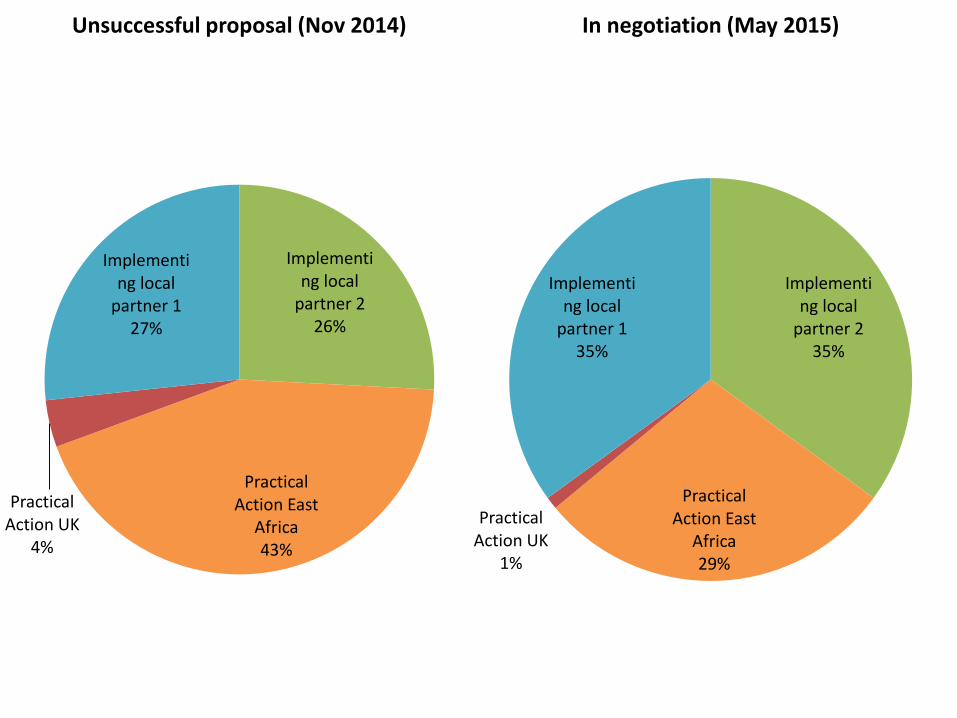
Implementing local
partner 226%
Practical Action East
Africa43%
Practical Action UK
4%
Implementing local
partner 127%
Unsuccessful proposal (Nov 2014)
Implementing local
partner 235%
Practical Action East
Africa29%
Practical Action UK
1%
Implementing local
partner 135%
In negotiation (May 2015)
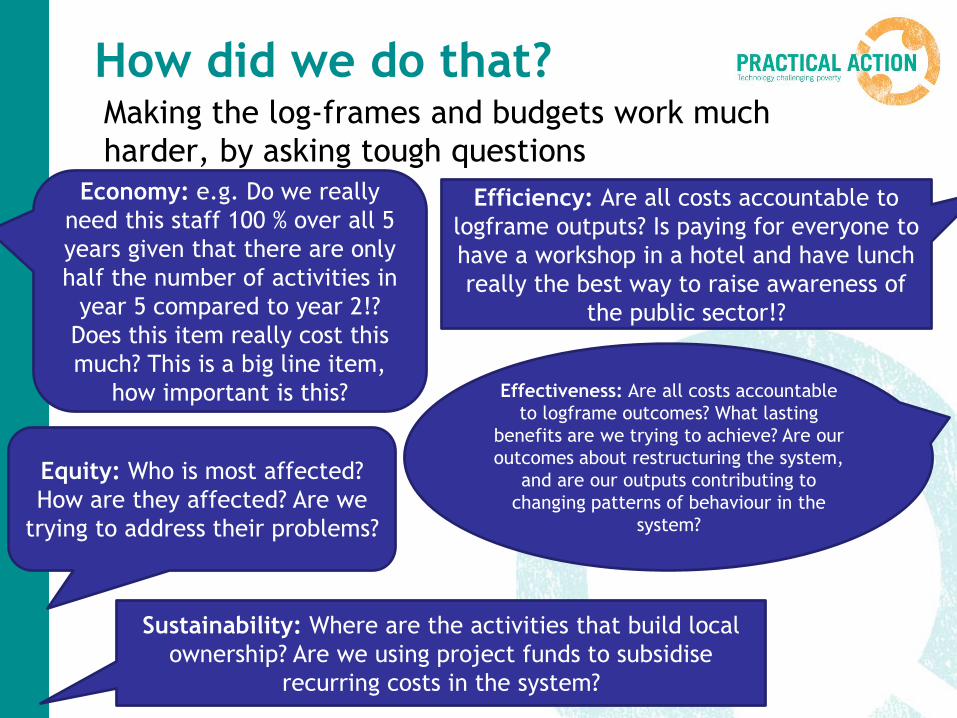
How did we do that?Making the log-frames and budgets work much
harder, by asking tough questions
Economy: e.g. Do we really
need this staff 100 % over all 5
years given that there are only
half the number of activities in
year 5 compared to year 2!?
Does this item really cost this
much? This is a big line item,
how important is this?
Efficiency: Are all costs accountable to
logframe outputs? Is paying for everyone to
have a workshop in a hotel and have lunch
really the best way to raise awareness of
the public sector!?
Effectiveness: Are all costs accountable
to logframe outcomes? What lasting
benefits are we trying to achieve? Are our
outcomes about restructuring the system,
and are our outputs contributing to
changing patterns of behaviour in the
system?
Equity: Who is most affected?
How are they affected? Are we
trying to address their problems?
Sustainability: Where are the activities that build local
ownership? Are we using project funds to subsidise
recurring costs in the system?
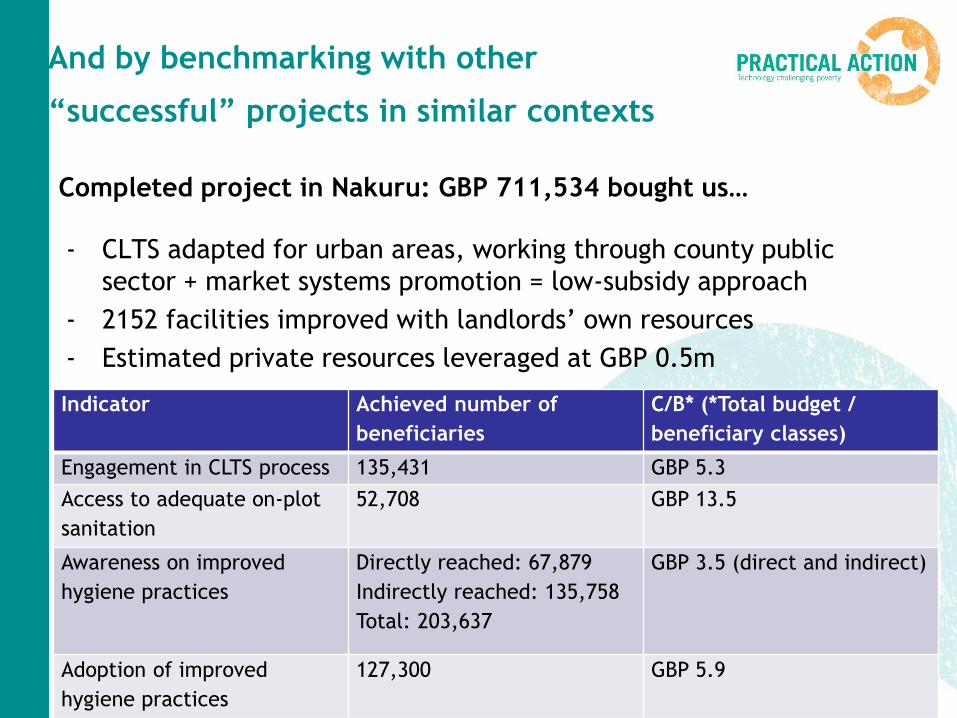
And by benchmarking with other
“successful” projects in similar contexts
Completed project in Nakuru: GBP 711,534 bought us…
- CLTS adapted for urban areas, working through county public
sector + market systems promotion = low-subsidy approach
- 2152 facilities improved with landlords’ own resources
- Estimated private resources leveraged at GBP 0.5m
Indicator Achieved number of
beneficiaries
C/B* (*Total budget /
beneficiary classes)
Engagement in CLTS process 135,431 GBP 5.3
Access to adequate on-plot
sanitation
52,708 GBP 13.5
Awareness on improved
hygiene practices
Directly reached: 67,879
Indirectly reached: 135,758
Total: 203,637
GBP 3.5 (direct and indirect)
Adoption of improved
hygiene practices
127,300 GBP 5.9
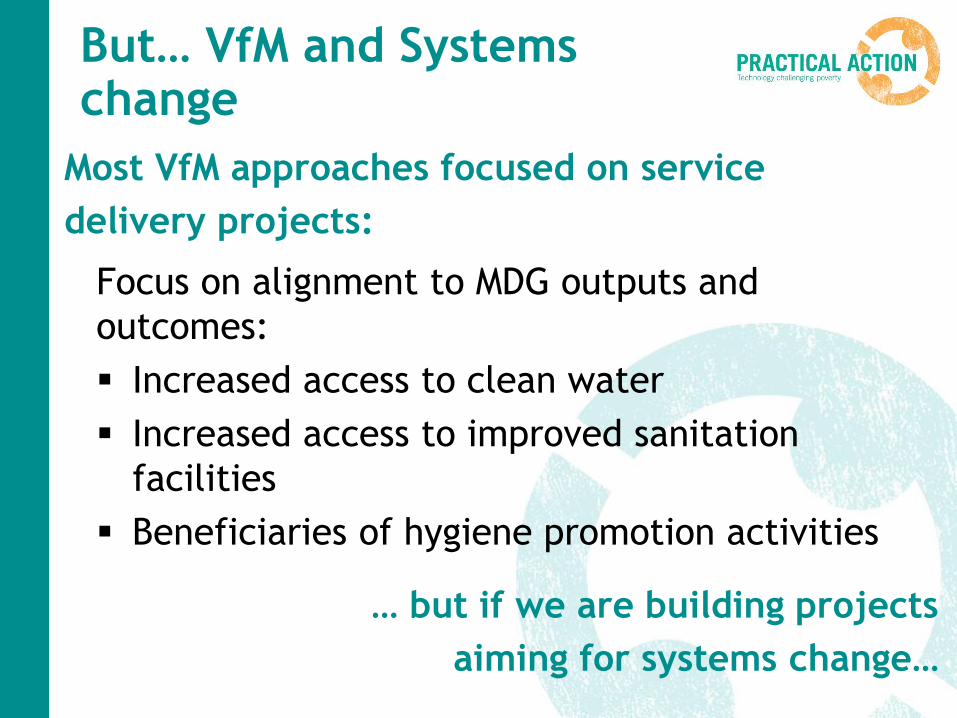
Most VfM approaches focused on service
delivery projects:
Focus on alignment to MDG outputs and
outcomes:
Increased access to clean water
Increased access to improved sanitation
facilities
Beneficiaries of hygiene promotion activities
… but if we are building projects
aiming for systems change…
But… VfM and Systems change
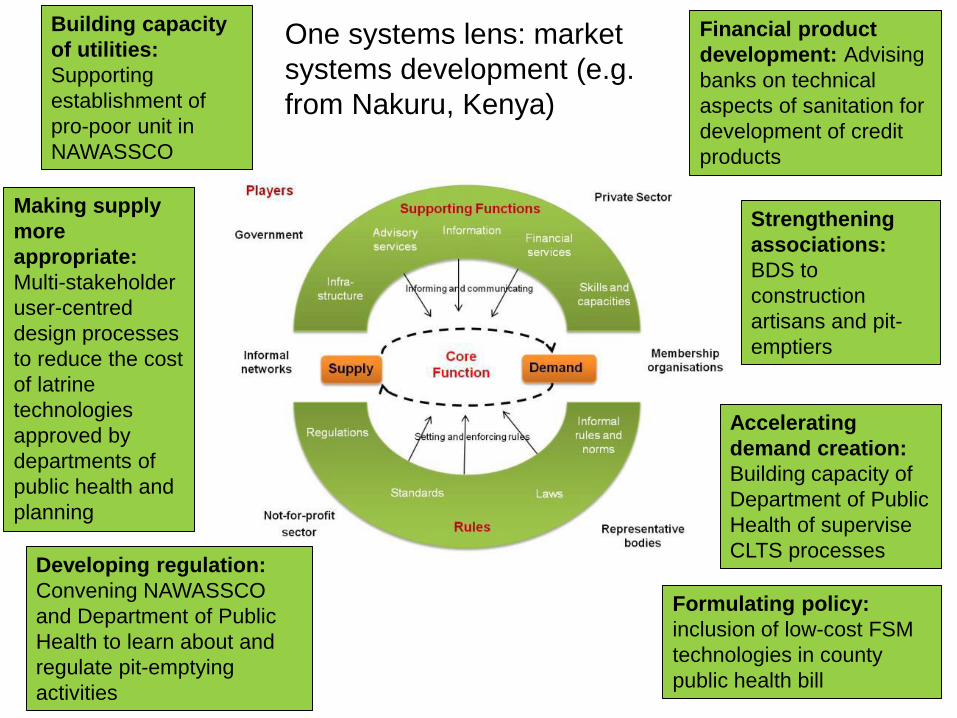
Formulating policy:
inclusion of low-cost FSM
technologies in county
public health bill
Building capacity
of utilities:
Supporting
establishment of
pro-poor unit in
NAWASSCO
Developing regulation:
Convening NAWASSCO
and Department of Public
Health to learn about and
regulate pit-emptying
activities
Financial product
development: Advising
banks on technical
aspects of sanitation for
development of credit
products
Accelerating
demand creation:
Building capacity of
Department of Public
Health of supervise
CLTS processes
Making supply
more
appropriate:
Multi-stakeholder
user-centred
design processes
to reduce the cost
of latrine
technologies
approved by
departments of
public health and
planning
Strengthening
associations:
BDS to
construction
artisans and pit-
emptiers
One systems lens: market
systems development (e.g.
from Nakuru, Kenya)
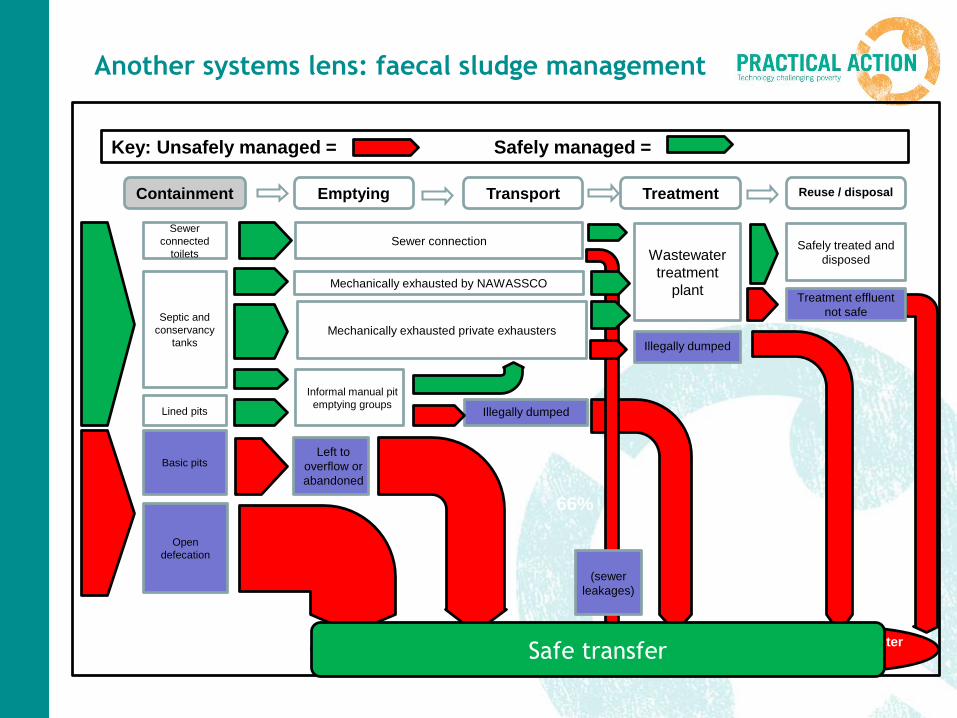
Another systems lens: faecal sludge management
Key: Unsafely managed = Safely managed =
Containment Emptying Transport Treatment Reuse / disposal
Septic and
conservancy
tanks
Sewer connection
Mechanically exhausted by NAWASSCO
Left to
overflow or
abandoned
Open
defecation
Illegally dumped
Residential environment Drainage systemEnvironment / water
body
14%66%
Sewer
connected
toilets
Lined pits
Basic pits
Wastewater
treatment
plant
Informal manual pit
emptying groups
Mechanically exhausted private exhausters
Treatment effluent
not safe
Illegally dumped
Safely treated and
disposed
(sewer
leakages)
Safe transfer
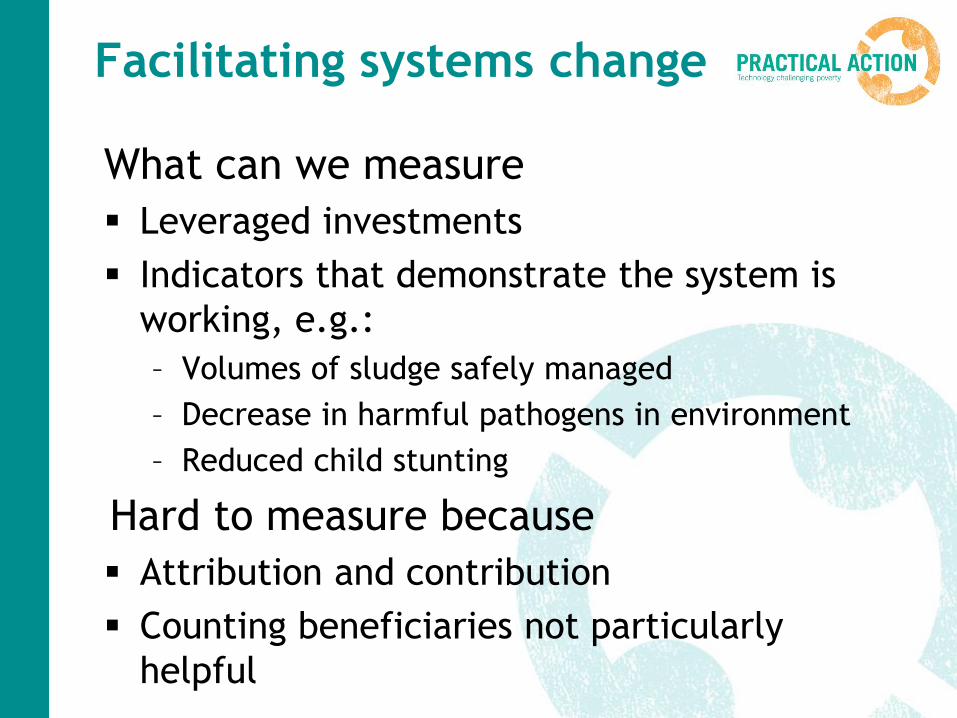
Facilitating systems change
What can we measure
Leveraged investments
Indicators that demonstrate the system is
working, e.g.:
– Volumes of sludge safely managed
– Decrease in harmful pathogens in environment
– Reduced child stunting
Hard to measure because
Attribution and contribution
Counting beneficiaries not particularly
helpful
Conclusions and recommendations so far
VfM driver out of necessity, turns out to be a highly
enriching process
VfM offers a way of closing the loop of learning
between evaluation and business development
C/B is CONFUSING!
EEEES is a very powerful design tool
C/B is a negative influence on thinking systemically
– Let’s make sure that VfM discourse is more
nuanced!
Challenge for the future: Focus on how VfM can
create information to help us plan for “impact-
based financing”, e.g. development impact bonds