Improving the User Experience of Music …...recommender systems. With personalization, systems are...
238
Eingereicht von Bruce Ferwerda Angefertigt am Department of Compu- tational Perception Erstbeurteiler Markus Schedl Zweitbeurteiler Marco de Gemmis Mitbetreuung Marko Tkalcic JOHANNES KEPLER UNIVERSIT ¨ AT LINZ Altenbergerstraße 69 4040 Linz, ¨ Osterreich www.jku.at DVR 0093696 Improving the User Experience of Music Recommender Systems Through Personality and Cultural Information Dissertation zur Erlangung des akademischen Grades Doktor der Technischen Wissenschaften im Doktoratsstudium der Technischen Wissenschaften
Transcript of Improving the User Experience of Music …...recommender systems. With personalization, systems are...

Eingereicht vonBruce Ferwerda
Angefertigt amDepartment of Compu-tational Perception
ErstbeurteilerMarkus Schedl
ZweitbeurteilerMarco de Gemmis
MitbetreuungMarko Tkalcic
JOHANNES KEPLERUNIVERSITAT LINZAltenbergerstraße 694040 Linz, Osterreichwww.jku.atDVR 0093696
Improving the UserExperience of MusicRecommender SystemsThrough Personality andCultural Information
Dissertation
zur Erlangung des akademischen Grades
Doktor der Technischen Wissenschaften
im Doktoratsstudium der
Technischen Wissenschaften

“To dare is to do ... to fear is to fail.”— John Goddard

Sworn Declaration
I hereby declare under oath that the submitted Doctoral Dissertation hasbeen written solely by me without any third-party assistance, informationother than provided sources or aids have not been used and those usedhave been fully documented. Sources for literal, paraphrased and citedquotes have been accurately credited.
The submitted document here present is identical to the electronically sub-mitted text document.
Linz, August 1, 2016
Bruce Ferwerda

Abstract (GER)
Personalisierung ist der nachste Schritt zur Verbesserung der User Expe-rience von Empfehlungssystemen. Mit Hilfe von Personalisierung konnensich Systeme auf das Verhalten, die Vorlieben und Bedurfnisse der Be-nutzer anpassen. Um dies zu erreichen, erstellen Systeme Benutzer-modelle auf Basis der von ihnen generierten Daten, um sodann Adap-tierungen vornehmen zu konnen. Hierbei stellt sich die Frage, wohergenug hochqualitative Daten uber einen (neuen) Benutzer gesammelt wer-den konnen, um akkurate Modelle zu erstellen. Eine Moglichkeit bietenFragebogen, sie sind jedoch aufdringlich und verlangen vom Benutzer Zeitund Aufwand, was deren Interaktion mit dem System beeintrachtigt.
Eine mogliche Antwort auf den Mangel an Daten bietet der Trend, Systememit sozialen Netzwerken uber sogenannte “single sign-on” Schalter fur Lo-gin und Registrierung zu verbinden. Die Verbindung mit sozialen Netzw-erken ist nicht nur praktisch fur Benutzer (z.B. durch Zeitersparnis beimRegistrierungsprozess), sondern erlaubt auch dem System, weitere Infor-mationen uber den Benutzer zu erhalten. Diese sind jedoch nicht immer di-rekt nutzlich fur das System. Um sie bestmoglich zu verwerten, werden all-gemeine Benutzermodelle benotigt, zu denen das Verhalten, die Vorliebenund Bedrfnisse der Nutzer in Relation gebracht werden konnen.
In dieser Dissertation werden Personlichkeit und kultureller Hintergrund vonBenutzern zur Benutzermodellierung betrachtet. Diese zwei Konzepte sinddauerhaft und bestandig, und beeinflussen das Verhalten, die Vorliebenund die Bedrfnisse in realen Situationen. Der Einfluss dieser Konzepteim technologischen Kontext ist jedoch noch relativ unerforscht. Um diesenMangel zu beseitigen und Benutzermodelle auf Basis ebendieser Konzeptezu erstellen, beinhaltet diese Dissertation die folgenden wissenschaftlichenBeitrge:
1. Sie untersucht, ob und wie Personlichkeit und Kultur im Verhaltnis zuVerhalten, Vorlieben und Bedurfnissen stehen.
2. Sie beschreibt eine implizite Art personlichkeits- und kulturrelevanteDaten aus sozialen Netzwerken zu erlangen.
Obwohl allgemeine Benutzermodelle in verschiedenen Kontexten ver-wendbar sind, beschaftigt sich diese Dissertation spezifisch mitEmpfehlungssystemen fur Musik. Zu diesem Zweck, und Bezug nehmendauf das erste Ziel, wurden mehrere Studien uber verschiedene Aspekte desgesamten Musikerlebnisses durchgefuhrt. Ihre Ergebnisse zeigen, dassPersonlichkeit und kulturelle Aspekte Musikkonsumsverhalten, -vorliebenund -bedurfnisse beeinflussen. Zusatzlich zur Erforschung dieses Zusam-
i

menhangs wurde eine benutzerzentrierte Evaluierung von echten person-alisierten Musikempfehlungen durchgefuhrt.
Das zweite Ziel ermoglicht das automatisierte Erstellen vonpersonlichkeits- und kulturbasierten Benutzermodellen mit Hilfe vonsozialen Netzwerken wie Facebook, Twitter, und Instagram: 1) Forderungvon “Sharing”- und “Posting”-Verhalten auf Facebook, sodass mehrInformationen zur Benutzermodellierung zur Verfugung stehen, 2) Be-nutzermodellierung auf Basis von limitierten Informationen aus demBenutzerprofil auf Facebook, 3) das Ausnutzen von Bildeigenschaften vonInstagram-Fotos um Personlichkeitsmerkmale aufgrund der angewandtenFotomanipulationen zu lernen und 4) das Zusammenfuhren von Informa-tionen aus verschiedenen sozialen Netzwerken, Twitter und Instagram, umBenutzermodelle zu verbessern.
Die Ergebnisse dieser Dissertation beinhalten neue Erkenntnisse daruber,wie die Personlichkeit und der kulturelle Hintergrund von Benutzern ihr Ver-halten, ihre Vorlieben und ihre Bedurfnisse in einem musikalischen Kon-text beeinflussen. Die Arbeit zeigt auch, wie Personlichkeits- und kul-turelle Dimensionen aus sozialen Netzwerken gewonnen werden konnen.Die durchgefuhrte Forschung zeigt eine neue umfassende Art personal-isierte Musikempfehlungssysteme zu erstellen, insbesondere mit begren-zten Daten uber das Benutzerverhalten.
Verschiedene Aspekte zur Verbesserung der User Experience wurdenberucksichtigt. Sie lassen sich in drei allgemeine Kategorien un-terteilen:
• Verstehen der Benutzer und ihres Musikkonsumverhaltens, ihrer -vorlieben und -bedurfnisse.
• Impliziter Erwerb von Personlichkeitsmerkmalen der Benutzer aussozialen Netzwerken.
• Benutzerzentrierte Evaluierung von Musikempfehlungssystemen.
Eine allgemeine Beschreibung des vorgestellten personalisiertenMusiksystems findet sich in:
• Ferwerda, B., & Schedl, M. (2016) Personality-Based User Model-ing for Music Recommender Systems. In Proceedings of the Euro-pean Conference on Machine Learning and Principles and Practiceof Knowledge Discovery in Databases (Riva del Garda, IT).
• Ferwerda, B. (2015) The Soundtrack of My Life: Adjusting the Emo-tion of Music. In the 1st Workshop on Collaborating with IntelligentMachines held in conjunction with the 33rd Annual ACM Conferenceon Human Factors in Computing Systems (Seoul, KR).
ii

• Ferwerda, B., & Schedl, M. (2014) Enhancing Music RecommenderSystems with Personality Information and Emotional States: A Pro-posal. In Proceedings of the 2nd Workshop on Emotions and Per-sonality in Personalized Services held in conjunction with the 22ndConference on User Modeling, Adaptation and Personalization (Aal-borg, DK).
Artikel, die den oben vorgestellen Kategorien zugeordnet sind, sind im Fol-genden aufgefuhrt.
Verstehen der Benutzer und ihres Musikkonsumverhaltens, ihrer -vorlieben und -bedurfnisse.
• Ferwerda, B., Tkalcic, M., & Schedl, M. (2016). Exploring MusicDiversity Needs Across Countries. In Proceedings of the 24th Con-ference on User Modeling, Adaptation and Personalization (Halifax,NS, CA).
• Ferwerda, B., & Schedl, M. (2016) Investigating the Relationship Be-tween Diversity in Music Consumption Behavior and Cultural Dimen-sions: A Cross-country Analysis. In Extended Proceedings of the24th Conference on User Modeling, Adaptation and Personalization:1st Workshop on Surprise, Opposition, and Obstruction in Adaptiveand Personalized Systems (Halifax, NS, CA).
• Ferwerda, B., Yang, E., Schedl, M., & Tkalcic, M. (2016) Personal-ity and Taxonomy Preferences, and the Influence of Category ChoiceSet Size on the User Experience for Music Streaming Services. Un-der Review.
• Ferwerda, B., Yang, E., Schedl, M., & Tkalcic, M. (2015) PersonalityTraits Predict Music Taxonomy Preferences. In Extended AbstractsProceedings of the 33rd Annual ACM Conference on Human Factorsin Computing Systems (Seoul, KR).
• Ferwerda, B., Schedl, M., & Tkalcic, M. (2015). Personality & Emo-tional States: Understanding Users’ Music Listening Needs. In Pro-ceedings of the 23rd Conference on User Modeling, Adaptation andPersonalization (Dublin, IR).
• Tkalcic, M., Ferwerda, B., Hauger, D., & Schedl, M. (2015) Person-ality Correlates for Digital Concert Program Notes. In Proceedings ofthe 23rd Conference on User Modeling, Adaptation and Personaliza-tion (Dublin, IR).
iii

Impliziter Erwerb von Personlichkeitsmerkmalen der Benutzeraus sozialen Netzwerken.
• Ferwerda, B., Schedl, M., & Tkalcic, M. (2016) Personality Traitsand the Relationship with (Non-)Disclosure Behavior on Facebook.In Companion Proceedings of the 25th International Conference onWorld Wide Web: 7th International Workshop on Modeling Social Me-dia (Montreal, QB, CA).
• Skowron, M., Ferwerda, B., Tkalcic, M., & Schedl, M. (2016) Fus-ing Social Media Cues: Personality Prediction from Twitter and Insta-gram. In Companion Proceedings of the 25th International Confer-ence on World Wide Web (Montreal, QB, CA).
• Ferwerda, B., Schedl, M., & Tkalcic, M. (2016) Using Instagram Pic-ture Features to Predict Users’ Personality. In Proceedings of the22nd International Conference on MultiMedia Modeling (Miami, FL,US).
• Ferwerda, B., Schedl, M., & Tkalcic, M. (2015) Predicting Person-ality Traits with Instagram Pictures. In Extended Proceedings of the9th ACM Conference on Recommender Systems: 3rd Workshop onEmotions and Personality in Personalized Services (Vienna, AT).
• Ferwerda, B., Schedl, M., & Tkalcic, M. (2014) To Post or Not to Post:The Effects of Persuasive Cues and Group Targeting Mechanisms onPosting Behavior. In Proceedings of the 6th International Conferenceon Social Computing (Stanford, CA, US).
Benutzerzentrierte Evaluierung von Musikempfehlungssyste-men.
• Ferwerda, B., Graus, M., Vall, A., Tkalcic, M., & Schedl, M. (2017)How Item Discovery Enabled by Diversity Leads to Increased Rec-ommendation List Attractiveness. In Submission.
• Ferwerda, B., Graus, M., Vall, A., Tkalcic, M., & Schedl, M. (2016)The Influence of Users’ Personality Traits on Satisfaction and At-tractiveness of Diversified Recommendation Lists. In Extended Pro-ceedings of the 10th ACM Conference on Recommender Systems:4th Workshop on Emotions and Personality in Personalized Systems(Boston, MA, US).
iv

Abstract (ENG)
Personalization is the next step in order to improve the user experience ofrecommender systems. With personalization, systems are able to adapt inorder to give users an experience that is tailored to their behavior, prefer-ences, and needs. To achieve personalization, systems create user modelsbased on user-generated data, so that a suitable adaptation strategy canbe applied. The problem that persists is how to gather enough high-qualitydata about the (new) user to create accurate models. One way to solve thisproblem is to use questionnaires. However, this is not desirable since it isobtrusive, takes a lot of effort and time from the user, and thereby disruptstheir interaction with the system.
The trend of systems being increasingly connected with social network-ing sites (SNSs; e.g., single sign-on buttons for login and registration pur-poses), may offer a better solution to the lack of data problem. The inter-connectedness with SNSs is not only convenient for the user (e.g., skippingregistration procedures by letting the system connect with their SNSs), butalso allows systems to gain additional user information. However, not allthe information may be directly useful for the targeted purpose. In orderto exploit all the information available, general user models are needed towhich users’ behavior, preferences, and needs can be related to and in-ferred from.
In this dissertation, users’ personality and their cultural background are con-sidered for user modeling. These two constructs have shown to be endur-ing and stable, and relate to behavior, preferences, and needs in real-lifesituations. However, how these two constructs relate in a technologicalcontext is still relatively unknown. To address this shortcoming of currentresearch and to effectively create and employ user models in a technologi-cal setting, the scientific contributions of this dissertation are twofold:
1. Investigating whether and how personality and culture relate to be-havior, preferences, and needs.
2. Implicit acquisition of personality and cultural dimensions from SNSdata.
Although the general user models could be employed in any context forpersonalization, the research conducted in this dissertation specifically fo-cuses on the task of music recommendation. To this end, addressing thefirst goal, several studies have been conducted on various aspects of themusic experience: music browsing behavior, music listening needs, andmusic recommendation list diversity. The results indicate that personal-ity and cultural aspects do relate to different music consumption behavior,preferences, and needs. Not only the relationships were investigated, but
v

also a user-centric evaluation was performed, involving real personalizedmusic recommendations.
The second goal provides ways to automatically infer personality and cul-tural user models from SNSs, such as Facebook, Twitter, and Instagram: 1)promoting sharing and posting behavior on Facebook so that more informa-tion becomes available for user model acquisition, 2) user model acquisitionfrom limited user profile information on Facebook, 3) exploiting Instagrampicture features to learn personality traits from information on how usersmodify their pictures on Instagram, and 4) fusing data from several SNSs,Twitter and Instagram, to improve user model acquisition.
The results presented in this dissertation provide new insights in how users’personality and cultural background influence behavior, preferences, andneeds in a music context. The presented works also show how personalityand cultural dimensions can be obtained from SNS data. The conductedresearch as a whole provides a novel comprehensive way for creating apersonalized music recommender system, especially in cases when users’behavioral data with the system is (still) limited.
Different aspects involving the improvement of the user experience wereconsidered, which can be divided into three general categories:
• Understanding users and their music listening behavior, preferences,and needs.
• Implicit acquisition of users’ personal characteristics from social me-dia.
• User-centric evaluation of a music recommender system.
A general description of the proposed personalized music system can befound in:
• Ferwerda, B., & Schedl, M. (2016) Personality-Based User Model-ing for Music Recommender Systems. In Proceedings of the Euro-pean Conference on Machine Learning and Principles and Practiceof Knowledge Discovery in Databases (Riva del Garda, IT).
• Ferwerda, B. (2015) The Soundtrack of My Life: Adjusting the Emo-tion of Music. In the 1st Workshop on Collaborating with IntelligentMachines held in conjunction with the 33rd Annual ACM Conferenceon Human Factors in Computing Systems (Seoul, KR).
• Ferwerda, B., & Schedl, M. (2014) Enhancing Music RecommenderSystems with Personality Information and Emotional States: A Pro-posal. In Proceedings of the 2nd Workshop on Emotions and Per-sonality in Personalized Services held in conjunction with the 22nd
vi

Conference on User Modeling, Adaptation and Personalization (Aal-borg, DK).
The papers depicting each category are highlighted below.
Understanding users and their music listening behavior, preferences,and needs.
• Ferwerda, B., Tkalcic, M., & Schedl, M. (2016). Exploring MusicDiversity Needs Across Countries. In Proceedings of the 24th Con-ference on User Modeling, Adaptation and Personalization (Halifax,NS, CA).
• Ferwerda, B., & Schedl, M. (2016) Investigating the Relationship Be-tween Diversity in Music Consumption Behavior and Cultural Dimen-sions: A Cross-country Analysis. In Extended Proceedings of the24th Conference on User Modeling, Adaptation and Personalization:1st Workshop on Surprise, Opposition, and Obstruction in Adaptiveand Personalized Systems (Halifax, NS, CA).
• Ferwerda, B., Yang, E., Schedl, M., & Tkalcic, M. (2016) Personal-ity and Taxonomy Preferences, and the Influence of Category ChoiceSet Size on the User Experience for Music Streaming Services. Un-der Review.
• Ferwerda, B., Yang, E., Schedl, M., & Tkalcic, M. (2015) PersonalityTraits Predict Music Taxonomy Preferences. In Extended AbstractsProceedings of the 33rd Annual ACM Conference on Human Factorsin Computing Systems (Seoul, KR).
• Ferwerda, B., Schedl, M., & Tkalcic, M. (2015). Personality & Emo-tional States: Understanding Users’ Music Listening Needs. In Pro-ceedings of the 23rd Conference on User Modeling, Adaptation andPersonalization (Dublin, IR).
• Tkalcic, M., Ferwerda, B., Hauger, D., & Schedl, M. (2015) Person-ality Correlates for Digital Concert Program Notes. In Proceedings ofthe 23rd Conference on User Modeling, Adaptation and Personaliza-tion (Dublin, IR).
Implicit acquisition of users’ personal characteristics from social me-dia.
• Ferwerda, B., Schedl, M., & Tkalcic, M. (2016) Personality Traitsand the Relationship with (Non-)Disclosure Behavior on Facebook.In Companion Proceedings of the 25th International Conference onWorld Wide Web: 7th International Workshop on Modeling Social Me-dia (Montreal, QB, CA).
vii

• Skowron, M., Ferwerda, B., Tkalcic, M., & Schedl, M. (2016) Fus-ing Social Media Cues: Personality Prediction from Twitter and Insta-gram. In Companion Proceedings of the 25th International Confer-ence on World Wide Web (Montreal, QB, CA).
• Ferwerda, B., Schedl, M., & Tkalcic, M. (2016) Using Instagram Pic-ture Features to Predict Users’ Personality. In Proceedings of the22nd International Conference on MultiMedia Modeling (Miami, FL,US).
• Ferwerda, B., Schedl, M., & Tkalcic, M. (2015) Predicting Person-ality Traits with Instagram Pictures. In Extended Proceedings of the9th ACM Conference on Recommender Systems: 3rd Workshop onEmotions and Personality in Personalized Services (Vienna, AT).
• Ferwerda, B., Schedl, M., & Tkalcic, M. (2014) To Post or Not to Post:The Effects of Persuasive Cues and Group Targeting Mechanisms onPosting Behavior. In Proceedings of the 6th International Conferenceon Social Computing (Stanford, CA, US).
User-centric evaluation of a music recommender system.
• Ferwerda, B., Graus, M., Vall, A., Tkalcic, M., & Schedl, M. (2017)How Item Discovery Enabled by Diversity Leads to Increased Rec-ommendation List Attractiveness. In Submission.
• Ferwerda, B., Graus, M., Vall, A., Tkalcic, M., & Schedl, M. (2016)The Influence of Users’ Personality Traits on Satisfaction and At-tractiveness of Diversified Recommendation Lists. In Extended Pro-ceedings of the 10th ACM Conference on Recommender Systems:4th Workshop on Emotions and Personality in Personalized Systems(Boston, MA, US).
viii

Curriculum Vitae
Full Name: Bruce Ferwerda
Education
PhD in Computer ScienceJohannes Kepler University (Linz, AT)
2014-2016
MSc in Human-Technology InteractionEindhoven University of Technology (Eindhoven, NL)
2010-2012
BEng in E-TechnologyUniversity of Applied Sciences, HvA (Amsterdam, NL)
2006-2009
Non-Degree Programs
Quantitative Research MethodsUniversity of California, Irvine (Irvine, CA, US)
2015-2015
Cognitive ScienceYonsei University (Seoul, KR)
2012-2013
Distributed & Ubiquitous ComputingWaseda University (Tokyo, JP)
2011-2012
Artificial IntelligenceRadboud University (Nijmegen, NL)
2010-2010
IP DeSeRTS (Erasmus Mundus Program)University of Applied Sciences, EVTEK (Espoo, FI)
2010-2010
Experience
ResearcherJohannes Kepler University (Linz, AT)
2013-2016
Visiting Researcher host: Alfred KobsaUniversity of California, Irvine (Irvine, CA, US)
2015-2015
ResearcherYonsei University (Seoul, KR)
2012-2013
UX Researcher & DesignerMeasureWorks (Almere, NL)
2012-2013
Visiting Researcher host: Tatsuo NakajimaWaseda University (Tokyo, JP)
2011-2012
EngineerStudio Roosegaarde (Waddinxveen, NL)
2009-2010
ix

Acknowledgments
First of all, I would like to thank my advisor Markus Schedl. Theworks presented in this dissertation would not have been possiblewithout him. Furthermore, I would like to thank him for giving me thefreedom to develop and pursue my own research interest within hisproject, and for the numerous conference support to get exposure ofmy work and to be able to create my own academic network.
My special thanks goes out to Marko Tkalcic for the many interestingand fruitful discussions to push the research to the next level. I alsowant to thank him for the great advisory role in my PhD trajectoryeven though I am not able to recognize him as one of my officialadvisors.
Last but not least, I want to thank all of those not directly related to myresearch (i.e., family, friends, and colleagues). Their moral supporthas been of great value to fulfill the requirements for my PhD.
x

Contents
Abstract (GER) i
Abstract (ENG) v
Curriculum Vitae ix
Acknowledgments x
1 Introduction 1
2 Related Works 32.1 Personalization in Recommender Systems . . . . . . 32.2 Personality . . . . . . . . . . . . . . . . . . . . . . . . 5
2.2.1 Personality and the Relationship with Behavior,Preferences, and Needs . . . . . . . . . . . . . 6
2.2.2 Implicit Personality Acquisition . . . . . . . . . 72.3 Cultural Dimensions . . . . . . . . . . . . . . . . . . . 8
3 Dissertation Outline 103.1 Music Systems . . . . . . . . . . . . . . . . . . . . . . 103.2 Understanding Users’ Music Listening Behavior, Pref-
erences, and Needs . . . . . . . . . . . . . . . . . . . 113.3 Implicit Acquisition of Users’ Personal Characteristics
From Social Media . . . . . . . . . . . . . . . . . . . . 133.4 User-Centric Evaluation of a Music Recommender
System . . . . . . . . . . . . . . . . . . . . . . . . . . 15
4 Music Systems 164.1 Enhancing Music Recommender Systems with Per-
sonality Information and Emotional States: A Proposal 174.2 The Soundtrack of My Life: Adjusting the Emotion of
Music . . . . . . . . . . . . . . . . . . . . . . . . . . . 294.3 Personality-Based User Modeling for Music Recom-
mender Systems . . . . . . . . . . . . . . . . . . . . . 33
5 Understanding Users and Their Music Listening Behav-ior, Preferences, and Needs 395.1 Personality & Emotional States: Understanding Users’
Music Listening Needs . . . . . . . . . . . . . . . . . . 405.2 Personality Traits Predict Music Taxonomy Preferences 48

5.3 Personality and Taxonomy Preferences, and the Influ-ence of Category Choice Set Size on the User Expe-rience for Music Streaming Services . . . . . . . . . . 58
5.4 Personality Correlates for Digital Concert ProgramNotes . . . . . . . . . . . . . . . . . . . . . . . . . . . 102
5.5 Exploring Music Diversity Needs Across Countries . . 1105.6 Investigating the Relationship Between Diversity in
Music Consumption Behavior and Cultural Dimen-sions: A Cross-Country Analysis . . . . . . . . . . . . 115
6 Implicit Acquisition of Users’ Personal CharacteristicsFrom Social Media 1286.1 To Post or Not to Post: The Effects of Persuasive Cues
and Group Targeting Mechanisms on Posting Behavior 1296.2 Personality Traits and the Relationship with (Non-
)Disclosure Behavior on Facebook . . . . . . . . . . . 1506.3 Predicting Personality Traits with Instagram Pictures . 1616.4 Using Instagram Picture Features to Predict Users’
Personality . . . . . . . . . . . . . . . . . . . . . . . . 1726.5 Fusing Social Media Cues: Personality Prediction
from Twitter and Instagram . . . . . . . . . . . . . . . 187
7 User-Centric Evaluation of a Music Recommender Sys-tem 1937.1 How Item Discovery Enabled by Diversity Leads to In-
creased Recommendation List Attractiveness . . . . . 1947.2 The Influence of Users’ Personality Traits on Satisfac-
tion and Attractiveness of Diversified Recommenda-tion Lists . . . . . . . . . . . . . . . . . . . . . . . . . . 205
8 General Conclusion 216

1 Introduction
Recommender systems are increasingly implemented in different ar-eas in order to help users to make (better) choices from an abun-dance of choice options. Recommender systems are created to pro-vide suggestions that are most likely of interest to the user. The re-search community on recommender systems made great advancesto improve the recommendation algorithms in order to be able toprovide the user with more accurate recommendations [46]. Usuallyby analyzing users’ implicit (e.g., clicking or buying behavior) and/orexplicit (e.g., rating or weighting of items) feedback on items, a sim-ilarity measurement is created based on the captured feedback ofthe user. Items with the highest predicted similarity rating are thenprovided to the user as a choice set. It follows that the more accu-rate the recommendation algorithm is, the more accurate the recom-mendations will be to the users’ interest. A common reasoning isof causality between recommendation accuracy and the user experi-ence; better recommendations will lead to a higher user experience.Therefore, a majority of research has focused on the improvementof the recommendation algorithms to improve the accuracy of therecommendations.
Research has started to look beyond recommendation accuracy andfound that other factors beside accuracy have influence on the userexperience (e.g., [38]). These factors include other system aspects,such as recommendation diversity (e.g., [4, 23, 58]), but also per-sonal (e.g., product expertise and prior preferences [4, 56]) or situa-tional aspects (e.g., mood and emotion [19]), which all just started toreceive attention in the creation of recommender systems. A prob-lem that persist is how to capture these influential factors or how togather enough behavioral data (this is especially problematic for newusers) in order to infer user preferences for a personalized user ex-perience. A simple way to get to know the user is to let them fill inquestionnaires. However, this is often undesirable since it is obtru-sive, takes a lot of effort and time from the user, and thereby disruptstheir interaction with the system.
The implicit acquisition (i.e., without the use of questionnaires) ofpersonal and situational aspects is still challenging. However, the in-creased connectedness of applications with social networking sites(SNSs) opens new ways to implicitly gather information about the
1

user. For example, single sign-on (SSO) mechanisms 1 allow usersto easily login and register through their SNSs, which allow appli-cations to access the basic user information needed, but are oftenalso granted access to other parts of the users’ profile [10]. Althoughnew information sources become available, not all the informationmay be directly useful for the targeted purpose. In order to exploit allthe information available, general user models are needed to whichusers’ behavior, preferences, and needs can be related to and in-ferred from.
General models, such as cultural dimensions and personality traits,have shown to be enduring and stable, and embody people’s behav-ioral patterns, preferences, and needs in real-life situations [36, 37].However, how these general user models relate in a technologicalsetting is still relatively unknown. The works presented in this disser-tation answers two general research questions (RQs):
1. How do personality traits and cultural background relate to be-havior, preferences, and needs?
2. How can personality traits 2 be implicitly acquired from SNSs?
To investigate how personality traits and cultural background relateto behavior, preferences, and needs, this dissertation specifically fo-cuses on the music domain. That is, the findings of RQ1 are in par-ticular applicable to music recommender systems. The findings ofRQ2 on the other hand are more general, and can be used for anysystem with an SNS connection. The research that was conductedfor both RQs provide a novel comprehensive way for the creationof a personalized music recommender system. Inferring user pref-erences from these user models are especially useful in situationswhen it is not (yet) possible to infer preferences from behavioral datawithin the application.
The dissertation continues with an overview of the related works onthe aforementioned aspects, followed with a dissertation outline con-sisting of a short description of the works that were conducted withinthis PhD trajectory (§3) with the full papers in the sections follow-ing that in §5 (understanding users and their music behavior, prefer-ences, and needs), §6 (implicit acquisition of users’ personal char-acteristics from social media), and §7 (user-centric evaluation of a
1Buttons that allow users to register or login with accounts of other applications. Forexample, social networking services: ”Login with your Facebook account.”
2The focus is laid on implicitly acquiring personality traits as cultural background (i.e.,country information) can usually be easily obtained from the user’s basic profile information.
2
music recommender system). This dissertation ends with a generalconclusion in §8.
2 Related Works
In this section related work is provided about the key areas of thisdissertation. First an overview is given on personalization in recom-mender systems followed by the related work on the general usermodels that are used in this dissertation: personality traits and cul-tural dimensions.
2.1 Personalization in Recommender Systems
Personalization in recommender systems is done on various levelsof the system. The most basic personalization is done by providingrecommendations to the user that are of most interest to them. Byanalyzing the user’s implicit and/or explicit feedback on items, rec-ommender systems are able to calculate similarity measurements tooutput a choice set with items consisting of the highest predicted sim-ilarity. The generation of item similarity measurements are based ongeneral filtering methods: collaborative filtering (i.e., creating recom-mendations based on users with a similar taste), content-based filter-ing (i.e., creating recommendations based on item feedback given inthe past), or hybrid (i.e., a combination of collaborative and content-based filtering) [3], and are assessed using metrics of algorithmic ac-curacy and precision. Ever since research has focused on creatingmore accurate algorithms so that the recommendations more accu-rately reflect the user’s interest. 3 However, the algorithmic improve-ments in accuracy showed to not always lead to improvements in theuser experience [50]. A recommender system’s objective should notonly focus on being accurate, but also on being a pleasure to use forthe user [42].
By adopting an approach that includes the user experience insteadof focusing only on the algorithm, new insights—and sometimescounterintuitive insights in terms of prediction and recommendation
3 Since this dissertation focuses on the user experience, no detailed overview of pastalgorithmic research will be provided. For a comprehensive review on the algorithmic sideof recommender systems see [1, 5, 11, 29, 30].
3

accuracy—were gained, which emphasizes the importance of look-ing at recommender systems from a user experience perspective.For example, a list of items in which each item is highly accurate maybecome a bad recommendation as a collective [58]. A list consistingof highly accurate items may cause that the items in the recommen-dation list become too similar and thereby covering a too narrow in-terest of the user [7]. Having items that are too similar to each othermay also have negative psychological effects on the user. It maycause that the user will experience choice overload, which in turncan lead to an increase of choice difficulties [4, 38, 56].
The user experience research in recommender systems does notonly focus on algorithmic deviations, but covers other aspects of thesystem as well, such as presentation and interaction styles. Re-search has shown that other factors besides the algorithm play arole in the subjective evaluations of users on the recommender sys-tem. For example, including explanations about why a certain rec-ommendation is made has shown to positively influence the user ex-perience, such as scrutability (i.e., users will better understand whatto change when recommendations are not satisfying), trust (i.e., in-creased confidence in the system), efficiency and effectiveness (i.e.,let users make faster and better decisions), or persuasiveness (i.e.,convince users to try a recommendation), which all at the end influ-ences the user satisfaction with the system and its recommendations(see [51] for an overview on the work on providing explanations inrecommender systems).
With the findings of how to improve the user experience in recom-mender systems, the next step in personalization was made. More-over, research found nuances in their findings showed that individualdifferences may occur, which indicate that the (general) results onimproving the user experience may affect users differently [4, 48, 56].Bollen et al. [4] and Willemsen et al. [56] showed in their studieswith a movie recommender system that besides the positive effectsof recommendation diversity on choice difficulties and satisfaction,personal characteristics (e.g., strength of prior preference, domainexpertise [4, 56]) influences the found relationships.
The relation between users’ personal characteristics and their pref-erences for recommender systems have not been investigated a lotyet. Although domain expertise and strength of prior preferenceshave been identified as influential personal characteristics, it remainschallenging to capture these personal characteristics without disturb-ing the user with questionnaires. Another way to overcome this prob-
4

lem is by analyzing behavior data of users with the system. However,two common problems are arising here: 1) gathering enough behav-ioral data, and 2) not all the behavioral data is useful for or related tothe personalization purpose.
One way to overcome the aforementioned problems, is by exploitinginformation from external sources. Systems are getting increasinglyconnected with SNSs through SSO mechanisms. Before SNSs re-lease users’ profile information to a system, users need to accepta consent form that states which parts of the profile is going to beaccessed by the system. Besides accessing users’ basic profile in-formation, systems often ask for additional permissions for accessingother parts of users’ profile [10]. By granting access to other partsof the profile, systems are able to unobtrusively infer users’ prefer-ences. As this data may also not directly be useful for the targetedpurpose, and to be able to effectively use all the information avail-able, general user models are needed to which users’ behavior, pref-erences, and needs can be related to. Once the general user modelabout a user is created, their preferences can be inferred and ap-plied to the system for a personalized user experience. Two generaluser models (i.e., personality and cultural dimensions) are used inthis dissertation, which are discussed in the following sections.
2.2 Personality
The use of users’ personality plays a main role in this dissertation.Personality traits are used as a general user model to investigate therelationship with users’ their behavior, preferences, and needs forpersonalization of a music recommender system. Personality hasshown to characterize a person’s thoughts, feelings, social adjust-ments, and behaviors, which subsequently influences their expecta-tions, self-perceptions, values, attitudes, and their reactions to oth-ers, problems, and stress [39, 57]. Although recent findings haveshown that people can alter their personality, it requires a lot of effortand awareness [34]. In general, people’s personality is enduring andremains stable over time, and since it characterizes different patternsof a person, it makes it very well suited for user modeling.
To define a person’s personality, different models have been createdto categorize personality, where the five-factor model (FFM) is mostwell known and widely used [41]. The FFM consists of five generaldimensions that describe personality. Each of the five dimensions
5

relates to a cluster of correlated primary factors. Table 1 shows thegeneral dimensions with the corresponding primary factors.
General Dimensions Primary FactorsOpenness to Experience Artistic, curious, imaginative, insightful, orig-
inal, wide interestConscientiousness Efficient, organized, planful, reliable, respon-
sible, thoroughExtraversion Active, assertive, energetic, enthusiastic,
outgoing, talkativeAgreeableness Appreciative, forgiving, generous, kind, sym-
pathetic, trustingNeuroticism Anxious, self-pitying, tense, touchy, unsta-
ble, worrying
Table 1: Five-factor model adopted from [35]
2.2.1 Personality and the Relationship with Behavior, Preferences,and Needs
Until now, personality research has mainly focused on identifyingindividual differences in real-life situations (i.e., social and physicalenvironments; [40]). How personality-based differences in a techno-logical setting manifest is still relatively unknown. However, some ofthe findings on personality in real-life situations are already suitableto be implemented in domain-specific technologies. For example,Rentfrow and Gosling [45] identified relationships between personal-ity traits and music preferences, such as cheerful music with vocalsshowed a positive relationship with extraversion while artistic and in-tricate music showed a positive relationship with openness to experi-ence. Although these relationships were identified as preferences inreal-life situations, they could also be implemented in personalizedsystems (e.g., the results of the example could be implemented inmusic recommender systems).
There is an increased interest in identifying personality-based indi-vidual differences in technological settings and how to implementthe findings for personalization. In an exploratory study on health-promoting applications, Halko and Kientz [28] found indications thatconscientious users would be most likely to achieve their health goalsand more likely to use and influenced by socially-based technologies.Chen et al. [9] showed personality-based diversity preferences in a
6

movie recommender system, such as neurotic users favor a recom-mendation list with movies from diverse directors. Tkalcic et al. [53]proposes a method to use personality traits to overcome the ”cold-start problem” in recommender systems. 4
Including personality information in recommender systems hasproven its merits. Hu and Pu [33] showed that personality-basedrecommender systems are more effective in increasing users’ loy-alty towards the system and decreasing cognitive effort comparedto systems without using personality information. Although the gen-eral nature of personality makes it applicable across different do-mains [6], the domain-specific relationships with personality need tobe revealed first so that the system can adopt the right personaliza-tion strategy.
2.2.2 Implicit Personality Acquisition
Although the advantages of personality-based systems have beenshown and the relationships between personality traits with domain-specific personalizations are being investigated, the acquisition ofpersonality traits is still challenging. The most straightforward wayto get to know the personality of users is by using a questionnaire.However, this is often time-consuming and interrupts the user’s in-teraction with the system. Inferring personality traits from behavioraldata with the system is problematic as well as enough data for infer-ence is often lacking; especially with new users. Another possibilityis by using external information sources, which is made possible bythe increased connectedness of systems with SNSs. With the useof SSO mechanisms systems are accessing users’ basic profile in-formation. Besides the basic profile information additional permis-sions are often asked to access other parts of the user profile [10].By granting access, opportunities are provided to unobtrusively inferusers’ personality traits.
There is an increase body of work focusing on inferring personal-ity traits from different kind of information sources (see [55] for anoverview). As for inferring personality traits from SNSs that couldbe implemented in a personality-based system, research has beenmainly focusing on Facebook [2, 8, 27, 43, 47] and Twitter [26, 44].
4The cold-start problem is most prevalent in recommender systems and occurs with newusers of the application. It refers to that (almost) no information exists yet about the user tomake inferences from.
7

The research on Facebook has been focusing on different aspectsof a user profile to infer user’s personality from. Celli et al. [8] lookedat profile pictures on Facebook and showed, for example, that ex-traverts tend to have pictures where they are smiling and are takenwith other people. Park et al. [43] used the linguistic features of Face-book users to determine their personality, whereas Ross et al. [47]found relationships between personality and Facebook usage. Theresearch on inferring personality from Twitter has analyzed the lin-guistic features that are used by a user (e.g., negations, articles; [26])and how users are connected with their social network (e.g., follow-ing, followers; [44]).
2.3 Cultural Dimensions
Next to personality traits, cultural dimensions have been used insome of the works in this dissertation. Whereas personality traits fo-cus on the individual, cultural dimensions describe a whole society:how a culture has its effects on values, which influences behavior ofmembers of the society [31]. As well as with personality traits, thedomain-specific relationships with cultural dimensions need to be re-vealed before we are able to use them for personalization. This isimmediately also the disadvantage of using cultural dimensions as itis hard to infer these relationships due to the difficulties to performsuch large-scale experiments with enough participants around theworld. However, once the relationships are known, the advantage ofusing cultural dimensions over personality traits is that country infor-mation is usually standard in a user profile of the system, whereaspersonality traits need to be inferred indirectly.
There are different cultural models to which behavior, preferences,and needs can be related to (e.g., Hofstede [31], GLOBE [32] andTrompenaar’s [54] cultural dimensions). The most comprehensivemodel is the Hofstede’s model of cultural dimensions [31]. Althoughthis model originates from 1968, it is still being actualized. Hofstede’scultural dimensions comprises 97 countries, which are categorizedby six dimensions: power distance index, individualism, uncertaintyavoidance index, masculinity, long-term orientation, and indulgence.Each of the dimensions are shortly described below:
Power distance: defines the extent to which power is distributed un-equally by less powerful members of institutions (e.g., family). Highpower distance indicates that a hierarchy is clearly established and
8

executed in society. Low power distance indicates that authority isquestioned and attempted to distribute power equally.
Individualism: defines the degree of integration of people into soci-etal groups. High individualism is defined by loose social ties. Themain emphasis is on the ”I” instead of the ”we,” while opposite for lowindividualistic cultures.
Masculinity: defines a society’s preference for achievement, hero-ism, assertiveness and material rewards for success (countries scor-ing high in this dimension). Whereas low masculinity represents apreference for cooperation, modesty, caring for the weak and qualityof life.
Uncertainty avoidance: defines a society’s tolerance for ambiguity.High scoring countries in this scale are more inclined to opt for stiffcodes of behavior, guidelines, laws. Whereas more acceptance ofdifferent thoughts and/or ideas are more common for those scoringlow in this dimension.
Long-term orientation: is associated with the connection of thepast with the current and future actions and/or challenges. Lowerscoring countries tend to believe that traditions are honored and kept,and value steadfastness. High scoring countries believe more thatadaptation and circumstantial, pragmatic problem-solving are nec-essary.
Indulgence: defines in general the happiness of a country. Coun-tries scoring high in this dimension are related to a society that al-lows relatively free gratification of basic and natural human desiresrelated to enjoying life and having fun (e.g., be in control of their ownlife and emotions). Whereas low scoring countries show more con-trolled gratification of needs and regulate it by means of strict socialnorms.
9

3 Dissertation Outline
The general scientific contribution of the works presented in this dis-sertation comes in twofold:
• Showing how users’ personality traits and cultural dimensionsrelated to behavior, preferences, and needs
• Implicit acquisition of personality from SNSs.
While the works in each of the aforementioned points have their ownnovel contributions to the respective fields. The works altogetherprovide a holistic view of how personality and cultural information canbe applied and used to a music recommender system to improve theuser experience.
Each of the research conducted can be placed in one of the cate-gories of Figure 1. A short description of each work is discussed inthe upcoming sections.
User-Centric Evaluation of a Music Recommender System
Understanding Users’ Music Behavior, Preferences, & Needs
Personal Characteristics Acquisition from SNSs
Music Recommender System
Figure 1: Categorization of the works that have been done.
3.1 Music Systems
Based on the conducted research, several proposals have beenmade about how to implement the findings. In §4.1 [17] a musicrecommender system is proposed that besides using personality for
10

personalizing a playlist also takes into account the current mood ofthe user. The current mood of the users is captured by real-life track-ing of the user’s Twitter feeds since Tweeting is a real-time activity,which users often use to express their feelings about their activitiesimmediately. This allows for adjusting the music playlist in order to fitthe user’s current emotional state and their preferred way of emotionregulation.
In §4.2 [12] a system is proposed with which users can easily ad-just the expressed emotion of a song by using predefined settingsto either fit their emotional state, emotion regulation strategy, or fit aspecific context.
The system proposed in §4.3 [14] is the most comprehensive pro-posal and incorporates the findings of all of the personality-basedresearch in the sections below. It shows how the results can be im-plemented in different areas of the music recommender system toprovide users with a personalized user experience (i.e., user inter-face, music recommendations, playlist composition).
3.2 Understanding Users’ Music Listening Behavior, Prefer-ences, and Needs
The research presented in the following sections reveals relation-ships between users’ personality or cultural dimensions with differentbehaviors, preferences, and needs.
User InterfaceIn §5.1 [24] and §5.2 [25] the relationship was explored between per-sonality traits and music browsing strategies of the most popular mu-sic taxonomies (i.e., mood, genre, and activity) that are used by sys-tems to organize their music. Furthermore, in §5.2 [25] an extensionis presented where choice overload is investigated (i.e., the numberof categories after choosing a music taxonomy). For these studiesan online music streaming service was simulated where participantswere asked to interact with the system. By capturing their naviga-tional behavior in the system and their subjective system evalua-tion (e.g., satisfaction, attractiveness, preference) through conclud-ing questionnaires, relationships with their personality could be re-vealed. For example, findings indicate that those scoring high onopenness to experience show a high preference for browsing for mu-
11

sic by mood, while conscientious users show a preference for brows-ing by activity. The findings of could be used to adapt the user inter-face to meet the user’s preferred way of music browsing.
Listening NeedsThe study in §5.3 [19] looked at the relationship between personalitytraits and emotionally-laden music and how preferences change de-pending on the emotional state of the user. A controlled experimentwas used consisting of the following steps:
1. Assessing participant’s initial emotional state
2. Inducing an emotional state (one of the six basic emotions:happy, angry, disgust, fear, sad, surprise) through standardizedvideo clips
3. Assessing participant’s emotional state after the video clip (ma-nipulation check)
4. Rating emotionally-laden music (standardized music clipsbased on the six basic emotions) on the listening likelihood con-sidering the current emotional state
The results show that, in general, users like to listen to music in linewith their emotional state. However, individual differences based onpersonality occur; especially in a negative emotional state (e.g., sad-ness). We found that when in a negative emotional state, those whoscored high on openness to experience, extraversion, and agree-ableness tend to cheer themselves up with happy music, while thosewho scored high on neuroticism tend to prefer to dwell a bit longer inthis negative state by listening to sad music. This has important im-plications for playlist generation. By inferring users’ emotional state(e.g., mining user-generated content), the next song can be bettertargeted toward their needs.
Meta informationIn §5.4 [52] the amount of meta information to be presented along-side the music piece was investigated, and explored whether thepreferred amount is influenced by the user’s personality. The resultsshowed that the following personality traits tend to have a higher pref-erence for more meta information: openness to experience, agree-ableness, conscientiousness, and extraversion. This provides im-plications about the amount of meta information a system should
12

present to the user without them experiencing information overload,which in turn, negatively affects the user experience of the user.
Diversity NeedsIn §5.5 [23] and §5.6 [13] the diversity in music listening behaviorwas explored between countries. A Last.fm dataset was used withlistening behavior of 53,309 users of 47 countries. Different diversitymeasurements were computed on a genre and artist level in orderto explore whether differences in listening behavior is culturally em-bedded. Relationships of diversity in music listening behavior andcultural dimensions were found. For example, music listeners fromindividualistic countries tend to listen to more diverse music on anartist as well as on a genre level. The results provide implicationson how recommendation list diversity should differ based on wherethe user is from. Individual diversity differences are explored anddiscussed in §7.1 [16] and §7.2 [15] together with a user-centric eval-uation.
3.3 Implicit Acquisition of Users’ Personal CharacteristicsFrom Social Media
In order to apply the personality-based results for personalization,attention was given to the implicit acquisition of personality traits fromSNSs. The most popular SNSs were explored to acquire personalitytraits from: Facebook, Instagram, and fusing multiple sources (i.e.,Twitter and Instagram).
FacebookA usual prerequisite for implicit personality acquisition is the avail-ability of data. In §6.1 [18] the underlying psychological mechanismsof sharing and posting behavior of Facebook users was investigated.The findings show that sharing and posting behavior often is sub-ject to anticipated regret. This anticipated regret originates from the(wrong) estimation of how the user’s audience (i.e., social network)perceive the content. Based on these results, technologies can bedeveloped that analyze the user’s social network, which would allowfor the creation of proxy measures to counteract on wrong estima-tions of the content appropriateness by the user.
13

In §6.2 [21] personality acquisition when data is limited was investi-gated. The relationship between disclosing or not disclosing of pro-file sections of a Facebook user profile and personality traits wereexplored. Results showed that non-disclosure behavior provide in-dications of a user’s personality. The personality predictor that wascreated showed to be able to approximate the results state-of-the-artmethods.
InstagramEven though Instagram is a popular SNS, it is still unexplored for per-sonality acquisition. In §6.3 [20] and §6.4 [22] a personality predictorwas created based on the picture features of user’s Instagram pic-tures (i.e., how filters were applied to modify the characteristics ofthe pictures). The rational of analyzing Instagram pictures and theirrelationship with the user’s personality comes from that Instagramfeatures different filters that allow users to modify their pictures. Thefilters facilitate the possibility for users to create and express theiridentity, which could be related to their personality.
The focus in §6.3 [20] and §6.4 [22] was laid on picture features in-stead of the type of filter, since the type of filter users use dependon how the original pictures looks like. It could well be that differentfilters are applied to achieve the same feeling in the end result. Byanalyzing the picture features, distinct relationships with personalitytraits were found. For example, very open users tend to apply filtersto their pictures so that they express more green tones. A reliablepredictor could be created with the relationships found between pic-ture features and personality traits.
Fusing Twitter and InstagramSince personality acquisition from Twitter has been explored well, thestudy presented in §6.5 [49] looked at whether combining cues fromdifferent SNSs would be able to increase the accuracy of a person-ality predictor. By using linguistic and meta information from Twitterand linguistic and image information from Instagram, a significantimprovement in predicting user’s personality was achieved.
14

3.4 User-Centric Evaluation of a Music Recommender Sys-tem
As mentioned before: only relying on measurements of algorithmicaccuracy and precision is not enough. Applying a user-centered ap-proach may lead to conclusions that deviate from algorithmic evalu-ations. Therefore, it is important to conduct user-centric evaluationwhen the goal is to improve the user experience of a system.
The user-centric evaluation in this dissertation could only be on partof the results presented in this dissertation. This was due to the diffi-culty to recruit enough participants. The user-centric evaluation wasdone based on music recommendation list diversity. In §7.1 [16] themechanisms underlying the increased attractiveness due to musiclist diversity was explored. Findings show that diversifying music rec-ommendation lists is only beneficial if it contributes to the discoveryof new music that broadens or deepens the taste of the user.
In §7.2 [15] was investigated how satisfaction and attractiveness withdiversified music recommendation lists differ based on the person-ality of users. The results show that different levels of diversifica-tion were preferred based on the user’s personality. Conscientioususers showed to have a preferences for more diversification in therecommendation list, while agreeable users have a preferences for amid-level of diversity.
15

4 Music Systems
Ferwerda, B., & Schedl, M. (2014) Enhancing Music Recom-mender Systems with Personality Information and EmotionalStates: A Proposal. In Proceedings of the 2nd Workshop onEmotions and Personality in Personalized Services held in con-junction with the 22nd Conference on User Modeling, Adapta-tion and Personalization (Aalborg, DK).
Ferwerda, B. (2015) The Soundtrack of My Life: Adjusting the Emo-tion of Music. In the 1st Workshop on Collaborating with Intel-ligent Machines held in conjunction with the 33rd Annual ACMConference on Human Factors in Computing Systems (Seoul,KR).
Ferwerda, B., & Schedl, M. (2016) Personality-Based User Mod-eling for Music Recommender Systems. In Proceedings ofthe European Conference on Machine Learning and Principlesand Practice of Knowledge Discovery in Databases (Riva delGarda, IT).
16

Enhancing Music Recommender Systemswith Personality Information and EmotionalStates: A Proposal
Published in: Extended Proceedings of the 22nd Conference on User Modeling,Adaptation, and Personalization (UMAP 2014): 2nd Workshop on Emotions andPersonality in Personalized Systems (EMPIRE 2014; Aalborg, DK)
BRUCE FERWERDA, Johannes Kepler University, Linz (AT)MARKUS SCHEDL, Johannes Kepler University, Linz (AT)
Abstract
This position paper describes the initial research assumptions to im-prove music recommendations by including personality and emotionalstates. By including these psychological factors, we believe that theaccuracy of the recommendation can be enhanced. We will give atten-tion to how people use music to regulate their emotional states, andhow this regulation is related to their personality. Furthermore, we willfocus on how to acquire data from social media (i.e., microbloggingsites such as Twitter) to predict the current emotional state of users.Finally, we will discuss how we plan to connect the correct emotionallyladen music pieces to support the emotion regulation style of users.
Keywords: Music Recommender Systems, Personality, EmotionalStates, Emotion Regulation
1 Introduction
Research on recommender systems have shown increased interest to in-corporate psychological aspects. Especially the relationship between per-sonality and user preferences has gained a lot of attention. For example,knowledge about the influence of personality traits on music taste [25], anddiversity in item recommendations [39] have been exploited to improve theuser tailored recommendation. As personality is defined as the individ-ual differences in enduring emotional, interpersonal, experiential, attitudi-nal and motivational styles [12, 17], one can expect to be able to infer muchmore based on personality traits to improve the recommendation.
The goal of this project is to improve music recommendations by incorpo-rating additional psychological factors. More specifically, we focus on emo-
17

tional states and their relationship with personality to infer music taste andpreferences. By knowing the user’s current emotional state, a system cananticipate its recommendation with an emotionally laden song that is in linewith the user’s style of emotion regulation (e.g., changing or maintainingtheir emotional state).
In the following sections we give a brief introduction about what is knownabout personality and emotional states, and work towards how we are plan-ning to use it to improve recommendations.
2 Personality
Personality has shown to be an enduring factor that influences an individ-ual’s behavior [13], interest, and tastes [14, 25]. As personality plays such aprominent role in shaping human preferences, one can expect similar pat-terns (i.e., behavior, interest, and tastes) to emerge between similar per-sonality traits [2].
Different models have been created to categorize personality, where thefive-factor model (FFM) is most well known and widely used [17]. TheFFM consists of five general dimensions that describe personality. Eachof the five dimensions consist clusters of correlated primary factors. Ta-ble 1 shows the general dimensions with the corresponding primary fac-tors.
General dimen-sions
Primary factors
Openness artistic, curious, imaginative, insightful, original, wide in-terest
Conscientiousness efficient, organized, planful, reliable, responsible, thor-ough
Extraversion active, assertive, energetic, enthusiastic, outgoing,talkative
Agreeableness appreciative, forgiving, generous, kind, sympathetic,trusting
Neuroticism anxious, self-pitying, tense, touchy, unstable, worrying
Table 1: Five-factor model
There is an emerging interest in how personality relates to user preferencesin different domains. This provide valuable information for the developmentof domain specific recommender systems. Knowing someone’s personalitycan help to infer their preferences [23, 24, 25], and can therefore contributeto a more accurate recommendation. For example, music preferences werefound to be correlated with personality traits [25]. Rentfrow and Gosling
18

[25] categorized music pieces into 4 music-preference dimensions (reflec-tive and complex, intense and rebellious, upbeat and conventional, andenergetic and rhythmic), and found correlations with the FFM general di-mensions, such as, a relation between energetic and rhythmic music andextraversion and agreeableness.
The prediction of personality parameters is starting to establish by either us-ing implicit acquisition (e.g., personality prediction by extracting data fromsocial media [8, 16, 22]), or explicit acquisition by letting users answeringa personality quiz [10]. Although the implicit method is unobtrusive, accu-racy is compromised as it dependents on the quality of the source (e.g.,frequency of expressing on social media). On the other hand, the explicitmethod is more accurate, but intrusive and time consuming.
3 Emotional States
We can find emotions in every facet of our life, such as during: decisionmaking, objective and subjective thinking, creativity. To categorize the emo-tional states we experience, Ekman [5] defined six basic emotional statesin which we can categorize experienced emotion: anger, disgust, fear, hap-piness, sadness, and surprise. Others on the other hand believe that emo-tions are a mix of dimensions of emotional states [35].
To deal with our emotional states throughout the day, we adapt differentstrategies. Parkinson and Totterdell [21] defined 162 different strategies(e.g., exercising, music listening, taking a bath). Especially listening to mu-sic plays an important role. Research has found that music is the secondmost strategy used [36, 7]. It can change, create, maintain, or enhanceemotions [3]. This suggest that music can play an important supportiverole when people dealing with their emotions in daily life.
Just as with personality, there is also an implicit (e.g., blog text) and an ex-plicit way to detect emotion with the same drawbacks. Although the implicitdetection has advanced, it goes without saying that automatic capturing ofonline emotional states remain challenging. As Scherer [28] noted "Theinherent fuzziness and the constant evolution of language categories aswell as inter-language, inter-cultural, and inter-individual differences makeit difficult to define central working concepts".
19

4 Personality & Emotional States
How we regulate our emotions have been investigated with relation to ourpersonality. Of particular interest are the neuroticism and extraversion di-mensions. These dimensions are associated with experiencing negativeand positive affect consistently. For example, Tamir [32] found that peoplescoring high on the neuroticism dimension tend to increase their level ofworry. Similarly, people who score low on the extraversion dimension tendto be less motivated to increase their happiness [33].
While most studies are focusing on personality traits in relation to emotionregulation, there is a small area that argues that the emotion regulationstyle can be explained by one’s implicit theory of emotion. In other wordswhether someone beliefs that emotions are fixed (entity theorist), or moremalleable (incremental theorist). Entity theorists experience more nega-tive emotions, that is, less favorable emotion experiences, lower well-being,greater depression, more loneliness, and poorer social adjustments com-pared to incremental theorists [34].
Music has the ability to induce intense emotions (positive and negative)[40]. Some studies have investigated how, and whether the emotion thatconsist in music is used by people in their emotion regulation. Thoma et al.[38] categorized different music pieces on valence and arousal, and foundthat different pieces were preferred depending on the emotionally ladensituation. Similarly, Van Goethem and Sloboda [7] found that people usemusic to support their regulation strategy. For example, music is used tohelp to distract from the affect or situation, or can help to think about it ina rational way. Despite findings on an individual level (i.e., personality) andhow music is used as a regulation strategy, there is still a gap in connectingthese two. That is, it is still unknown how music is used to regulate emotionson an individual level.
5 How to improve recommendations?
As music plays a role in emotion regulation of people, and the way howpeople regulate their emotions seem to be dependent on their personality(or their implicit theories of emotion), the music that people use to supporttheir emotion regulation may also be dependent on their personality.
Whereas personality is usually used to alleviate the cold-start problem inrecommender systems (i.e., new users and sparse data sets) [11], or todetermine the amount of diversity in the recommendation [39], includingemotional states can help to improve music recommendations on the fly.
20

Currently, music recommender systems anticipate their subsequent rec-ommendations on the music that the user currently listens to. The rec-ommendation is based on similarity by comparing what others with similartaste have listened before (collaborative filtering), or by matching properties(e.g., genre, artist) of the music pieces (content-based filtering). This canresult in that recommendations given may fit the user’s taste, but may notmatch the user’s actual needs at that moment. For example, the systemsknows that a user likes Beyoncé. Beyoncé has a range of different emotion-ally laden songs from up-tempo to ballads. By knowing the user’s emotionat a specific moment, the recommender system can anticipate and proposea piece of emotion-laden music that lies within the taste of the user that cansupport the regulation of the experienced emotion.
5.1 A Scenario
Anna is a 22 year old student. When she listens to music, she often makesuse of an online radio. This online radio knows Anna’s taste so it can antic-ipate on the next song to play for Anna. Besides knowing Anna’s taste, thesystem knows that Anna is a little bit neurotic.
On one day Anna is at home, listening to an up-tempo song of Beyoncé.The next song that the radio put in the cue is another up-tempo song, butthis time by Katy Perry. Suddenly Anna receives some bad news thatmakes her sad. She post her feelings on Twitter. The radio system no-tices this and based on her personality (neuroticsm), it adjust the song inthe cue. Instead of playing an up-tempo song, it replaces it with a sad songof Katy Perry. By knowing how Anna likes to regulate her emotions, thesystem can anticipate the play-list accordingly.
6 Proposal
In the following sections we discuss the initial ideas that we have to improverecommender systems by incorporating the user’s personality and currentemotional state. We start with describing how we plan to investigate the re-lationship between personality and emotion regulation through music. Afterthat we discuss the methods for the personality and emotion acquisitionfrom social media, and finally we discuss how we plan to find the emo-tionally laden songs. For the incorporation of emotion and personality, weassume that system already initiated the user’s music taste.
21

Randomclip
Controlquestion
video clip
Emotionallyladen
music
Emotionallyladen
5 differentmusic pieces
Controlquestion
Likelihoodquestions Questionnaires
Figure 1: User study work flow
6.1 Step 1: User Study
The first step would be to investigate how people prefer to regulate theiremotions and the relationship with their personality. For example, peoplescoring high on neuroticism tend to increase their level of worry [32]. There-fore, they may not want to listen to music that tries to change their worrystate, but want music that is in line with that state instead.
Although there is much research done on the inducing effect of emotionalladen music [4, 27], not much is known about how people use music toregulate their emotions. We plan to conduct a online user study using par-ticipants on Amazon Mechanical Turk. In this user study we will use theset of film clips (see Figure 1 for the experiment work flow), developed byHewig et al. [9] to induce one of the basic emotional states. Presenting filmclips is one of the methods that is frequently used to induce emotions inpsychological experiments. For the user study, we will assign participantsrandomly to a emotionally laden film clip (anger, disgust, fear, happiness,sadness, or neutral). After showing participants the film clip, we will ask asa control the emotion the film clip induced. In the next step we will presentdifferent emotionally laden music fragments (anger, fear, happiness, sad-ness, and tenderness) and ask participants the likelihood that they wouldlisten to such music when being in the just induced emotional state. Themusic fragments we will use are categorized by Eerola and Vuoskoski [4]based on the basic emotions they bear. As a control question we will askin addition what kind of emotion the music pieces induce. To concludewe will ask the FFM questions, implicit theory of emotions questions, anddemographics (i.e., age and gender). This will give us information abouthow music is used in different emotional states and how this is related topersonality traits.
With the results of the aforementioned user study we will create a modelto predict the emotionally laden music pieces that users would like to listento when in a certain emotional state. A second user study will be carriedout to create the dataset for testing the model. The dataset will containdata about their current emotional states of users and the emotional laden
22
songs they want to listen to. A 10-fold cross-validation method will be usedfor validation.
Once the model is created and verified, we will know how people preferto regulate their emotional states with music throughout the day, and howthis is related to their personality. In the next step we will move toward theextraction of personality and emotional states from social media.
6.2 Step 2: Personality & Emotional State Acquisition
We will use Twitter as our main source to extract the personality and emo-tional state parameters from. Tweets are crawled by using the Twitter API.Furthermore, we will limit ourselves to tweets with English as the main lan-guage.
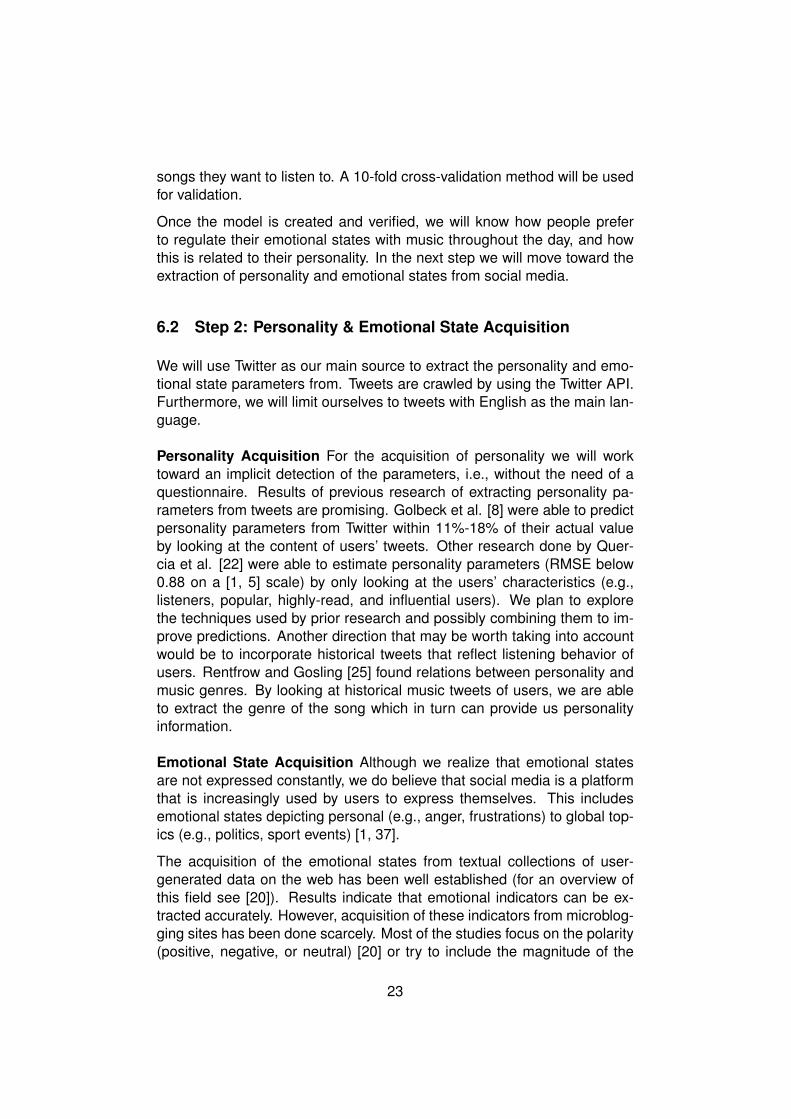
Personality Acquisition For the acquisition of personality we will worktoward an implicit detection of the parameters, i.e., without the need of aquestionnaire. Results of previous research of extracting personality pa-rameters from tweets are promising. Golbeck et al. [8] were able to predictpersonality parameters from Twitter within 11%-18% of their actual valueby looking at the content of users’ tweets. Other research done by Quer-cia et al. [22] were able to estimate personality parameters (RMSE below0.88 on a [1, 5] scale) by only looking at the users’ characteristics (e.g.,listeners, popular, highly-read, and influential users). We plan to explorethe techniques used by prior research and possibly combining them to im-prove predictions. Another direction that may be worth taking into accountwould be to incorporate historical tweets that reflect listening behavior ofusers. Rentfrow and Gosling [25] found relations between personality andmusic genres. By looking at historical music tweets of users, we are ableto extract the genre of the song which in turn can provide us personalityinformation.
Emotional State Acquisition Although we realize that emotional statesare not expressed constantly, we do believe that social media is a platformthat is increasingly used by users to express themselves. This includesemotional states depicting personal (e.g., anger, frustrations) to global top-ics (e.g., politics, sport events) [1, 37].
The acquisition of the emotional states from textual collections of user-generated data on the web has been well established (for an overview ofthis field see [20]). Results indicate that emotional indicators can be ex-tracted accurately. However, acquisition of these indicators from microblog-ging sites has been done scarcely. Most of the studies focus on the polarity(positive, negative, or neutral) [20] or try to include the magnitude of the
23

emotion (mild and strong) [30]. Only a few have tried to categorize mi-croblogging text based on existing emotional categorizations [1, 29].
One approach that we bear in mind that to build upon is the use of emotionlexicons. These lexicons consist of terms related to an emotion. Severallexicons have been created based on different emotion categorizations andhave been tested on tweets. Such as, Sintsova, Musat, and Pu [29] cre-ated a lexicon compatible with the Geneva Emotion Wheel categorizationof emotions, Roberts et al. [26] based their emotion lexicon on Ekman’scategorization, and Suttles, and Ide [31] on Plutchik’s. Especially the workof Roberts et al. [26] would be suitable to build upon as the Ekman’s cate-gorization is on the basis of our work. We will be able to complement thepredictability of emotions by including metadata that have shown to consistof emotional indicators, for example, hashtags [18, 19], traditional emoti-cons [6], and emoji [26].
6.3 Step 3: Emotion Classification of Songs
The user study (see §6.1) will give us insights in how emotionally ladensongs are used in the emotion regulation process. For the system to beable to anticipate its recommendation, we need to find the right emotionalannotated song.
The field of emotion classification in music is still evolving (see for an overview[15]). Currently, different methods are used to annotate music pieces ontheir emotion: direct human annotation (e.g., surveys, social tags, games),indirect human annotation (e.g., web documents, social tag clouds, lyrics),or content-based analysis (e.g., audio, images, video). As Kim et al. [15]noted "Recognizing musical mood remains a challenging problem primarilydue to the inherent ambiguities of human emotions." To find the right emo-tionally laden song within a collection in this project, we will initially turnto the tags provided by Last.FM website. Last.FM currently provide songswith the tags happy, sad, angry, and relaxed. Based on these tags we canmake a first attempt to match emotionally laden songs with the user’s wayof regulating their emotional state.
7 Conclusion
By including the user’s current emotional state, we propose that music rec-ommendations can be improved. Our next efforts will be to investigate howpeople regulate their emotions with music. That is, what kind of emotionallyladen music people are listening when being in a specific emotional state.
24

Additionally, we will investigate how emotion regulation with music is relatedto their personality.
For the acquisition of personality and emotion, we will focus on microblog-ging sites. As social media generates a constant stream of communication,we believe that microblogging sites as Twitter are suitable to extract person-ality and emotional states of users. Although accurate results are achievedfrom textual collections of user-generated data on the web, analyzing mi-croblogging sites remains challenging. The amount of text is scarce as thetext posted on Twitter is limited to 140 characters. However, the ability toexpress oneself in a short and fast way lend itself to post content more of-ten. To extract personality and emotional states from Twitter feeds we willinitially trust on different existing methods and combine them to improvepredictability of the parameters.
With the findings of the aforementioned steps, we can start matching musicthat fits the user’s way of emotion regulation. To find suitable music, we willinitially rely on the emotional tags that Last.FM provides.
8 Acknowledgment
This research is supported by the European FP7/2007-2013 program throughthe PHENICX project under grant agreement no. 601166 and by the Aus-trian Science Fund (FWF): P25655.
References
[1] Bollen, J., Mao, H., Pepe, A.: Modeling public mood and emotion:Twitter sentiment and socio-economic phenomena. In: ICWSM (2011)
[2] Burger, J.: Personality. PSY 235 Theories of Personality Series, Cen-gage Learning (2010)
[3] DeNora, T.: Music as a technology of the self. Poetics 27(1), 31–56(1999)
[4] Eerola, T., Vuoskoski, J.K.: A comparison of the discrete and dimen-sional models of emotion in music. Psychology of Music 39(1), 18–49(2011)
[5] Ekman, P.: An argument for basic emotions. Cog. & Emotion 6, 169–200 (1992)
25

[6] Go, A., Bhayani, R., Huang, L.: Twitter sentiment classification usingdistant supervision. CS224N Project Report, Stanford pp. 1–12 (2009)
[7] van Goethem, A., Sloboda, J.: The functions of music for affect regu-lation. Musicae scientiae 15(2), 208–228 (2011)
[8] Golbeck, J., Robles, C., Edmondson, M., Turner, K.: Predicting per-sonality from twitter. In: Privacy, security, risk and trust (passat), 2011ieee third international conference on and 2011 ieee third interna-tional conference on social computing (socialcom). pp. 149–156. IEEE(2011)
[9] Hewig, J., Hagemann, D., Seifert, J., Gollwitzer, M., Naumann, E.,Bartussek, D.: Brief report: A revised film set for the induction of basicemotions. Cognition & Emotion 19(7), 1095–1109 (2005)
[10] Hu, R., Pu, P.: Using personality information in collaborative filtering fornew users. Recommender Systems and the Social Web p. 17 (2010)
[11] Hu, R., Pu, P.: Enhancing collaborative filtering systems with person-ality information. In: Proceedings of the fifth ACM conference on Rec-ommender systems. pp. 197–204. ACM (2011)
[12] John, O.P., Srivastava, S.: The big five trait taxonomy: History,measurement, and theoretical perspectives. Handbook of personality:Theory and research 2, 102–138 (1999)
[13] Jung, C.: Psychological Types. No. v. 6 in Bollingen Series No. 20,Princeton University Press (1976)
[14] Kemp, A.E.: The musical temperament: Psychology and personalityof musicians. Oxford University Press (1996)
[15] Kim, Y.E., Schmidt, E.M., Migneco, R., Morton, B.G., Richardson, P.,Scott, J., Speck, J.A., Turnbull, D.: Music emotion recognition: A stateof the art review. In: Proc. ISMIR. pp. 255–266. Citeseer (2010)
[16] Kosinski, M., Stillwell, D., Graepel, T.: Private traits and attributes arepredictable from digital records of human behavior. Proceedings of theNational Academy of Sciences 110(15), 5802–5805 (2013)
[17] McCrae, R.R., John, O.P.: An introduction to the five-factor model andits applications. Journal of personality 60(2), 175–215 (1992)
[18] Mohammad, S.M.: # emotional tweets. In: Proceedings of the FirstJoint Conference on Lexical and Computational Semantics-Volume 1:Proceedings of the main conference and the shared task, and Volume2: Proceedings of the Sixth International Workshop on Semantic Eval-uation. pp. 246–255. Association for Computational Linguistics (2012)
26

[19] Mohammad, S.M., Kiritchenko, S.: Using hashtags to capture fineemotion categories from tweets. Computational Intelligence (2014)
[20] Pang, B., Lee, L.: Opinion mining and sentiment analysis. Foundationsand trends in information retrieval 2(1-2), 1–135 (2008)
[21] Parkinson, B., Totterdell, P.: Classifying affect-regulation strategies.Cognition & Emotion 13(3), 277–303 (1999)
[22] Quercia, D., Kosinski, M., Stillwell, D., Crowcroft, J.: Our twitter pro-files, our selves: Predicting personality with twitter. In: Privacy, secu-rity, risk and trust (passat), 2011 ieee third international conferenceon and 2011 ieee third international conference on social computing(socialcom). pp. 180–185. IEEE (2011)
[23] Rawlings, D., Ciancarelli, V.: Music preference and the five-factormodel of the neo personality inventory. Psychology of Music 25(2),120–132 (1997)
[24] Rentfrow, P.J., Goldberg, L.R., Zilca, R.: Listening, watching, andreading: The structure and correlates of entertainment preferences.Journal of personality 79(2), 223–258 (2011)
[25] Rentfrow, P.J., Gosling, S.D.: The do re mi’s of everyday life: the struc-ture and personality correlates of music preferences. Journal of per-sonality and social psychology 84(6), 1236 (2003)
[26] Roberts, K., Roach, M.A., Johnson, J., Guthrie, J., Harabagiu, S.M.:Empatweet: Annotating and detecting emotions on twitter. In: LREC.pp. 3806–3813 (2012)
[27] Scherer, K.R.: Which emotions can be induced by music? what arethe underlying mechanisms? and how can we measure them? Journalof new music research 33(3), 239–251 (2004)
[28] Scherer, K.R.: What are emotions? and how can they be measured?Social science information 44(4), 695–729 (2005)
[29] Sintsovaa, V., Musata, C.: Fine-grained emotion recognition in olympictweets based on human computation. WASSA 2013 12 (2013)
[30] Strapparava, C., Mihalcea, R.: Learning to identify emotions in text. In:Proceedings of the 2008 ACM symposium on Applied computing. pp.1556–1560. ACM (2008)
[31] Suttles, J., Ide, N.: Distant supervision for emotion classification withdiscrete binary values. In: Computational Linguistics and IntelligentText Processing, pp. 121–136. Springer (2013)
27

[32] Tamir, M.: Don’t worry, be happy? neuroticism, trait-consistent affectregulation, and performance. Journal of personality and social psy-chology 89(3), 449 (2005)
[33] Tamir, M.: Differential preferences for happiness: Extraversion andtrait-consistent emotion regulation. Journal of Personality 77(2), 447–470 (2009)
[34] Tamir, M., John, O.P., Srivastava, S., Gross, J.J.: Implicit theories ofemotion: affective and social outcomes across a major life transition.Journal of Personality and Social Psychology 92(4), 731 (2007)
[35] Thayer, R.E.: The biopsychology of mood and arousal. Oxford Univer-sity Press (1989)
[36] Thayer, R.E., Newman, J.R., McClain, T.M.: Self-regulation of mood:strategies for changing a bad mood, raising energy, and reducing ten-sion. Journal of personality and social psychology 67(5), 910 (1994)
[37] Thelwall, M., Buckley, K., Paltoglou, G.: Sentiment in twitter events.Journal of the American Society for Information Science and Technol-ogy 62(2), 406–418 (2011)
[38] Thoma, M.V., Ryf, S., Mohiyeddini, C., Ehlert, U., Nater, U.M.: Emotionregulation through listening to music in everyday situations. Cognition& emotion 26(3), 550–560 (2012)
[39] Wu, W., Chen, L., He, L.: Using personality to adjust diversity in rec-ommender systems. In: Proceedings of the 24th ACM Conference onHypertext and Social Media. pp. 225–229. ACM (2013)
[40] Zentner, M., Grandjean, D., Scherer, K.R.: Emotions evoked by thesound of music: characterization, classification, and measurement.Emotion 8(4), 494 (2008)
28

The Soundtrack of My Life: Adjusting theEmotion of Music
Published in: ACM Conference on Human Factors in Computing Systems (CHI 2015):Collaborating with Intelligent Machines, extended proceedings (Seoul, KR)
BRUCE FERWERDA, Johannes Kepler University, Linz (AT)
Abstract
In this position paper for the CHI2015 workshop “Collaborating withIntelligent Machines," we propose an application to easily adjust theemotion of a musical melody by using predefined settings. For theadjustment of the melody we rely on music production rules and musi-cal structural characteristics related to predefined emotions that havebeen defined by prior work.
Keywords: Music Recommender Systems, Emotional States, Emo-tion Regulation
1 Proposal
Music plays an import role in our lives. Out of 162 emotion regulation strate-gies, listening to music has been listed as the second strategy that peoplemost often use [6, 9]. This is not surprising, as music has shown to be ableto induce bona fide emotions [7, 12].
Professional composers have shown to be able to express effectively theintended emotion of their music piece to their audience [10]. Although,we intuitively would say that the emotion of a music piece is conveyed bythe lyrics, studies indicate that the piece’s emotion mainly lies within itsmelody. Even when lyrics and melody conflict in their expressed emotion,the melody has been proven dominant in emotion determination [1]. Thisprovides opportunities to adjust the music piece’s emotion to any givensituation regardless of the lyrics.
In this position paper, we propose an application that can adjust the emotionof a music piece in a simple manner. To adjust the emotion of a song, werely on production rules. It has been argued that the experienced emotionof a music piece is determined by a multiplication of features: structural fea-tures, performance features, listener features, and contextual features [8].A short description of each feature is found below.
29

• Structural features:
– Acoustic as well as the foundational structures of a piece thatmakes up the music.
• Performance features:
– The manner in which a piece is executed by the performer. Thisincludes physical appearance, reputation of the performer.
• Listener features:
– Social and individual identity of the listener (e.g., personality, mu-sical knowledge).
• Contextual features:
– Location and occasion where the music piece is played.
The magnitude of the felt emotion increases as more features are positivelyrelated. The effect of each feature is compounded by one another. Asperformance features are not adjustable in the context of the applicationas we propose, we further focus only on the other features in this positionpaper.
Previous work investigated the range of different musical structural charac-teristics to communicate emotions. For example, happy music has beenidentified with a mean of 4.984 notes per second, while sad music has1.333 [2]. With this information we propose predefined buttons in the ap-plication that can adjust music structural features according to the desiredemotion (see Figure 1 for a mock-up UI).
Similarly, buttons could be created for contextual features in the same wayas proposed for structural features. Often the desired emotion in a certaincontext is already known (e.g., sad music at a funeral). Instead of buttonswith emotion labels, buttons with predefined context could be created thatin turn adjust the musical characteristic of the music piece to fit the con-text.
In addition, a more personalized approach is possible by depicting the lis-tener features. A possible focus of listener features is personality. Somestudies have shown that there are individual differences in how people per-ceive (e.g., [11]) and prefer music (e.g., [4]). For example, high agreeableor neurotic people tend to have stronger sad feelings [11]. Based on one’spersonality, a musical emotional adjustment can be strengthened or weak-ened. For example, sad music has been identified with a mean of 1.333notes per second, with a lower bound of 1.112 and an upper bound of1.554. Based on one’s personality it can be decided to adjust the musicpiece more towards the upper -or lower bound of the emotion.
30

Figure 1: Mock-up of a music player interface that adjust the music accord-ing to the chosen emotion.
With this position paper we join the emergence of music applications thatinclude personality and/or affect information (e.g., [3, 5]). Our proposedapplication supports easy music creation for every situation by adjusting theconveyed emotion of the piece. It can also be useful for off-site collaborationin the creation of music by being able to easily try out different emotionalsettings.
Acknowledgements
This research is supported by the EU FP7/’13-’16 through the GiantStepsproject under grant agreement no. 610591.
31

References
[1] Ali, S.O., Peynircioglu, Z.F.: Songs and emotions: are lyrics andmelodies equal partners? Psychology of Music 34(4), 511–534 (2006)
[2] Bresin, R., Friberg, A.: Emotion rendering in music: range and char-acteristic values of seven musical variables. Cortex 47(9), 1068–1081(2011)
[3] Ferwerda, B., Schedl, M.: Enhancing music recommender systemswith personality information and emotional states: A proposal. In: 2ndEMPIRE Workshop. pp. 1613–0073 (2014)
[4] Ferwerda, B., Schedl, M., Tkalcic, M.: Personality & emotional states:Understanding users’ music listening needs. UMAP 2015 ExtendedProceedings
[5] Ferwerda, B., Yang, E., Schedl, M., Tkalcic, M.: Personality traits pre-dict music taxonomy preferences. In: CHI’15 Extended Abstracts onHuman Factors in Computing Systems. ACM (2015)
[6] Parkinson, B., Totterdell, P.: Classifying affect-regulation strategies.Cognition & Emotion 13(3), 277–303 (1999)
[7] Scherer, K.R.: Which emotions can be induced by music? what arethe underlying mechanisms? and how can we measure them? Journalof new music research 33(3), 239–251 (2004)
[8] Scherer, K.R., Zentner, M.R.: Emotional effects of music: Productionrules. Music and emotion: Theory and research pp. 361–392 (2001)
[9] Thayer, R.E., Newman, J.R., McClain, T.M.: Self-regulation of mood:strategies for changing a bad mood, raising energy, and reducing ten-sion. Journal of personality and social psychology (1994)
[10] Thompson, W.F., Robitaille, B.: Can composers express emotionsthrough music? Empirical Studies of the Arts 10(1), 79–89 (1992)
[11] Vuoskoski, J.K., Eerola, T.: Measuring music-induced emotion a com-parison of emotion models, personality biases, and intensity of experi-ences. Musicae Scientiae 15(2) (2011)
[12] Zentner, M., Grandjean, D., Scherer, K.R.: Emotions evoked by thesound of music: characterization, classification, and measurement.Emotion 8(4), 494 (2008)
32

Personality-Based User Modeling for MusicRecommender Systems
Published in: Proceedings of the European Conference on Machine Learning andPrinciples and Practice of Knowledge Discovery in Databases (ECMLPKDD 2016; Riva delGarda, IT)
BRUCE FERWERDA, Johannes Kepler University, Linz (AT)MARKUS SCHEDL, Johannes Kepler University, Linz (AT)
Abstract
Applications are getting increasingly interconnected. Although the in-terconnectedness provide new ways to gather information about theuser, not all user information is ready to be directly implemented inorder to provide a personalized experience to the user. Therefore, ageneral model is needed to which users’ behavior, preferences, andneeds can be connected to. In this paper we present our works on apersonality-based music recommender system in which we use users’personality traits as a general model. We identified relationships be-tween users’ personality and their behavior, preferences, and needs,and also investigated different ways to infer users’ personality traitsfrom user-generated data of social networking sites (i.e., Facebook,Twitter, and Instagram). Our work contributes to new ways to mineand infer personality-based user models, and show how these mod-els can be implemented in a music recommender system to positivelycontribute to the user experience.
Keywords: Personalization, Music Recommender Systems
1 Introduction
An abundance of information about users is getting available with the in-creased interconnectedness of applications, which provide new ways totackle problems that systems, such as recommender systems are facing(e.g., lacking behavioral data to infer preferences, such as with the “cold-start problem"). 1 For example, the implementation of single sign-on (SSO)
1The cold-start problem is most prevalent in recommender systems and occurs with newusers of the application. It refers to that (almost) no information exists yet about the user tomake inferences from.
33

mechanisms 2 allow users to easily login and register to the application, butalso let applications import user information from the connected application,which could be used for personalization.
Although with the interconnectedness of applications new information sourcesbecome available, not all the new information is directly applicable to createpersonalized experiences with. Therefore, a general user model is neededto which users’ behavior, preferences, and needs can be connected to inorder to create personalized experiences for users. This allows the cre-ation of only one user model that can be used across applications withoutthe need of information that is directly related to a specific behavior, prefer-ence, or need of the user [1].
We model users based on their personality to make inferences about theirbehavior, preferences, and needs. Personality has shown to be a stableand enduring factor, which influences an individual’s behavior, interest, andtaste. As personality plays such a prominent role in shaping human prefer-ences, one can expect similar patterns (i.e., behavior, interest, and taste) toemerge for people with similar personality traits, which makes it suitable foruser modeling. In our works, we rely on the widely used five-factor model(FFM), which categorizes personality into five traits: openness to experi-ence (O), conscientiousness (C), extraversion (E), agreeableness (A), andneuroticism (N) [10].
In the next sections we provide an overview of our works on user mod-eling, which comes in twofold: 1) understanding the relationship betweenpersonality traits of users and their behavior, preferences, and needs, and2): implicit acquisition of users’ personality traits from social media.
2 Understanding the User
In order to create personality-based recommender systems, the relation-ship with their behavior, preferences, and needs need to be identified first.We conducted several user studies on different aspects of the user experi-ence in music recommender systems in order to identify relationships withusers’ personality.
Listening needs. In [4] we aimed to understand the music listening needsof users in order to provide better personalized recommendations. We in-vestigated the relationship between personality traits and the preferencefor different kinds of music, and how these preferences change depend-ing on users’ emotional state. Our findings show that, in general, users
2Buttons that allow users to register or login with accounts of other applications. Forexample, social networking services: “Login with your Facebook account."
34

like to listen to music in line with their emotional state. However, individ-ual differences based on personality occur; especially in a negative emo-tional state (e.g., sadness). We found that when in a negative emotionalstate, those who scored high on openness to experience, extraversion,and agreeableness tend to cheer themselves up with happy music, whilethose who scored high on neuroticism tend to prefer to dwell a bit longerin this negative state by listening to sad music. This has important implica-tions for playlist generation. By inferring users’ emotional state (e.g., mininguser-generated content), the next song can be better targeted toward theirneeds.
Meta information. In [14] we investigated the amount of meta informationa user would want about the music pieces that is listened to. The resultsshowed that the following personality traits tend to have a higher prefer-ence for more meta information: openness to experience, agreeableness,conscientiousness, and extraversion. This provides implications about theamount of meta information a system should present to the user withoutthem experiencing information overload, which in turn, negatively affectsthe user experience of the user.
User interface. In [8] we simulated an online music streaming serviceto identify the relationship between personality traits and the way usersbrowse for music. By exploring the most frequently used taxonomies tocategorize music (i.e., by genre, activity, mood), we were able to identifydistinct music browsing behavior based on users’ personality, which couldbe used to create adaptive user interfaces. For example, findings indicatethat those scoring high on openness to experience show a high preferencefor browsing for music by mood, while conscientious users show a prefer-ence for browsing by activity.
3 Acquisition of Users’ Personality Traits
Besides identifying relationships between personality traits and users’ be-havior, preferences, and needs, we also looked into the implicit personalityacquisition of users. We specifically focused on personality acquisition fromsocial networking sites (SNSs: e.g., Facebook, Twitter, Instagram), as theyare getting increasingly interconnected through SSO buttons. Besides ac-cessing users’ basic profile information, applications often ask for additionalpermissions to access other parts of the users profile [2]. By granting ac-cess, applications are able to unobtrusively infer users’ personality traits.We report the RMSE on personality trait prediction (i.e., O, C, E, A, N) foreach of our work below (r ε [1,5]).
35

Several works exist that show that it is possible to infer personality traitsfrom user-generated data of SNSs (e.g., Facebook [11], and Twitter [9, 12]).In [5, 7] we add to the work on SNS analyses by inferring personality traitsfrom users’ Instagram picture features. We showed that personality traitsare related to the way Instagram users modify their pictures with filters,and a reliable personality predictor can be created based on that (RMSE:O=.68, C=.66, E=.90, A=.69, N=.95). For example, open users tend toapply filters to their pictures in order to make them look more greenish.In [13] we tried to increase the prediction accuracy by fusing informationfrom different SNSs (i.e., Instagram and Twitter). We show a significantimprovement of the prediction accuracy when combining different sources(RMSE: O=.51, C=.67, E=.71, A=.50, N=.73).
One problem with the implicit acquisition of personality is that when usersare not sharing information, the acquisition fails. We investigated this prob-lem from two different directions: 1) understanding the underlying mech-anisms of sharing information, 2) personality acquisition with limited userinformation.
In [3] we found that the lack of sharing and posting comes from the un-certainty of approval of the users viewing the posts. We were able to in-creasing sharing and posting by analyzing the user’s social network andcreate proxy measures about how the shared or posted content would bereceived.
In [6] we looked at whether or not disclosing Facebook profile informationreveals personality as well. By solely analyzing whether profile sectionswere disclosed or not (e.g., occupation, education), disregarding their ac-tual content, we were able to create a personality predictor that is ableto approximate the prediction accuracy of methods extensively analyzingcontent (RMSE: O=.73, C=.73, E=.99, A=.73, N=.83). This provide op-portunities to still being able to infer users’ personality even when they arenot disclosing information.
4 Conclusion
This paper gave an overview of our work on creating personalized experi-ences in music recommender systems. We revealed relationships betweenpersonality traits and different user behavior, needs, and preferences toimprove the user experience, and showed how personality can be minedand inferred using the increased connectedness between applications andSNSs.
36

5 Acknowledgment
This research is supported by the Austrian Science Fund (FWF): P25655.
References
[1] Cantador, I., Fernández-tobías, I., Bellogín, A.: Relating PersonalityTypes with User Preferences in Multiple Entertainment Domains. EM-PIRE (2013)
[2] Chia, P.H., Yamamoto, Y., Asokan, N.: Is this app safe?: a large scalestudy on application permissions and risk signals. In: WWW. ACM(2012)
[3] Ferwerda, B., Schedl, M., Tkalcic, M.: To post or not to post: Theeffects of persuasive cues and group targeting mechanisms on postingbehavior. In: SocialCom (2014)
[4] Ferwerda, B., Schedl, M., Tkalcic, M.: Personality & emotional states:Understanding usersâAZ music listening needs. In: UMAP (2015)
[5] Ferwerda, B., Schedl, M., Tkalcic, M.: Predicting personality traits withinstagram pictures. In: EMPIRE (2015)
[6] Ferwerda, B., Schedl, M., Tkalcic, M.: Personality traits and the rela-tionship with (non-) disclosure behavior on facebook. In: WWW (2016)
[7] Ferwerda, B., Schedl, M., Tkalcic, M.: Using instagram picture fea-tures to predict users’ personality. In: MMM (2016)
[8] Ferwerda, B., Yang, E., Schedl, M., Tkalcic, M.: Personality traits pre-dict music taxonomy preferences. In: CHI Extended Abstracts (2015)
[9] Golbeck, J., Robles, C., Edmondson, M., Turner, K.: Predicting per-sonality from twitter. In: SocialCom (2011)
[10] McCrae, R.R., John, O.P.: An introduction to the five-factor model andits applications. Journal of Personality (1992)
[11] Park, G., Schwartz, H.A., Eichstaedt, J.C., Kern, M.L., Kosinski, M.,Stillwell, D.J., Ungar, L.H., Seligman, M.E.: Automatic personality as-sessment through social media language. Journal of personality andsocial psychology 108(6), 934 (2015)
37

[12] Quercia, D., Kosinski, M., Stillwell, D., Crowcroft, J.: Our twitter pro-files, our selves: Predicting personality with twitter. In: SocialCom(2011)
[13] Skowron, M., Tkalcic, M., Ferwerda, B., Schedl, M.: Fusing social me-dia cues: personality prediction from twitter and instagram. In: WWW(2016)
[14] Tkalcic, M., Ferwerda, B., Hauger, D., Schedl, M.: Personality corre-lates for digital concert program notes. In: UMAP (2015)
38

5 Understanding Users and Their Music ListeningBehavior, Preferences, and Needs
Ferwerda, B., Yang, E., Schedl, M., & Tkalcic, M. (2015) Person-ality Traits Predict Music Taxonomy Preferences. In ExtendedAbstracts Proceedings of the 33rd Annual ACM Conference onHuman Factors in Computing Systems (Seoul, KR).
Ferwerda, B., Yang, E., Schedl, M., & Tkalcic, M. (2016) Personal-ity and Taxonomy Preferences, and the Influence of CategoryChoice Set Size on the User Experience for Music StreamingServices. Under Review.
Ferwerda, B., Schedl, M., & Tkalcic, M. (2015). Personality & Emo-tional States: Understanding Users’ Music Listening Needs. InProceedings of the 23rd Conference on User Modeling, Adap-tation and Personalization (Dublin, IR).
Tkalcic, M., Ferwerda, B., Hauger, D., & Schedl, M. (2015) Person-ality Correlates for Digital Concert Program Notes. In Proceed-ings of the 23rd Conference on User Modeling, Adaptation andPersonalization (Dublin, IR).
Ferwerda, B., Tkalcic, M., & Schedl, M. (2016). Exploring MusicDiversity Needs Across Countries. In Proceedings of the 24thConference on User Modeling, Adaptation and Personalization(Halifax, NS, CA).
Ferwerda, B., & Schedl, M. (2016) Investigating the RelationshipBetween Diversity in Music Consumption Behavior and Cul-tural Dimensions: A Cross-country Analysis. In Extended Pro-ceedings of the 24th Conference on User Modeling, Adaptationand Personalization: 1st Workshop on Surprise, Opposition,and Obstruction in Adaptive and Personalized Systems (Hali-fax, NS, CA).
39

Personality & Emotional States:Understanding Users’ Music ListeningNeeds
Published in: Proceedings of the 23rd Conference on User Modeling, Adaptation, andPersonalization (UMAP 2015; Dublin, IE)
BRUCE FERWERDA, Johannes Kepler University, Linz (AT)MARKUS SCHEDL, Johannes Kepler University, Linz (AT)MARKO TKALCIC, Johannes Kepler University, Linz (AT)
Abstract
This position paper describes the initial research assumptions to im-prove music recommendations by including personality and emotionalstates. By including these psychological factors, we believe that theaccuracy of the recommendation can be enhanced. We will give atten-tion to how people use music to regulate their emotional states, andhow this regulation is related to their personality. Furthermore, we willfocus on how to acquire data from social media (i.e., microbloggingsites such as Twitter) to predict the current emotional state of users.Finally, we will discuss how we plan to connect the correct emotionallyladen music pieces to support the emotion regulation style of users.
Keywords: Music Recommender Systems, Personality, EmotionalStates, Emotion Regulation
1 Introduction
We experience emotions in every facet of our life (e.g., during decisionmaking, thinking, creativity), and our behavior is influenced by the emo-tional state we are in [16]. To regulate our emotional states, we rely on162 different methods where listening to music is the second most usedmethod [9].
Within an emotion regulation method, we can adopt different strategies,such as, changing, enhancing, or maintaining our emotional states. Previ-ous research has found that the preferred strategy is based on individualdifferences (e.g., [11]). For example, some people prefer to be cheered upwhen feeling sad, while others would like to stay in this emotional state a bitlonger. Research has shown that composers are able to effectively express
40
the intended emotion of their song to their audience [13], and that music isable to induce bona fide emotions [16]. The ability of music to express andinduce different kind of emotions makes it well suited to support emotionregulation.
Current music applications that feature the ability for users to listen to musicthat fits their emotional state, assume that they want to listen to music in linewith how they feel. However, since people adopt different emotion regula-tion strategies, they may not always desire music which is similar with theiremotional state. Hence, in order to recommend the most appropriate musicfor users and their current emotional state, understanding music listeningneeds on a general as well as on an individual level is needed.
With this work we seek to expand the understanding of how one’s emo-tional state relates to the preferred (emotionally laden) music. Music isknown to regulate emotions, but it is not known how emotional states relateto different types of emotionally laden music preferences, nor how prefer-ence differences breakdown on an individual level by looking at personalitytraits.
This leads us to the following research questions:
1. How do emotional states relate to emotionally laden music prefer-ences?
2. How do personality traits relate to emotionally laden music prefer-ences?
An online user study was conducted where participants were asked torate different emotionally laden music pieces on the listening likelihoodbased on their current emotional state. Among 359 participants we foundthat the emotional state is related to the use of emotionally laden music.Furthermore, individual differences were identified based on personalitytraits.
We continue with the related work, method, findings, and discussion.
2 Related work
Ample research has investigated the effects of music and the importance ofit in everyday life. For example, Thompson and Robitaille found that com-posers are effective in transferring the intended emotion of the music piecesto their audience [13], indicating that people perform well at interpreting mu-sic emotions. People are not only good at recognizing emotions in music,but music is also able to induce emotions in such a way that it is used as
41
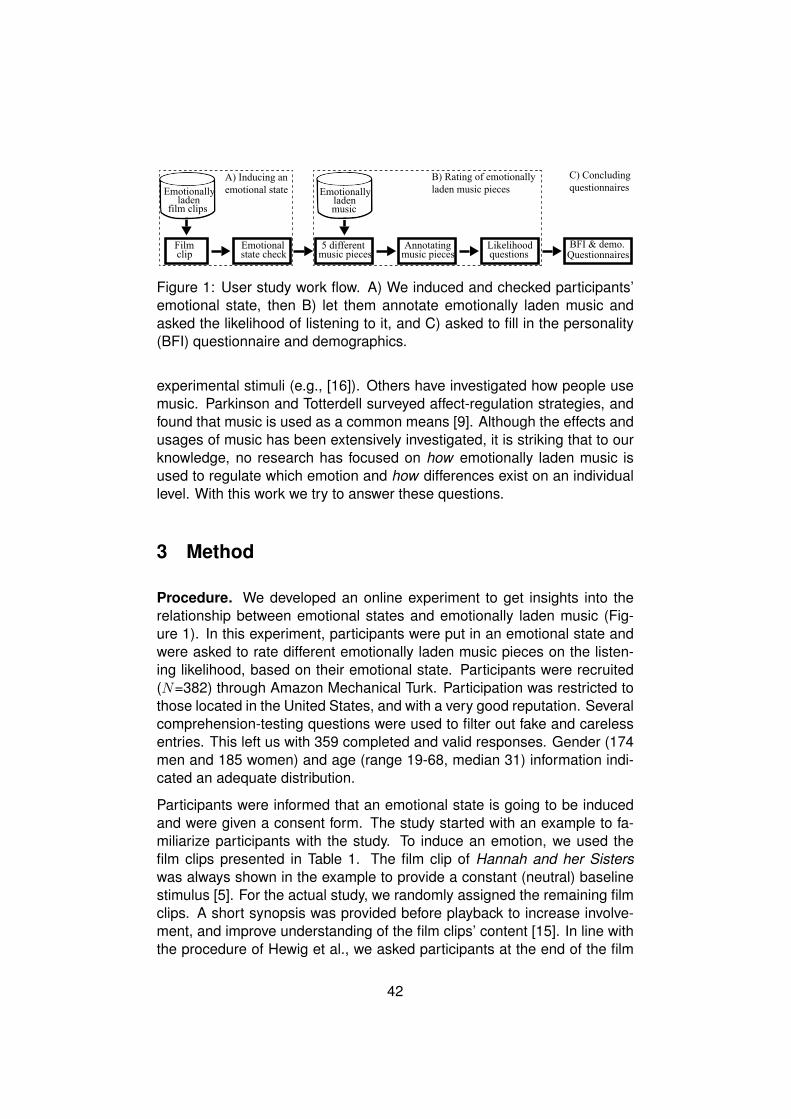
Filmclip
Emotionalstate check
film clips
Emotionallyladen
music
Emotionallyladen
5 differentmusic pieces
Annotatingmusic pieces
Likelihoodquestions Questionnaires
A) Inducing an emotional state
B) Rating of emotionally laden music pieces
C) Concludingquestionnaires
BFI & demo.
Figure 1: User study work flow. A) We induced and checked participants’emotional state, then B) let them annotate emotionally laden music andasked the likelihood of listening to it, and C) asked to fill in the personality(BFI) questionnaire and demographics.
experimental stimuli (e.g., [16]). Others have investigated how people usemusic. Parkinson and Totterdell surveyed affect-regulation strategies, andfound that music is used as a common means [9]. Although the effects andusages of music has been extensively investigated, it is striking that to ourknowledge, no research has focused on how emotionally laden music isused to regulate which emotion and how differences exist on an individuallevel. With this work we try to answer these questions.
3 Method
Procedure. We developed an online experiment to get insights into therelationship between emotional states and emotionally laden music (Fig-ure 1). In this experiment, participants were put in an emotional state andwere asked to rate different emotionally laden music pieces on the listen-ing likelihood, based on their emotional state. Participants were recruited(N=382) through Amazon Mechanical Turk. Participation was restricted tothose located in the United States, and with a very good reputation. Severalcomprehension-testing questions were used to filter out fake and carelessentries. This left us with 359 completed and valid responses. Gender (174men and 185 women) and age (range 19-68, median 31) information indi-cated an adequate distribution.
Participants were informed that an emotional state is going to be inducedand were given a consent form. The study started with an example to fa-miliarize participants with the study. To induce an emotion, we used thefilm clips presented in Table 1. The film clip of Hannah and her Sisterswas always shown in the example to provide a constant (neutral) baselinestimulus [5]. For the actual study, we randomly assigned the remaining filmclips. A short synopsis was provided before playback to increase involve-ment, and improve understanding of the film clips’ content [15]. In line withthe procedure of Hewig et al., we asked participants at the end of the film
42

Table 1: The film clips with theirlength, and emotion.
Film Clip Length (s) EmotionHannah and her Sisters 92 Neutral
Crimes and Misdemeanors 63 NeutralAll the President’s Men 65 Neutral
An Officer and a Gentleman 111 HappyWhen Harry met Sally 149 Happy
Witness 91 AngerMy Bodyguard 236 Anger
Silence of the Lambs 202 FearHalloween 208 Fear
An Officer and a Gentlemen 101 SadThe Champ 171 Sad
Maria’s Lovers 58 DisgustPink Flamingos 29 Disgust
Table 2: The albums with the tracknumber, length, and emotion.
Album (track number) Length (s) EmotionThe Rainmaker (3) 18 Happy
Batman (18) 20 HappyLethal Weapon 3 (8) 14 AngerThe Rainmaker (7) 15 AngerBatman Returns (5) 16 Fear
JFK (8) 14 FearThe English Patient (18) 25 Sad
Running Scared (15) 19 SadShine (10) 20 Tender
Pride & Prejudice (1) 16 Tender
clip to indicate how they were feeling (by selecting an emotion from the setas seen in Table 1), and not what they thought the film clip was supposeto express [7]. In the next step, five emotionally laden music pieces, fromwithin and between the emotion categories (Table 2), were randomly pre-sented. Participants were asked to annotate the emotion they thought themusic piece was trying to express (by selecting an emotion from the setas seen in Table 2), and the likelihood (5-point Likert scale; never-always)of listening to such emotionally laden music, considering their (reported)emotional state. The study ended with the personality questionnaire anddemographics.
Materials. For our stimuli we relied on existing materials that have beentested in prior studies. To induce an emotional state, we used film clips asthey are the most powerful emotion elicitation technique in a controlled en-vironment [10]. Hewig et al. designed film clips to induce an emotional statewithout sound, and categorized them based on Ekman’s emotion catego-rization (anger, fear, happy, surprise, disgust, and sad; Table 1) [7]. Usingmuted stimuli allowed us to control for conflicts with our music pieces in theannotation step of the study. 1
We used the emotionally laden music pieces created by Eerola and Vu-oskoski. They defined music pieces based on the emotional value theybear, based on Ekman’s emotion categorization. Film soundtracks wereused as they are created with the purpose to mediate powerful emotionalcues. Additionally, as they are instrumental, they are relatively neutral interms of musical preferences and (artist) familiarity (Table 2) [1]. 2
We assessed personality traits with the widely used 44-item Big Five Inven-tory (BFI; 5-point Likert scale; disagree strongly - agree strongly [8]), which
1As the surprise emotion only lasts seconds [2], we decided not to include this.2Eerola and Vuoskoski [1] replaced disgust with tender, as disgust is rarely expressed
by music. Music depicting surprise was omitted due to lack of statistical significance.
43

describes personality in terms of openness to experience, conscientious-ness, extraversion, agreeableness, and neuroticism.
4 Findings
The analyses were done based on participants’ reported emotional stateafter the film clip was shown, not on the intended induced emotion by thefilm clip. The distribution of the reported emotional states were as follows:happy (n=55), neutral (n=82), anger (n=62), disgust (n=56), fear (n=79),and sad (n=61).
An initial one-way multivariate analysis of variance (MANOVA) was con-ducted to test the relationship between emotionally laden music piecesand emotional states. A significant MANOVA effect was obtained (Wilks’Lambda = .523, F (25, 1164.24) = 8.89, p <.001) with a moderate effectsize (η2=.13). The homogeneity of variance assumption was tested for allthe emotionally laden music pieces. Levene’s F test showed that the musicpieces depicting the emotional states happy and tender do not meet therequirement of p >.05. None of the largest standard deviations of the twopieces were more than four times the size of the corresponding smallest,suggesting that follow-up ANOVAâAZs are robust.
Post-hoc tests (Tukey HSD) were performed to examine individual mean dif-ference comparisons across the six emotional states and the five emotion-ally laden music pieces. The results reported here were compared againsta neutral emotional state and were all statistically significant (p <.05). Re-sults revealed that in general, participants preferred happy and tender mu-sic when in a neutral emotional state. However, in a angry or disgustedstate, participants preferred angry or fearful music. They also preferredsad music when they were feeling sad. Additionally, participants indicateda dislike of happy and tender music when they felt angry, fearful, or dis-gusted.
Follow-up ANOVAs were conducted to test for individual differences. Re-sults revealed that in a neutral emotional state, participants who scoredhigh on agreeableness tend to listen more to happy (F (1, 19.27) =16.12,p <.001) and tender (F (1, 11.89) =11.40, p <.005) music. When par-ticipants felt happy, the ones who scored high on openness tend to lis-ten more to happy music (F (1, 9.02) =8.85, p <.05). Participants whoscored high on neuroticism and felt disgusted tend to listen more to sadmusic (F (1, 12.73) =8.47, p <.005). Lastly when participants felt sad, andscored high on extraversion (F (1, 16.95) =9.96, p <.005), agreeableness(F (1, 13.29) =7.81, p <.05), or openness (F (1, 16.29) =9.57, p <.005),
44

they tend to listen more to happy music.
5 Discussion
Our data show that the emotional state influences the (emotionally laden)music people listen to. In a neutral emotional state, happy and tender mu-sic is consumed more frequently. Additionally, findings indicate that peoplein general prefer emotionally laden music that is in line with their emotionalstate. Angry and fearful music is preferred when feeling angry or disgusted,whereas preference for happy and tender music decreases for these emo-tional states. Additionally, we found an increase of sad music in a sadstate.
Taking personality traits into account, individual differences emerged. Oneof our findings showed that those who scored high on openness, extraver-sion, and agreeableness are more inclined to listen to happy music whenthey are feeling sad. In other words; they are trying to cheer themselvesup with happy music. On the other hand, we found that those who are neu-rotic try to maintain their negative emotional state by listening to more sadsongs.
In order to provide personalized music recommendations, we identified im-portant individual differences that deviate from the notion that users desireto listen to music which is in line with their emotional state. By using per-sonality to identify individual differences, we join the emergent interest ofpersonality-based personalized systems. Several solutions have alreadybeen proposed to incorporate personality (e.g., [3, 4, 14]). For example,adaptation of the user interface of music recommender systems based onpersonality traits [4]. Also the extraction of emotion from social media isstarting to establish (e.g., Twitter feeds [6]). Given our results there are sev-eral implications to consider. Music systems could anticipate the next songin the queue, or provide a list of recommendations, based on the user’scurrent emotional state. This allows the system to better serve the user’smusic listening needs, and support their emotion regulation strategy.
Although we relied on self-report measures to assess emotions (emotioninduction as well as music annotations) through an online platform, over85% of the responses were in line with the original classifications that havebeen extensively tested priorly [1, 7]. This suggests that the used methodswere effective.
Our results focused on individual differences of music preferences based ongeneral emotional states. However, as Tamir and Ford [12] noted, emotionregulation strategies depend not only on individual differences, but also
45

on the context that people are situated in. They found that people wantto experience unpleasant emotions to attain certain instrumental benefits.That is, people want to feel bad when they expect it to give them benefits.For example, in confronting situations. We will address the influence ofcontext in future work.
6 Acknowledgments
This research is supported by the Austrian Science Fund: P25655, and theEU FP7/2013-2016 through the PHENICX project under grant agreement601166.
References
[1] Eerola, T., Vuoskoski, J.K.: A comparison of the discrete and dimen-sional models of emotion in music. Psychology of Music (2010)
[2] Ekman, P.: An argument for basic emotions. Cognition & Emotion(1992)
[3] Ferwerda, B., Schedl, M.: Enhancing music recommender systemswith personality information and emotional states: A proposal. In: 2ndEMPIRE workshop (2014)
[4] Ferwerda, B., Yang, E., Schedl, M., Tkalcic, M.: Personality traitspredict music taxonomy preferences. In: CHI’15 Extended Abstracts.ACM (2015)
[5] Hagemann, D., Naumann, E., Maier, S., Becker, G., Lürken, A., Bar-tussek, D.: The assessment of affective reactivity using films. Person-ality and Individual Differences 26(4), 627–639 (1999)
[6] Hasan, M., Rundensteiner, E., Agu, E.: Emotex: Detecting emotions intwitter messages. Academy of Science and Engineering (ASE) (2014)
[7] Hewig, J., Hagemann, D., Seifert, J., Gollwitzer, M., Naumann, E.,Bartussek, D.: Brief report: A revised film set for the induction of basicemotions. Cognition & Emotion 19(7), 1095–1109 (2005)
[8] John, O.P., Srivastava, S.: The big five trait taxonomy: History,measurement, and theoretical perspectives. Handbook of personality:Theory and research (1999)
46

[9] Parkinson, B., Totterdell, P.: Classifying affect-regulation strategies.Cognition & Emotion 13(3), 277–303 (1999)
[10] Schaefer, A., Nils, F., Sanchez, X., Philippot, P.: Assessing the effec-tiveness of a large database of emotion-eliciting films: A new tool foremotion researchers. Cognition and Emotion 24(7), 1153–1172 (2010)
[11] Tamir, M.: Don’t worry, be happy? neuroticism, trait-consistent affectregulation, and performance. Journal of personality and social psy-chology 89(3), 449 (2005)
[12] Tamir, M., Ford, B.Q.: When feeling bad is expected to be good: emo-tion regulation and outcome expectancies in social conflicts. Emotion12, 807 (2012)
[13] Thompson, W.F., Robitaille, B.: Can composers express emotionsthrough music? Empirical Studies of the Arts 10(1), 79–89 (1992)
[14] Tkalcic, M., Ferwerda, B., Hauger, D., Schedl, M.: Personality corre-lates for digital concert program notes. UMAP 2015, Springer LNCS9146 (2015)
[15] Tomarken, A.J., Davidson, R.J., Henriques, J.B.: Resting frontal brainasymmetry predicts affective responses to films. J. of personality andsocial psychology (1990)
[16] Zentner, M., Grandjean, D., Scherer, K.R.: Emotions evoked by thesound of music: characterization, classification, and measurement.Emotion 8(4), 494 (2008)
47

Personality Traits Predict Music TaxonomyPreferences
Published in: Extended Abstract Proceedings of the ACM Conference on Human Factorsin Computing Systems (CHI 2015; Seoul, KR)
BRUCE FERWERDA, Johannes Kepler University, Linz (AT)EMILY YANG, Johannes Kepler University, Linz (AT)MARKUS SCHEDL, Johannes Kepler University, Linz (AT)MARKO TKALCIC, Johannes Kepler University, Linz (AT)
Abstract
Music streaming services increasingly incorporate additional musictaxonomies (i.e., mood, activity, and genre) to provide users differentways to browse through music collections. However, these additionaltaxonomies can distract the user from reaching their music goal, andinfluence choice satisfaction. We conducted an online user study withan application called “Tune-A-Find," where we measured participants’music taxonomy choice (mood, activity, and genre). Among 297 par-ticipants, we found that the chosen taxonomy is related to personalitytraits. We found that openness to experience increased the choicefor browsing music by mood, while conscientiousness increased thechoice for browsing music by activity. In addition, those high in neu-roticism were most likely to browse for music by activity or genre. Ourfindings can support music streaming services to further personalizeuser interfaces. By knowing the user’s personality, the user interfacecan adapt to the user’s preferred way of music browsing.
Keywords: Personality, Music, Recommender Systems, Taxonomy
1 Introduction
With large amounts of music available online, music information retrieval(MIR) plays an important role in navigating through music. Much researchhas been done on classifying music (assigning textual labels to character-ize music) in order for systems to manage music collections and help usersfind music that they want to listen to (for an overview see [6]). Music stream-ing services use music classification to organize music in predefined tax-onomies for their users to browse through. While “genre" is the most widelyused taxonomy, other ways of organizing music have emerged. Popular
48

music streaming services, such as: 8tracks, AccuRadio, Songza, Spotify, 1
incorporate additional taxonomies such as mood or activity to better servedifferent music browsing needs of its users. These additional taxonomiesare in line with findings of how people use music in their lives [12].
While ample research has focused on choice satisfaction with an item,chosen from a set of similar items (e.g., [1]), others have shown that thecreation of choice satisfaction already starts at the taxonomy level [10].Research has demonstrated that additional taxonomies can distract, evenwhen they are not considered relevant for the search of an item [15]. Dis-traction can raise the search effort because of competing attention [11],and complicate the search for an item [2]. Choosing and making trade-offsbetween taxonomies becomes challenging when they possess unique orcomplementary features that are not directly comparable [7]. In the end, itcan decrease consumers’ preference strength for, and satisfaction with theeventually picked item [10].
The genre, mood, and activity taxonomy used by music streaming servicesinclude features that are not directly comparable; they all provide differ-ent perspectives to browse for music. Displaying them simultaneously cancomplicate music browsing, and eventually diminish users’ satisfaction withthe chosen music and/or the system. Therefore, it is important to under-stand taxonomy preferences on an individual level. If the system can adaptthe interface according to individual preferences by anticipating on tax-onomies that may distract, it can contribute to increased user satisfaction.E.g., by emphasizing the user’s preferred taxonomy and pushing others tothe back, or not showing them at all.
Prior psychology studies have shown that personality is an enduring factorthat influences user’s behavior, interest, and taste (e.g., [16]; more detailsin the box below). This started an emerging interest in building personality-based recommender systems (e.g., [18]; more details in the box below).With this work, we contribute to this emerging field by showing that users’music browsing strategy is related to personality traits. For this we usethe music browsing taxonomies (mood, activity, and genre) frequently usedby music streaming services. Our results can be used to further improvepersonality-based systems. By knowing the relationship between person-ality and music taxonomies, we could exploit personality information inorder to personalize the user interface and counteract on distracting tax-onomies.
1http://www.8tracks.com, http://www.accuradio.com, http://www.songza.com,http://www.spotify.com
49

Personality & user preferencesDifferent studies have shown relationships between personality anduser preferences. In the music domain Rentfrow and Gosling haveinvestigated the relationship between personality traits and genrepreferences. E.g., one of their findings show that extraversion isrelated to preferences for country, pop, religious, and soundtrackmusic [16]. In this study we take a broader perspective, and focus onthe frequently used taxonomies by music streaming services to ordertheir music collections. We show with our results that the relationshipbetween personality and music is not limited to music preferences, butcan be extended to music browsing strategies.
Personality-based recommender systemsInformation about the relationship between personality traits and userpreferences have been given interest to improve recommendersystems. Tkalcic et al. for example, proposed a method to overcomethe cold-start problem by including personality information to enhancethe neighborhood measure [18]. Moreover, Hu and Pu found thatpersonality-based recommender systems are more effective inincreasing users’ loyalty towards the system and decreasing cognitiveeffort compared to systems without personality information [9].
This leads us to the following research question:
RQ: How do personality traits predict taxonomy (mood, activity, genre) pref-erences in music streaming services?
We conducted an online user study where we asked participants to interactwith a music application. Among 297 participants we found that personalitytraits are a predictor of taxonomy preferences. We found in line with our hy-potheses, that those scoring high on openness to experience chose mood,those scoring high on conscientiousness or neuroticism chose activity, andthose scoring high on neuroticism chose genre.
2 How taxonomy preferences can be predicted
Our thesis is that taxonomy preferences can be inferred from personal-ity traits. Personality is considered an enduring factor that influences be-havior, interest, and taste. Therefore, knowing one’s personality can helpto infer their preferences (e.g., music genre preferences [16]). Differentmodels have been created to categorize personality, where the five-factormodel (FFM) is one of the most well known and widely used. The FFM
50

consists of five general dimensions that describe personality: openness toexperience, conscientiousness, extraversion, agreeableness, and neuroti-cism [13].
In this study, we hypothesize that these dimensions, except for agreeable-ness, can help us predict users’ music taxonomy preference. The agree-ableness dimension is related to helpfulness, trusting, and sympathetic [3].These are factors that we believe are not relevant for predicting taxonomypreferences in this study, and therefore agreeableness will not be furtherdiscussed. The dimensions relevant to our hypotheses are discussed be-low.
2.1 Openness to experience
The openness to experience dimension refers to characteristics such as:active imagination, willingness to consider new ideas, divergent thinking,and intellectual curiosity. Those who score high on this scale tend to be un-conventional and independent [3]. High openness to experience has alsoshown to be related to the openness of feelings. It has shown to relate toaesthetic emotions, as well as to greater awareness, clarity, and intensityof their own emotions at the time [17]. As those scoring high on open-ness to experience are more aware of, and more capable to judge theirown emotions, we expect them to be more likely to chose for the moodtaxonomy.
H1: Those scoring high on openness to experience are more likely tochoose for mood.
2.2 Conscientiousness
Conscientiousness refers to characteristics such as self-discipline. Peo-ple that score high on the conscientiousness scale tend to be more orga-nized, plan oriented, and determined compared to those scoring low [3].They also live lives that are overall less emotional, more balanced, morepredictable, and will encounter fewer emotionally intense situations (fewerextreme lows, as well as fewer extreme highs). This dimension is consid-ered to be the least emotionally charged, and is correlated with positive andnegative emotions [8, 17]. Therefore, we expect this dimension to be morerelated to activity and genre, as these taxonomies bear more concretenessand are less emotionally charged.
H2: Those scoring high on conscientiousness are more likely to choose foractivity or genre.
51

2.3 Extraversion
Extraverts are considered to be very sociable, energetic, optimistic, friendly,and assertive [3]. Findings show that for high extraverts, they might usephysical and other energizing activities to distract themselves from nega-tive emotions. However, this is a last resort and is only used when all otherpaths toward active modification are not available [4]. Although this doesnot seem to be a situation that would happen often, we think that extraver-sion may be a predictor for choosing activity.
H3: Those scoring high on extraversion are more likely to choose for activ-ity.
2.4 Neuroticism
The neuroticism dimension indicates emotional stability and personal ad-justment. High scoring on neuroticism are those that frequently experienceemotional distress and wide swings in emotions, while those scoring lowon neuroticism tend to be calm, well adjusted, and not prone to extremeemotional reactions [3]. Additionally, those who are highly neurotic do notbelieve that emotions are malleable, but rather difficult to control and strongin their expressions [8]. Previous research has found that music is used toregulate emotions [16]. As neurotic people do not consider emotions to beeasily changed, we believe that they prefer to browse for music by activityor genre.
H4: Those scoring high on neuroticism are more likely to choose for activityor genre.
3 Method
To investigate personality and taxonomy preferences, we made use of afake music application named “Tune-A-Find." This application was createdto study user interaction and music preferences in a simulated music stream-ing service environment. The application consists of a simple interface withthree taxonomies (mood, activity, and genre) for participants to browse formusic (see Figure 1). A tooltip provided users a description of each taxon-omy. We randomized taxonomy order to prevent order effects.
Prior to the start, we told participants that they were going to test a newmusic streaming service. Additionally, we instructed them to interact with
52

Figure 1: Screenshot of Tune-A-Find with “mood" tooltip. See the box belowfor all tooltip descriptions.
Tooltip descriptionsMood: “Browse for music that fits how you’re feeling."Activity: “Browse for music that fits what you’re doing."Genre: “Browse for music by music style."
the system in the for them most ideal way in order to limit experiencebias.
We collected participants’ first taxonomy choice to investigate their intrinsictaxonomy preferences. At the end of the study, we asked them to fill inthe 44-item Big Five Inventory on a 5-point Likert scale (disagree strongly -agree strongly) in order to measure personality.
We recruited 326 participants through Amazon Mechanical Turk. Participa-tion was restricted to those located in the United States, and also to thosewith very good reputation to avoid careless contributions. Participants wererecruited at various times of the day to balance night and day time musicapplication usage. Several comprehension-testing questions were used tofilter out fake and careless entries. This left us with 297 completed and validresponses. Age (19 to 68, with a median of 31) and gender (159 males and138 females) information indicated an adequate distribution.
4 Findings
Using a chi-square test of independence, we tested our hypotheses by look-ing at the relationship between participants’ five personality dimensions andthe chosen music taxonomy (mood, activity, and genre). We discuss our re-
53

Figure 2: Hypotheses visualization. (O)penness to experience,(C)onscientiousness, (E)xtraversion, (A)greeableness, (N)euroticism. Solidlines represent accepted hypotheses, dotted lines the rejected ones.
sults in the following sections. The phi coefficient (φ) was used as the indexof effect size. All findings indicate a moderate effect size. A recall of ourhypotheses can be found in Figure 2.
4.1 Mood (n=68)
Chi-square test results indicated a marginally significant effect betweenopenness to experience and mood χ2(1, N = 297) = 3.117, p = .07,φ = .202. This means that those who scored high on openness to ex-perience were more likely to choose for mood than for activity or genre. Allother personality dimensions were not significant.
4.2 Activity (n=16)
The chi-square test results for activity indicated a significant effect of neu-roticism χ2(1, N = 297) = 12.663, p < .001, φ = .306. Additionally, wefound a marginal significant effect of conscientiousness χ2(1, N = 297) =3.210, p = .07, φ = .204. However, no significant effects were found forextraversion χ2(1, N = 297) = .507, ns or the other dimensions. Resultsindicate that those who scored high on neuroticism or conscientiousnesswere more likely to choose activity.
4.3 Genre (n=213)
The chi-square test results for genre showed a significant effect of neuroti-cism χ2(1, N = 297) = 6.583, p = .01, φ = .249, but no significant effect wasfound of conscientiousness χ2(1, N = 297) = 0, ns or the other dimensions.
54

This implies that those who scored high on neuroticism were more inclinedto choose for genre.
5 Discussion
We found that those scoring high on openness to experience are likely tochoose for mood (H1). Our hypothesis regarding high conscientiousnesswas partially supported (H2). High conscientiousness increased preferencefor activity, but not for genre. This could be explained by the fact that highlyconscientious people are characterized as hard-working, task- and goal-oriented (taking to an extreme, they can be workaholics and perfectionists)[14]. Therefore, it can be that those scoring high on this dimension prefera taxonomy where they can find music that fit their task or goal rather thanlooking for music based on genre. No significant results were found for ourhypothesis between high extraversion and a preference for activity (H3).Extraverts are only likely to use physical and energizing activities as a lastresort when all other paths toward modification of negative emotions are notavailable [4]. This could explain the rejection of our hypothesis, as thesekind of situations are unlikely to occur frequently. Lastly, we found supportfor our hypothesis that those scoring high on neuroticism are more likely tochoose for activity or genre (H4).
6 Conclusion
Our data suggest that personality traits are a predictor for music taxonomypreferences used in music streaming services. Given our results, there areseveral HCI related implications to consider. Personality information hasalready been proposed to improve recommendations in recommender sys-tems (e.g., [5, 18]). Based on our results, personality information couldbe further incorporated to personalize user interfaces. E.g., preferred tax-onomies could be displayed prominently, while other taxonomies are lessemphasized, or music streaming services could recommend music basedon the preferred taxonomy.
The current study focused on independent music taxonomies (mood, activ-ity, and genre), but, for instance, our results show that high neuroticism isrelated to both activity and genre. People may hence not prefer one mu-sic taxonomy, but may be interested in combinations (e.g., sad pop music,funky road trip music, or happy cooking music). Furthermore, we will look atcategory preferences within a taxonomy. Such as, categories within mood(e.g., happy, sad, angry), activity (e.g., sleeping, relaxing, partying), and
55

genre (e.g., pop, rock, jazz). Finally, cultural differences could play a role intaxonomy usage. Future work should address this.
7 Acknowledgements
This research is supported by the Austrian Science Fund (FWF): P25655;and by the EU FP7/2013-2016 through the PHENICX project under grantagreement no.601166.
References
[1] Bollen, D., Knijnenburg, B.P., Willemsen, M.C., Graus, M.: Under-standing choice overload in recommender systems. In: RecSys. ACM(2010)
[2] Bravo, M.J., Farid, H.: Object recognition in dense clutter. Perception& psychophysics 68(6), 911–918 (2006)
[3] Burger, J.: Personality. PSY 235 Theories of Personality Series, Cen-gage Learning (2010), http://books.google.at/books?id=bZY7I2\_8yRMC
[4] Carver, C.S., White, T.L.: Behavioral inhibition, behavioral activation,and affective responses to impending reward and punishment: thebis/bas scales. J. of personality and social psych. (1994)
[5] Ferwerda, B., Schedl, M.: Enhancing music recommender systemswith personality information and emotional states: A proposal. In: EM-PIRE, Aalborg, Denmark. pp. 1613–0073 (2014)
[6] Fu, Z., Lu, G., Ting, K.M., Zhang, D.: A survey of audio-based musicclassification and annotation. Multimedia, IEEE Transactions on pp.303–319 (2011)
[7] Gourville, J.T., Soman, D.: Overchoice and assortment type: Whenand why variety backfires. Marketing science 24(3), 382–395 (2005)
[8] Gross, J.J., John, O.P.: Mapping the domain of expressivity: multi-method evidence for a hierarchical model. J. of personality and socialpsych. (1998)
[9] Hu, R., Pu, P.: Acceptance issues of personality-based recommendersystems. In: RecSys. pp. 221–224. ACM (2009)
56

[10] Iyengar, S.S., Wells, R.E., Schwartz, B.: Doing better but feeling worselooking for the âAIJbestâAI job undermines satisfaction. PsychologicalScience 17(2), 143–150 (2006)
[11] Janiszewski, C.: The influence of display characteristics on visual ex-ploratory search behavior. Journal of Consumer Research (3), 290–301 (1998)
[12] Lonsdale, A.J., North, A.C.: Why do we listen to music? a uses andgratifications analysis. British Journal of Psychology 102(1), 108–134(2011)
[13] McCrae, R.R., John, O.P.: An introduction to the five-factor model andits applications. Journal of personality 60(2), 175–215 (1992)
[14] Ozer, D.J., Benet-Martinez, V.: Personality and the prediction of con-sequential outcomes. Annu. Rev. Psychol. 57, 401–421 (2006)
[15] Perruchet, P., Rey, A., Hivert, E., Paction, S.: Do distractors interferewith memory for study pairs in associative recognition? Memory &cognition 34(5), 1046–1054 (2006)
[16] Rentfrow, P.J., Gosling, S.D.: The do re mi’s of everyday life: the struc-ture and personality correlates of music preferences. J. of personalityand social psych. (2003)
[17] Shiota, M.N., Keltner, D., John, O.P.: Positive emotion dispositionsdifferentially associated with big five personality and attachment style.The Journal of Positive Psychology 1(2), 61–71 (2006)
[18] Tkalcic, M., Kunaver, M., Košir, A., Tasic, J.: Addressing the new userproblem with a personality based user similarity measure. In: DEMRA(2011)
57

Personality and Taxonomy Preferences,and the Influence of Category Choice onthe User Experience for Music StreamingServices
Published in: Submitted to Journal
BRUCE FERWERDA, Johannes Kepler University, Linz (AT)EMILY YANG, Johannes Kepler University, Linz (AT)MARKUS SCHEDL, Johannes Kepler University, Linz (AT)MARKO TKALCIC, Johannes Kepler University, Linz (AT)
Abstract
Music streaming services increasingly incorporate different ways forusers to browse for music. Next to the commonly used “genre" taxon-omy, nowadays additionally taxonomies, such as mood and activitiesare often used. As additional taxonomies have shown to be able todistract the user in their search, we looked at how to predict taxon-omy preferences in order to counteract this. Additionally, we lookedat how the number of categories presented within a taxonomy influ-ences the user experience. We conducted an online user study whereparticipants interacted with an application called “Tune-A-Find." Wemeasured taxonomy choice (i.e., mood, activity, or genre), individ-ual differences (e.g., personality traits and music expertise factors),and different user experience factors (i.e., choice difficulty and sat-isfaction, perceived system usefulness and quality) when presentingeither 6- or 24-categories within the picked taxonomy. Among 297participants, we found that personality traits are related to music tax-onomy preferences. Furthermore, our findings show that the numberof categories within a taxonomy influences the user experience in dif-ferent ways and is moderated by music expertise. Our findings cansupport personalized user interfaces in music streaming services. Byknowing the user’s personality and expertise, the user interface canadapt to the user’s preferred way of music browsing.
Keywords: Personality, Taxonomy, Music, Categorization, Overchoice
1 Introduction
With the rapid increase of technological advances, Internet connectivity be-came faster and cheaper. Music streaming services are eagerly making
58

use of these developments by putting large music collections online. Theavailability of online music gives users the possibility to choose from an im-mense music collection and stream the content directly to their devices atany given time. While it provides users an almost unlimited choice of mu-sic, the abundance of music is a cognitive burden. To overcome this, musicstreaming services try to organize their collections in such a way so thatusers can easily browse and find what they would like to hear. Differentclassification methods from music information retrieval (MIR) are used toorganize music (see for an overview [4, 31]) in order for users to browsethrough these large amount of music content.
The “genre" taxonomy has been most commonly used to organize music.However, lately, music streaming services have shown interest in a moreuser centered approach for organizing music. Popular music streamingservices, such as: 8tracks (http://www.8tracks.com), AccuRadio (http://www.accuradio.com), Songza (http://www.songza.com), Spotify (http://www.spotify.com), have started to provide additional taxonomies to bet-ter serve users with diverse music browsing needs. Derived from researchthat investigated how people use music in their everyday life [57], tax-onomies such as mood and activity are included for users to find musicthey want to listen to in different situations or contexts.
By providing different taxonomies, diverse browsing needs of users areserved. Prior research has shown that satisfaction with the eventually cho-sen item already starts at the taxonomy level [37]. However, taxonomiescan compete, especially when they possess unique or complementary fea-tures that are not directly comparable [34]. Taxonomies that are not rele-vant for the search goal can distract the user [65]. They can complicatethe search process [9], and increase the search effort because of compet-ing attention [44]. This can result in that the taxonomy influences users’preference strength and satisfaction with the eventually chosen item [43].Therefore, understanding taxonomy preferences on an individual level isimportant to provide a personalized music experience. For example, mu-sic streaming services could emphasize the taxonomy that is important tothe user while muting less preferred taxonomies to the background, or notshowing them at all.
To predict taxonomy (mood, activity, or genre) preferences, personalitytraits can play an important role. Personality has shown to be a reliablepredictor for human preferences. It has shown to be an enduring factorthat influences people’s behavior [47], interests, and taste [27, 50, 69]. Aspersonality has shown to be a prominent factor in shaping human prefer-ences (e.g., behavior, interest, and taste), one can expect similar patternsto emerge between similar personality traits [10]. For that, we believe thata preference for a taxonomy (i.e., mood, activity, or genre) can also be
59

derived by the personality characteristics of a user.
In addition to taxonomy preferences, we take a further look into the subse-quent step of music browsing; the categories within a taxonomy. We lookat how the amount of categories within a music taxonomy influences theuser experience (i.e., choice satisfaction, choice difficulty, perceived sys-tem quality, and perceived system usefulness). Ample research has shownthat presenting more options may not always be a good thing. It can causeoverchoice (also referred as “choice overload"), that in turn influences thedifficulty to make a choice and satisfaction with the item and decreaseschoice satisfaction [6, 36, 41, 71, 75, 77]. However, whether overchoiceoccurs has shown to be influenced by different moderators (e.g., expertise,choice set attractiveness). See for an overview [74]). To our knowledge,overchoice and its moderators in the context of music browsing have notbeen studied so far. As we will further discuss in the next section, exper-tise plays an important role in whether overchoice occurs. In this study, werely on measurements to infer music expertise related to the chosen musictaxonomy.
Our work makes several contributions. Firstly, we contribute to the field ofpersonality-based preferences. We show that personality does not only ex-plain music genre preferences [69], but that it extends to the overarchingmusic categorizations (i.e., taxonomies) by showing that personality traitsare related to different music browsing strategies (i.e., browsing for musicby mood, activity, or genre). Secondly, we contribute to the decision mak-ing literature by extending the knowledge about when and how overchoiceoccurs in the context of music. For this we look at the categories within ataxonomy, and show that music expertise is an important influencing factoron the evaluation of the system and chosen item.
Based on our work, music services could be further personalized. Theservice could adapt the user interface depending on the user’s personalityand level of music expertise. This allows for counteracting on decreaseduser experience by the user interface.
The research questions (RQs) that we try to answer in this work are:
RQ 1: How do personality traits relate to taxonomy (mood, activity, genre)preferences in music streaming services?
RQ 2: How does the size of the choice set influence the user experience(i.e., choice satisfaction, perceived system usefulness, and perceived sys-tem quality), and how is this moderated by expertise?
To investigate these research questions, we conducted a user study (pre-ceded by a preliminary study) in which we simulated a music streaming
60

service application. Among 297 participants we found that personality isrelated to different music browsing strategies. We found that openness toexperience is positively related to the mood taxonomy, conscientiousnessand neuroticism are positively related to the activity taxonomy, and neuroti-cism is positively related to the genre taxonomy.
We also looked at the size of the choice set (i.e., 6 or 24 items) within achosen music taxonomy in order to investigate the overchoice effect. Wefound that music expertise plays a moderating role in how the system isevaluated by the user. Within the mood taxonomy, participants with highermusic expertise rated the system as more useful and of higher quality whenthey were facing the choice set with less options to choose from. However,this was the other way around for the genre taxonomy. Here, participantswith a higher music expertise rated the system more useful and of a higherquality when facing a bigger choice set.
We investigated two different RQs within one study. Therefore, the remain-der of the paper is structured as follows. We first discuss the related workseparately for each RQ in Section 2. In Section 2.1 we discuss the relatedwork of RQ 1, and in Section 2.2 the related work of RQ 2. After the re-lated work, we continue with the materials (Section 3) that were used for theuser study to answer RQ 1 and 2. In Section 4 we discuss the preliminarystudy that was necessary to define the content for the user study. Subse-quently, we divided Section 5 into Study A and B, where we will treat thehypotheses, findings, and discussion related to RQ 1 and 2. We discussthe limitations and future work in Section 6. Finally we round off the paperby drawing conclusions in Section 7.
2 Related Work
We divided our user study into two parts in order to investigate both RQs,which we call from hereon Study A and Study B. Therefore, we separatedthe related work into two parts as well. The first part will discuss work that isrelated to the taxonomies and personality traits (Study A. Section 2.1), andthe second part focuses on the overchoice in presenting different numberof categories within a taxonomy (Study B. Section 2.2).
2.1 Study A - Taxonomies
In the following sections we discuss how taxonomies influences users’ de-cision making, and how personality is able to predict the preference for ataxonomy.
61

2.1.1 Taxonomic influence
The effects of overchoice have been well studied. However, most researchon overchoice in consumer decision making has investigated choice satis-faction by focusing on choices in isolation (i.e., choices within a taxonomy;e.g., [6, 36, 41, 71, 75, 77]). For example, Iyengar and Lepper [41] in-vestigated overchoice by using an assortment of on a specific set of jams.Bollen et al [6] created movie recommendations by using only the Top-5and Top-20 movies. Although they found effects of overchoice on choicesin isolation, others have shown that the satisfaction with the eventually cho-sen item already starts at the overarching categorizations; the taxonomies(e.g., [34, 37, 65]). Herpen et al [37] asked their participants to choose ashirt from clothing brochures. They found that taxonomies can distract inthe decision making process. Their participants experienced higher deci-sion effort, had more difficulties grasping the selection, and were experienc-ing more confusion when the brochures consist of complementary clothingtaxonomies (e.g., shirts, pants, shoes) than when they consist of substitutes(i.e., only shirts). The complementary taxonomies caused participants totake longer to make a decision. In extension, Perruchet et al [65] foundthat taxonomies can unintentionally act as distractors when not relevant forthe initial search goal or when not being actively looked for at all. Whentaxonomies are placed next to each other, they start to compete. Gourvilleand Soman [34] showed that competing of the taxonomies is exacerbatedespecially when they consist of features that are unique and not directlycomparable.
Although different taxonomies in music streaming services serve the samegoal of providing users with music that they would want to listen to, theyalso consist of unique features that are not directly comparable. The tax-onomies provide users the possibility to browse for music in different ways.In general, the mood taxonomy provides users with music that is similarto how they feel, the activity taxonomy provides music that fits a specificactivity, and the genre taxonomy has music categorized based on a set ofstylistic criteria. Given that the features of the taxonomies are not directlycomparable, they can distract the user and increase the effort of picking theright music taxonomy to continue the music browsing. In the end, it caninfluence the satisfaction with the eventually chosen music item.
To minimize the negative influence of competing taxonomies, we try tocounteract by identifying the intrinsic music browsing preference of the user.By identifying the user’s most preferable music browsing strategy, the sys-tem can anticipate the desired user interface. For example, the systemcan display the preferred music browsing taxonomy or already recommendmusic that is in line with a user’s music browsing strategy (e.g., [26]).
62

In order to identify the music browsing preference of users, we rely on per-sonality traits. We will discuss prior work related to personality in the nextsection.
2.1.2 Personality
Personality has shown to be an enduring factor that influences an individ-ual’s behavior [46], interest, and tastes [50, 69]. As personality plays sucha prominent role in shaping human preferences, one can expect similarpatterns (i.e., behavior, interest, and tastes) to emerge between similarpersonality traits [10]. Different models have been created to categorizepersonality, where the five-factor model (FFM) is the most well known andwidely used [59]. The FFM consists of five general dimensions that de-scribe personality. Each of the five dimensions consist of clusters of cor-related primary factors. Table 1 shows the general dimensions with thecorresponding primary factors.
General dimensions Primary factorsOpenness to experience Artistic, curious, imaginative, insightful, original,
wide interestConscientiousness Efficient, organized, planful, reliable, responsible,
thoroughExtraversion Active, assertive, energetic, enthusiastic, outgoing,
talkativeAgreeableness Appreciative, forgiving, generous, kind, sympa-
thetic, trustingNeuroticism Anxious, self-pitying, tense, touchy, unstable, wor-
rying
Table 1: The five-factor model adapted from McCrae and John [59].
There is a growing amount of psychological literature investigating the rela-tionship between personality traits and music consumption (e.g., [27, 67,69, 70, 82]). For example, music preferences were found to be corre-lated with personality traits. Rentfrow and Gosling [69] categorized musicpieces into 4 music-preference dimensions (reflective and complex, intenseand rebellious, upbeat and conventional, and energetic and rhythmic), andfound correlations with the five general personality dimensions (i.e., open-ness to experience, conscientiousness, extraversion, agreeableness, andneuroticism), such as, a relationship between energetic and rhythmic musicand extraversion and agreeableness. The psychological work on person-ality provides valuable information for the development of domain specificrecommender systems. Knowing someone’s personality can help infer theirpreferences, and can therefore contribute to a better personalized experi-
63

ence.
There has been an emergent interest in how to use personality in a sys-tem (e.g., recommender systems), and several directions have been pro-posed (e.g., [23, 26, 25, 80, 81]). For example, Tkalcic et al [81] propose amethod to overcome the “cold-start problem" 1 by including personality in-formation to enhance the neighborhood measurement. Hu and Pu [39] haveshown that personality-based recommender systems are more effective inincreasing users’ loyalty towards the system and decreasing cognitive effortcompared to systems that do not use personality information.
Also research on personality acquisition is progressing. Research has beenlooking into ways to implicitly acquire personality traits of users and therebycreate opportunities to decrease the usage of extensive and time consum-ing questionnaires. Possibilities to implicitly acquire personality traits be-come possible with the increased implementation of mechanisms such as“single sign-on buttons" by applications. Single sign-on buttons allow usersto conveniently register as a new user and login to an application by usingtheir social media account (e.g., Facebook). However, except for the user’sbasic information that is required for the application, applications often gainaccess to an abundance of other data of the user [14]. Research on newmedia has shown that it is able to infer personality traits from content ofsocial media trails (e.g., Facebook [2, 29, 33, 64, 72], Twitter [32, 66], andInstagram [28, 30]).
2.2 Study B - Categories
In this work, we further look into the influence of the number of categoriespresented within each taxonomy (Section 5.3). With this we join decision-making research on overchoice. Overchoice (or choice overload) refers tothe increase of choice difficulty and eventual decrease of satisfaction asthe number of choices increase. Iyengar and Lepper [41] were one of thefirst to define overchoice by testing the attractiveness between a set of 6 or24 types of jam. Although their result shows that initially participants weremore attracted to the larger (24 item) set, those who were exposed to thesmaller (6 item) set were more inclined to actually buy a pot of jam (3% and30% respectively of the participants bought jam). Additionally, assessmentof satisfaction showed that those who bought jam from the larger choiceset were less satisfied compared to those with a purchase from the smallerchoice set.
1The cold-start problem is most prevalent in recommender systems, and occurs whenthere is not enough data (yet) to recommend personalized items to the user. This problemespecially occurs for new users.
64

The overchoice effect has been replicated numerous times in different con-text, and was shown to affect motivation to choose as well as satisfac-tion with the chosen item (e.g., [6, 36, 42, 71, 77]). Shah and Wolford [77]found a motivational buying decrease in purchasing black pens when theassortment size increases. When they increased the assortment size ofthe black pens, participants’ motivation to purchase decreased from 70%to 33%. Reutskaja and Hogarth [71] investigated overchoice in the contextof gift-boxes prices, and found that satisfaction with the chosen gift-box de-creased when the number of gift-boxes to choose from increased. Similarfindings were shown by Haynes [36] in the context of the number of lotteryprices to choose from. Likewise, Bollen et al [6] demonstrated a decreasein choice satisfaction in a movie recommender system among an increasenumber of attractive movies to choose from.
Although there is an increased chance of a decrease in choice satisfaction,people somehow still cherish more choice, and studies have shown thatshops with a large variety even create a competitive advantage by providingmore choices (e.g., [1, 8, 12, 16, 40, 48, 58, 54, 62]). So it seems that eventhough consumers risk to be more dissatisfied with their choice at the end,they still are attracted to more choices.
Why a larger set is more attractive and yet less satisfactory, can be ex-plained by a number of mechanisms. A larger choice set becomes moreattractive because of the summed benefit of each option, and thereby thetotal benefit of the set increases [20]. However, satisfaction decreases be-cause making the right choice becomes more difficult. The psychologicalcost increases as a consequence of an increased number of choices. Inother words, the summed benefit of a larger choice set is outweighed bythe cost of comparing each option in order to make the right decision, in-creased risk of making a wrong choice, and increased expectations with thechosen item [20, 75, 76]. This results in that a larger choice set has a higherchance of decreased satisfaction or that no choice is made at all. Reutskajaand Hogarth [71] showed that overchoice occurs in an inverted satisfactionU-curve, where at one point the total cost of the choice set grows fasterthan the total benefit of the set, causing a decrease of satisfaction to occur.
Apart from studies that have shown the overchoice effect, there are alsostudies that demonstrate an opposing view (e.g., [5, 7, 21, 49, 79]). Theyfound that reducing the variety in retail shops often result in decrease salesor no change at all. Scheibehenne et al [74] performed a meta-analysis of50 studies voting against and in favor of the overchoice hypothesis, andfound that the overall effect size comes close to zero. There seem to benecessary preconditions for a choice set before overchoice occurs [73, 74].As mentioned before, the attractiveness of the choice set plays an importantrole. When items of a choice set are comparably attractive, and especially
65

when they additionally consist of incomparable features, the chances ofoverchoice increases ([17, 24]).
Besides that the choice set is undermined with preconditions; also the de-cision maker’s characteristics play a role. A factor that has been shown toplay a significant role is expertise with the choice domain [60, 74]. Whenpeople have expertise with the choice content, they are less prone to beoverwhelmed by the increasing number of choices, and therefore, over-choice is less likely to occur.
In order to investigate the overchoice within a music taxonomy, we firstneeded to create a choice set that meets the precondition (i.e., a choice setwith attractive items). We conducted a preliminary study where we iden-tified the categories that would be most attractive to our participants (seeSection 4). Additionally, the moderator effect of music expertise related toeach music taxonomy is further investigated in Section 5.3.
3 Method
In order to investigate music taxonomy preferences for music browsing, andoverchoice of categories within a music taxonomy, we created an online ex-periment where we simulated a music streaming service application. Thisapplication allowed us to study both RQ 1 and 2 at the same time. In thefollowing sections we will discuss the experiment in more detail, and thematerials used.
3.1 Procedure
For the experiment we simulated a music streaming service applicationnamed “Tune-A-Find" (see Figure 1 for the work-flow of the experiment)in order to investigate taxonomy preferences, and overchoice of categorieswithin a taxonomy. Before participants started the experiment, instructionswere given stating that they were about to test a new music streaming ser-vice. We emphasized that it is important that they interact with the applica-tion in the most ideal way for them. This allowed us to minimize experiencebias with any of the taxonomies. After participants agreed with the instruc-tions they continued by interacting with Tune-A-Find.
The simulated music streaming service consists of a simple interface withthree taxonomies (mood, activity, and genre) for participants to browse formusic (see Figure 2 and Section 5.2). A tooltip provided users a descrip-
66

Activity Instructions 6 categories
24 categoriesQuestionnaires
Taxonomy choice Random category assignment
Genre
Mood
Figure 1: Experiment work-flow. Participants were given instructions aboutthe study, then continued by interacting with the music streaming applica-tion (see Section 5.2 for details). After choosing a music taxonomy to con-tinue the music browsing, participants were randomly assigned to eitherthe 6-categories condition or the 24-categories (see Section 5.3 for moredetails). After picking a category, participants continued to the concludingquestionnaires.
tion of each taxonomy. 2 The order of the taxonomies was randomized toprevent order effects. After participants chose a taxonomy to search musicby (i.e., mood, activity, or genre), they continued on by choosing a cate-gory (i.e., type of mood, type of activity, or type of genre) within the chosentaxonomy.
Figure 2: Screen shot of Tune-A-Find with the “Mood" tooltip.
For the categories within a chosen taxonomy, participants were randomlyassigned to either the 6- or 24-categories condition (Figure 3 and Sec-tion 5.3). The categories within each taxonomy were based on the resultsof the preliminary study (Section 4). We did not allow participants to goback to pick a different taxonomy. Therefore, we included a “None of theitems" option. Category order was randomized with “None of the items" op-tion always placed last. After participants picked a category, they continuedwith the concluding questionnaires (i.e., user experience, music expertise,personality, and demographics questionnaires). We intentionally did not in-clude real music recommendations in order to avoid response biases in the
2Mood tooltip description “Browse for music that fits how you’re feeling." Activity tooltipdescription “Browse for music that fits what you’re doing." Genre tooltip description “Browsefor music by music style."
67

questionnaires due to the influence of the algorithm.
Figure 3: Screen shots of the 6- and 24-categories conditions (top andbottom, respectively) with an extra option of “None of the items."
3.2 Materials
The taxonomies used in Tune-A-Find (i.e., mood, activity, and genre), arebased on a close observation of current music streaming services. Wefound that these labels are increasingly being used (see Table 2).
68

Mood Activity Genre8Tracks X X XAccuRadio X XEarbits XGrooveshark XGoogle Play Music XGuvera X XJango X XLast.fm XMusicovery X X XPandora XSlacker X XSongza X X XSpotify X X X
Table 2: Grasp of the observed music streaming services and the tax-onomies they use to organize music.
For the number of categories to present within each taxonomy, we followedthe original work of Iyengar and Lepper [41] on overchoice. They observedthe occurrence of overchoice between choice sets consisting of 6 and 24-items. We conducted a separate user study to determine which categoricallabels (types of mood, types of activity, or types of genres) to include withineach taxonomy (see Section 4).
For the concluding questionnaires we made use of existing questionnairesmeasuring: user experience, music expertise, and personality. To measureuser experience factors we adapted the original user experience question-naire of Knijnenburg et al [52] to fit the music streaming context of ourstudy. The questionnaire depicts different parts of the user experience. Itmeasures participants choice difficulty, choice satisfaction, perceived sys-tem usefulness, and perceived system quality (see Appendix B).
In order to measure participants’ music expertise, we relied on the Gold-smiths Music Sophistication Index (Gold-MSI [61]). The Gold-MSI question-naire measures music sophistication based on the following dimensions:
• Active engagement (how much time and money one spends on mu-sic)
• Perceptual abilities (cognitive musical ability related to music listeningskills)
• Musical training (musical training and practice)
• Signing abilities (skills and activities related to singing)
69
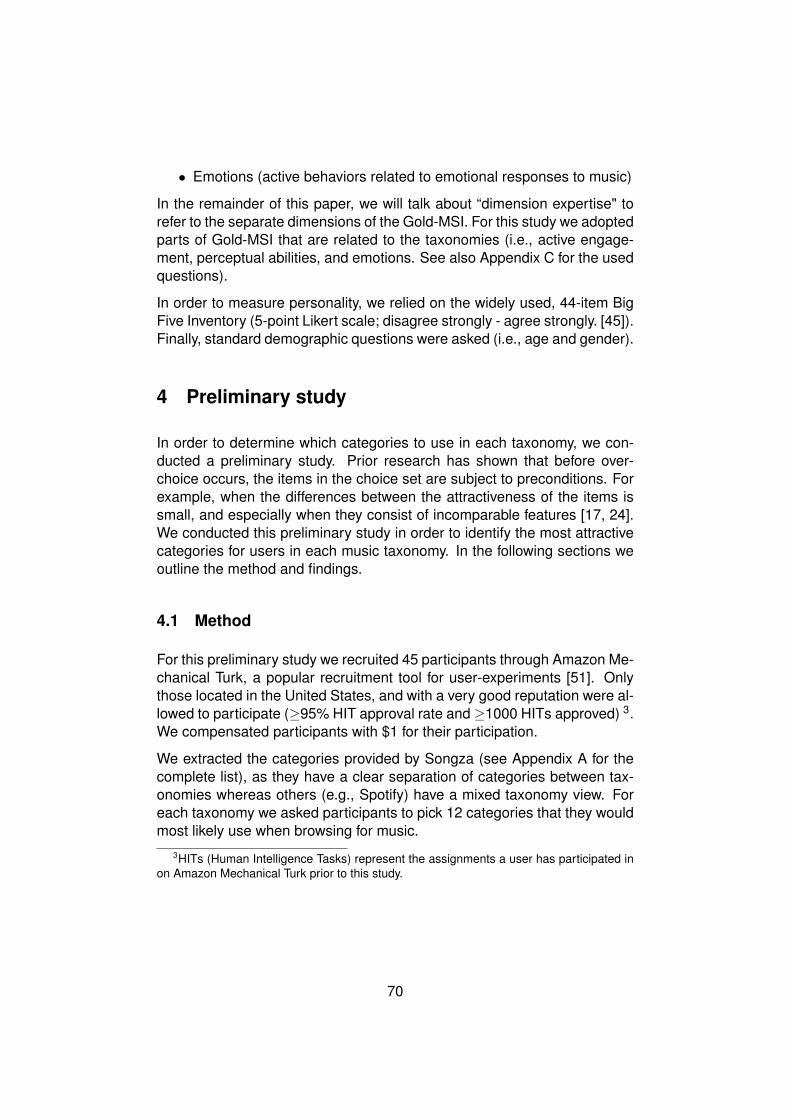
• Emotions (active behaviors related to emotional responses to music)
In the remainder of this paper, we will talk about “dimension expertise" torefer to the separate dimensions of the Gold-MSI. For this study we adoptedparts of Gold-MSI that are related to the taxonomies (i.e., active engage-ment, perceptual abilities, and emotions. See also Appendix C for the usedquestions).
In order to measure personality, we relied on the widely used, 44-item BigFive Inventory (5-point Likert scale; disagree strongly - agree strongly. [45]).Finally, standard demographic questions were asked (i.e., age and gender).
4 Preliminary study
In order to determine which categories to use in each taxonomy, we con-ducted a preliminary study. Prior research has shown that before over-choice occurs, the items in the choice set are subject to preconditions. Forexample, when the differences between the attractiveness of the items issmall, and especially when they consist of incomparable features [17, 24].We conducted this preliminary study in order to identify the most attractivecategories for users in each music taxonomy. In the following sections weoutline the method and findings.
4.1 Method
For this preliminary study we recruited 45 participants through Amazon Me-chanical Turk, a popular recruitment tool for user-experiments [51]. Onlythose located in the United States, and with a very good reputation were al-lowed to participate (≥95% HIT approval rate and ≥1000 HITs approved) 3.We compensated participants with $1 for their participation.
We extracted the categories provided by Songza (see Appendix A for thecomplete list), as they have a clear separation of categories between tax-onomies whereas others (e.g., Spotify) have a mixed taxonomy view. Foreach taxonomy we asked participants to pick 12 categories that they wouldmost likely use when browsing for music.
3HITs (Human Intelligence Tasks) represent the assignments a user has participated inon Amazon Mechanical Turk prior to this study.
70

4.2 Findings & conclusion
In line with prior work of Iyengar and Lepper [41] on overchoice, and workdefining the preconditions of the choice set [17, 24], we picked the top 6and 24 most attractive (i.e., the categories that participants indicated touse most likely in their music browsing) categories (Table 3). The top 6 and24 most attractive categories are used for Study B (see Section 5.3) wherewe investigate overchoice within a music taxonomy (i.e., mood, activity, andgenre).
Mood # Activity # Genre #1 Energetic 40 Relaxing 30 Pop 292 Happy 37 Being Creative 26 Rock 233 Soothing 35 Rainy day 24 Rock: Classic
Alternative &Punk
21
4 Mellow 34 Staying Up AllNight
22 Indie: IndieRock
20
5 Atmospheric 31 Road Trip 21 Indie: Indie Pop 196 Hypnotic 30 Working/Studying
(without lyrics)19 Easy Listening 19
7 Introspective 28 Reading in aCoffee Shop
18 Classical 18
8 Warm 27 Singing in theShower
18 Blues & BluesRock
18
9 Motivational 27 Housework 18 Film scores 1810 Funky 25 Working/Studying
(with lyrics)17 Folk 17
11 Sad 24 RomanticEvening
17 Dance 16
12 Celebratory 24 Gaming 17 R&B 1613 Nocturnal 23 Energy Boost 17 Pop: Classic
Pop15
14 Aggressive 22 Working Out:Weight Training
17 Rap 15
15 Seductive 22 Unwinding AfterWork
16 Oldies 14
16 Gloomy 22 Working Out:Cardio
16 Electronica 14
17 Sweet 22 Dance Party:Beach
16 Jazz 14
18 Classy 20 House Party 16 Rock: ModernRock
13
71

19 Sexual 19 Barbecuing 15 Indie: IndieElectronic
13
20 Raw 19 Lying Low onthe Weekend
15 Dance: House &Techno
13
21 Angsty 18 Sleeping 14 Singer-Songwriter
13
22 Visceral 18 City Cruising 14 Pop: Dance pop 1223 Spacey 16 Waking Up on
the Right Side ofthe Bed
12 Funk 12
24 Trippy 16 Lying on aBeach
12 Dubstep & Drum’n Bass
12
Table 3: Top 6- and 24-categories chosen by participants. #represents the number of votes
5 Main studies
In the following subsections, we discuss the main studies where we treatthe hypotheses, findings, and discussion for each study separately. StudyA depicts the taxonomy preferences (Section 5.2), and Study B addressesthe overchoice effect within a chosen taxonomy (Section 5.3). 4
5.1 Participants
We recruited 326 participants through Amazon Mechanical Turk. Partic-ipation was restricted to those located in the United States, and also tothose with very good reputation (≥95% HIT approval rate and ≥1000 HITsapproved) to avoid careless contributions. Participants were recruited atvarious times of the day to balance night and day time music applicationusage. Several comprehension-testing questions were used to filter outfake and careless entries. This left us with 297 completed and valid re-sponses. Age (19 to 68, with a median of 31) and gender (159 males and138 females) information indicated an adequate distribution. Participantswere compensated with $2 for their participation.
4The studies extend the preliminary results published in [removed for submission] .
72

5.2 Study A
In Study A, we looked at how taxonomy preferences are related to differentpersonality traits. To investigate this relation we simulated a music stream-ing service (Figure 2). The application consists of a simple interface withthree taxonomies (mood, activity, and genre) for participants to browse formusic. A tooltip provided users a description of each taxonomy. The orderof the taxonomies were randomized to prevent order effects. Once a tax-onomy was picked, participants continued by choosing a category withinthe chosen taxonomy (this is addressed in Study B in Section 5.3). As weare interested in users’ intrinsic taxonomy preferences, participants werenot able to go back once a taxonomy was picked. For those who wantto choose a different taxonomy, we included an additional option of “Noneof the items" among the available categories. For those who picked thisoption, we included an additional question in the concluding questionnairewhere they could indicate what they would have picked otherwise in termsof taxonomy (i.e., mood, activity, or genre) as well as the category within ataxonomy.
In order to prevent an experience bias with one of the music taxonomies(i.e., mood, activity, or genre), participants were told during the instructionsof the user study that they were going to test a new music streaming ser-vice, and therefore it is important that they interact with the system in themost ideal way for them.
As there is no strong evidence from the literature to form hypotheses, wedecided to adopt an exploratory approach. We try to draw relationshipsbetween our findings to what is known from prior research in the discussionsection.
5.2.1 Findings
Using a chi-square test of independence, we explored the relationship be-tween participants’ five personality dimensions and the chosen music tax-onomy (mood, activity, and genre). We used a median split to divide eachpersonality trait into a low and high measure. The distribution of the musictaxonomy choices made by the participants are shown in Table 5. Par-ticipants in general chose for genre taxonomy followed by the mood andactivity taxonomies. In the following sections we discuss the relationshipbetween personality traits and the music taxonomy chosen by the partici-pants (see Table 4 for an overview).
73

χ2 (p)O C E A N
Mood 3.117(0.05)
0.934(0.334)
0.870(0.351)
0.044(0.833)
0.703(0.402)
Activity 0.046(0.830)
3.210(0.05)
0.507(0.477)
0.406(0.524)
12.663(<0.001)
Genre 3.079(0.11)
0.000(0.997)
1.506(0.220)
0.266(0.606)
6.583(0.01)
Table 4: Summary of the results for each taxonomy (i.e., mood, ac-tivity, and genre) with each personality trait: (O)pennes to experience,(C)onscientiousness, (E)xtraversion, (A)greeableness, and (N)euroticism.
Mood Taxonomy. Results of the chi-square test indicated a positive re-lationship between openness to experience and mood χ2(1, N = 297) =3.117, p = .05. This means that those who scored high on the opennessto experience dimension were more likely to choose for mood than for ac-tivity or genre taxonomy. We did not find any significant effects of the otherpersonality traits: conscientiousness χ2(1, N = 297) = .934, p = .334, ex-traversion χ2(1, N = 297) = .870, p = .351, agreeableness χ2(1, N = 297)= .044, p = .833, and neuroticism χ2(1, N = 297) = .703, p = .402.
Activity Taxonomy. When looking at the chi-square test results for the ac-tivity taxonomy, we found a positive significant effect of conscientiousnessχ2(1, N = 297) = 3.210, p = .05. Additionally, we found a positive rela-tionship of neuroticism χ2(1, N = 297) = 12.663, p < .001. These resultsindicate that those who scored high on neuroticism or conscientiousnesswere more likely to choose the activity taxonomy. We did not find signifi-cant effects for openness to experience χ2(1, N = 297) = .046, p = .830,extraversion χ2(1, N = 297) = .507, p = .477, and agreeableness χ2(1,N = 297) = .406, p = .524.
Genre Taxonomy. The chi-square test results for the genre taxonomy in-dicated a positive significant effect of neuroticism χ2(1, N = 297) = 6.583,p = .01, which implies that those who scored high on neuroticism weremore inclined to choose for genre than for the other taxonomies.. All theother personality traits were not significant: openness to experience χ2(1,N = 297) = 3.079, p = .11, conscientiousness χ2(1, N = 297) = 0, p = .997,extraversion χ2(1, N = 297) = 1.506, p = .220, and agreeableness χ2(1,N = 297) = .266, p = .606.
Additional finding. Additionally, we looked for effects of gender and age.Controlling for gender and age did not result in any significant effects. How-ever, as seen in Table 5, the distribution of gender is interesting and indi-
74
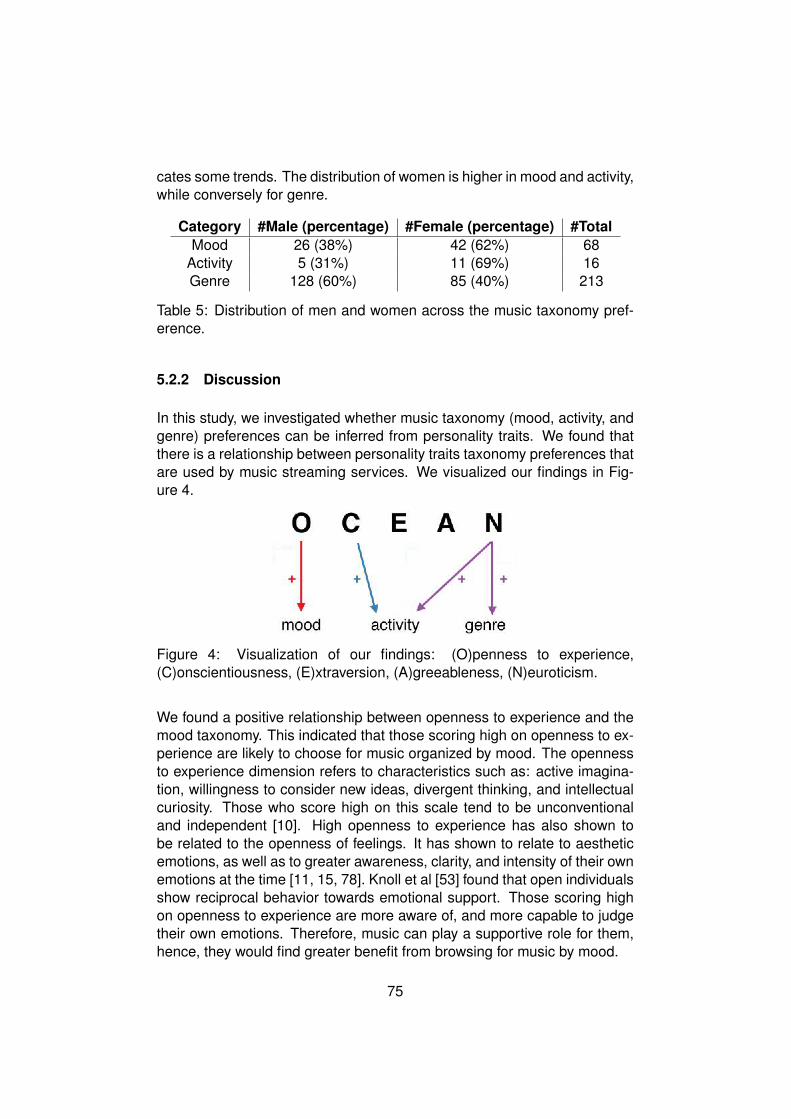
cates some trends. The distribution of women is higher in mood and activity,while conversely for genre.
Category #Male (percentage) #Female (percentage) #TotalMood 26 (38%) 42 (62%) 68
Activity 5 (31%) 11 (69%) 16Genre 128 (60%) 85 (40%) 213
Table 5: Distribution of men and women across the music taxonomy pref-erence.
5.2.2 Discussion
In this study, we investigated whether music taxonomy (mood, activity, andgenre) preferences can be inferred from personality traits. We found thatthere is a relationship between personality traits taxonomy preferences thatare used by music streaming services. We visualized our findings in Fig-ure 4.
Figure 4: Visualization of our findings: (O)penness to experience,(C)onscientiousness, (E)xtraversion, (A)greeableness, (N)euroticism.
We found a positive relationship between openness to experience and themood taxonomy. This indicated that those scoring high on openness to ex-perience are likely to choose for music organized by mood. The opennessto experience dimension refers to characteristics such as: active imagina-tion, willingness to consider new ideas, divergent thinking, and intellectualcuriosity. Those who score high on this scale tend to be unconventionaland independent [10]. High openness to experience has also shown tobe related to the openness of feelings. It has shown to relate to aestheticemotions, as well as to greater awareness, clarity, and intensity of their ownemotions at the time [11, 15, 78]. Knoll et al [53] found that open individualsshow reciprocal behavior towards emotional support. Those scoring highon openness to experience are more aware of, and more capable to judgetheir own emotions. Therefore, music can play a supportive role for them,hence, they would find greater benefit from browsing for music by mood.
75

A positive relationship between conscientiousness and the activity taxon-omy was found. In other words, high conscientious people show an in-creased preference for activity, but not for genre. Conscientiousness refersto characteristics, such as, self-discipline. People that score high on theconscientiousness scale tend to be more plan- and goal-oriented, orga-nized, and determined compared to those scoring low [10]. They also livelives that are overall less emotional, more balanced, more predictable, andwill encounter fewer emotionally intense situations (fewer extreme lows, aswell as highs [35, 83]). This dimension is considered to be the least emo-tionally charged, and correlated with positive and negative emotions [78].They are also characterized as hard-working, task- and goal-oriented (tak-ing to an extreme, they can be workaholics and perfectionists [63]). Asconscientious people are least emotionally charged, and more plan- andgoal-oriented, they would benefit of taxonomies that consist of concretemusic categories (e.g., activities) to support their plans and goals insteadof more vaguely defined categories (e.g., moods and emotions).
Lastly, we found relationships between neuroticism and the activity andgenre taxonomy. This indicates that those scoring high on neuroticismare more likely to choose for activity or genre. The neuroticism dimen-sion indicates emotional stability and personal adjustment. High scoringon neuroticism are those that frequently experience emotional distress andwide swings in emotions, while those scoring low on neuroticism tend tobe calm, well adjusted, and not prone to extreme emotional reactions [10].Additionally, those who are highly neurotic do not believe that emotions aremalleable, but rather difficult to control and strong in their expressions [35].As neurotic people do not consider emotions to be easily changed, they willnot benefit much from choosing the mood taxonomy, but more of choosingthe activity or genre taxonomies instead.
5.3 Study B
In Study B we looked into how the number of categories presented withina chosen music taxonomy influences the user experience (i.e., categorychoice satisfaction and difficulty, perceived system quality and usefulness),and how this effect is moderated by the participant’s music dimension ex-pertise (i.e., active engagement, emotion, and perceptual abilities). Theconditions (6- and 24-categories) of Study B are subsequent to Study A.That is, the data acquisition of Study B originates from the behavior af-ter participants picked a music taxonomy to continue their music browsing(Study A; Section 5.2)
In the following subsections we continue with hypotheses building, findings,and discussion.
76

5.3.1 Hypotheses
The overchoice effect has been extensively investigated (e.g., [6, 36, 42,71, 77]). Overchoice is not always bound to occur; the choice set needsto satisfy preconditions. We covered the choice set preconditions in Sec-tion 4. However, overchoice does not only depend on choice set char-acteristics, but the users’ characteristics play a role as well. A significantmoderator for overchoice is the expertise of the user [12, 13, 55, 60, 74].In line with findings showing expertise as a moderator for overchoice, wetherefore hypothesize that also in the context of this study, expertise playsa role. In order to measure expertise, we rely on the different dimensions(i.e., active engagement, emotion, and perceptual abilities) of the Gold-MSI(as discussed in Section 3.2). The active engagement dimension depictsgeneral music expertise (e.g., how much time and money one spends onmusic listening), while the dimensions emotion and perceptual abilities de-pict expertise related to the individual music taxonomies (mood and genretaxonomy respectively). For example, the emotion dimension is related tohow often someone might choose music that will send shivers down theirspine or how often music can evoke memories of past people and places,thereby mapping to the mood taxonomy. The perceptual ability dimensionis related to how well someone can compare two pieces of music or howwell someone can identify genres of music, thereby mapping to the genretaxonomy. As the active engagement dimension depicts general behavior,we believe that it has a positive effect in both the mood and genre musictaxonomy.
Furthermore, we do not only investigate the effects of overchoice on choicesatisfaction, but assess other parts of the user experience as well. Besidessatisfaction, we also include choice difficulty, perceived system quality, andperceived system usefulness. Unless otherwise specified, we will refer tothese factors as the user experience.
We hypothesize:
H1: The number of categories within any of the taxonomies will have apositive effect on the user experience for dimension experts in active en-gagement, but not for non-experts.
The dimensions emotion and perceptual abilities are more specifically ori-ented towards the mood and genre music taxonomy. Therefore we hypoth-esize:
H2: The number of categories within the mood taxonomy will have a posi-tive effect on the user experience for dimension experts in emotion, but not
77

for non-experts.
H3: The number of categories within the genre taxonomy will have a posi-tive effect on the user experience for dimension experts in perceptual abili-ties, but not for non-experts.
We do not hypothesize effects of overchoice within the activity taxonomybecause it depicts specific activities, and is unrelated to any kind of exper-tise or ambiguity. In other words, an activity that suits a situation is withinthe choices or not, regardless of the amount presented.
5.3.2 Findings
A multivariate analysis of variance (MANOVA) was conducted to test foruser experience (i.e., perceived system usefulness, perceived system qual-ity, choice difficulty, and choice satisfaction) differences between 6- and 24-categories. With the MANOVA we tested only for differences between thenumber of categories within each music taxonomy without controlling forexpertise. Table 6 and 7 show the categories that the participants chose,and the total distribution across the music taxonomies respectively. Resultsshow that for the mood, activity, and genre taxonomies, participants did notexperience any significant difference whether it was the smaller choice setor the bigger choice set that they were choosing from. User experiencefactors were not significantly different when choosing from a choice set of6- or 24-categories as well.
Mood # Activity # Genre #0 None 2 None 3 None 201 Energetic 8 Relaxing 0 Pop 162 Happy 6 Being creative 2 Rock 303 Soothing 5 Rainy day 0 Classical Rock 214 Mellow 10 Staying up all
night4 Indie Rock 11
5 Atmospheric 3 Road trip 0 Indie Pop 26 Hypnotic 2 Working/studying
without lyrics3 Easy Listening 7
Total 36 12 107
Table 6: Distribution of chosen categories within each taxonomy (6-categories condition).
78

Mood # Activity # Genre #0 None 0 None 0 None 51 Energetic 2 Relaxing 0 Pop 92 Happy 4 Being creative 0 Rock 93 Soothing 4 Rainy day 0 Classical Rock 84 Mellow 3 Staying up all
night0 Indie Rock 5
5 Atmospheric 1 Road trip 0 Indie Pop 26 Hypnotic 0 Working/studying
without lyrics0 Easy Listening 4
7 Introspective 1 Reading in acoffee shop
0 Classical 0
8 Warm 1 Singing in theshower
0 Blues/Rock 3
9 Motivational 1 Housework 2 Film scores 410 Funky 1 Working/studying
with lyrics0 Folk 5
11 Sad 1 Romanticevening
0 Dance 1
12 Celebratory 0 Gaming 0 R&B 613 Nocturnal 1 Energy boost 0 Classic Pop 414 Aggressive 0 Working out:
weight training0 Rap 6
15 Seductive 1 Unwinding af-ter work
0 Oldies 7
16 Gloomy 1 Working out:cardio
2 Electronica 7
17 Sweet 0 Beach party 0 Jazz 518 Classy 2 House party 0 Modern Rock 819 Sexual 3 Barbequing 0 Electronic Indie 220 Raw 1 Lying low on
the weekend0 Dance/House/Techno 2
21 Angsty 1 Sleeping 0 Singer-songwriter 122 Visceral 1 City cruising 0 Dance Pop 123 Spacey 2 Waking up on
the right sideof the bed
0 Funk 1
24 Trippy 0 Lying on abeach
0 Dubstep/Drum andBass
1
Total 32 4 106
Table 7: Distribution of chosen categories within each taxonomy (24-categories condition).
79

In order to investigate the effects of expertise, we conducted a moderatedmultiple regression (MMR) analysis. We used the dimensions of the Gold-MSI (i.e., active engagement, perceptual abilities, and emotions) to assessparticipants’ expertise level, and added these as a moderator to the analy-ses. This allowed us to investigate how expertise influences the overchoiceeffect and the user experience factors (i.e., perceived system usefulness,perceived system quality, choice difficulty, and choice satisfaction).
The analyses were conducted in two steps (the results of all steps can befound in Appendix D). In the first step we tested for main effects. This al-lowed us to see the general effects of expertise on the user experience fac-tors within each music taxonomy, regardless of the number of categories.The second step involved the moderators (i.e., emotion, perceptual abilities,and active engagement dimension expertise). By including the moderators,we were able to look at how expertise influences overchoice, and in turn theuser experience.
We separately discuss the significant findings of each music taxonomy onthe user experience factors (i.e., perceived system usefulness, perceivedsystem quality, choice difficulty, and choice satisfaction) below. In each ofthe following result sections, we first start with the significant main effects(i.e., the effect of expertise on the user experience without taking into ac-count the different number of categories). After that we continue with thesignificant moderator effects (i.e., the effect of expertise on overchoice andthe user experience).
Mood Taxonomy. When looking at the results of perceived system useful-ness, we found a significant main effect of emotion expertise (t(1, 63)=1.939,p=0.05; full results in Appendix D.1). This indicates that in general partic-ipants that are emotion experts found the system more useful than non-experts. For perceived system quality, we found a significant main effect ofactive engagement expertise (t(1, 63)= -2.379, p=0.02), as well as emotionexpertise (t(1, 63)=2.285, p=0.02; full results in Appendix D.2). This meansthat active engaged participants indicated that they perceived the system oflower quality while participations with emotion expertise rated the system ofhigher quality. Furthermore, we found a main effect on choice satisfactionof emotion expertise (t(1, 63) = 1.764, p=0.08), indicating that those whouse music for emotional activities are in general more satisfied with theircategory label choice.
80

Figure 5: Moderator effectof emotion (E) expertise onperceived system usefulness(higher means more useful) withinthe mood taxonomy.
Figure 6: Moderator effectof emotion (E) expertise onperceived system quality (highermeans higher quality) within themood taxonomy.
Figure 7: Moderator effectof emotion (E) expertise onchoice difficulty (higher meanseasier) within the mood taxonomy.
Figure 8: Moderator effect of ac-tive engagement (AE) expertiseon choice difficulty (higher meanseasier) within the mood taxonomy.
When looking at differences between the number of categories while con-trolling for the expertise dimensions, we found the following moderator ef-fects on the different factors of the user experience. For the perceived sys-tem usefulness, we found a significant moderator effect of emotion exper-tise (t(1, 63)=-2.147, p=0.03). The results of the moderator effect indicatethat emotion experts perceived the system as less useful when given morechoices, while non-emotion experts perceived the system as more usefulwhen given more choices (Figure 5). When looking at the perceived systemquality, we found a moderator effect of emotion expertise (t(1, 63)=-1.834,p=0.07), indicating that emotion experts perceived the system of less qual-ity when given more choices (Figure 6). Lastly, we identified moderatoreffects on choice difficulty by emotion expertise and active engagement ex-pertise (full results in Appendix D.3). Emotion experts show a decreasein choice difficulty when given less choices (t(1, 63)=-1.754, p=0.08; Fig-ure 7), whereas active engagement experts show a decrease of choicedifficulty when given more choices (t(1, 63)=2.385, p=0.02; Figure 8). Nosignificant effects were found on choice satisfaction.
81

Activity Taxonomy. As expected, no main or moderator effects were foundfor the categories within the activity taxonomy.
Genre Taxonomy. No main effects were found of the different expertisedimensions on the user experience. However, moderator effects were ob-served on the user experience factors when looking at the differences be-tween the number of categories. A significant moderator effect was foundon perceived system usefulness when controlling for perceptual abilities ex-pertise (t(1, 197)=2.260, p=0.02; full results in Appendix D.4). Participantswith expertise in perceptual abilities rated the system as more useful whengiven more choices. On the other hand, those with low perceptual abilitiesrated the system as more useful when given less choices (Figure 9). Forperceived system quality, we found a moderator effect of perceptual abilitiesexpertise (t(1, 197)=1.838, p=0.06; full results in Appendix D.5). The resultsshow that perceptual experts rated the system of higher quality when givenmore choices, while it hardly made a difference for non-experts (Figure 10).No significant effects were found on choice satisfaction or choice difficultyby expertise in perceptual abilities, nor did we find any effects on the userexperience factors by active engagement.
Figure 9: Moderator effect ofperceptual abilities (PA) expertiseon perceived system usefulness(higher means more useful) withinthe genre taxonomy.
Figure 10: Moderator effect of per-ceptual abilities (PA) expertise onperceived system quality (highermeans higher quality) within thegenre taxonomy.
5.3.3 Discussion
Our results show that expertise plays a role in whether overchoice occursor not. With regards to H1, we only found partial support. We hypothe-sized that general music expertise (active engagement), would play a rolein whether overchoice occurs. However, we only found an overchoice effectin the mood taxonomy on choice difficulty. Those who were more expertindicated to find it more difficult to choose a category when they were givenless choice, whereas non-experts indicated to experience more difficulties
82

when given more choice. As this was the only effect found, the effect ofexpertise seem to be very specific, and cannot take any general form.
Remarkable is the effect of emotion expertise within the mood taxonomy.Here, the emotion expertise seem to adopt an opposite effect of overchoice.Therefore, we need to reject our hypothesis (H2). Instead of an increase inthe user experience factors when given more choice, emotion experts showa decrease. In other words, they perceived the system as more useful andof higher quality, and indicated to have less difficulties to pick a category,when provided less choice than when given more choice. Whereas, non-experts indicated the opposite effect and were experiencing a higher userexperience when given more choices. A possible explanation for this couldbe that emotional experts are in general more emotionally aroused andtherefore prefer less choice because it takes less cognitive effort. This is inline with findings that show that emotional arousal can have an adverse ef-fect on decision making because of reduced cognitive processing [22, 56].In other words, information processing decreases as a result of emotionalarousal. Making a choice from a bigger choice set would then take moreeffort to assess every option. Also, especially for those who rely more onthe emotional triggers of music, making a bad choice will have bigger con-sequences than making a good choice [3]. Hence, as the choice sets withineach music taxonomy were designed to be most attractive, choice difficultywithin the mood taxonomy is exacerbated for the more experienced ones.
The effect of expertise in the genre taxonomy is partially in line with ourhypothesis (H3). Prior research suggests that expertise is a moderatorfor overchoice [12, 13, 55, 60, 74]. Those who indicated to be expertsin perceptual abilities rated the system of higher quality, and more useful,when more choices were provided.
Striking is that we did not observe a clear overchoice effect on the choicethat was made (i.e., choice difficulty and choice satisfaction), but only onthe evaluation of the system (i.e., perceived system usefulness and per-ceived system quality). Evaluating the necessary preconditions for over-choice to occur state that the user needs to have a lack of familiarity withthe items, and should not have a clear prior preference for an item [41].However, not meeting these preconditions should lead to preferring morechoice [12, 13], whereas our results show no differences. Others argue thatoverchoice can only occur when all options are attractive. So, there shouldbe no dominant option and the proportion of non-dominant options shouldbe large [18, 19, 38, 68]. Otherwise, making a decision would be easy, re-gardless of the size of the choice set. In this study, we tried to control forthat by creating choice sets with the most attractive items (see the prelimi-nary study in Section 4). Also, by looking at the distribution of the choicesmade by the participants (see Table 6 and 7), there is no category that ex-
83

cessively stands out of being chosen. The most plausible explanation forwhy we did not observe the hypothesized effects comes from Hutchinson[40]. He argued that overchoice seldom occurs among animals, becausethey seem to have adapted to the different sizes of choice sets that naturallyoccur in their environment. Although this hypothesis has not been verifiedon humans so far, it would explain best why the overchoice effect on thechoices made (i.e., choice difficulty and choice satisfaction) was not foundin our study. The sizes of the choice sets we used are not uncommon formusic streaming services. We picked the size of our largest choice set (24categories) to be in line with the original work of overchoice by Iyengar andLepper [41]. However, this was just a subset of what would be presented toactual users of such a service. It could be that our participants are accus-tomed to the sizes of the choice sets we presented, as normally they wouldneed to deal with even larger choice sets.
Although we did not experience the overchoice effect on the category items,it does not mean that our choice sets did not have any effects. We didfind effects on the factors evaluating the system (i.e., perceived systemusefulness and perceived system quality). These are important factors thathelp to form users’ general perspective of the system as a whole.
5.4 Implications
The results of these studies support the creation of personalized user in-terfaces by taking into account the user’s personality and expertise (a pro-posed user model can be found in Figure 11). With applications gettingmore and more connected and sharing resources (e.g., applications con-nect with social networking sites, such as, Facebook, Twitter, or Instagram),the automatic extraction of personality and expertise becomes more avail-able. A possible scenario could be:
A user has the music application connected to his Facebook account. Basedon his Facebook profile, the application inferred that he is someone open tonew experiences. Therefore, the music application adjusts the user inter-face by emphasizing the mood taxonomy to let the user continue browsingfor music. By analyzing his profile (e.g., he filled in artists and bands thathe likes) and postings (e.g., posting often that he goes to concerts), thesystem may infer that he is actively engaged with music. Based on this, thesystem decides to provide him more categories to choose from within themood taxonomy.
84

Figure 11: Proposed user model. Personality traits: (O)pennessto experience, (C)onscientiousness, (E)xtraversion, (A)greeableness,(N)euroticism. Music expertise dimensions: active engagement (AE), per-ceptual abilities (PA), emotions (E).
In the last couple of years, it has been demonstrated that personality in-formation can be extracted from social networking sites (SNSs) like Face-book (e.g., [2, 29, 33, 64, 72]), Twitter (e.g., [32, 66]), and Instagram (e.g., [28,30]). Their findings show that SNSs offer reliable cues to infer different per-sonality traits. Being able to extract personality traits from SNSs caters thepossibility for (music) applications to adjust their user interface based onour results. For example, when someone appears to be open to new expe-riences, the mood taxonomy could be emphasized while other taxonomiescould be placed more in the background of the interface. In addition, mu-sic recommendations could be given based on the mood taxonomy (e.g.,music with similar mood expression).
We believe that also the expertise dimensions (i.e., active engagement,perceptual abilities, and emotions) that we used in Study B, can be in-ferred from the same increased connectedness with SNSs. For example,active engagement can be inferred by extracting information on concertattendance (e.g., Facebook events, SongKick; http://www.songkick.com)as well as purchase behavior (e.g., iTunes store, Amazon; http://www.amazon.com). The “About" section, or the posted activities and status up-dates in SNSs can provide cues to infer perceptual abilities. Analyzingpostings of a SNS user could give an indication about the emotion exper-tise dimension (e.g., postings about induced feelings when listening to asong). Also, there seems to be some relationship between factors of theemotion expertise dimension and the openness to experience personalityfactor. This could serve as an additional indicator. Music applications could
85

anticipate the choice set based on the expertise dimension of the user.
6 Limitations & Future work
There are several limitations in this study that should be addressed in fu-ture work. Our sample focused only on participants situated in the UnitedStates. It is possible that cultural differences play a role in taxonomy usageand category preferences. Future work should address this.
We tested the relationship between personality traits and independent mu-sic taxonomies (i.e., mood, activity, and genre). One of our results show arelationship between neuroticism and the activity and genre taxonomy.Onthe other hand, it could well be that people prefer combinations of differenttaxonomies (e.g., sad pop music, funky road trip music, or happy cookingmusic).
In the studies we conducted, we intentionally did not include real music rec-ommendations as we believed this could interfere with rightfully answeringour research questions. Since this study only simulated the decision mak-ing stage of using a music streaming service and did not play any actualmusic, it may have limiting effects on the holistic user experience.
7 Conclusion
The goal of this work was to investigate whether music browsing strate-gies are related to personality traits, by looking at the decision making ofpicking a music taxonomy (mood, activity, or genre) to browse for music.Additionally, we looked at the occurrence of overchoice with the number ofcategories within the music taxonomies, and how this effect is moderatedby expertise.
We found that users’ choice of a taxonomy (mood, activity, or genre) tobrowse for music, is related to their personality. Furthermore, our results,show that overchoice is moderated by expertise. We found that the effectsof overchoice is counteracted by expertise in the genre taxonomy. However,having more expertise/experience does not always make choosing easier.In our case, emotion experts (e.g., those who easily identify with emotionsin music) had more difficulties making a decision with an increased choiceset. Although expertise may take the role as a proxy measure for cogni-tive processing, by assuming that expertise and experience with the topicmakes processing information about the topic easier, this does not always
86

seem true. It seems that in some cases, expertise or more experience cancreate adverse effects.
Finally, while the majority of prior research focuses on the influence of over-choice on choice satisfaction and/or choice difficulty, we show with our re-sults that overchoice does not necessarily limit its influence to these twofactors. Our results show that even when choice satisfaction or difficultyare not affected by the overchoice effect, it may still influence other as-pects of the user experience (e.g., system usefulness, and system quality).These other factors of the user experience should not be neglected, andcould play an important role in the recurring use of the system by users.
8 Acknowledgements
This research is supported by the Austrian Science Fund (FWF): P25655;and by the EU FP7/2013-2016 through the PHENICX project under grantagreement no.601166.
87

Appendix A - Categories
Music categories extracted from Songza (http://www.songza.com)
Nr Mood Activity Genre1 Visceral Housework Blues & Blues Rock2 Mellow Drinking at a Dive Bart Bluegrass3 Celebratory Hanging Out in the Man
CaveChildren’s
4 Warm Road Trip Christian5 Motivational Skateboarding Christian: Gospel6 Angsty Working/Studying
(without lyrics)Christmas
7 Trashy Getting High Classical8 Seductive Going for a Bike Ride Classical: Crossover9 Hypnotic Unwinding After Work Classical: Vocal10 Rowdy Staying up all Night Country11 Aggressive Dance Party: Beach Country: Contemporary
Country12 Sweet Singing in the Shower Dance13 Soothing Energy Boost Dance: Disco & Nu Disco14 Introspective Slow Dancing Dance: House & Techno15 Raw Sitting on a Back Porch Dancehall16 Gloomy Reading in a Coffee
ShopDubstep & Drum ’n Bass
17 Atmospheric Working Out: Cardio Easy Listening18 Nocturnal Breaking Up Electronica19 Cold Making Out Film Scores20 Spacey Dinner Party: Formal Folk21 Earthy Workout Cool Down Funk22 Lush Getting Lucky Hawaiian23 Sexual Driving in the Left Lane Indie: Indie Electronic24 Classy Working Out: Weight
TrainingIndie: Indie Folk & Ameri-cana
25 Trippy Lying on a Beach Indie: Indie Pop26 Energetic House Party Indie: Indie Rock27 Sprightly Barbecuing International/World28 Funky Cocktail Party International: African29 Campy Romantic Evening International: Asian30 Happy Rainy Day International: Brazilian31 Sad Waking Up on the Right
Side of the BedInternational: Jamaican
32 Cocky Working/Studying (withlyrics)
International: Mediter-ranean
88

33 Dance Party: Sweaty Jazz34 Lounging in a Cool Ho-
telJazz: Vocal Jazz
35 Lying Low on the Week-end
Latin
36 Yoga Latin: Cuban37 Pleasing Crowd Latin: Puerto Rican38 Coding Latin: Salsa39 Pool Party Latin: Tropical40 Sleeping Nature Sounds & Sound-
scapes41 Dinner Party: Casual Oldies42 Gaming Pop43 Relaxing Pop: Classic Pop44 City Cruising Pop: Dance Pop45 Coming Down After a
PartyPop: Soft Pop
46 Stripping R&B47 Shopping at a Vintage
StoreR&B: Classic R&B
48 Ballroom Dancing R&B: Contemporary R&B49 Dirt Road Driving R&B: Soul50 Walking Through a City Rap51 Dance Party: Fun &
FunkyRap: Classic MainstreamRap
52 Being Creative Rap: Old School Rap53 Cooking with Friends Rap: Today’s Mainstream
Rap54 Girls Night Out Rap: Underground & Al-
ternative Rap55 Getting Married Reggae & Ska56 Grinding at a Nightclub Reggaeton57 Rock58 Rock: Classic Alternative
& Punk59 Rock: Contemporary Al-
ternative60 Rock: Emo/Pop-Punk61 Rock: Hard Rock62 Rock: Metal63 Rock: Modern Rock64 Rock: Rockabilly65 Singer-Songwriter66 Showtunes
89

Appendix B - User Experience
Below the questions depicting the user experience (adapted from [52]).
B.1 Choice Satisfaction
5-point Likert scale: disagree strongly - agree strongly.
Nr Question1 I don’t like the item I chose (negated).2 I am enthusiastic about the item I chose.
B.2 Perceived Choice Difficulty
5-point Likert scale: very difficult - very easy.
Nr Question1 How difficult was it to choose an item from the list?
B.3 Perceived System Usefulness
5-point Likert scale: disagree strongly - agree strongly.
Nr Question1 With this way of finding music, I can make better choices.2 I don’t find this way of finding music useful (negated).3 I would use this way of finding music more often if it was possible.
90

B.4 Perceived System Quality
5-point Likert scale: disagree strongly - agree strongly.
Nr Question1 I found good items in the list.2 The list did not consist any of my preferred items (negated).
Appendix C - Music sophistication
Below the questions belonging to corresponding parts of the Gold-MSI (5-point Likert scale: disagree strongly - agree strongly. Adopted from [61]).
C.1 Music Emotions
Nr Question1 I sometimes choose music that can trigger shivers down my spine.2 Pieces of music rarely evoke emotions for me.3 I often pick certain music to motivate or excite me.4 Music can evoke my memories of past people and places.
C.2 Active Engagement
Nr Question1 I spend a lot of my free time doing music-related activities.2 I often read or search the Internet for things related to music.3 I don’t spend much of my disposable income on music.4 Music is kind of an addiction for me - I couldn’t live without it.5 I keep track of new music that I come across (e.g., new artists or
recordings).
91

C.3 Perceptual Abilities
Nr Question1 I am able to judge whether someone is a good singer or not.2 I find it difficult to spot mistakes in a performance of a song even if I
know the tune.3 I can tell when people sing or play out of time with the beat.4 I can tell when people sing or play out of tune.5 When I hear a music I can usually identify its genre.
Appendix D - Results
Below the results of the moderated multiple regression for the mood andgenre taxonomy. Step 1 depicts the analyses for the main effects (i.e., gen-eral effect of expertise on the user experience without taking into accountthe different number of categories), and Step 2 depicts the moderator ef-fects (i.e., the effects of expertise on the overchoice effect and the userexperience)
D.1 Mood Taxonomy & Perceived System Usefulness
b SE b βStep 1 Constant 3.404 0.529 ***
6- or 24-item 0.096 0.172 0.071Active engagement -0.112 0.127 -0.162Emotions 0.297 0.153 0.340ˆPerceptual abilities -0.059 0.127 -0.074
Step 2 Constant 2.144 0.755 **6- or 24-item 2.446 1.036 1.807*Active engagement -0.28 0.174 -0.404Emotions 0.7 0.241 0.802**Perceptual abilities -0.036 0.152 -0.045Item x Active engagement 0.366 0.258 1.016Item x Emotions -0.657 0.306 -2.138*Item x Perceptual abilities -0.203 0.271 -0.606
Note. R2=0.063 for step 1, R2=0.160 for step 2. ˆp<0.1, *p<.05, **p<.01,***p<.001.
92

D.2 Mood Taxonomy & Perceived System Quality
b SE b βStep 1 Constant 3.404 0.61 ***
6- or 24-item 0.191 0.198 0.119Active engagement -0.347 0.146 -0.422*Emotions 0.403 0.176 0.390*Perceptual abilities -0.001 0.147 -0.001
Step 2 Constant 1.864 0.874 *6- or 24-item 2.903 1.198 1.808Active engagement -0.396 0.201 -0.482Emotions 0.804 0.278 0.777Perceptual abilities -0.008 0.176 -0.008Item x Active engagement 0.092 0.299 0.214Item x Emotions -0.65 0.354 -1.782ˆItem x Perceptual abilities -0.06 0.313 -0.152
Note. R2=0.116 for step 1, R2=0.200 for step 2. ˆp<0.1, *p<.05, **p<.01,***p<.001.
D.3 Mood Taxonomy & Choice Difficulty
b SE b βStep 1 Constant 4.906 0.634 ***
6- or 24-item -0.096 0.205 -0.060Active engagement 0.025 0.152 -0.067Emotions -0.069 0.183 -0.067Perceptual abilities -0.114 0.153 -0.121
Step 2 Constant 3.967 0.900 ***6- or 24-item 1.925 1.234 1.212Active engagement -0.293 0.208 -0.360Emotions 0.320 0.287 0.313Perceptual abilities -0.027 0.182 -0.029Item x Active engagement 0.734 0.308 1.735Item x Emotions -0.640 0.365 -1.775ˆItem x Perceptual abilities -0.462 0.323 -1.178*
Note. R2=0.024 for step 1, R2=0.133 for step 2. ˆp<0.1, *p<.05, **p<.01,***p<.001.
93

D.4 Genre Taxonomy & Perceived System Usefulness
b SE b βStep 1 Constant 3.45 0.499 ***
6- or 24-item 0.327 0.134 0.174*Active engagement -0.056 0.094 -0.054Emotions 0.043 0.12 0.031Perceptual abilities 0.068 0.119 0.047
Step 2 Constant 4.148 0.717 ***6- or 24-item -0.863 0.975 -0.458Active engagement -0.037 0.136 -0.036Emotions 0.158 0.164 0.115Perceptual abilities -0.242 0.182 -0.168Item x Active engagement -0.004 0.188 -0.007Item x Emotions -0.232 0.239 -0.511Item x Perceptual abilities 0.54 0.239 1.172*
Note. R2=0.032 for step 1, R2=0.060 for step 2. ˆp<0.1, *p<.05, **p<.01,***p<.001.
D.5 Genre Taxonomy & Perceived System Quality
b SE b βStep 1 Constant 3.313 0.631 ***
6- or 24-item 0.595 0.17 0.246Active engagement -0.039 0.119 -0.029Emotions 0.027 0.152 0.015Perceptual abilities 0.049 0.15 0.027
Step 2 Constant 3.933 0.913 ***6- or 24-item -0.468 1.242 -0.194Active engagement 0.073 0.173 0.054Emotions 0.1 0.209 0.056Perceptual abilities -0.276 0.232 -0.149Item x Active engagement -0.18 0.239 -0.271Item x Emotions -0.135 0.304 -0.232Item x Perceptual abilities 0.56 0.305 0.945ˆ
Note. R2=0.060 for step 1, R2=0.077 for step 2. ˆp<0.1., *p<.05,**p<.01, ***p<.001.
94

References
[1] Arnold SJ, Oum TH, Tigert DJ (1983) Determinant attributes in retailpatronage: seasonal, temporal, regional, and international compar-isons. Journal of Marketing Research pp 149–157
[2] Back MD, Stopfer JM, Vazire S, Gaddis S, Schmukle SC, Egloff B,Gosling SD (2010) Facebook profiles reflect actual personality, notself-idealization. Psychological science
[3] Baumeister RF, Vohs KD, DeWall CN, Zhang L (2007) How emo-tion shapes behavior: Feedback, anticipation, and reflection, ratherthan direct causation. Personality and Social Psychology Review11(2):167–203
[4] Bertin-Mahieux T, Eck D, Mandel M (2011) Automatic tagging of au-dio: The state-of-the-art. Machine audition: Principles, algorithms andsystems pp 334–352
[5] Boatwright P, Nunes JC (2001) Reducing assortment: An attribute-based approach. Journal of marketing 65(3):50–63
[6] Bollen D, Knijnenburg BP, Willemsen MC, Graus M (2010) Under-standing choice overload in recommender systems. In: RecSys, ACM,pp 63–70
[7] Borle S, Boatwright P, Kadane JB, Nunes JC, Galit S (2005) The ef-fect of product assortment changes on customer retention. Marketingscience 24(4):616–622
[8] Bown NJ, Read D, Summers B (2003) The lure of choice. Journal ofBehavioral Decision Making 16(4):297–308
[9] Bravo MJ, Farid H (2006) Object recognition in dense clutter. Percep-tion & psychophysics 68(6):911–918
[10] Burger J (2010) Personality. PSY 235 Theories of Personality Se-ries, Cengage Learning, URL http://books.google.at/books?id=bZY7I2\_8yRMC
[11] Buss AH (1980) Self-consciousness and social anxiety. Freeman
[12] Chernev A (2003) Product assortment and individual decision pro-cesses. Journal of Personality and Social Psychology 85(1):151
[13] Chernev A (2003) When more is less and less is more: The role ofideal point availability and assortment in consumer choice. Journal ofconsumer Research 30(2):170–183
95

[14] Chia PH, Yamamoto Y, Asokan N (2012) Is this app safe?: a largescale study on application permissions and risk signals. In: WWW,ACM
[15] Costa PT, McCrae RR (1992) Neo pi-r professional manual
[16] Craig CS, Ghosh A, McLafferty S (1984) Models of the retail locationprocess-a review. journal of retailing 60(1):5–36
[17] Dhar R (1996) The effect of decision strategy on deciding to deferchoice. Journal of Behavioral Decision Making 9(4):265–281
[18] Dhar R (1997) Consumer preference for a no-choice option. Journalof Consumer Research 24(2):215–231
[19] Dhar R, Nowlis SM (1999) The effect of time pressure on consumerchoice deferral. Journal of Consumer Research 25(4):369–384
[20] Diehl K, Poynor C (2010) Great expectations?! assortmentsize, expectations, and satisfaction. Journal of Marketing Research47(2):312–322
[21] Dreze X, Hoch SJ, Purk ME (1995) Shelf management and spaceelasticity. Journal of Retailing 70(4):301–326
[22] Easterbrook JA (1959) The effect of emotion on cue utilization and theorganization of behavior. Psychological review 66(3):183
[23] Elahi M, Braunhofer M, Ricci F, Tkalcic M (2013) Personality-basedactive learning for collaborative filtering recommender systems. In: AI*IA 2013: Advances in Artificial Intelligence, Springer, pp 360–371
[24] Fasolo B, Hertwig R, Huber M, Ludwig M (2009) Size, entropy, anddensity: What is the difference that makes the difference betweensmall and large real-world assortments? Psychology & Marketing26(3):254–279
[25] Ferwerda B (2015) The soundtrack of my life: Adjusting emotion of mu-sic. In: Proceedings of the 1st Workshop Collaborating with IntelligentMachines, Seoul, South Korea
[26] Ferwerda B, Schedl M (2014) Enhancing music recommender sys-tems with personality information and emotional states: A proposal.In: Proceedings of the 2nd Workshop Emotions and Personality inPersonalized Services (EMPIRE 2014), Aalborg, Denmark, pp 1613–0073
[27] Ferwerda B, Schedl M, Tkalcic M (2015) Personality & emotionalstates: Understanding usersâAZ music listening needs. UMAP
96

[28] Ferwerda B, Schedl M, Tkalcic M (2015) Predicting personality traitswith instagram pictures. In: Proceedings of the 3rd Workshop on Emo-tions and Personality in Personalized Systems 2015, ACM, New York,NY, USA, EMPIRE ’15, pp 7–10, DOI 10.1145/2809643.2809644, URLhttp://doi.acm.org/10.1145/2809643.2809644
[29] Ferwerda B, Schedl M, Tkalcic M (2016) Personality traits and the rela-tionship with (non-)disclosure behavior on facebook. In: Proceedingsof the International Workshop on Modeling Social Media, ACM
[30] Ferwerda B, Schedl M, Tkalcic M (2016) Using instagram picturefeatures to predict usersâAZ personality. In: MultiMedia Modeling,Springer, pp 850–861
[31] Fu Z, Lu G, Ting KM, Zhang D (2011) A survey of audio-based mu-sic classification and annotation. Multimedia, IEEE Transactions on pp303–319
[32] Golbeck J, Robles C, Edmondson M, Turner K (2011) Predicting per-sonality from twitter. In: Privacy, security, risk and trust (passat), 2011ieee third international conference on and 2011 ieee third internationalconference on social computing (socialcom), IEEE, pp 149–156
[33] Gosling SD, Gaddis S, Vazire S, et al (2007) Personality impressionsbased on facebook profiles. ICWSM 7:1–4
[34] Gourville JT, Soman D (2005) Overchoice and assortment type: Whenand why variety backfires. Marketing science 24(3):382–395
[35] Gross JJ, John OP (1998) Mapping the domain of expressivity: multi-method evidence for a hierarchical model. Journal of personality andsocial psychology p 170
[36] Haynes GA (2009) Testing the boundaries of the choice overload phe-nomenon: The effect of number of options and time pressure on deci-sion difficulty and satisfaction. Psychology & Marketing 26(3):204–212
[37] Herpen Ev, Diehl K, Poynor C (2008) Arranged to distraction: howcategorizing products with complements versus substitutes alters theexperience of product choice. Advance of Consumer Resarch 35:80–83
[38] Hsee CK, Leclerc F (1998) Will products look more attractive whenpresented separately or together? Journal of Consumer Research25(2):175–186
[39] Hu R, Pu P (2009) Acceptance issues of personality-based recom-mender systems. In: RecSys, ACM, pp 221–224
97

[40] Hutchinson J (2005) Is more choice always desirable? evidence andarguments from leks, food selection, and environmental enrichment.Biological Reviews 80(1):73–92
[41] Iyengar SS, Lepper MR (2000) When choice is demotivating: Can onedesire too much of a good thing? Journal of personality and socialpsychology 79(6):995
[42] Iyengar SS, Huberman G, Jiang W (2004) How much choice is toomuch? contributions to 401 (k) retirement plans. Pension design andstructure: New lessons from behavioral finance pp 83–95
[43] Iyengar SS, Wells RE, Schwartz B (2006) Doing better but feelingworse looking for the âAIJbestâAI job undermines satisfaction. Psy-chological Science 17(2):143–150
[44] Janiszewski C (1998) The influence of display characteristics on vi-sual exploratory search behavior. Journal of Consumer Research25(3):290–301
[45] John OP, Donahue EM, Kentle RL (1991) The big five inventory: Ver-sions 4a and 54, institute of personality and social research. Universityof California, Berkeley, CA
[46] Jung C (1976) Psychological Types. No. v. 6 in Bollingen Series No.20, Princeton University Press
[47] Jung CG (1923) Psychological types. New York Retrieved September15, 2014, from http://psychclassics.yorku.ca/Jung/types.htm
[48] Kahn BE (1995) Consumer variety-seeking among goods and ser-vices: An integrative review. Journal of Retailing and Consumer Ser-vices 2(3):139–148
[49] Kahn BE, Wansink B (2004) The influence of assortment structure onperceived variety and consumption quantities. Journal of ConsumerResearch 30(4):519–533
[50] Kemp AE (1996) The musical temperament: Psychology and person-ality of musicians. Oxford University Press
[51] Kittur A, Chi EH, Suh B (2008) Crowdsourcing user studies with me-chanical turk. In: Proceedings of the SIGCHI conference on humanfactors in computing systems, ACM, pp 453–456
[52] Knijnenburg BP, Willemsen MC, Gantner Z, Soncu H, Newell C (2012)Explaining the user experience of recommender systems. User Mod-eling and User-Adapted Interaction 22(4-5):441–504
98

[53] Knoll N, Burkert S, Schwarzer R (2006) Reciprocal support provi-sion: Personality as a moderator? European journal of personality20(3):217–236
[54] Koelemeijer K, Oppewal H (1999) Assessing the effects of assortmentand ambience: a choice experimental approach. Journal of Retailing75(3):319–345
[55] Langner T, Krengel M (2013) The mere categorization effect for com-plex products: The moderating role of expertise and affect. Journal ofBusiness Research 66(7):924–932
[56] Leith KP, Baumeister RF (1996) Why do bad moods increase self-defeating behavior? emotion, risk tasking, and self-regulation. Journalof personality and social psychology 71(6):1250
[57] Lonsdale AJ, North AC (2011) Why do we listen to music? a uses andgratifications analysis. British Journal of Psychology 102(1):108–134
[58] Mazursky D, Jacoby J (1986) Exploring the development of store im-ages. Journal of Retailing 62(2):145–165
[59] McCrae RR, John OP (1992) An introduction to the five-factor modeland its applications. Journal of personality 60(2):175–215
[60] Mogilner C, Rudnick T, Iyengar SS (2008) The mere categorizationeffect: How the presence of categories increases choosersâAZ per-ceptions of assortment variety and outcome satisfaction. Journal ofConsumer Research 35(2):202–215
[61] Müllensiefen D, Gingras B, Musil J, Stewart L (2014) The musicalityof non-musicians: an index for assessing musical sophistication in thegeneral population. PloS one 9(2):e89,642
[62] Oppewal H, Koelemeijer K (2005) More choice is better: Effects of as-sortment size and composition on assortment evaluation. InternationalJournal of Research in Marketing 22(1):45–60
[63] Ozer DJ, Benet-Martinez V (2006) Personality and the prediction ofconsequential outcomes. Annu Rev Psychol 57:401–421
[64] Park G, Schwartz HA, Eichstaedt JC, Kern ML, Kosinski M, StillwellDJ, Ungar LH, Seligman ME (2014) Automatic personality assessmentthrough social media language.
[65] Perruchet P, Rey A, Hivert E, Paction S (2006) Do distractors interferewith memory for study pairs in associative recognition? Memory &cognition
99
[66] Quercia D, Kosinski M, Stillwell D, Crowcroft J (2011) Our twitter pro-files, our selves: Predicting personality with twitter. In: Privacy, secu-rity, risk and trust (passat), 2011 ieee third international conferenceon and 2011 ieee third international conference on social computing(socialcom), IEEE, pp 180–185
[67] Rawlings D, Ciancarelli V (1997) Music preference and the five-factor model of the neo personality inventory. Psychology of Music25(2):120–132
[68] Redelmeier DA, Shafir E (1995) Medical decision making in situationsthat offer multiple alternatives. Jama 273(4):302–305
[69] Rentfrow PJ, Gosling SD (2003) The do re mi’s of everyday life: thestructure and personality correlates of music preferences. Journal ofpersonality and social psychology 84(6):1236
[70] Rentfrow PJ, Goldberg LR, Zilca R (2011) Listening, watching, andreading: The structure and correlates of entertainment preferences.Journal of personality 79(2):223–258
[71] Reutskaja E, Hogarth RM (2009) Satisfaction in choice as a function ofthe number of alternatives: When âAIJgoods satiateâAI. Psychology& Marketing 26(3):197–203
[72] Ross C, Orr ES, Sisic M, Arseneault JM, Simmering MG, Orr RR(2009) Personality and motivations associated with facebook use.Computers in Human Behavior 25(2):578–586
[73] Scheibehenne B, Greifeneder R, Todd PM (2009) What moderates thetoo-much-choice effect? Psychology & Marketing 26(3):229–253
[74] Scheibehenne B, Greifeneder R, Todd PM (2010) Can there ever betoo many options? a meta-analytic review of choice overload. Journalof Consumer Research 37(3):409–425
[75] Schwartz B (2004) The paradox of choice. Ecco New York
[76] Schwartz B (2004) The tyranny of choice. SCIENTIFIC AMERICAN-AMERICAN EDITION- 290(4):70–75
[77] Shah AM, Wolford G (2007) Buying behavior as a function of paramet-ric variation of number of choices. Psychological Science 18(5):369–370
[78] Shiota MN, Keltner D, John OP (2006) Positive emotion dispositionsdifferentially associated with big five personality and attachment style.The Journal of Positive Psychology 1(2):61–71
100
[79] Sloot LM, Fok D, Verhoef PC (2006) The short-and long-term impactof an assortment reduction on category sales. Journal of MarketingResearch 43(4):536–548
[80] Tkalcic M, Kunaver M, Tasic J, Košir A (2009) Personality baseduser similarity measure for a collaborative recommender system. In:Proceedings of the 5th Workshop on Emotion in Human-ComputerInteraction-Real world challenges, pp 30–37
[81] Tkalcic M, Kunaver M, Košir A, Tasic J (2011) Addressing the new userproblem with a personality based user similarity measure. In: FirstInternational Workshop on DEMRA 2011, p 106
[82] Tkalcic M, Ferwerda B, Hauger D, Schedl M (2015) Personality Corre-lates for Digital Concert Program Notes. UMAP pp 1–6
[83] Watson D, Clark LA (1997) Extraversion and its positive emotionalcore.
101

Personality Correlates for Digital ConcertProgram Notes
Published in: Proceedings of the 23rd Conference on User Modeling, Adaptation, andPersonalization (UMAP 2015; Dublin, IE)
MARKO TKALCIC, Johannes Kepler University, Linz (AT)BRUCE FERWERDA, Johannes Kepler University, Linz (AT)DAVID HAUGER, Johannes Kepler University, Linz (AT)MARKUS SCHEDL, Johannes Kepler University, Linz (AT)
Abstract
In classical music concerts, the concert program notes are distributedto the audience in order to provide background information on thecomposer, piece and performer. So far, these have been printed doc-uments composed mostly of text. With some delay, mobile devices aremaking their way also in the world of classical concerts, hence offer-ing additional options for digital program notes comprising not only textbut also images, video and audio. Furthermore, these digital programnotes can be personalized. In this paper, we present the results of auser study that relates personal characteristics (personality and back-ground musical knowledge) to preferences for digital program notes.
Keywords: Classical Music, Digital Program Notes, Personality
1 Introduction
Classical music has long resisted the temptation of introducing new de-vices, such as smartphones or tablets into the live concert experiences.However, things started to change recently. Two efforts are being madein this direction, one within the FP7 Phenicx project1 and the other by thePhiladelphia Orchestra2, both of them developing a mobile application forsupporting the live classical concert experience. Both of these applicationsfeature the program notes in a digital form. Within the Phenicx project weare developing a system that would support personalized digital programnotes based on the user profile. The personalization is going to be done ofthe level of the preferred multimedia type in the notes (music, text or audio)and its length. In order to develop the personalization method we first need
1http://phenicx.upf.edu/2https://www.philorch.org/introducing-livenote%E2%84%A2-nights#/
102

to identify the relationships between the users’ personal characteristics (interms of personality and musical background) and the preferences for thesupporting multimedia material in the digital program notes. In this paper,we present the results of a user study that was carried out in order to iden-tify these relationships. To be more concrete, we addressed the followingresearch questions
1. Do the user’s preferences for the digital program notes correlate withthe user’s personality
2. Do the user’s preferences for the digital program notes correlate withthe user’s musical background
2 Related work
Personality and learning styles. The purpose of the program notes is toprovide additional information about the concert in terms of the historicalbackground on the piece, the composer and the performer. Similar educa-tional processes, outside the classical music live experience domain, havebeen investigated in terms of personalization. Research based on learn-ing styles, as a subset of personality, has been done [6] and models forpersonalizing course materials have been proposed [3].
Personality and user preferences. Personality has been gaining popular-ity in research on personalized services. It has been used to alleviate thecold-start problem in recommender systems [4, 15]. Research has beencarried out to understand how personality relates to user preferences inmultiple domains [1]. Special attention has been given to music, wherestrong relations have been found (i) between personality and genre pref-erences [14] (ii) between personality and the way people use music (e.g.rationally versus for mood regulation [2]) and (iii) between personality andthe way users organize music [5]. However, to the best of our knowledge,there has been no research done on the relations between classical musicand personality, except for the aforementioned genre preferences.
Implicit acquisition of personality. For a long time, the only way of as-sessing the user personality has been through extensive questionnaires,such as the Big-Five Inventory (BFI) [9]. There has been an increasing in-terest for detecting unobtrusively the user personality from various sources.Related work has been done especially on using social media (e.g. face-book or twitter) to infer the personality in the Five Factor Model (FFM) per-sonality space [7, 13, 10]. These methods can be useful in scenarios whena user logs in an online system with her/his social media account.
103

3 Usage Scenario
Within the Phenicx project, we are developing technologies for improvingthe classical concert experience. One of the use cases we focus on is thedigital program notes scenario, where automatically generated, tailor-mademultimedia editorials are offered to prospective audience members, intro-ducing the concert that will take place with the purpose of informing, edu-cating and pre-engaging users, supporting concert anticipation [11]. Theconcrete scenario we foresee is a user (the attendee of a classical concert)having a mobile device (e.g. a smartphone or a tablet device) with a mobileapplication that supports the scenario. The user logs in the application withher/his social media account (e.g. twitter or facebook). Using some of theaforementioned methods for inferring the user’s personality from the socialmedia stream, the application can use this information to tailor the digitalprogram notes to the user’s needs. The strategy for personalizing the dig-ital program notes is going to be based on the outcomes of the study wepresent in this paper.
4 Materials and Methods
We conducted a user study to collect the data needed. We gathered theparticipants through Amazon Mechanical Turk. In total we had 165 partic-ipants aged from 20 to 76 (mean 37, stdev 11), 93 females and 72 males.The participants first filled in a set of background questionnaires: a ques-tionnaire about their musical background, a questionnaire about their mu-sical preferences in general (according to 18 genres) and the Ten-itemsPersonality Inventory (TIPI) questionnaire [8]. The participants were thenshown various supporting multimedia content that could fit in an interactivedigital program note. For the chosen classical music concert (the piece LaMer by the French composer Claude Debussy performed by the Royal Con-certgebouw Orchestra) we prepared multimedia material (text, images andaudio) for the composer, piece and performer. Furthermore, each pair (e.g.composer-text) was presented in a long and short version (for images andaudio clips short meant one item and long meant several items). In totalwe presented the participants 14 combinations of content. For each contentcombination, the participants gave three ratings: (i) amount of consumptionof the content (on the scale none/some/half/most/all), (ii) interestingness ofthe content (on a scale from 1 to 5) and (ii) novelty of the content (on ascale from 1 to 5).
104

5 Results
As can be seen from Tab. 1, personality traits were correlated with the sub-jects’ musical background. Openness and extraversion were positively sig-nificantly correlated to three variables, agreeableness had a negative signif-icant correlation with two variables while conscientiousness had a positivecorrelation only with the attending classical concerts variable. Neuroticismwas not significantly correlated with any of the musical background vari-ables.
personality trait musical background variable correlation p value
openness listening to classical music 0.26 0.0007studying an instrument 0.16 0.03attending classical concerts 0.19 0.01
extraversion playing an instrument 0.21 0.008attending classical concerts 0.3 0.00009attending non-classical con-certs
0.24 0.002
agreeableness listening to non-classical mu-sic
−0.22 0.005
studying an instrument −0.23 0.003
conscientiousness attending classical concerts 0.17 0.02
Table 1: Correlations between personality traits and musical backgroundvariables.
Personality also appears to be correlated with how much the subjects likeclassical music as a genre (see Tab. 2). Openness, extraversion andagreeableness have a positive significant correlation with liking classicalmusic, while conscientiousness and neuroticism are not significantly corre-lated.
personality trait correlation p-value
openness 0.17 0.03extraversion 0.21 0.006agreeableness 0.33 0.00001conscientiousness 0.11 0.16neuroticism −0.14 0.06
Table 2: Correlation between personality traits and the preferences for theclassical music genre.
We observed several significant correlations among variables that can be
105

Figure 1: Bubble plots with correlations between personality and contentpreferences. In the presented four cases all independent variables (x axis)are on the scale from 1 to 7, while the dependent (y axis) are on the scalefrom 1 to 5. The top-left figure is the relation between openness and thepreference for the short description of the piece (slope b1 = 0.24, correlationr = 0.29, p-value p = 0.0001 ). The top-right figure is the relation betweenneuroticism and the preference for a long description about the orchestra(b0 = 0.15, r = −0.21, p = 0.007). The bottom-left figure is the relationbetween conscientiousness and the degree of consumption of the long or-chestra description (b0 = 0.25, r = 0.28, p = 0.003). The bottom-right figureis the relation between agreeableness and the degree of consumption ofthe long audio (b0 = 0.32, r = 0.36, p = 2 · 10−6)
.
useful in a personalized system. Personality did correlate with with the an-swers provided by the subjects on the consumption, interestingness andnovelty of the multimedia material. For example, people who score highon openness, agreeableness, conscientiousness and extraversion tend toshow a positive correlation with consumption, interestingness and novelty,hence meaning that they prefer to consume more of the material, find itinteresting and novel. On the other hand, subjects who score high on neu-roticism tend to consume less of the material, find it less interesting or
106
novel. Our data show no correlation or negative correlations for neuroti-cism and the observed answers (see Fig. 1). Similarly, the music back-ground variables showed generally positive correlations with consumption,interestingness and novelty of the multimedia material.
6 Conclusions and Future Work
The analysis of our data showed that there are many significant corre-lations between personal characteristics (personality and musical back-ground) and preferences for the supporting multimedia content. However,further analyses should be carried out to determine how these personalcharacteristics relate with various types of material (text/images/audio) orlength. The most important step we need to take is to use machine learningtechniques to predict the preferred type of digital program notes based onthe users’ personalities. We plan to use logistic regression for individual bi-nary variables and multinomial logistic regression for individual Likert scaleratings. Furthermore, we plan to use a rule-based algorithm for inferringthe preferred modality and length.
We are currently in the process of designing a new user study where wewill have better control over the text variance. The text will be curated bymusicologists and we will use different levels of complexity (in terms ofvocabulary). Furthermore, we will use the Goldsmiths Music SophisticationIndex (MSI) [12] to assess the musical background of the users (the MSIinstrument was published after we already carried out the study presentedhere).
Acknowledgement
This research is supported by the European FP7/2007-2013 programmethrough the PHENICX project under grant agreement no. 601166 and bythe Austrian Science Fund (FWF): P25655.
References
[1] Cantador, I., Fernández-tobías, I., Bellogín, A.: Relating PersonalityTypes with User Preferences in Multiple Entertainment Domains. EM-PIRE 1st Workshop on "Emotions and Personality in Personalized Ser-vices", 10. June 2013, Rome (2013)
107

[2] Chamorro-Premuzic, T., Furnham, A.: Personality and music: cantraits explain how people use music in everyday life? British journal ofpsychology (London, England : 1953) 98(Pt 2), 175–85 (May 2007),http://www.ncbi.nlm.nih.gov/pubmed/17456267
[3] El-Bishouty, M.M., Chang, T.W., Graf, S., Chen, N.S.: Smart e-courserecommender based on learning styles. Journal of Computers in Ed-ucation 1(1), 99–111 (Mar 2014), http://link.springer.com/10.1007/s40692-014-0003-0
[4] Elahi, M., Braunhofer, M., Ricci, F., Tkalcic, M.: Personality-basedactive learning for collaborative filtering recommender systems. AI*IA2013: Advances in Artificial Intelligence pp. 360–371 (2013), http://link.springer.com/chapter/10.1007/978-3-319-03524-6\_31
[5] Ferwerda, B., Yang, E., Schedl, M., Tkalcic, M.: Personality TraitsPredict Music Taxonomy Preference. In: CHI 2015 Works-in-Progress(2015)
[6] Furnham, A.: The big five versus the big four: the relationship be-tween the Myers-Briggs Type Indicator (MBTI) and NEO-PI five fac-tor model of personality. Personality and Individual Differences 21(2),303–307 (Aug 1996), http://linkinghub.elsevier.com/retrieve/pii/0191886996000335
[7] Golbeck, J., Robles, C., Edmondson, M., Turner, K.: Predicting Per-sonality from Twitter. In: 2011 SocialCom and PASSAT conferenceProceedings. pp. 149–156. IEEE (Oct 2011), http://ieeexplore.ieee.org/lpdocs/epic03/wrapper.htm?arnumber=6113107
[8] Gosling, S.D., Rentfrow, P.J., Swann, W.B.: A very brief measure ofthe Big-Five personality domains. Journal of Research in Personal-ity 37(6), 504–528 (Dec 2003), http://linkinghub.elsevier.com/retrieve/pii/S0092656603000461
[9] John, O.O.P., Srivastava, S.: The Big Five trait taxonomy: His-tory, measurement, and theoretical perspectives. In: Pervin, L.A.,John, O.P. (eds.) Handbook of personality: Theory and research,vol. 2, pp. 102–138. Guilford Press, New York, second edn. (1999),http://books.google.com/books?hl=en\&lr=\&id=b0yalwi1HDMC\&oi=fnd\&pg=PA102\&dq=The+Big-Five+Trait+Taxonomy:+History,+Measurement,+and+Theoretical+Perspectives\&ots=758AL9TvOn\&sig=EdcojL2Ze7jxAWySrhj\_Jhbyr9ohttp://books.google.com/books?hl=en\&lr=\&id=b0
[10] Kosinski, M., Stillwell, D., Graepel, T.: Private traits and attributes arepredictable from digital records of human behavior. Proceedings of the
108
National Academy of Sciences pp. 2–5 (Mar 2013), http://www.pnas.org/cgi/doi/10.1073/pnas.1218772110
[11] Liem, C.C.S., Sterren, R.V.D.: Innovating the Classical Music Experi-ence in the PHENICX Project : Use Cases and Initial User Feedback.1st International Workshop on Interactive Content Consumption (WS-ICC) at EuroITV 2013 (2013)
[12] Müllensiefen, D., Gingras, B., Musil, J., Stewart, L.: The mu-sicality of non-musicians: an index for assessing musical so-phistication in the general population. PloS one 9(2), e89642(Jan 2014), http://www.pubmedcentral.nih.gov/articlerender.fcgi?artid=3935919\&tool=pmcentrez\&rendertype=abstract
[13] Quercia, D., Kosinski, M., Stillwell, D., Crowcroft, J.: OurTwitter Profiles, Our Selves: Predicting Personality with Twit-ter. In: 2011 SocialCom and PASSAT conference Proceed-ings. pp. 180–185. IEEE (Oct 2011), http://ieeexplore.ieee.org/lpdocs/epic03/wrapper.htm?arnumber=6113111http://ieeexplore.ieee.org/xpls/abs\_all.jsp?arnumber=6113111
[14] Rentfrow, P.J., Gosling, S.D.: The do re mi’s of everyday life: Thestructure and personality correlates of music preferences. Journal ofPersonality and Social Psychology 84(6), 1236–1256 (2003), http://doi.apa.org/getdoi.cfm?doi=10.1037/0022-3514.84.6.1236
[15] Tkalcic, M., Kunaver, M., Košir, A., Tasic, J.: Addressing the newuser problem with a personality based user similarity measure. Pro-ceedings of the DEMRA 2011 and the UMMS 2011 Workshops,Girona, Spain (2011), http://ceur-ws.org/Vol-740/DEMRA\_UMMS\_2011\_proceedings.pdf\#page=106
109

Exploring Music Diversity Needs AcrossCountries
Published in: Proceedings of the 24th Conference on User Modeling, Adaptation, andPersonalization (UMAP 2016; Halifax, NS, CA)
BRUCE FERWERDA, Johannes Kepler University, Linz (AT)ANDREU VALL, Johannes Kepler University, Linz (AT)MARKO TKALCIC, Free University of Bolzano, Bolzano (IT)MARKUS SCHEDL, Johannes Kepler University, Linz (AT)
Abstract
Providing diversity in recommendations has shown to positively influ-ence the user’s subjective evaluations such as satisfaction. However,it is often unknown how much diversity a recommendation set needsto consist of. In this work, we explored how music users of Last.fmapply diversity in their listening behavior. We analyzed a dataset withthe music listening history of 53,309 Last.fm users capturing their to-tal listening events until August 2014. We complemented this datasetwith The Echo Nest features and Hofstede’s cultural dimensions toexplore how music diversity is applied across countries. Between 47countries, we found distinct relationships between the cultural dimen-sions and music diversity variables. These results suggest that dif-ferent country-based diversity measurements should be consideredwhen applied to a recommendation set in order to maximize the user’ssubjective evaluations. The country-based relationships also provideopportunities for recommender systems to personalize experienceswhen user data is limited by being able to rely on the user’s demo-graphics.
Keywords: Music Recommendations, Diversity, Cultural Differences
1 Introduction
Providing recommendation diversity to users has become an important fea-ture for recommender systems. Recommending items with high accuracyoften result in a set of recommendations that are too similar to each other,and thereby not covering the full spectrum of the user’s interest. Giving inon accuracy by introducing diversity can positively influence the user expe-rience, such as user satisfaction [1].
110

The amount of diversity that should be provided remains a debatable topic.Prior research has identified that individual characteristics (e.g., expertise)play a role in how much diversity is desired by the user [1]. The problem thatpersist is that often self-report measures are used to identify these influen-tial individual characteristics. Whereas registration and login processes arebecoming easier (e.g., single sign-on buttons), asking additional questionsmay become a bothersome process for (new) users.
The implicit acquisition (i.e., without the use of questionnaires) of individ-ual differences remains challenging. Especially for new users there is notenough behavioral data yet to make inferences. Country information maybe a useful alternative as it already consists in a standard user profile andbehavior has shown te be culturally embedded. We looked at music lis-tening behavior of Last.fm 1 users from 47 countries and explored how theyapply diversity to their playlists. We computed a diversity measure based onthe unique listening events (i.e., of artists and genres) of users per country.By using The Echo Nest features we were also able to look at artist charac-teristics (i.e., how known, familiar, or popular the artists are that have beenlistened to by users). This provide insights on cultural dependent diversitypatterns.
2 Related Work
Recommender systems intend to create a personalized set of items thatare most relevant to the user. However, highly relevant items often appeartoo similar to each other. A set of items showing too much similarities (e.g.,highly relevant items) can cause choice overload [9]. In [1] was shown thatdiversity has a positive effect on the attractiveness of the recommendationset, the difficulty to make a choice, and eventually on the choice satisfac-tion. Additionally, individual differences were found. E.g., increased exper-tise has positive effects on perceived item variety and attractiveness.
Besides individual characteristics, research has shown that culture consistsof useful cues as well. General behavior and preferences have shown tobe rooted and embodied in culture [8]; looking at behavior on a countrylevel may provide useful information for the desired recommendation diver-sity.
1http://www.last.fm
111

Table 1: Correlation results.PDI IDV MAS UAI LTO IND
Artist .279* -.373** .155 -.020 -.259* .080Genre .329* -.265* .074 -.051 -.108 -.113Hot. -.131 -.0.39 -.135 -.359* -.641** .557**Fam. -.100 -.229 .009 -.255 -.677** .520**Disc. -.367** -.294* -.311* -.366* -.274* .517**
Note. *p<.05, **p<.01
3 Method
A Last.fm dataset was used with 53,309 users of 47 countries and theirtotal listening history until August 2014. 2 The dataset consists of users’listening (i.e., user ID, time-stamp, artist name, and track name) and pro-file information (i.e., gender, age, country). A diversity measure was cre-ated by aggregating each user’s listening history by artist and genre toidentify the unique instances of each respectively. 3 E.g., a history of 90events originating from two artists/genres means a diversity of two. Eachdiversity measure was normalized (r ε [0,1]) due to the unequal number ofusers between countries. The dataset was complemented with Hofstede’scultural dimensions (i.e., power distance, individualism, masculinity, uncer-tainty avoidance, long-term orientation, and indulgence [7]) and The EchoNest features (i.e., genre, hotness, familiarity, and discovery).
4 Results
Correlation analyses were used to explore the relationship between culturaldimensions and diversity, and report Pearson’s correlation (r ε [-1,1]) toindicate the relationship.
Table 1 shows the correlation results between the cultural dimensions andlistening characteristics. A negative correlation represents the degree of di-versity, whereas a positive correlation indicates homogeneity. Positive cor-relations were found between a culture’s power distance and artist (r=.279,p=.043) and genre (r=.329, p=.027) diversity. This indicates that users incountries scoring high on this dimension tend to apply less diversity byartist as well as by genre. Negative correlations were found between the
2Available at http://www.cp.jku.at/datasets/LFM-1b/3Genre was obtained through The Echo Nest. To maintain a manageable dataset we
decided not to focus on a track level.
112

individualism dimensions and artist (r=-.373, p=.012) and genre (r=-.265,p=.048) diversity, which indicates that users in individualistic countries tendto apply music diversity on an artist as well as genre level. Finally, a nega-tive correlation was found between long-term orientation and artist diversity(r=-.259, p=.048). Users in countries scoring high on this dimension tendto listen to more diverse artists.
The Echo Nest features allowed us to gain more insights of the diversitycharacteristics of the artists. A negative correlation indicates that usersof a country involve artists that score low on the respective feature of TheEcho Nest when scoring high in the correlated cultural dimension (Table 1).
Hotness. Hotness was found to be negatively correlated with uncertaintyavoidance (r=-.359, p=.015) and long-term orientation (r=-.641, p=.000),while a positive correlation was found with indulgence (r=.557, p=.000).
Familiarity. Familiarity was found to be negatively correlated with long-term orientation (r=-.677, p=.000), but positively correlated with indulgence(r=.520, p=.000).
Discovery. Discovery showed a negative correlation with five out of sixcultural dimensions: power distance (r=-.367, p=.013), individualism (r=-.294, p=.050), masculinity (r=-.311, p=.038), uncertainty avoidance (r=-.366, p=.013), and long-term orientation (r=-.274, p=.042). A positive cor-relation was found with indulgence (r=.517, p=.000).
5 Conclusion & Implications
We show with our results that different diversity patterns exist and that theyare related to cultural dimensions. When looking at the relationship be-tween listening characteristics and cultural dimensions, distinct correlationswere found.
Approaching diversity on a country level enables the creation of proxy mea-sures for personalization when data is limited. Users’ personality has gainedinterest to make inferences for personalization (e.g., [2, 6, 11]) on an indi-vidual level. The interconnectedness of applications and social media maybe exploited to implicitly acquire personality (e.g., Facebook [4], Twitter [10],Instagram [3, 5]). However, a social media connection is still needed. Ourresults could be used to infer diversity needs based on country information,which is often available through the user’s account.
113

6 Acknowledgment
This research is supported by the Austrian Science Fund (FWF): P25655.
References
[1] Bollen, D., Knijnenburg, B.P., Willemsen, M.C., Graus, M.: Under-standing choice overload in recommender systems. In: RecSys. ACM(2010)
[2] Ferwerda, B., Schedl, M.: Enhancing music recommender systemswith personality information and emotional states: A proposal. In: EM-PIRE (2014)
[3] Ferwerda, B., Schedl, M., Tkalcic, M.: Predicting personality traits withinstagram pictures. In: 3rd Workshop on EMPIRE (2015)
[4] Ferwerda, B., Schedl, M., Tkalcic, M.: Personality traits and the rela-tionship with (non-) disclosure behavior on facebook. WWW (2016)
[5] Ferwerda, B., Schedl, M., Tkalcic, M.: Using instagram picture fea-tures to predict users’ personality. In: MultiMedia Modeling (2016)
[6] Ferwerda, B., Yang, E., Schedl, M., Tkalcic, M.: Personality traits pre-dict music taxonomy preferences. In: CHI’15 Ext. Abstracts (2015)
[7] Hofstede, G., Hofstede, G.J., Minkov, M.: Cultures and organizations:Software of the mind (1991)
[8] Kitayama, S., Park, H.: Cultural shaping of self, emotion, and well-being: How does it work? Soc. and Pers. Psych. Compass (2007)
[9] Scheibehenne, B., Greifeneder, R., Todd, P.M.: Can there ever be toomany options? a meta-analytic review of choice overload. J. of Cons.Res. (2010)
[10] Skowron, M., Ferwerda, B., Tkalcic, M., Schedl, M.: Fusing socialmedia cues: Personality prediction from twitter and instagram. WWW(2016)
[11] Tkalcic, M., Ferwerda, B., Hauger, D., Schedl, M.: Personality Corre-lates for Digital Concert Program Notes. UMAP pp. 1–6 (2015)
114

Investigating the Relationship BetweenDiversity in Music Consumption Behaviorand Cultural Dimensions: A Cross-CountryAnalysis
Published in: Extended Proceedings of the 24th Conference on User Modeling,Adaptation, and Personalization (UMAP 2016): 1st Workshop on Surprise, Opposition,and Obstruction in Adaptive and Personalized Systems (SOAP 2016; Halifax, NS, CA)
BRUCE FERWERDA, Johannes Kepler University, Linz (AT)MARKUS SCHEDL, Johannes Kepler University, Linz (AT)
Abstract
Diversity in recommendation lists or sets has shown to be an impor-tant feature in recommender systems as it can counteract on negativeeffects such as choice difficulty and choice overload. However, howmuch diversity a recommendation list needs to provide is not clearlydefined. By analyzing music listening behavior of listeners in 47 coun-tries, we show that diversity needs may be cultural dependent. For ouranalyses, we exploited a Last.fm dataset containing almost 1.1 billionsingle listening events. We investigated several diversity measures toidentify how users in different countries apply music diversity to theirlistening behavior. By analyzing 53,309 Last.fm users, we found dis-tinct diversity behavior related to several cultural dimensions of Hof-stede. We show with our results that different diversity needs existbetween cultures, and should be taken into account when applyingdiversity to a recommendation list.
Keywords: Diversity, Cultural Differences, Music Recommender Sys-tems
1 Introduction
By tradition, recommender systems are created to most accurately providerecommendations in line with the user’s taste (i.e., output options with thehighest predicted ratings). The assumption of this approach is that thehigher the recommendation accuracy, the higher the attractiveness of theitems for the user. However, it has been shown that by doing this two sub-sequent effects may occur, which are caused by recommendations that aretoo attractive: (i) choice difficulties [23], and (ii) choice overload [2]. One
115

way to counteract on the negative effects of too attractive items is to intro-duce recommendation diversity.
The amount of diversity that a set or list of recommendations should providehas been given limited attention. Prior research has shown that personalcharacteristics, such as expertise, play a role in the desired amount of rec-ommendation diversity [2]. As the shaping of behavior and preferences hasshown to be influenced by culture [13], identifying diversity on a countrylevel may already provide cues about the desired recommendation diver-sity.
Providing a truly personalized experience to the user is still challengingin today’s recommender systems. Often there is simply not enough dataavailable (yet) about the user. A way to solve this problem is to use ques-tionnaires in order to get to know the user. However, this is not desirablesince it is obtrusive, takes a lot of effort and time from the user, and therebydisrupts their interaction with the system. Since country information is oftenavailable through the user’s profile information, identifying diversity needson a country level could be exploited to provide users with a personalizedexperience. Quantifying these diversity needs and studying their relation-ship to cultural dimensions is the focus of the study at hand.
This study is a follow-up investigation of the one presented in [8]. A short-coming of that study was the quite simple definition of diversity, solely basedon absolute numbers of whether an artist is listened to or not, neglectingthe frequency the artist is listened to. Furthermore, [8] uses genres takenfrom the Echonest,1 which are very broad, thus rendering impossible fine-grained modeling and analysis. Addressing these two shortcomings, thepaper at hand (i) investigates several volume- and entropy-based diversityformulations and (ii) models a population’s diversity via a dictionary con-taining more than 2,000 genre names.
2 Related Work
Recommender systems intend to create a personalized set of items that aremost relevant to the user. However, highly relevant items often appear toosimilar to each other, resulting in recommendations that may be perceivedas boring to the users. A set of items showing too much similarity (e.g.,too many highly relevant items) can, in turn, cause choice overload [19].Bollen et al. [2] and Willemsen et al. [23] investigated the influence of diver-sity on movie recommendations and found that diversity has a positive ef-fect on the attractiveness of the recommendation set, the difficulty to make
1http://the.echonest.com
116

a choice, and eventually on the choice satisfaction. Bollen et al. [2] ad-ditionally identified individual differences. For example, they showed thatincreased expertise has positive effects on perceived item variety and at-tractiveness.
Besides individual user characteristics, research has shown that culturalaspects can provide useful cues too. General behavior and preferenceshave shown to be rooted and embodied in culture [13], hence looking atbehavior on a country level may provide useful information for the desiredrecommendation diversity. In a comprehensive study, Hofstede et al. [11]describe national cultures among six dimensions: power distance, individ-ualism, masculinity, uncertainty avoidance, long-term orientation, and in-dulgence. These dimensions describe the effects of a society’s culture onthe values and behaviors of its members, which we use to explain diver-sity differences between countries in this study. The data that describesHofstede’s cultural dimensions has been collected since 1967 and is beingrefined ever since.
3 Method
The study at hand investigates on a standardized corpus of music listeningevents and listener demographics on the one hand, and Hofstede’s culturaldimensions on the other, the relationship between diversity of music tastes(on the genre level) and cultural aspects in a population (on the countrylevel). In the following, we first provide details of the used dataset, its en-richment by genre terms, and the definitions for diversity that we study. Sub-sequently, we summarize Hofstede’s cultural dimensions, against which wecompare our diversity scores via correlation analysis.
3.1 Music Dataset
We used the LFM-1b dataset [18] to model diversity and perform our exper-iments.2 It is a dataset containing almost 1.1 billion single listening eventsby more than 120,000 users of Last.fm3 and covers over 3 million uniqueartists. Due to its user-generated nature, however, the data is quite noisy,e.g., metadata frequently contains typos. We therefore had to perform sim-ple data cleaning first. Assuming that wrong artist names, which can bethe result of misspellings, typos, hacking, and vandalism, etc., do not fre-quently occur in the dataset, we discarded all artist names that occur in the
2http://www.cp.jku.at/datasets/LFM-1b3http://www.last.fm
117

listening events of less than 10 users. This cleaning resulted in a dataset of585,095 artists.
3.2 Modeling Diversity
Geographically, we model diversity on the country level. In order to ob-tain relevant results, we only consider countries with at least 100 users inthe LFM-1b dataset. For detailed numbers of users, please consider Ta-ble 2.
In terms of listening behavior, we gauge diversity via scores derived fromgenre data of users’ listening events. To this end, we first retrieve all artists’top tags provided by Last.fm via their API.4 The resulting tags obviouslycontain many terms other than genre names, for which reason we indexthem by a dictionary of 1,998 genre and style terms extracted from Free-base.5 We further restrict the considered tags to those that have a tagweight of at least 10 according to Last.fm’s weighting scheme.6 This even-tually provides us with a set of genre tags for each artist. Statistics of the50 most frequently occurring genres for selected countries of the datasetare provided in Table 1 for the U.S.A., Japan, and Finland. As can be seen,while there are quite a few genres that are popular among Last.fm usersin all three countries (e.g., Rock, Alternative, and Metal), country-specificdifferences are evidenced too. For instance, J-Pop is a genre very popularin Japan, but not among the top 50 genres in any of the other countrieslisted here. In contrast, 3 out of the top 10 most popular genres in Finlandrelate to Metal.
4We use the API endpoint http://www.last.fm/api/show/artist.getTopTags.5http://www.freebase.org6Last.fm employs a non-disclosed approach to weight artist tags based on the number
of users who assign the tag to the artist. While details are not provided, these weightsare normalized to [0,100]. Our filtering thus discards tags infrequently used to describe theartist under consideration.
118

Table 1: Relative amount of listening events (playcounts PC in percent) ofthe 50 most frequent genres and styles for the U.S.A., Japan, and Finland.
U.S.A. Japan FinlandGenre tag PC Genre tag PC Genre tag PCRock 12.51 Rock 16.01 Rock 11.31Alternative 9.63 Alternative 8.37 Metal 11.15Alternative rock 5.86 J-pop 5.77 Alternative 7.30Metal 4.77 Pop 4.56 Alternative rock 4.56Pop 3.62 Metal 4.55 Hard rock 4.28Indie 3.59 Alternative rock 4.26 Heavy metal 3.44Hard rock 3.12 Indie 3.63 Death metal 2.74Indie rock 3.09 Electronic 2.29 Classic rock 2.61Classic rock 2.92 Hard rock 2.24 Pop 2.21Electronic 2.33 Classic rock 2.23 Indie 2.13Dance 2.21 Visual Kei 2.03 Electronic 2.00Psychedelic 1.84 Indie rock 2.02 Indie rock 1.75Blues 1.77 Heavy metal 1.68 Dance 1.71Hip-Hop 1.72 Dance 1.66 Progressive rock 1.67Punk 1.61 Punk 1.53 Nu metal 1.57Heavy metal 1.49 Psychedelic 1.45 Progressive 1.50Singer-songwriter 1.34 Anime 1.43 Power metal 1.46Progressive 1.25 Electronica 1.43 Punk 1.45Electronica 1.24 Blues 1.18 Alternative metal 1.32Progressive rock 1.16 Japanese rock 1.17 Psychedelic 1.18New Wave 1.08 Progressive rock 1.06 Hip-Hop 1.10Punk rock 1.03 Pop punk 0.91 Electronica 0.90Nu metal 0.99 Nu metal 0.86 Speed metal 0.89Alternative metal 0.85 Progressive 0.86 Blues 0.84Rap 0.83 New Wave 0.84 Punk rock 0.82Post-punk 0.79 Punk rock 0.83 Viking metal 0.75Synthpop 0.77 Singer-songwriter 0.75 Progressive metal 0.71Pop punk 0.77 Death metal 0.75 New Wave 0.70Rnb 0.75 Synthpop 0.67 Melodic death metal 0.69Psychedelic rock 0.72 Hip-Hop 0.63 Thrash 0.68Emo 0.68 Experimental 0.59 Visual Kei 0.66Experimental 0.68 Jazz 0.59 Groove metal 0.65Death metal 0.68 Ambient 0.59 Pop punk 0.64Electro 0.67 Power metal 0.58 Psychedelic rock 0.64Garage rock 0.67 Electropop 0.57 Hardcore 0.62Blues-rock 0.66 Electro 0.52 Thrash metal 0.62House 0.64 Alternative metal 0.52 Industrial 0.60Techno 0.62 Post-punk 0.51 Singer-songwriter 0.59Ambient 0.60 Speed metal 0.50 Ambient 0.58Glam rock 0.57 Pop rock 0.47 Experimental 0.53Folk 0.53 Instrumental 0.47 Synthpop 0.50Indie pop 0.52 Emo 0.46 Glam rock 0.49Art rock 0.41 House 0.44 Emo 0.49Hardcore 0.41 Blues-rock 0.43 Symphonic metal 0.48Funk 0.40 Funk 0.42 Metalcore 0.46Instrumental 0.40 Glam rock 0.41 Instrumental 0.46Speed metal 0.39 Techno 0.39 Electro 0.44Soul 0.37 Hardcore 0.38 Technical death metal 0.44Folk rock 0.37 Fusion 0.38 Rapcore 0.43Industrial rock 0.36 Soul 0.38 Blues-rock 0.42
Based on the users’ demographics, as provided in the LFM-1b dataset, andthe artist-related genre information, obtained as described above, we de-fine the following volume- and entropy-based diversity measures, computedper country and reported in Table 2:
119

Table 2: Diversity scores for the top 47 countries. The columns indicate:country, total number of users, Hofstede’s cultural dimensions (r ∈ [0,100]):power distance index(PDI), individualism (IDV), masculinity (MAS), uncer-tainty avoidance index (UAI), long-term orientation (LTO), and indulgence(IND), absolute volume of unique genre occurrences (Vol. abs.), relativevolume of unique genre occurrences (Vol. rel.), absolute (Vol. > 1h abs.)and relative (Vol. > 1h rel.) volume of genre occurrences with relative lis-tening volumes exceeding one per mille, genre entropy, mean (Vol. µ) andstandard deviation (Vol. σ) of listening distributions over genres.
Country # User PDI IDV MAS UAI LTO IND Vol.abs.
Vol.rel.(%)
Vol. >1habs.
Vol.> 1hrel.
(%)
Entropy Vol. µ Vol. σ
U.S.A. 10255 40 91 62 46 26 68 111155.55 132 6.6 0.647383 0.0009 .004580Russia 5024 93 39 36 95 81 20 109754.85 141 7.05 0.665395 0.000912 .004312Germany 4578 35 67 66 65 83 40 1100 55 138 6.9 0.662084 0.000909 .004346Great Britain 4534 35 89 66 35 51 69 110355.15 132 6.6 0.64291 0.000907 .004702Poland 4408 68 60 64 93 38 29 107753.85 132 6.6 0.647125 0.000929 .004696Brazil 3886 69 38 49 76 44 59 105352.65 119 5.95 0.626137 0.00095 .005271Finland 1409 33 63 26 59 38 57 1042 52.1 131 6.55 0.656833 0.00096 .004694Netherlands 1375 38 80 14 53 67 68 108154.05 142 7.1 0.658458 0.000925 .004473Spain 1243 57 51 42 86 48 44 104352.15 136 6.8 0.657332 0.000959 .004723Sweden 1231 31 71 5 29 53 78 1062 53.1 124 6.2 0.649503 0.000942 .004678Ukraine 1143 N/A N/A N/A N/A 86 14 102951.45 139 6.95 0.665125 0.000972 .004543Canada 1077 39 80 52 48 36 68 1056 52.8 132 6.6 0.65296 0.000947 .004637France 1055 68 71 43 86 63 48 104552.25 140 7 0.66765 0.000957 .004357Australia 976 38 90 61 51 21 71 1036 51.8 125 6.25 0.64334 0.000965 .004912Italy 974 50 76 70 75 61 30 103151.55 120 6 0.645742 0.00097 .004942Japan 806 54 46 95 92 88 42 1024 51.2 126 6.3 0.648062 0.000977 .004929Norway 750 31 69 8 50 35 55 1028 51.4 129 6.45 0.657356 0.000973 .004700Mexico 705 81 30 69 82 24 97 101150.55 137 6.85 0.655207 0.000989 .004930Czech Republic 632 57 58 57 74 70 29 983 49.15 133 6.65 0.6687 0.001017 .004593Belarus 558 N/A N/A N/A N/A 81 15 979 48.95 140 7 0.672649 0.001021 .004543Belgium 513 65 75 54 94 82 57 1008 50.4 142 7.1 0.66945 0.000992 .004547Indonesia 484 78 14 46 48 62 38 842 42.1 118 5.9 0.644635 0.001188 .005790Turkey 479 66 37 45 85 46 49 980 49 119 5.95 0.654673 0.00102 .004732Chile 425 63 23 28 86 31 68 918 45.9 127 6.35 0.653122 0.001089 .005312Croatia 372 73 33 40 80 58 33 940 47 129 6.45 0.665861 0.001064 .004904Portugal 291 63 27 31 104 28 33 918 45.9 136 6.8 0.664801 0.001089 .005023Argentina 282 49 46 56 86 20 62 927 46.35 119 5.95 0.639404 0.001079 .005586Switzerland 277 34 68 70 58 74 66 970 48.5 132 6.6 0.66451 0.001031 .004768Austria 276 11 55 79 70 60 63 932 46.6 140 7 0.671787 0.001073 .004804Denmark 272 18 74 16 23 35 70 950 47.5 136 6.8 0.664297 0.001053 .004858Hungary 272 46 80 88 82 58 31 901 45.05 137 6.85 0.687505 0.00111 .004544Serbia 253 86 25 43 92 52 28 910 45.5 141 7.05 0.677889 0.001099 .004746Romania 237 90 30 42 90 52 20 951 47.55 137 6.85 0.676884 0.001052 .004409Bulgeria 236 70 30 40 85 69 16 926 46.3 143 7.15 0.681036 0.00108 .004766Ireland 220 28 70 68 35 24 65 906 45.3 125 6.25 0.652082 0.001104 .005270Lithuania 202 42 60 19 65 82 16 892 44.6 138 6.9 0.672913 0.001121 .004969Slovakia 192 104 52 110 51 77 28 878 43.9 136 6.8 0.684491 0.001139 .004614Greece 175 60 35 57 112 45 50 907 45.35 134 6.7 0.688293 0.001103 .004447Latvia 165 44 70 9 63 69 13 904 45.2 134 6.7 0.675491 0.001106 .004787New Zealand 164 22 79 58 49 33 75 865 43.25 134 6.7 0.672034 0.001156 .005161China 162 80 20 66 30 87 24 847 42.35 129 6.45 0.671203 0.001181 .004991Columbia 159 67 13 64 80 13 83 885 44.25 123 6.15 0.65439 0.00113 .005477Iran 135 58 41 43 59 14 40 782 39.1 117 5.85 0.65695 0.001279 .005473India 122 77 48 56 40 51 26 794 39.7 127 6.35 0.665461 0.001259 .005578Venezuela 118 81 12 73 76 16 100 816 40.8 123 6.15 0.654646 0.001225 .005830Estonia 107 40 60 30 60 82 16 823 41.15 125 6.25 0.672622 0.001215 .005148Israel 100 13 54 47 81 38 N/A 830 41.5 133 6.65 0.674123 0.001205 .005378
120

Overall volume of genre occurrences We count the number of genretags that appear at least once in at least one user’s listening history ofthe respective country’s user base and define it as the absolute volume ofgenre occurrences (indicated as Vol. abs. in Table 2). The relative volumeis computed as the fraction of the absolute one and the number of genretags in the dictionary (Vol. rel. in Table 2).
Relative listening volume exceeding one per mille We first computethe total playcounts, i.e. number of listening events of each artist over allusers in the country under investigation. Based on the artist–genre map-ping, we subsequently calculate these playcounts per genre by aggregat-ing the playcounts of all artists that are tagged by that genre. This absolutegenre playcount is then normalized by the total playcount of a country, yield-ing an estimate of genre g’s relative popularity in country c. Formally, thecomputation of this relative popularity popc(g) is given in Equation 1, whereG is the set of genres, Uc is the set of users in country c, Ag
c is the set ofartists listened to in country c and tagged as genre g, and pc(u, a) denotesthe number of listening events (playcounts) of user u to artist a.7
popc(g) =
∑u∈Uc
∑a∈Ag
cpc(u, a)∑
g∈G∑
u∈Uc
∑a∈Ag
cpc(u, a)
(1)
To define diversity, we finally count the number of genres whose relativepopularity exceeds one per mille of the total listening events. Again, we usethis score as absolute measure and we divide it by the number of genretags to yield a relative estimate (Vol. > 1h abs. and Vol. > 1h rel. inTable 2).
Entropy Based on the genre-specific playcounts, computed as describedin the previous paragraph, we use the normalized genre entropy as diversitymeasure. Formally, our adapted entropy measure is defined in Equation 2,where G is the set of all genres and pc(g) is the probability for genre gin country c. We approximate this probability as the relative frequency ofgenre g’s playcounts among all playcounts in country c. The normalizationterm in the denominator ensures that the resulting diversity scores fall intothe range [0,1].
Hc(G) =−∑
g∈G pc(g) · log2 pc(g)log2 |G|
(2)
7We use the term le instead of pc in the formula to avoid confusions with pc in Equation 2.
121

Statistics over relative genre playcounts In addition to the volume-based diversity measures and to entropy, we investigate basic statisticsof the relative genre playcounts. In particular, we compute mean and stan-dard deviation of the elements pc(g) with g ∈ G. The corresponding scoresare denoted Vol. µ and Vol. σ, respectively, in Table 2.
3.3 Modeling Cultural Dimensions
The most comprehensive framework for national cultures is considered tobe Hofstede et al.’s cultural dimensions. They defined six dimensions toidentify cultures [11]:
Power distance index (PDI) Defines the extent to which power is dis-tributed unequally by less powerful members of institutions (e.g., family).High power distance indicates that a hierarchy is clearly established andexecuted in society. Low power distance indicates that authority is ques-tioned and attempted to distribute power equally.
Individualism (IDV) Defines the degree of integration of people into so-cietal groups. High individualism is defined by loose social ties. The mainemphasis is on the “I” instead of the “we,” while opposite for low individual-istic cultures.
Masculinity (MAS) Defines a society’s preference for achievement, hero-ism, assertiveness and material rewards for success (countries scoringhigh in this dimension). Whereas low masculinity represents a preferencefor cooperation, modesty, caring for the weak and quality of life.
Uncertainty avoidance index (UAI) Defines a society’s tolerance for am-biguity. High scoring countries in this scale are more inclined to opt for stiffcodes of behavior, guidelines, laws. Whereas more acceptance of differingthoughts and/or ideas are accepting for those scoring low in this dimen-sion.
Long-term orientation (LTO) Is associated with the connection of thepast with the current and future actions and/or challenges. Lower scoringcountries tend to believe that traditions are honored and kept, and valuesteadfastness. High scoring countries believe more that adaptation andcircumstantial, pragmatic problem-solving are necessary.
122

Table 3: Spearman correlations between Hofstede’s cultural dimensionsand the analyzed diversity measures. Abbreviations for diversity measuresas in Table 1. Results for absolute and relative diversity measures areobviously the same and therefore reported only once. Note: *p<.05, **p<.01
Vol. abs./rel. Vol. > 1h abs./rel. Entropy Vol. µ Vol. σPower Distance -.183 .036 .132 .183 .022Individualism .459** -.167 -.117 -.459** -.414**Masculinity -.073 -.115 -.133 .073 .088Uncertainty Avoidance .057 .301* .218 -.057 -.174Long-Term Orientation .106 .443** .442** -.106 -.442**Indulgence .217 -.300** -.558** -.217 .225
Indulgence (IND) Defines in general the happiness of a country. Coun-tries scoring high in this dimension are related to a society that allows rel-atively free gratification of basic and natural human desires related to en-joying life and having fun (e.g., be in control of their own life and emotions).Whereas low scoring countries show more controlled gratification of needsand regulate it by means of strict social norms
4 Experiments and Results
A correlation analysis was performed to indicate the relationship betweenHofstede’s cultural dimensions and the diversity measurements, cf. Table 3.Spearman correlation (r ∈ [-1,1]) is reported as the correlation coefficientto indicate the strength of the relationship. Statistically significant results ata level of p < 0.05 and p < 0.01 are denoted by * and **, respectively.
Investigating the table, we find moderate, highly significant correlations be-tween the cultural dimension of individualism and the volume-based diver-sity measures. This correlation is positive for absolute volume (Vol. abs.)and negative for the mean and standard deviation of the volume measuresthat take actual playcount values into account (respectively, Vol. µ andVol. σ). It seems reasonable that listeners from cultures in which individual-ism is important show higher diversity in terms of numbers of distinct gen-res they listen to. The negative correlation to the playcount-based volumemeasures signifies that these listeners do not listen only to a few genresvery intensely (which would result in a higher Vol. µ and Vol. σ value), butinstead spread their music listening time slightly more evenly over variousgenres (overall, resulting in lower Vol. µ and Vol. σ scores). Interestingly,the volume measure that restricts results by the per mille threshold doesnot show significant correlations to individualism. This is presumably dueto the lower number of genres and styles considered in this case that does
123

not account for a high enough amount of individualism.
For long-term orientation, we identify moderate positive, highly significantcorrelations with both volume- and entropy-based diversity measures. Thiscan be explained by the reasonable assumption that cultures scoring highon aspects like flexibility, adaptation, and pragmatic problem-solving (ac-cording to the definition of long-term orientation) are more likely to listento more diverse music, both in terms of unique genres listened to andentropy in their music distribution over genres. These countries’ listeningevents are also more evenly spread over a variety of genres (lower Vol. σscores).
For the cultural dimension of indulgence, we observe quite interesting andmaybe surprising results. In fact, this dimension is highly significantly, neg-atively correlated to volume- and entropy-based diversity measures, in par-ticular to the latter. Therefore, citizens of countries scoring high on indul-gence, which means they tend to enjoy life and have a lot of fun, exhibit asmaller need for music diversity. This could, to some extent, be explainedby a focus on certain genres that are commonly regarded as positive andhappy, e.g., Pop, while avoiding music from dark genres, such as DeathMetal.
The aspect of uncertainty avoidance is only slightly correlated to the relativevolume diversity. Power distance and masculinity do not show significantcorrelation to any of the diversity measures.
5 Conclusions and Future Work
In the presented study, we found distinct correlations between volume- andentropy-based music diversity measures and Hofstede’s cultural dimen-sions, which showed to be in line with, and extended, prior results reportedin [8]. We identified moderate, highly significant correlations for the aspectof individualism and volume-based diversity measures. Highly individual-ist societies thus listen to more diverse genres. For long-term orientationand indulgence, we also found moderate, highly significant correlations; inthese cases not only for volume-based, but also for entropy-based diversitymeasures. For long-term orientation, this means that countries whose pop-ulation can be characterized as flexible, pragmatic, and eager to adapt tochanges show a higher level of diversity in their music consumption behav-ior. Populations characterized by high indulgence (happiness and enjoyinglife) in contrast show a significantly lower desire for music diversity.
Approaching diversity on a country level enables the creation of proxy mea-sures for personalization in situations where data is limited. For example,
124

the new user problem in recommender systems when there is not enoughbehavioral data yet to make personalization inferences with. To addressthis problem, users’ personality, among other aspects, has attracted inter-est to make inferences for personalization [4, 9, 21]. One way to extractpersonality is facilitated by the increasing connectedness of applicationsand social media (e.g., single sign-on buttons). This allows exploitationof social media data for personality acquisition, for instance, from Face-book [1, 3, 5, 15], Twitter [10, 17], or Instagram [6, 7, 20]. However, aconnection with the user’s social media account is still needed. Our resultscould be used to make inferences about the user’s diversity needs basedsolely on their country, which is often available through the user’s accountinformation.
Future work will investigate diversity formulations that also take into ac-count similarities between genres. In particular when using fine-grainedgenre terms, an approach based on extending the one presented in [16]may yield additional interesting findings. In addition, taking into consider-ation similarities and affinities between countries, e.g., via Wikipedia arti-cles [14], may allow for a more decent modeling of culture. In this studywe only focused on Hofestede’s cultural dimensions. However, althoughless comprehensive, there are other cultural dimensions (e.g., GLOBE [12]and Trompenaar’s [22] cultural dimensions) available. It would be nice toinvestigate the consistency between the different cultural dimensions in thefuture.
6 Acknowledgments
This research is supported by the Austrian Science Fund (FWF): P25655.
References
[1] M. D. Back, J. M. Stopfer, S. Vazire, S. Gaddis, S. C. Schmukle,B. Egloff, and S. D. Gosling. Facebook profiles reflect actual person-ality, not self-idealization. Psychological Science, 21:372–374, 2010.
[2] D. Bollen, B. P. Knijnenburg, M. C. Willemsen, and M. Graus. Under-standing choice overload in recommender systems. In Proceedings ofthe 4th ACM Conference on Recommender Systems, pages 63–70,Barcelona, Spain, September 2010.
[3] F. Celli, E. Bruni, and B. Lepri. Automatic personality and interactionstyle recognition from facebook profile pictures. In Proceedings of the
125
ACM International Conference on Multimedia, pages 1101–1104, Or-lando, Florida, USA, November 2014.
[4] B. Ferwerda and M. Schedl. Enhancing Music Recommender Sys-tems with Personality Information and Emotional States: A Proposal.In Proceedings of the 2nd Workshop on Emotions and Personality inPersonalized Services (EMPIRE), Aalborg, Denmark, July 2014.
[5] B. Ferwerda, M. Schedl, and M. Tkalcic. Personality traits and therelationship with (non-) disclosure behavior on facebook. In Proceed-ings of the 25th International World Wide Web Conference Companion(WWW), Montreal, Canada, April 2016.
[6] B. Ferwerda, M. Schedl, and M. Tkalcic. Predicting Personality Traitswith Instagram Pictures. In Proceedings of the 3rd Workshop on Emo-tions and Personality in Personalized Services (EMPIRE), Vienna,Austria, September 2015.
[7] B. Ferwerda, M. Schedl, and M. Tkalcic. Using Instagram Picture Fea-tures to Predict Users’ Personality. In Proceedings of the 22nd Interna-tional Conference on MultiMedia Modeling (MMM 2016), Miami, USA,January 2016.
[8] B. Ferwerda, A. Vall, M. Tkalcic, and M. Schedl. Exploring Music Di-versity Needs Across Countries. In Proceedings of the 24th Interna-tional Conference on User Modeling, Adaptation and Personalization(UMAP), Halifax, Canada, July 2016.
[9] B. Ferwerda, E. Yang, M. Schedl, and M. Tkalcic. Personality TraitsPredict Music Taxonomy Preferences. In ACM CHI ’15 Extended Ab-stracts on Human Factors in Computing Systems, Seoul, Republic ofKorea, April 2015.
[10] J. Golbeck, C. Robles, M. Edmondson, and K. Turner. Predicting Per-sonality from Twitter. In Proceedings of the 3rd IEEE InternationalConference on Social Computing (SocialCom), Boston, USA, October2011.
[11] G. Hofstede, G. J. Hofstede, and M. Minkov. Cultures and Organiza-tions: Software of the Mind. McGraw-Hill, USA, 3rd edition, 2010.
[12] R. J. House, P. J. Hanges, M. Javidan, P. W. Dorfman, and V. Gupta.Culture, leadership, and organizations: The GLOBE study of 62 soci-eties. Sage publications, 2004.
[13] S. Kitayama and H. Park. Cultural Shaping of Self, Emotion, and Well-Being: How Does It Work? Social and Personality Psychology Com-pass, 1(1):202–222, 2007.
126

[14] P. Laufer, C. Wagner, F. Flöck, and M. Strohmaier. Mining cross-cultural relations from Wikipedia — A study of 31 European food cul-tures. In Proceedings of the ACM Web Science Conference (WebSci),Oxford, UK, June–July 2015.
[15] G. Park, H. A. Schwartz, J. C. Eichstaedt, M. L. Kern, M. Kosinski,D. J. Stillwell, L. H. Ungar, and M. E. Seligman. Automatic PersonalityAssessment Through Social Media Language. Journal of Personalityand Social Psychology, 108, November 2014.
[16] M. Park, I. Weber, and M. N. amd Sarah Vieweg. Understanding Mu-sical Diversity via Online Social Media. In Proceedings of the 9th AAAIConference on Web and Social Media (ICWSM), Oxford, England, UK,May 2015.
[17] D. Quercia, M. Kosinski, D. Stillwell, and J. Crowcroft. Our twitter pro-files, our selves: Predicting personality with twitter. In Proceedings ofthe 3rd IEEE International Conference on Social Computing (Social-Com), Boston, USA, October 2011.
[18] M. Schedl. The LFM-1b Dataset for Music Retrieval and Recommen-dation. In Proceedings of the ACM International Conference on Multi-media Retrieval (ICMR), New York, USA, June 2016.
[19] B. Scheibehenne, R. Greifeneder, and P. M. Todd. Can there ever betoo many options? A meta-analytic review of choice overload. Journalof Consumer Research, 37(3):409–425, 2010.
[20] M. Skowron, B. Ferwerda, M. Tkalcic, and M. Schedl. Fusing SocialMedia Cues: Personality Prediction from Twitter and Instagram. InProceedings of the 25th International World Wide Web ConferenceCompanion (WWW), Montreal, Canada, April 2016.
[21] M. Tkalcic, B. Ferwerda, D. Hauger, and M. Schedl. Personality Cor-relates for Digital Concert Program Notes. In Proceedings of the 22ndInternational Conference on User Modeling, Adaptation and Personal-ization (UMAP), Dublin, Ireland, June–July 2015.
[22] F. Trompenaars and C. Hampden-Turner. Riding the Waves of Culture— Understanding Diversity in Global Business. McGraw-Hill Educa-tion, 3rd edition, 2012.
[23] M. C. Willemsen, B. P. Knijnenburg, M. P. Graus, L. C. Velter-Bremmers, and K. Fu. Using latent features diversification to reducechoice difficulty in recommendation lists. In Proceedings of the Rec-Sys 2011 Workshop on Human Decision Making in RecommenderSystems, Chicago, USA, October 2011.
127

6 Implicit Acquisition of Users’ PersonalCharacteristics From Social Media
Ferwerda, B., Schedl, M., & Tkalcic, M. (2014) To Post or Not toPost: The Effects of Persuasive Cues and Group TargetingMechanisms on Posting Behavior. In Proceedings of the 6thInternational Conference on Social Computing (Stanford, CA,US).
Ferwerda, B., Schedl, M., & Tkalcic, M. (2015) Predicting Person-ality Traits with Instagram Pictures. In Extended Proceedingsof the 9th ACM Conference on Recommender Systems: 3rdWorkshop on Emotions and Personality in Personalized Ser-vices (Vienna, AT).
Ferwerda, B., Schedl, M., & Tkalcic, M. (2016) Using InstagramPicture Features to Predict Users’ Personality. In Proceedingsof the 22nd International Conference on MultiMedia Modeling(Miami, FL, US).
Ferwerda, B., Schedl, M., & Tkalcic, M. (2016) Personality Traitsand the Relationship with (Non-)Disclosure Behavior on Face-book. In Companion Proceedings of the 25th International Con-ference on World Wide Web: 7th International Workshop onModeling Social Media (Montreal, QB, CA).
Skowron, M., Ferwerda, B., Tkalcic, M., & Schedl, M. (2016) Fus-ing Social Media Cues: Personality Prediction from Twitter andInstagram. In Companion Proceedings of the 25th InternationalConference on World Wide Web (Montreal, QB, CA).
128

To Post or Not to Post: The Effects ofPersuasive Cues and Group TargetingMechanisms on Posting Behavior
Published in: Proceedings of the 6th International Conference on Social Computing(SocialCom 2014; Stanford, CA, US)
BRUCE FERWERDA, Johannes Kepler University, Linz (AT)MARKUS SCHEDL, Johannes Kepler University, Linz (AT)MARKO TKALCIC, Johannes Kepler University, Linz (AT)
Abstract
When social network sites (SNSs) users intend to share content, theyneed to estimate the appropriateness of the content for their audience.Wrongly made estimations can result in regret about the posted con-tent. A common strategy for users to minimize regret is to self-censorcontent. However, this also means that content that would have beensafe to share may be left unshared. To solve sharing problems, SNSshave been focusing on improving group targeting mechanisms to giveusers more control over their content. As users still need to estimatethe content appropriateness themselves, we asked whether improv-ing these mechanisms is really the solution. We hypothesized thatusers’ posting decisions consist of uncertainty and therefore provid-ing guidance on whether it is safe to post would be more beneficial.To answer this we conducted two studies. In Study A we identifiedwhat kind of content users are self-censoring and what the reasonsare. Study B was used to test and compare different solutions to limitthe self-censored content found in Study A. We created a persuasivecue that predicted how the user’s audience would possibly respondto the content and compared this with the effects of a group targetingmechanism. Among 215 participants we found that posting decisionsconsist of uncertainty and that persuasive cues are a more effectivemeans to limit self-censorship, but can also warn users of content thatis not safe to post. Making use of such cue can improve SNSs’ socia-bility and reduce regret of wrong posting decisions.
Keywords: Persuasive Cues, Posting Behavior, Censoring, SocialNetworks
129

1 Introduction
Social network sites (SNSs) are rapidly growing with the adoption spread-ing out across a wide audience [8]. This continuous adoption have beenchanging online social practices and experiences [12]. The encouragementof sociability resulted in a growing social diversity in the user’s social net-work. SNSs like Facebook have become an "all-friends-in-one-place" so-lution, meaning a larger number of social connections with a mix of strongand weak ties [9].
The trend of becoming an all-friends-in-one-place environment can createa "privacy dilemma," i.e., a conflict between the privacy needs of individualsand the need for sociability and content sharing. When privacy is protected,sociability and content sharing will be compromised and vice versa. In bothcases the outcome is undesirable [9]. Previous research argued that theseproblems are exacerbated because users are experiencing difficulties toshare content with specific groups in their social network [9, 17, 22]. As aresult, users self-censor to anticipate regret of wrongly posted content [24];they adjust their posting or eventually decide not posting at all. Sleeper etal. [22] found that reasons for self-censoring behavior are mainly concen-trated around the anticipated feelings or opinions of the user’s audience(e.g., not wanting to start an argument, worried to offend or hurt someone,feeling that the content would be boring or redundant, or feeling that thecontent went against the way users wanted to present themselves). Thissuggests that the reason for users to start censoring their content may notbe the difficulties to target specific groups, but the perception users createon how their audience will respond to the posted content. Therefore, usersmay not seek a better way to target groups in their network to share con-tent with when considering to post content, but a way to assure how theiraudience will respond to the content they want to post instead. Being ableto target specific groups in an ever growing social network may rather be astrategy of users in order to better predict how their audience will respondto the content by shrinking the audience to a manageable size.
We created an online experiment to test this hypothesis in which we set upa persuasive cue that provide users with possible responses on the contentagainst a group targeting mechanism. By comparing these two methodsagainst each other we investigated the behavioral change these methodscan induce in posting decisions and gain deeper insight in the underlyingmechanisms of posting behavior. These insights provide knowledge on howto help users to make better posting decisions. This is important as SNSsare intended for people to create and share content about themselves as aresult of voluntary disclosure among multiple users [16]. Wrongly made de-cisions in the posting process affects the functionality of SNSs: not posted
130
content that should have been posted jeopardizes SNSs functionality as itlimits sociability, while posted content that should not be posted contributesto regret of the poster.
2 Related work
In this section we discuss users’ behavior when considering sharing con-tent on SNSs. We continue the related work with how users are judging theappropriateness of the content followed by their strategy to reduce regretof posted content. Finally, we discuss recent work that tries to overcomesharing difficulties.
Behavior on SNSsUsers have difficulties in defining their social connections. The "friend" cat-egory in SNSs is very broad and ambiguous. Most users tend to list anyonethey have met during the course of their lives and do not actively dislike [6].This kind of behavior results in that the user’s social network include a mixof strong and weak ties [13]. SNSs have created extensive sets of privacycontrols that allow users to interact at different levels of sociability. Despitethese privacy controls, users are not utilizing the privacy settings provided[5]. Although users are not utilizing the privacy settings, they still activelyshare their content [11]. The content considered for sharing undergoes theevaluation of possible regret. Shared content becomes regret because ofunforeseen or ignored consequences, such as they want to be perceived infavorable ways, they do not think about the consequences of their post, ormisjudge the culture and norms within their network [24].
The imagined audienceWhen considering content to share, users have a sense of audience. Straterand Lipford [23] found that the user’s perceived audience shrinks over time;as users interact more with a certain group they start to perceive them astheir primary audience and pay less attention to others. This behavior sug-gests that connections other than the user’s perceived audience becomeless significant over time, thus also less important to take into considera-tion to share content with.
Users create an "imagined" audience to estimate the appropriateness ofthe content presentation [19]. They use cues from their social media en-vironment to construct and augment knowledge about their audience [7].However, as the interpretation of these cues are subjective, the createdimage may not be accurate and can be deviated from the actual read-
131

ers. When the environment involves higher interaction with its readers,the awareness of the imagined audience becomes more prominent andthereby the specifics becomes more important [19]. A deviated image ofthe audience can therefore become problematic. Especially in SNSs wheresharing is part of being social, the possible misconception users create cansignificantly influence the way users share their content.
Self-censorshipOne of the strategies to minimize the risk of regret is to self-censor content[19, 22, 24]. Although self-censorship is an effective strategy to prevent re-gret, it also increases the chances that content that would have been safeis left unshared. In a qualitative study by Sleeper et al. [22] in the U.S.,most commonly found content subject to self-censoring is external content(e.g., entertainment, politics) followed by personal opinions and updates.The most important reason connected to these contents is to control theself-presentation. To a slightly lesser extent, other reasons of censoringcontent were found: users did not want to start an argument or discussion,or were afraid to be boring or repetitive. These self-censoring reasons ap-ply to almost half of the content considered to be shared [22].
Privacy settingsTo help users in their sharing decisions, research has focused on provid-ing different methods to increase control and transparency of disclosurebehavior. Extensively investigated are methods to improve group targetingsettings, such as machine-learning solutions [3] as well as ways to giveusers more control about what to share and with whom [21]. A recentsystem providing an advanced sharing method are "circles" on Google+[17]. Although such settings provide users with more control, they do nothelp prevent users posting content that they should not post. Additionally,research about privacy settings indicate that users often do not use thecustom privacy settings available, but adhere to standard settings instead[22, 23, 24]. These standard settings provide an "all or nothing" situation.Users are able to set their information open to everybody or protecting theirwhole profile by utilizing the setting to restrict it to "friends only." Althoughusers choose for a specific setting, they still deliberately choose to self-censor information and not share content [23].
Persuasive cuesSome studies have been focusing on accommodating persuasive cues byproviding a justified reason for the user to disclose information, such asgiving a reason why it would be better to disclose [10], or appealing tothe social norm by displaying what others have done [1, 4, 20]. The pre-
132

sentation of these kind of persuasive cues have been studied in differentways. For example Patil, Page, and Kobsa [20] used a descriptive wayto present the aggregated privacy choices of one’s social circle, while Be-smer, Watson, and Lipford [4] chose for a visual approach to display thesocial norm.
3 The actual sharing problem
Based on the just discussed literature, we can conclude that improvinggroup targeting mechanisms may not be the right solution as users do notmake sufficiently use of them. Even if users choose a setting, they stillrely on what they think is acceptable. Ajzen [2] defines this influence onthe decision making as the subjective norm in which behavior is influencedby the perceptual judgments and beliefs of relevant others about the in-tended behavior. Results of previous research on SNSs indeed suggestthat the underlying reasons for users to start censoring their content arethe perceptions they create about responses of their audience on the con-tent [19, 22, 23, 24]. What is shared is judged on its perceived safenessand appropriateness, as well as what is considered to be socially accept-able and normal within their social network [23]. As these judgments aresubjectively created by the user, they are uncertain to some extent.
The work in this study is based on the assumption that posting decisionsconsist of uncertainty. We believe that by presenting a cue that providespossible responses of the user’s audience on the content, we can minimizethat uncertainty. Providing such cue will help users in their decision mak-ing process and prevent them from wrongly censoring or posting content.To the best of our knowledge, the usage of this kind of cues has not yetbeen explored in the context of content sharing. Our study was designedto answer the following main questions:
1. Will presenting possible responses of the audience change postingbehavior in compliance?
2. Will providing a group targeting mechanism in a self-censoring statechange posting behavior?
3. When in a self-censoring state, will presenting responses have astronger effect on behavioral change than a group targeting mech-anism?
Users create a subjective judgment about what is acceptable within the au-dience to which the content is shown. Therefore, we expect that when usersknow how the audience will possibly respond on the content, they will ad-
133

just their posting behavior towards the polarity of the responses. Presentingresponses of the user’s audience on the content will reduce self-censoringbehavior, but also warns users of posting content that they should not. Inboth cases, this cue reduces regret of a wrongly made decision.
We expect group targeting mechanisms to alleviate self-censoring prob-lems to some extent. By using group targeting mechanisms, users aregaining more control over their content. That is, to whom they share thecontent with. By targeting specific groups in the network, users are able toshrink their ever growing social network to a size in which they can makemore easily judgments about the appropriateness of the content. We ex-pect that it only alleviates the self-censoring problem partly, hence the ap-propriateness estimation of the content is still subjectively created by theuser. Thus, giving users more control will have a smaller effect comparedto presenting possible responses of the audience.
Given that we expect both methods to have a positive effect on posting de-cisions, there may be an accumulation of the effect size when both methodsare combined. We expect that combining the methods will provide a posi-tive interaction effect.
4 Methodology
The experiment that would provide insights in posting behavior was con-ducted in two steps, which we will refer to as Study A and Study B. Thegoal of Study A was to identify 1) content for posting, and 2) reasons forcensorship. We used these outcomes in the design of Study B, where weobserved the actual posting and censorship behavior. In Study B, we putthe user in a posting position for a selected content. Then the participantwas subjected to a self-censorship inducing scenario and put in one ofthe experimental conditions. Afterwards, the participant was asked again ifthey wanted to post the content. The difference between the first postingposition and the second were the observed behavior changes.
4.1 Study A
In order to acquire the desired data (content for posting and reasons forcensorship) we followed the experiment design laid out by Sleeper et al.[22]. The workflow of the study is depicted in Fig. 1.
We recruited 21 university students (8 males, aged between 20 26 years,median age 22 years) for a one week diary study and a concluding in-
134

Questionnaire
interviewsPost-study Analyses
Yes
No
Post?Consider to post content
Figure 1: Study A: Workflow
terview. Participants were asked to fill-in a questionnaire every time theyself-censored a content posting on Facebook. The questionnaire consistedof three questions: 1) context of the content, 2) content type (e.g., photo,video etc.), and 3) reason for censoring. After a week of reporting postingcensorship, participants were invited for a post-study semi-structured inter-view where they discussed in more details the censored content and thereasons for censorship.
4.1.1 Data Coding and Analysis
The goal of data coding was to map the raw data from the diary study andinterviews into a set of self-censored contents and reasons. The results ofcoding are reported in Fig. 2 and Fig. 3.
In total, participants reported 88 self-censored contents in the diary study.Following the coding scheme of Sleeper et al. [22], coding took place infour steps: 1) two researchers coded half of the content each, 2) basedon these codes, the researchers created a set of higher level codes, 3)these were used to code the remaining halves (for each researcher), and4) disagreements and inconsistencies were discussed jointly.
4.1.2 Results
Participants self-censored various kind of content (see Fig. 2). Most cen-sored contents in our sample were about personal opinions and updates.Personal opinions were mostly about how participants felt about specific
135

0 5 10 15 20 25 30 35 40
News & politics
Entertainment
Personal updates
Personal opinions
Figure 2: Number of self-censored content by type.
0 5 10 15 20 25 30Inconvenience
ArgumentPrivacyOffend
SupportBoring
Self-presentation
Figure 3: Number of self-censored reasons by type.
things happening in their life whereas personal updates were in generalabout happenings of participants throughout the day. These were mainlyexpressed as status updates on Facebook. Next to personal content, en-tertainment content (i.e., music, humoristic, sports, and fashion items) aremost commonly censored. Finally, to a much lesser degree participantsself-censored political and news items.
Responses of participants about the reason of self-censoring could beplaced in one of the following categories (see Fig. 3):
• Self-presentation: worried that the content would hurt their own pre-sentation.
• Boring/repetitive: concerned that the content would be perceived asboring or repetitive.
• Support/sympathy: worried that friends would not respond on thecontent (comment or like).
• Argument: did not want to get involved into an argument about thetopic with anybody.
• Offend: felt that the content may hurt somebody.
• Privacy: felt that the content would violate privacy of others.
136

• Inconvenience: too much effort to post the content.
The main reason for participants to censor their content is because of self-presentation concerns. This is for a big part related to the personal opin-ions and updates categories. Participants were mainly worried that postingsomething about themselves would possibly create a negative image to-ward others. Other significant reasons is the believe that the content wouldbe perceived as boring, or that they would not get the appropriate supportand sympathy from others. To a lesser degree participants were worriedabout privacy, creating an argument, or offending someone.
In the interviews we additionally asked participants if they would post theself-censored content under different circumstances, such as being able totarget specific groups in their network or if they would know how their socialnetwork would possibly respond. Striking was that all the participants saidthat for personal opinions and updates that there was nothing to changetheir decision. For all other content, participants seemed to be more openminded. Furthermore, we asked participants about disclosure concernswith certain groups in their social network. Depending on the content type,most participants expressed concerns about sharing content with some ofthe groups in their network except for "close friends." Participants did notshow concerns about disclosing any content with this group.
4.1.3 Discussion
Our goal in this study was to better understand the contents and reasonsfor self-censoring behavior. Additionally, as our study took place with SouthKorean participants, previous findings of Sleeper et al. [22] gave us theopportunity to explore possible cultural differences. Most of our findingsshow agreements with the results of previous research. Although we foundless varied content, the content types we found are in line with the findingsof Sleeper et al. [22] among U.S. participants. Furthermore, a resemblancecan be seen in the order of the major categories. The less variation in ourstudy may be explained by the age range and occupation variation of oursample. We focused on university students between 20 and 30 only, whilethe sample of Sleeper et al. [22] varied in their occupation and age (20-51).Still, similar self-censoring reasons were found.
A compelling additional reason we found among South Koreans is the con-cern for support and sympathy. Our participants expressed a substantialconcern of getting no responses on their postings. This longing for supportand sympathy may be connected to cultural dimensions. As most Asiancultures, Koreans tend to have a collectivistic nature that may explain theimportance of this reason [15]. Despite this difference, our findings show
137

in general similar trends between Americans and Koreans indicating thatcultural differences may not be so prominently present as thought.
4.2 Study B
Study B represents the core experiment with which we wanted to get in-sights into how a group targeting mechanism and a response prediction onthe content can influence the posting behavior. We developed an online ex-periment where the users 1) first chose a content, then 2) decided whetherto post it or not, then 3) were subjects to a manipulation (we had manip-ulations dealing with user groups and with predicted response; see §4.2.1for details), and finally 4) decided again whether to post the content or not.This experiment design, outlined in Fig. 4, allowed us to gather the dataneeded to make the conclusions to our initial research questions.
9 videoclips
Participantpicks a clip
Video clips Scenarios(Study A)
Presentingscenario Post?
Yes
No
1.1
1.2
2.1
2.2
1.1
1.2
2.1
2.2
Post?
Yes
No
Post?
Yes
No
Samebehavior
Changedbehavior
Changedbehavior
2x2 factorialdesign1.1 1.22.1 2.2
(Study A)
Samebehavior
Figure 4: Study B: Workflow
We recruited 215 participants (104 males, age ranging from 20 to 30 years,median age 24 years) among university students in South Korea. Par-ticipants were asked to post content through a Facebook-like web appli-cation. The application was a visual clone of Facebook running on ourserver.
In a pre-step we chose five groups that were to be used in some of themanipulations (see §4.2.1). Participants were asked to define two groupsof friends out of their social network. In addition to these two groups weadded three more: friends, public (default Facebook groups), and the groupclose friends (participants in Study A suggested that they would have had
138

a different posting behavior if there was the possibility to target such agroup).
In the next step we put the user in a self-censoring situation. Self-censoringis one of the possible results of a decision made about content that usersare considering to post. In other words; when a user has a positive atti-tude to post the content but feels hesitant to continue the posting. Basedon the outcomes of Study A (see §4.1.2), we selected the set of contentsthat were offered for posting to the participants. This set was composedof 9 different video clips of roughly 1 minute of length: movie (2x), music(2x), humor (2x), TV-series (1x), politics (1x), and news (1x). Participantschose one of the content items that they would consider to share. Thisensured the necessary positive attitude towards posting the content. Toensure the possibility to hesitate on posting the content, participants werethen presented with a reason for not posting (chosen from the set of rea-sons collected in Study A; see §4.1.2) and were asked whether they wantedto post the content. If the participant decided not to post, self-censorshiphas occurred as the participant had a positive attitude to post by choosingtheir own content.
In the next step the participants were exposed to one of the four conditionsthat could have an effect on their posting behavior. After being exposed tothe conditions the participants were asked again if they wanted to post thecontent. For each participant, the experiment flow was designed in such away that they were exposed to all four conditions in a random order.
4.2.1 Manipulations
We wanted to observe the influence of two factors on the posting behav-ior: a) group targeting mechanism, and b) predicted audience’s response.Hence we used a 2x2 within-subject factorial design consisting of the follow-ing manipulation conditions (see Tab. 1): (1.1) with group targeting mech-anism and with predicted audience’s response, (1.2) with group targetingmechanism only, (2.1) with predicted audience’s response only, and (2.2)without manipulation (control condition). Using a within-subject design theparticipants went four times through the procedure. For each round thecontent choices, as well as the reasons for self-censoring, differed. To can-cel out order effects, participants were randomly assigned to one of theconditions until all four were met.
Audience’s response predictionThis condition was designed to present possible responses of the user’ssocial network members. In order to effectively capture the effect of themanipulation, we designed it to oppose the participant’s choice of posting.
139

Condition Group targeting mechanism Predicted audience response(1.1) Yes Yes(1.2) Yes No(2.1) No Yes(2.2) No No
Table 1: Manipulations
Since participants could choose whether or not to follow the self-censoringscenario, we created two different textual messages based on work of Patilet al. [20]: 1) positive/comforting message, and 2) negative/warning mes-sage. When participants decided to censor the content, a comforting mes-sage was presented trying to change their decision (e.g., "We analyzedyour social network and based on their [participant’s audience] responseson similar content they would like this posting."). A warning message waspresented when participants did not censor their content. That is, whenthey decided to post the content regardless the self-censoring scenarioprovided (e.g., "We analyzed your social network and based on their [par-ticipant’s audience] responses on similar content they will not like this post-ing."). Next to the text messages, we also included a visual method (basedon work of Besmer et al. [4]) where we used a bar indicating the percentageof the user’s social network that would like the posting. For the comfortingmessage we set the bar on 95%, and for the warning message we set thebar on 5%. This condition alone was present in the manipulation ((2.1); seeTab. 1).
Group targeting mechanismIn this condition we displayed the five groups of users (two participant gen-erated groups, public, friends, and close friends) and required the subjectto choose one of the groups when posting the content. We did not definea default group in order to avoid situations in which participants would justclick through or get influenced by the default option. This condition alonewas present in the manipulation ((1.2); see Tab. 1).
Combined audience’s response prediction and group targeting mech-anismWe combined the audience’s response prediction messages and the grouptargeting mechanism condition in order to investigate the existence of anaccumulative effect. Both conditions were presented in the manipulation((1.1); see Tab. 1).
140

ControlTo ensure that the observed effects are not due to the fact that participantscould think their previous decision over, we included a control condition.This condition gave participants the opportunity to change their previousposting decision without the addition of a guiding message or added func-tionality. To this end, we provided just a message asking if they wanted tochange their previously made decision.
4.2.2 Measurements
In order to investigate the behavioral change the conditions induce in post-ing behavior, we captured three variables: 1) the posting behavior of partic-ipants before the condition presented (post or not post), 2) the experimentalcondition presented to the participants (i.e., (1.1), (1.2), (2.1) or (2.2)), and3) the posting decision after the condition presented (post or not post). Theinfluence of the condition was measured by whether participants changedtheir posting decision after the condition was presented. Additionally, togain a better understanding about the final posting decision made by theparticipants, we asked them to write down the reasons for their behav-ior.
4.2.3 Results
As we gave participants the choice to follow the self-censoring scenario wecreated, or to ignore it, we obtained different starting posting behaviors.We divided our analyses in order to investigate the behavioral change ofthe manipulations on not posting (self-censoring) and posting behavior. Inthis section we first discuss the results of participants that followed the self-censoring scenario. That is, whether the manipulations could induce a be-havioral change from self-censoring (not posting) to posting. We continuewith the results of our analysis where we discuss the results of participantsthat ignored the self-censoring scenario. In other words, whether the ma-nipulations could induce a behavioral change from posting to not posting(self-censoring).
In general, our interest was the effect of the manipulations on posting be-havior and the effect size of each. We performed a repeated measureslogistic regression to test this, by using a generalized linear model (GEN-LIN) with a binomial distribution and a logit link function.
Not posting (self-censoring)In this section we present our results with the self-censoring cases (n = 90).
141

The GENLIN’s goodness-of-fit is reflected in the quasi likelihood criterion(QIC = 188.434) and the corrected quasi likelihood under independencemodel criterion (QICC = 118.631). A low difference between QIC andQICC indicates that the model has a good correlation structure and thepredictors obtained fit the model well.
To investigate the effects of the logistic regression, odds ratios (OR) arereported. We first assessed the baseline odds (control condition) in or-der to see the effects of the manipulation conditions. When participantsdid not receive the audience’s responses on the content nor able to targetspecific user groups in their social network, we found the odds that theychanged their initial posting decision (censoring) to be 0.207 (CI = 0.076to 0.564, Wald Chi-Square = 9.479, p = 0.002). In other words, when par-ticipants were just given the opportunity to readjust their decision, 0.207participants decided to change their posting decision for every participantthat did not. The lack of a higher odds ratio in a certain direction supportsour assumption that posting decisions in a self-censoring state is uncertainas participants’ posting decision fluctuates.
Exploring the effect of presenting participants with possible responses oftheir audience, we found an increase of the baseline odds. When partici-pants knew how their audience would respond on the to be posted content,the baseline odds increased by a factor 9.302 (CI = 2.548 to 33.955, WaldChi-Square = 11.397, p = 0.001). This means that the odds of participantschanging their initial posting decision in this condition is 1.93. We alsofound an increase of the baseline odds when participants were only givena group targeting mechanism. The baseline odds increased by a factor5.375 (CI = 1.748 to 16.529, Wald Chi-Square = 8.609, p = 0.003). In otherwords, the odds of participants posting their content when they could tar-get specific groups is 1.11. Given these results, we can conclude that bothconditions induce a posting decision change. However, the odds are higherwhen participants knew how their audience would respond.
The interaction effect of combining the two manipulation conditions showa minimal change in the odds ratio (OR = 0.015, CI = 0.042 to 0.563,Wald Chi-Square = 7.968, p = 0.005). This suggest that there is an effectbetween knowing how the audience would respond and being able to targetuser groups. However, the odds increase is negligible small.
The choice that participants could make between different content typescould have played a role in the effect of the conditions. To investigate this,we dummy coded the content type in order to add them as a covariate. Theonly (marginally) significant results were found for political (OR = −0.131,CI = 0.016 to 1.061, Wald Chi-Square = 3.626, p = 0.057) and news items(OR = −0.241, CI = 0.056 to 1.033, Wald Chi-Square = 3.671, p = 0.055).Surprising is the negative odds ratio of both items, indicating a decrease
142
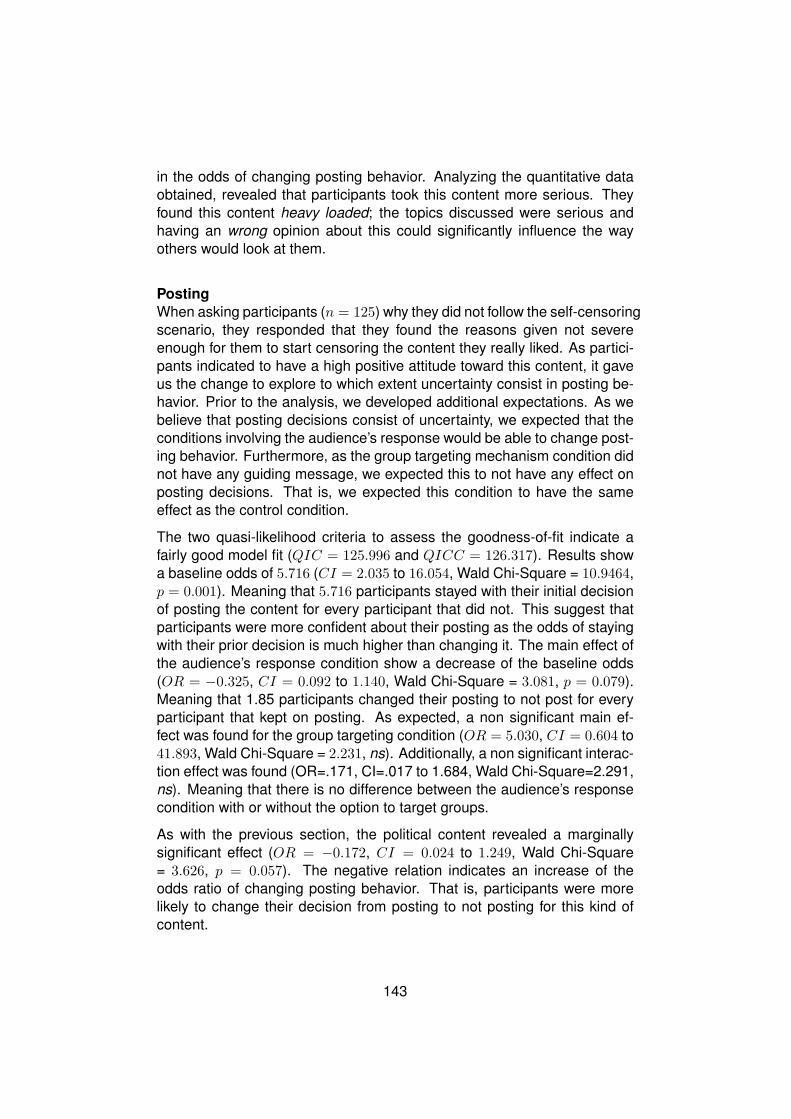
in the odds of changing posting behavior. Analyzing the quantitative dataobtained, revealed that participants took this content more serious. Theyfound this content heavy loaded; the topics discussed were serious andhaving an wrong opinion about this could significantly influence the wayothers would look at them.
PostingWhen asking participants (n = 125) why they did not follow the self-censoringscenario, they responded that they found the reasons given not severeenough for them to start censoring the content they really liked. As partici-pants indicated to have a high positive attitude toward this content, it gaveus the change to explore to which extent uncertainty consist in posting be-havior. Prior to the analysis, we developed additional expectations. As webelieve that posting decisions consist of uncertainty, we expected that theconditions involving the audience’s response would be able to change post-ing behavior. Furthermore, as the group targeting mechanism condition didnot have any guiding message, we expected this to not have any effect onposting decisions. That is, we expected this condition to have the sameeffect as the control condition.
The two quasi-likelihood criteria to assess the goodness-of-fit indicate afairly good model fit (QIC = 125.996 and QICC = 126.317). Results showa baseline odds of 5.716 (CI = 2.035 to 16.054, Wald Chi-Square = 10.9464,p = 0.001). Meaning that 5.716 participants stayed with their initial decisionof posting the content for every participant that did not. This suggest thatparticipants were more confident about their posting as the odds of stayingwith their prior decision is much higher than changing it. The main effect ofthe audience’s response condition show a decrease of the baseline odds(OR = −0.325, CI = 0.092 to 1.140, Wald Chi-Square = 3.081, p = 0.079).Meaning that 1.85 participants changed their posting to not post for everyparticipant that kept on posting. As expected, a non significant main ef-fect was found for the group targeting condition (OR = 5.030, CI = 0.604 to41.893, Wald Chi-Square = 2.231, ns). Additionally, a non significant interac-tion effect was found (OR=.171, CI=.017 to 1.684, Wald Chi-Square=2.291,ns). Meaning that there is no difference between the audience’s responsecondition with or without the option to target groups.
As with the previous section, the political content revealed a marginallysignificant effect (OR = −0.172, CI = 0.024 to 1.249, Wald Chi-Square= 3.626, p = 0.057). The negative relation indicates an increase of theodds ratio of changing posting behavior. That is, participants were morelikely to change their decision from posting to not posting for this kind ofcontent.
143
4.2.4 Discussion
In Study B we investigated three different methods to influence users’ post-ing decisions on SNSs by presenting: possible responses of the user’saudience, group targeting mechanism, and a combination of the two meth-ods. Our results show that all three methods have an effect on users’posting decisions. By comparing these different methods, we were ableto get a deeper understanding about the needs of users when posting con-tent. Looking at the effect of each method, knowing whether their audiencewould like the posting seem to be more beneficial for users than able totarget specific groups in their social network. It gives support to our notionthat users are uncertain in their posting decisions as they were easily influ-enced. This uncertainty is highlighted in the results of the control conditionin the self-censoring condition. Results showed that participants frequentlyreconsidered their self-censoring behavior when they were given the op-portunity. When participants already decided to post the content, they wereless prone to reconsider and were more likely to stick with their posting.They seem to be confident and sure about the content. However, this con-fidence is still affected when presented with how their audience would re-spond to the content. When participants knew that the content would notperceived well, they started to come back at their posting decision.
Despite the fact that all three methods provided significant results on behav-ioral change, we found no support for our expectation of an accumulativeeffect for the combined condition. This may be explained by the fact thatwe guided participants to share content with the close friends group. Theclose friends group was chosen because the results of Study A indicatedthat users did not perceive disclosure problems with this group. Strater andLipfort [23] noted that users are starting to see the group with which they in-teract most with as their primary audience. As users do not feel any disclo-sure problems with the close friends group, they may interact most with thisgroup already and therefore seeing this group as their primary audience.Presenting general responses of the user’s audience (audience’s responsecondition) or more specific as in the combined condition, would not make adifference for the user as they depict the same primary audience.
We also found differences among content type. These differences can beexplained by the "load." We used different content genres that can be di-vided in two groups: 1) heavy loaded content, and 2) light loaded content.The heavy loaded content are more about serious items and comprisedpolitical and news content types. Movie, music, humoristic, and TV-seriesfall in the light loaded content category as they consist of frivolous andentertaining items. Participants tend to respond differently to possible re-sponses of their audience depending on this content load. Our results in-
144

dicate that a comforting message has less effect on heavy loaded contentthan a warning message. This suggest that for this kind of content, usersare more cautious and prefer to err on the safe side when having the sightli-est doubt. The quantitative data we obtained about the reasons for partic-ipant’s final posting decision indicate that the content load indeed plays aprominent role. Especially for the political content, participants were verycareful by expressing their opinion as it indicates their political side. Forlight loaded content, these concerns were less present. Although this kindof content can also express a certain preference, participants felt that theycould "laugh it away" when it would play against them. For this type ofcontent participants seemed to be more sensitive for a comforting mes-sage that gives them that little push to post the content. However, whenthey are feeling confident about the content, the effect of the warning mes-sage decreases. This behavior is seen when participants did not followthe self-censoring scenario we presented to them. Additionally, it can alsoexplain why a part of the participants did not follow the scenario. As theyfelt they could easily repair damage made to their self-presentation, theyfound the reasons given not severe enough to start censoring the content.This changeable behavior that we could induce by presenting possible re-sponses accentuate the uncertainty that exists when users are trying topost their content on SNSs.
5 Conclusion
Results suggest that posting behavior consist of uncertainty. Especiallywhen users are self-censoring their content, they tend to change their de-cision quite frequently when given the chance. Although users seem to bemore sure and confident about posted content, results indicate that somedegree of uncertainty still exist. Group targeting mechanisms seem to con-tribute to influence posting decisions to some extent. Improving group tar-geting mechanisms can only partly take away uncertainty by allowing usersto shrink their social network to a size that they can easily estimate thecontent appropriateness. However, users can still make wrong estimations.Results show that by providing predictions about how the audience wouldrespond to the content significantly help users to make better posting de-cisions; when to self-censor the content, or when it is safe to post. Withregards to our research questions (see §3) this means that: 1) presentingusers with possible responses of their audience do result in an adjustedposting towards the polarity of the responses, 2) group targeting mech-anisms influence posting behavior in a self-censoring state, and 3) audi-ence’s response predictions do have a stronger effect on posting behaviorthan group targeting mechanisms.
145

Additionally, the posting guidance provided by the audience’s response pre-dictions depends on the content type. Users seem to be more cautious andsuspicious of posting content that is serious and heavy loaded. Posting thiscontent can damage their self-presentation which may be difficult to repair.Therefore, users are less sensitive for positive guidances for posting, andmore sensitive for negative guidances (when there is any doubt of hurtingtheir self-presentation, they will err on the safe side of their posting behav-ior; not posting the content). For light loaded content, users can use a littlepush to persuade them to continue posting. Even if this kind of contentwill not be received well by their audience, the consequences for their self-presentation are less severe and will be more easy to repair as the contentis light and not serious. Therefore, participants seem to care less aboutwhat kind of responses the content will produce.
The effects found of giving guidance in user’s posting decisions give raiseto the question whether research should continue focusing on improvinggroup targeting mechanisms. As SNSs are made for sociability, greateradvantage should be taken of the information that can be derived from auser’s social network instead of trying to limit sociability by providing re-strictions.
6 Limitations and future work
Study A relied on qualitative, self-reported data, and a relatively small sam-ple was used. Although results seem to be consistent with findings ofSleeper et al. [22], we still lack the ability to generalize our findings. Fur-thermore, both studies (A and B) used a specific subset of actual SNSusers; university students between 20s and 30s. Brandtzaeg et al. [9] ar-gue that variation can occur among different age ranges and occupations.For example, older and younger users have other privacy perceptions andtherefore could respond differently to the manipulations we provided. To al-leviate these limitations, a bigger and wider sample need to be obtained infuture studies in order to properly map the social diversity on SNSs.
In Study B, we made use of a combined condition where we merged the au-dience’s response condition with the group targeting condition. To measurethe influence of the message effectively, we tried to guide sharing behaviortoward one specific group; close friends. An interesting direction would beto investigate the effects when given posting guidance for each user groupseparately to see if users have separate posting thresholds for different usergroups. For example, users may desire a higher percentage of approval ofthe content when considering sharing content with close friends than witheverybody.
146

Our findings could have been influenced by cultural dimensions. As wealready stressed out in the discussion of Study A, the additional reasonfound for self-censoring may be explained by the collectivistic nature ofSouth Koreans. The results of Study B need to be interpreted with someprecaution as they could have been influenced by cultural dimensions too.One explanation of our findings is that self-esteem in collectivistic culturesis not derived through idiosyncrasy [14], but rather through harmony withthe group [25]. This makes people in these cultures tend to fit in rather thanto stand out [18]. Therefore, our results could have been compromisedby participants trying to fit in by following the cue we provided (audience’sresponse and combined conditions). Future studies should try to answerthis question by using a more individualistic society.
Lastly, as we focused specifically on content sharing, our findings might bewell applicable to other areas involving information disclosure.
7 Acknowledgments
This research is supported by the Austrian Science Fund (FWF): P25655;and by the EU FP7/2007-2013 through the PHENICX project under grantagreement no.601166. Furthermore, we want to thank Sunwha Lee andYeunju Kim for their assistance.
References
[1] Acquisti, A., John, L.K., Loewenstein, G.: The impact of relative stan-dards on the propensity to disclose. Journal of Marketing Research49(2), 160–174 (2012)
[2] Ajzen, I.: The theory of planned behavior. Organizational behavior andhuman decision processes 50(2), 179–211 (1991)
[3] Amershi, S., Fogarty, J., Weld, D.: Regroup: Interactive machine learn-ing for on-demand group creation in social networks. In: Proc. CHI. pp.21–30. ACM (2012)
[4] Besmer, A., Watson, J., Lipford, H.R.: The impact of social navigationon privacy policy configuration. In: Proc. SOUPS. p. 7. ACM (2010)
[5] Bonneau, J., Preibusch, S.: The privacy jungle: On the market for dataprotection in social networks. In: Economics of information securityand privacy, pp. 121–167. Springer (2010)
147

[6] Boyd, D.: Friends, friendsters, and myspace top 8: Writing communityinto being on social network sites. First Monday 11(12) (2006)
[7] Boyd, D.: Why youth (heart) social network sites: The role of net-worked publics in teenage social life. MIT Press, Cambridge, MA(2007)
[8] Brandtzæg, P.B., Heim, J.: Why people use social networking sites.In: Online communities and social computing, pp. 143–152. Springer(2009)
[9] Brandtzæg, P.B., Lüders, M., Skjetne, J.H.: Too many facebook"friends"? content sharing and sociability versus the need for privacyin social network sites. Intl. Journal of Human–Computer Interaction26(11-12), 1006–1030 (2010)
[10] Consolvo, S., Smith, I.E., Matthews, T., LaMarca, A., Tabert, J.,Powledge, P.: Location disclosure to social relations: why, when, &what people want to share. In: Proc. CHI. pp. 81–90. ACM (2005)
[11] Debatin, B., Lovejoy, J.P., Horn, A.K., Hughes, B.N.: Facebook andonline privacy: Attitudes, behaviors, and unintended consequences.Journal of Computer-Mediated Communication 15(1), 83–108 (2009)
[12] Ellison, N.B., Lampe, C., Steinfield, C.: Feature social network sitesand society: current trends and future possibilities. interactions 16(1),6–9 (2009)
[13] Ellison, N.B., Steinfield, C., Lampe, C.: The benefits of facebookâAIJfriends:âAI social capital and college studentsâAZ use of onlinesocial network sites. Journal of Computer-Mediated Communication12(4), 1143–1168 (2007)
[14] Goncalo, J.A., Staw, B.M.: Individualism–collectivism and groupcreativity. Organizational Behavior and Human Decision Processes100(1), 96–109 (2006)
[15] Gudykunst, W.B., Matsumoto, Y.: Cross-cultural variability of commu-nication in personal relationships. Communication in personal relation-ships across cultures pp. 19–56 (1996)
[16] Joinson, A.N.: Looking at, looking up or keeping up with people?: mo-tives and use of facebook. In: Proc. CHI. pp. 1027–1036. ACM (2008)
[17] Kairam, S., Brzozowski, M., Huffaker, D., Chi, E.: Talking in circles: se-lective sharing in google+. In: Proc. CHI. pp. 1065–1074. ACM (2012)
[18] Kitayama, S., Markus, H.R., Lieberman, C.: The collective construc-tion of self esteem: Implications for culture, self, and emotion. KluwerAcademic/Plenum Publishers (1995)
148

[19] Marwick, A.E.: I tweet honestly, i tweet passionately: Twitter users,context collapse, and the imagined audience. New Media & Society13(1), 114–133 (2011)
[20] Patil, S., Page, X., Kobsa, A.: With a little help from my friends: cansocial navigation inform interpersonal privacy preferences? In: Proc.CSCW. pp. 391–394. ACM (2011)
[21] Sadeh, N., Hong, J., Cranor, L., Fette, I., Kelley, P., Prabaker, M.,Rao, J.: Understanding and capturing people’s privacy policies in amobile social networking application. Personal and Ubiquitous Com-puting 13(6), 401–412 (2009)
[22] Sleeper, M., Balebako, R., Das, S., McConahy, A.L., Wiese, J., Cranor,L.F.: The post that wasn’t: exploring self-censorship on facebook. In:Proc. CSCW. pp. 793–802. ACM (2013)
[23] Strater, K., Lipford, H.R.: Strategies and struggles with privacy in anonline social networking community. In: Proc. BCS HCI. pp. 111–119.British Computer Society (2008)
[24] Wang, Y., Norcie, G., Komanduri, S., Acquisti, A., Leon, P.G., Cranor,L.F.: I regretted the minute i pressed share: A qualitative study ofregrets on facebook. In: Proc. SOUPS. p. 10. ACM (2011)
[25] Wink, P.: Beyond ethnic differences: Contextualizing the influence ofethnicity on individualism and collectivism. Journal of Social Issues53(2), 329–349 (1997)
149

Personality Traits and the Relationship with(Non-)Disclosure Behavior on Facebook
Published in: Companion Proceedings of the 25th World Wide Web Conference (WWW2016): 7th International Workshop on Modeling Social Media (MSM 2016; Montreal, QC,CA)
BRUCE FERWERDA, Johannes Kepler University, Linz (AT)MARKUS SCHEDL, Johannes Kepler University, Linz (AT)MARKO TKALCIC, Free University of Bolzano, Bolzano (IT)
Abstract
Applications increasingly use personality traits to provide a person-alized service to the user. To acquire personality, social media trailsshowed to be a reliable source. However, until now, analysis of socialmedia trails have been focusing on what has been disclosed: con-tent of disclosed items. These methods fail to acquire personalitywhen there is a lack of content (non-disclosure). In this study we donot look at the disclosed content, but whether disclosure occurred ornot. We extracted 40 items of different Facebook profile sections thatusers can disclose or not disclose. We asked participants to indi-cate to which extent they disclose the items in an online survey, andadditionally asked them to fill in a personality questionnaire. Among100 participants we found that users’ personality can be predicted bysolely looking at whether they disclose particular sections of their pro-files. This allows for personality acquisition when content is missing.
Keywords: Facebook, Disclosure, Non-disclosure, Personality, Per-sonality Prediction
1 Introduction
Social networking sites (SNSs) are becoming increasingly connected withapplications, such as recommender systems. The interconnectedness withSNSs lets users automatically import their information to the application bymaking use of a single sign-on (SSO) mechanism to authenticate. Thisallows users to save a considerable amount of registration time, and makesthem able to use the application right away.
Before SNSs release users’ profile information to an application, usersneed to accept a consent form that states which parts of the profile is goingto be accessed by the application. Besides accessing users’ basic profile
150

information, applications often ask for additional permissions for access-ing other parts of users’ profile [2]. By granting access to other parts ofthe profile, applications are able to unobtrusively infer users’ preferencesand thereby able to provide the new user a more personalized experi-ence.
User preferences can be inferred explicitly or implicitly. For example, Face-book user profiles consist of sections where users can explicitly discloseentertainment content (e.g., music, movies, books) they like, which makesinferring user’s preferences straight forward. When explicit information isunavailable, an implicit approach can be adopted. Research has shownthat it is possible to infer personality traits from content of social mediatrails (e.g., Facebook; [1, 9, 13, 16], and Twitter; [8, 14], Instagram [5, 6]).It has been shown that personality consist of reliable cues to create proxymeasures about users’ behavior, preference, and taste (e.g., [4, 15, 17]).However, both methods heavily rely on disclosed content. When sectionsare not disclosed, and thereby, content is missing, both methods fail to inferuser preferences.
In this study we do not rely on the content of disclosed sections, but solelywhether sections are disclosed, and especially not disclosed. To inves-tigate the relationship between personality traits and (non-)disclosure be-havior, we focus on Facebook. Facebook is one of the most popular andinterconnected SNS, which in addition allows users to create an extensiveuser profile, with the ability to control for disclosure by assigning separateprivacy settings to each section. This makes Facebook a suitable platformto study the relationship between personality traits and (non-)disclosure be-havior of different user profile sections.
Our work makes several contributions. We provide insights into the rela-tionship between (non-)disclosure behavior of profile sections and person-ality traits. Our findings could be used by applications to infer personalitywhen content data is missing, hence allowing to exploit the benefits of per-sonality to address, for example, cold start problems [18], adaptive userinterfaces [7], or music recommendations [3].
We conducted an online survey where we extracted all the user’s profilesections of Facebook, and asked participants to indicate for each sectionthe items they disclose or not. Additionally, we asked them to fill in the BigFive Inventory (BFI) questionnaire in order to assess their personality.
Among 100 participants we found distinct relationships between disclosedand not disclosed user’s profile sections and personality traits. In the re-mainder of this paper we continue with the related work, materials, results,discussion, limitations and future work, and conclusion.
151

2 Related work
In this work, we focus specifically on personality traits. Personality traitshave shown to be an enduring factor with relationships to one’s taste, pref-erence, and interest (e.g., [4, 15, 17]). For example, a finding of Rawl-ings and Ciancarelli show that extraverts have a preference for pop music[15].
Several models have been developed to categorize personality, of which thefive-factor model (FFM) is the most well known and widely used. The FFMcategorizes personality into five general dimensions that describes person-ality in terms of: openness to experience, conscientiousness, extraversion,agreeableness, and neuroticism [12].
As personality is such an enduring factor, knowing one’s personality pro-vides information about a person’s taste, preference, and interest withoutthe need of directly related data. Hence, personality is a useful measure-ment for personalized systems, such as recommender systems to providean improved user experience (e.g., [3, 7, 18]). For example, Tkalcic etal. propose a method to overcome the cold start problem of new usersby incorporating personality data to enhance the nearest-neighbor mea-surement [18]. Similarly, Ferwerda et al. use personality traits to adjustthe user interface in order to match different music browsing strategies [7].Hu and Pu showed that personality-based recommender system create anadvantage (e.g., higher system loyalty of users) over systems that do notincorporate personality [10].
In order to incorporate personality information into applications, researchhas given attention to the implicit acquisition of personality from social me-dia trails (e.g., Facebook [9, 13, 16], Twitter [8, 14]). For example, person-ality has been linked to Facebook use, such as the number of friends [16].Others have shown personality correlations with natural language featureson Twitter [8, 14]. Although, prior research has been able to infer personal-ity traits from social media, they relied on content analyses. When contentdata is missing (e.g., no information is disclosed), these methods fail to in-fer personality traits. However, as personality is related to human behavior,which sections users disclose or not may provide indicators about their per-sonality. More specifically, we believe that sections that users decide not todisclose is related to certain personality traits. This provides opportunitiesto infer personality when content data is missing.
152

3 Materials
To investigate the relationship between (non-)disclosure of Facebook’s userprofile sections and personality traits, we extracted all the items availablein a user’s profile. We closely observed an average Facebook profile, andextracted in total 40 items of three different sections of a Facebook profile(i.e., about, interest, and like sections; see Table 1).
About section:1 Work2 Education3 Professional skills4 Current city5 Hometown6 Places lived7 Mobile phone8 Website9 Email10 Address11 Birth date12 Gender13 Interested in14 Religious views15 Language16 Political views17 Relationship18 Family members19 About you (e.g., short description about yourself)20 Other names (e.g., nickname)
Interest section:21 Music (i.e., listen later)22 Movies (i.e., watched and want to watch)23 TV-shows (i.e., watched and want to watch)24 Books (i.e., read and want to read)
Like section:25 Movies26 Television27 Music28 Books29 Sports teams30 Athletes
153

31 Inspirational People32 Restaurants33 Games34 Activities35 Interests36 Sports37 Foods38 Clothing39 Websites40 Other
Table 1: Facebook’s disclosure items with the correspondingsection of occurrence.
In the survey, participants were asked to indicate to which extent they dis-closed the information of the respective item (To everybody, To friends only,Custom setting, Don’t know the setting, or Don’t disclose), by answeringthe following question of the corresponding section: "In the ‘{section},’ Idisclose my {item}..." After all the disclosure questions were answered,participants were asked to fill in the 44-item BFI personality questionnaire(5-point Likert scale; Disagree strongly - Agree strongly [11]) to identify theFFM factors.
We recruited 126 participants through Amazon Mechanical Turk. Participa-tion was restricted to those located in the United States with a very goodreputation (≥95% HIT approval rate and ≥1000 HITs approved). Additionalcomprehension testing questions were used to filter out fake and carelessentries. The Mahalanobis distance was calculated to check for outliers.This left us with 100 completed and valid responses. Age (18-64, median30) and gender (49 male, 51 female) information indicated an adequatedistribution.
4 Results
To find the relationship between personality traits and disclosure behavior,we dichotomized the responses of the disclosure scale (To everybody, Tofriends only, Custom setting, Don’t know the setting, or Don’t disclose).Although we asked participants for their disclosure setting, providing a third-party application access to one’s profile disregards that. An application willhave access to the sections that a user granted access to, regardless ofthe disclosure setting in the profile. Hence, we recoded the responses "Toeverybody," "To friends only," "Custom setting," "Don’t know the setting,"
154

to 1, as this means that participants had something filled in. The "Don’tdisclose" responses were recoded as 0.
A correlation analysis was performed to indicate the relationship betweenpersonality traits and disclosure behavior (Table 2). Point-biserial correla-tion (r ε [-1,1]) is reported as the correlation coefficient. 1 Below the re-sults related to each personality trait. A positive correlation indicates thatparticipants scoring high in the personality trait show a higher tendency toengage in disclosure behavior of the respective item in their user profile,while a negative correlation indicates the opposite effect.
Openness to experience. The openness to experience factor corre-lates with several items in the "About" section. We found negative corre-lations with the "Current city" (r=-.24, p=.02), "Hometown" (r=-.25, p=.01),"Mobile phone" (r=-.22, p=.03), "Website" (r=-.22, p=.03), and "Address"(r=-.24, p=.02). Additionally, we found a relationship of openness to expe-rience with "Birth date" (r=-.018, p=.08). Negative correlations indicate adecreased tendency to engage in disclosing these items.
Conscientiousness. For the conscientiousness personality trait we foundsome relationships with items in the "About" section. We found correlationswith "Current city" (r=-.20, p=.05), "Hometown" (r=-.18, p=.07), and "Birthdate" (r=-.018, p=.07). Additionally, we found a correlation with the "Other"item in the "Like" section (r=-.19, p=.06). Results show a negative correla-tion meaning that conscientiousness participants indicated to be less likelyto disclose these items.
Extraversion. Significant correlations were found in the "About" sec-tion and extraversion. We found correlations with "Email" (r=.23, p=.02),and "Birth date" (r=-.22, p=.03). Additionally, we found several positivecorrelations with items in the "Like" section and extraversion: "Restaurant"(r=.22, p=.03), "Games" (r=.18, p=.08), "Activities" (r=.21, p=.04), "Inter-ests" (r=.17, p=.09), "Food" (r=.24, p=.02), and "Clothing" (r=.19, p=.06).Except for email and birth date, the items show a positive relationship withextraversion; indicating a higher tendency to disclose.
Agreeableness. The only correlation we found with the agreeablenesspersonality factor is with "Places lived" in the "About" section (r=-.20, p=.04).The negative correlation indicates that agreeable participantes are lesslikely to engage in disclosing this item.
1The magnitude of the reported correlations are commonly seen in personality relatedresearch [5, 8, 9, 13, 14, 16].
155

Neuroticism. A correlation was found between "Birth date" and neuroti-cism (r=.17, p=.09). The positive coefficient indicate a positive relationshipwith disclosing birth date and the neuroticism trait.
O C E A N4 Current city -.24* -.20ˆ -.08 -.08 .015 Hometown -.25* -.18ˆ -.08 -.13 -.056 Places lived -.12 -.12 -.08 -.20* -.017 Mobile phone -.22* -.12 -.01 -.05 .108 Website -.22* .01 .16 .02 -.169 Email -.16 .09 -.23* .13 -.1310 Address -.24* -.02 .14 -.04 -.1511 Birth date -.18ˆ -.18ˆ -.22* -.12 .17ˆ32 Restaurant .03 -.06 .22* -.06 .0933 Games .10 .01 .18ˆ .02 -.1334 Activities .05 .03 .21* .06 -.0835 Interests .09 -.04 .17ˆ -.06 -.0537 Foods .01 -.18 .24* .01 -.1138 Clothing -.05 -.06 .19ˆ .01 -.0940 Other -.05 -.19ˆ .08 -.09 .02
Note. ˆp<0.1, *p<0.05
Table 2: Correlation Matrix of the profile items disclosure againstthe personality traits: (O)penness, (C)onscientiousness, (E)xtraversion,(A)greeableness, (N)euroticism. Only items that show significant levels ofp<0.1 are reported.
5 Personality prediction
As we found significant correlations between personality traits and disclo-sure behavior, we explored personality prediction based on disclosure be-havior. We trained a 10-fold cross-validation regression model with 10 iter-ations by using the Radial Basis Function. To indicate the differences be-tween the predicted and observed values, we report the root-mean-squareerror (RMSE; see Table 3). The RMSE of each personality trait relates to a[1,5] scale.
156

Personality RMSE 1 2 3Openness to experience 0.73 0.73 0.68 0.69Conscientiousness 0.73 0.69 0.66 0.76Extraversion 0.99 0.95 0.90 0.88Agreeableness 0.73 0.74 0.69 0.79Neuroticism 0.83 0.95 0.95 0.85
Table 3: Personality prediction with the root-mean-square error (RMSE).Left RMSE column shows the results of the current study. Columns num-bered 1, 2, and 3 show RSME scores of Ferwerda et al. [5, 6] and Querciaet al. [14] respectively.
To see how well our prediction performs, we compared our results with priorwork of Ferwerda et al. [5, 6], and Quercia et al. [14], as they used a similarapproach for their analyses. Ferwerda et al. [5, 6] extracted personality us-ing characteristics of Instagram images, and Quercia et al. [14] uses Twitterusers’ characteristics (e.g., popularity, highly read; see Table 3). By disre-garding content and only looking at whether sections are disclosed or not,we show that we can approach similar RSME scores as prior research an-alyzing social media content. Similarly, we found the most difficult traits topredict are extraversion and neuroticism.
6 Discussion
We found that personality traits are correlated with disclosing or not dis-closing different parts of the user profile on Facebook. Most significantcorrelations are found for openness to experience, extraversion, and agree-ableness. Our results indicate a relation between openness to experienceand non-disclosure behavior in the about section of a profile, while for ex-traversion it is mainly disclosure behavior in the like section of a profile. Anon-disclosure relationship was found between the places lived and agree-ableness.
Additionally, we were able to identify some correlations with conscientious-ness and neuroticism. The conscientiousness trait shows overlapping dis-closure behavior with the openness to experience trait, whereas the neu-roticism trait shows a more distinct pattern; a positive relationship wasfound of neuroticism on disclosing the birth date.
Furthermore, we show that the extracted Facebook items can be used topredict personality traits. Comparing with prior work (i.e., [5, 6, 14]), wefound similar patterns in personality prediction; prediction is most success-
157
ful for openness to experience, conscientiousness, and agreeableness, butmore difficult traits are conscientiousness and neuroticism.
7 Limitations and future work
Although our results indicate correlations with disclosing behavior and per-sonality traits, there are also several limitations to our study. Due to con-straints of the Facebook API, we decided to use self-report measurementsto capture disclosure behavior. There is a possibility that this self-reportmeasure did not accurately capture all the disclosure behavior of partici-pants. Additionally, our sample size is relatively small (n=100). We, there-fore, adopted a more lenient significance level to reveal correlations withall personality traits. Reported findings would benefit from a larger samplesize.
By using Amazon Mechanical Turk we focused only on participants basedin the United States. However, what people disclose may be influencedby culture [19]. Future work should take cultural differences into account.Finally, we focused specifically on Facebook user profile disclosures. Inter-esting would be to see how and whether (non-)disclosure behavior on otherplatforms (e.g., Twitter, Instagram, Pinterest) are able to indicate personal-ity traits as well.
8 Conclusion
Our results suggest that personality traits can be inferred by analyzingwhether users disclose or not disclose sections in their profile. Being ableto infer personality traits without content information, enables the creationof measurements to estimate personality traits even when there is no con-tent data available. This makes it possible to facilitate personality basedapplications (e.g., [7, 18]) with personality approximations to create a per-sonalized experience.
9 Acknowledgments
This research is supported by the Austrian Science Fund (FWF): P25655;and by the EU FP7/2013-2016 through the PHENICX project under grantagreement no.601166.
158

References
[1] Back, M.D., Stopfer, J.M., Vazire, S., Gaddis, S., Schmukle, S.C.,Egloff, B., Gosling, S.D.: Facebook profiles reflect actual personality,not self-idealization. Psychological science (2010)
[2] Chia, P.H., Yamamoto, Y., Asokan, N.: Is this app safe?: a large scalestudy on application permissions and risk signals. In: WWW. ACM(2012)
[3] Ferwerda, B., Schedl, M.: Enhancing music recommender systemswith personality information and emotional states: A proposal. EM-PIRE (2014)
[4] Ferwerda, B., Schedl, M., Tkalcic, M.: Personality & emotional states:Understanding users’ music listening needs. UMAP 2015 ExtendedProceedings
[5] Ferwerda, B., Schedl, M., Tkalcic, M.: Predicting personality traits withinstagram pictures. In: In EMPIRE. ACM, New York, NY, USA (2015)
[6] Ferwerda, B., Schedl, M., Tkalcic, M.: Using instagram picture fea-tures to predict users’ personality. In: MultiMedia Modeling. Springer(2016)
[7] Ferwerda, B., Yang, E., Schedl, M., Tkalcic, M.: Personality traitspredict music taxonomy preferences. In: CHI’15 Extended Abstracts.ACM (2015)
[8] Golbeck, J., Robles, C., Edmondson, M., Turner, K.: Predicting per-sonality from twitter. In: SocialCom. pp. 149–156. IEEE (2011)
[9] Gosling, S.D., Gaddis, S., Vazire, S., et al.: Personality impressionsbased on facebook profiles. ICWSM (2007)
[10] Hu, R., Pu, P.: Acceptance issues of personality based recommendersystems. In: RecSys. ACM (2009)
[11] John, O.P., Donahue, E.M., Kentle, R.L.: The big five inventory: Ver-sions 4a and 54, institute of personality and social research. UCBerkeley (1991)
[12] McCrae, R.R., John, O.P.: An introduction to the five-factor model andits applications. J. of pers. (1992)
[13] Park, G., Schwartz, H.A., Eichstaedt, J.C., Kern, M.L., Kosinski, M.,Stillwell, D.J., Ungar, L.H., Seligman, M.E.: Automatic personality as-sessment through social media language. Journal of personality andsocial psychology 108(6), 934 (2015)
159
[14] Quercia, D., Kosinski, M., Stillwell, D., Crowcroft, J.: Our twitter pro-files, our selves: Predicting personality with twitter. In: SocialCom. pp.180–185. IEEE (2011)
[15] Rawlings, D., Ciancarelli, V.: Music preference and the five-factormodel of the neo personality inventory. Psychology of Music 25(2),120–132 (1997)
[16] Ross, C., Orr, E.S., Sisic, M., Arseneault, J.M., Simmering, M.G., Orr,R.R.: Personality and motivations associated with facebook use. Com-puters in Human Behavior 25(2), 578–586 (2009)
[17] Tkalcic, M., Ferwerda, B., Hauger, D., Schedl, M.: Personality corre-lates for digital concert program notes. UMAP 2015, Springer LNCS9146 (2015)
[18] Tkalcic, M., Kunaver, M., Košir, A., Tasic, J.: Addressing the new userproblem with a personality based user similarity measure. In: DEMRA(2011)
[19] Wang, Y., Norice, G., Cranor, L.F.: Who is concerned about what?a study of american, chinese and indian users’ privacy concerns onsocial network sites. In: Trust and trustworthy comp. Springer (2011)
160
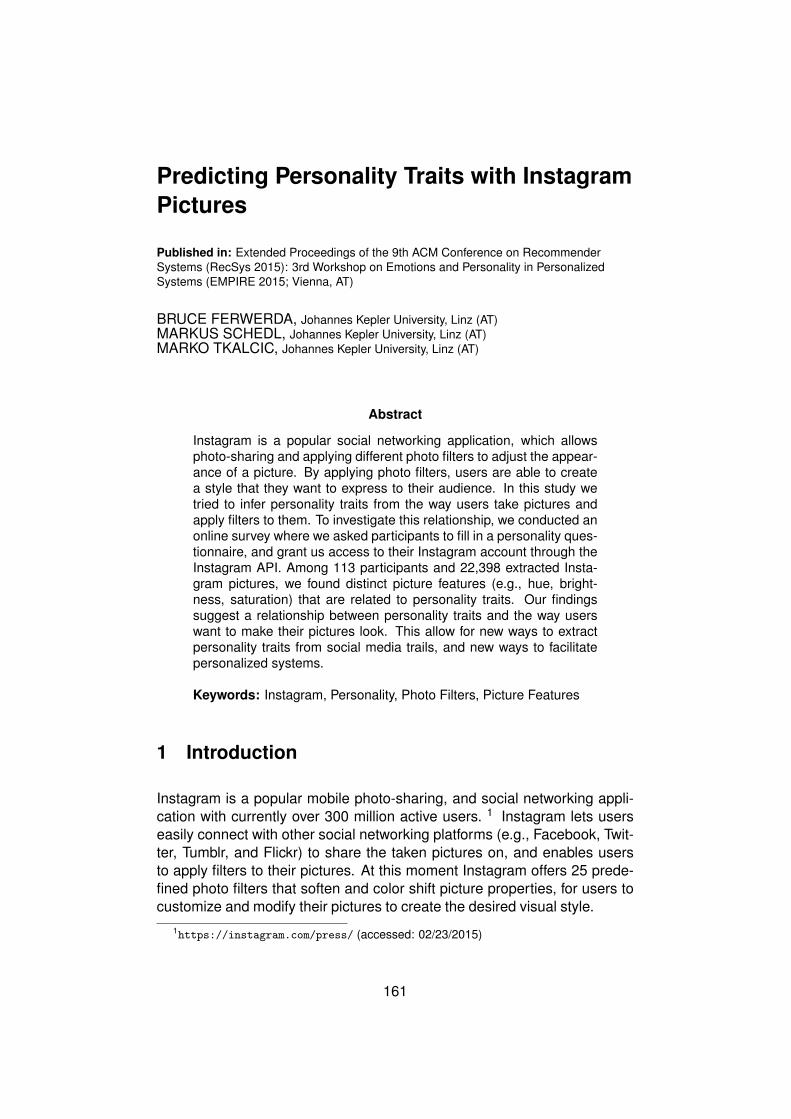
Predicting Personality Traits with InstagramPictures
Published in: Extended Proceedings of the 9th ACM Conference on RecommenderSystems (RecSys 2015): 3rd Workshop on Emotions and Personality in PersonalizedSystems (EMPIRE 2015; Vienna, AT)
BRUCE FERWERDA, Johannes Kepler University, Linz (AT)MARKUS SCHEDL, Johannes Kepler University, Linz (AT)MARKO TKALCIC, Johannes Kepler University, Linz (AT)
Abstract
Instagram is a popular social networking application, which allowsphoto-sharing and applying different photo filters to adjust the appear-ance of a picture. By applying photo filters, users are able to createa style that they want to express to their audience. In this study wetried to infer personality traits from the way users take pictures andapply filters to them. To investigate this relationship, we conducted anonline survey where we asked participants to fill in a personality ques-tionnaire, and grant us access to their Instagram account through theInstagram API. Among 113 participants and 22,398 extracted Insta-gram pictures, we found distinct picture features (e.g., hue, bright-ness, saturation) that are related to personality traits. Our findingssuggest a relationship between personality traits and the way userswant to make their pictures look. This allow for new ways to extractpersonality traits from social media trails, and new ways to facilitatepersonalized systems.
Keywords: Instagram, Personality, Photo Filters, Picture Features
1 Introduction
Instagram is a popular mobile photo-sharing, and social networking appli-cation with currently over 300 million active users. 1 Instagram lets userseasily connect with other social networking platforms (e.g., Facebook, Twit-ter, Tumblr, and Flickr) to share the taken pictures on, and enables usersto apply filters to their pictures. At this moment Instagram offers 25 prede-fined photo filters that soften and color shift picture properties, for users tocustomize and modify their pictures to create the desired visual style.
1https://instagram.com/press/ (accessed: 02/23/2015)
161

The ease with which a photo filter can be applied allow users to expressa personal style and create a seeming distinctiveness with the customizedpictures. Through the shared content and the way of applying filters, usersare able to reveal a lot about themselves to their social network. With that,the question arises: What do Instagram pictures tell about the user? Ormore specifically: What do Instagram pictures say about the personality ofthe user?
Personality traits have shown to consist of cues to infer users’ behavior,preference, and taste (e.g., [3, 11, 13]). Hence, knowing one’s personalitycan provide important cues for systems to cater to a personalized userexperience. It can provide systems with estimations about user preferenceswithout the use of extensive questionnaires or observations.
There has been an increased interest in how to use personality in systems(e.g., [2, 4, 14]), and how to automatically extract personality from onlinebehavior trails (e.g., Facebook [1, 6, 9, 12], Twitter [5, 10]). In this workwe join the personality extraction research by specifically focusing on therelationship between the picture features of an Instagram collection and thepersonality traits of the user.
Our work makes several contributions. We contribute to personality re-search by showing relationships between personality traits and the visualstyle of users’ Instagram pictures. Additionally, we contribute to new waysto extract personality from social media (i.e., Instagram). To the best of ourknowledge, we are the first to analyze (Instagram) pictures in relation withpersonality traits.
We conducted an online survey where we asked participants to fill in thewidely used, Big Five Inventory (BFI) personality questionnaire, and grantus access to the content of their Instagram account. We extracted 22,398Instagram pictures of 113 users, and analyzed them on several features(e.g., hue, brightness, saturation). Distinct correlations were found betweenpersonality traits and picture features.
In the remainder of the paper we will continue with related work, materials,features, results, discussion, and conclusion.
2 Related work
There is an increase of psychological research that investigate the relation-ship between personality and real-world behavior. Personality is known asan enduring factor and has shown to be related to a person’s taste, prefer-ence, and interest (e.g., [3, 11, 13]). For example, Rawlings and Ciancar-
162

elli found relationships between personality traits and music genre prefer-ences [11], while Tkalcic et al. found relationships between personality andclassical music [13].
To categorize personality, several models have been developed. The five-factor model (FFM) is the most well known and widely used one. It cate-gorizes personality into five general dimensions that describe personality interms of: openness to experience, conscientiousness, extraversion, agree-ableness, and neuroticism [8].
Based on psychological findings of personality in relation to real-world be-havior, there is an emergent interest in how to use and implement thesefindings into applications (e.g., [2, 4, 14]). It can provide useful proxy mea-sures for applications to cater to a more personalized service. For example,Tkalcic et al. proposes to use personality traits to enhance the nearest-neighborhood measurement for overcoming the cold-start problem (i.e.,recommending items to new users) in recommender systems [14]. Fer-werda et al. provide a way to use personality traits for adjusting the userinterface of music applications to fit user’s music browsing styles [4].
Personality traits have shown to consist of valuable information for per-sonalized system, but hard to acquire (e.g., extensive, time-consumingquestionnaires). Therefore, as applications are increasingly interconnected(e.g., social media), research started to focus on how to extract person-ality information from (online) behavior trails. Current research on Face-book (e.g., [1, 6, 9, 12]) and Twitter (e.g., [5, 10]) have shown to consist ofreliable cues to infer personality traits from. With our work we add to thepersonality extraction research by showing the relationship between per-sonality traits and picture features on Instagram.
3 Materials
To investigate the relationship between personality traits and picture fea-tures, we asked participants to fill in the 44-item BFI personality question-naire (5-point Likert scale; Disagree strongly - Agree strongly [7]). Thequestionnaire include questions that aggregate into the five basic personal-ity traits of the FFM. Additionally, we asked participants to grant us accessto their Instagram account through the Instagram API in order to crawl theirpictures. From hereon, we define the picture-collection term as all the In-stagram pictures of a single user.
We recruited 126 participants through Amazon Mechanical Turk. Partic-ipation was restricted to those located in the United States, and also tothose with a very good reputation to avoid careless contributions. Several
163

comprehension-testing questions were used to filter out fake and carelessentries. The Mahalanobis distance was calculated to check for outliers.This left us with 113 completed and valid responses. Age (18-64, median30) and gender (54 male, 59 female) information indicated an adequatedistribution.
4 Features
For each picture in a picture-collection that was crawled, we extracted sev-eral features. The extracted features are discussed below. Most of the fea-tures are color-based, some are content-based. For color-based featureswe use the color space that is most closely related to the human visual sys-tem, i.e., the Hue-Saturation-Value (HSV) color space [15].
Brightness. For each picture, we calculated the average brightness andvariance across all the pixels in the picture. Pictures that have a high aver-age brightness tend to be bright, obviously. These features represent howlight/dark a picture is and how much contrast there is in the picture, respec-tively. Pictures that have a high variance tend to have both dark and lightareas, whereas pictures with a low variance tend to be equally bright acrossthe picture. Furthermore, we divided the brightness axis into three equalintervals and counted the share of pixels that fall into each of these inter-vals (low/mid/high brightness). Pictures that have a high value in the lowbrightness feature tend to be darker, those that have a high value in themid brightness feature tend to have mostly neither dark nor bright areas,while those pictures that have a high value in the high brightness featuretend to have lots of bright areas.
Saturation. We calculated the average saturation and the variance foreach picture. Pictures with low average saturation tend to be bleak, color-less, while pictures with high saturation have more vivid colors. Pictureswith a high saturation variance tend to have both bleak and vivid colors.Here we also divided the saturation axis into three equal intervals and cal-culated the share of pixels that fall into each interval (low/mid/high satu-ration). pictures that have a high value in the low saturation tend to havemore bleak colors, those with a high value in the mid saturation feature tendto have neither bleak nor vivid colors while those pictures that have a highvalue in the high saturation feature tend to have vivid colors across mostof the picture area.
Pleasure-Arousal-Dominance (PAD). As the filters on Instagram intendto create a certain expression, we adopted the PAD model of Valdez and
164

Merhabian [16]. They created general rules of the expression of pleasure,arousal, and dominance in a picture as a combination of brightness andsaturation levels:
1. Pleasure = .69 Brightness + .22 Saturation
2. Arousal = -.31 Brightness + .60 Saturation
3. Dominance = -.76 Brightness + .32 Saturation
Hue-related features We extracted features that represented the prevalenthues in pictures. We chose many features that represent various aspectsof the hues. For each of the basic colors (red, green, blue, yellow, orange,and violet) we counted the share of pixels that fall into each color. As thediscrete color clustering of the hue dimension is nonlinear and subjective,we also divided the hue into 10 equal intervals and calculated the share ofpixels for each interval. These intervals are hard to describe with subjectivecolor descriptions. Furthermore, we calculated the share of pixels that fallinto cold (violet, blue, green) and warm (yellow, red, orange) colors.
Content-based features. Beside the color-centric features we also per-formed picture content analysis. We counted the number of faces and thenumber of people in each picture. We used the standard Viola-Jones al-gorithm [17]. A manual inspection of the Viola-Jones face detector resultsrevealed some false positives (e.g., a portrait within the picture) and falsenegatives (e.g., some rotated and tilted faces). However, in general theusers who tended to take pictures of people (e.g., selfies) had a highernumber of average number of faces/people per picture than those userswho tended to take mostly still photographs.
5 Results
We crawled 22,398 pictures, and extracted all the features per picture foreach picture-collection. As the features in the picture-collections show asymmetrical distribution, we calculated mean values for each feature tocreate a measurement of central tendency. The mean values of the fea-tures were used to calculate the correlation matrix (see Table 1). Pearson’scorrelation (r ε [-1,1]) is reported to indicate the linear relationship betweenpersonality and picture features.
The correlation matrix shows several features related with personality traits.We will discuss the results related to each personality trait below. Besidessignificant correlations of p<.05, we decided to report marginally significantresults as well (i.e., significant levels of .1 >p>.05).
165

Openness to experience. The openness factor correlates positively withthe feature green, meaning that open users tend to take pictures with a lotof green or applied a filter to express more greenness. We observed a neg-ative correlation with the feature brightness mean, which means that openusers tend to upload pictures that are low on brightness. This was furtherconfirmed by the positive correlation on brightness low, and the negativecorrelation on brightness high. These correlations show that the pictures ofopen users show more dark areas, and less bright areas.
Openness is also correlated with the saturation mean. This indicate thatthe pictures of open users consist of more saturated, vivid colors. We alsoobserved a positive correlation with the feature saturation variance, whichmeans that open users upload pictures that have both vivid and bleak col-ors.
A marginally significant correlation was observed for the warm/cold fea-tures. Pictures of open users contained less warm colors (i.e., red, or-ange), but more cold colors (i.e., blue, green). Also, the pictures of openusers tend to express less pleasure, but more arousal and dominance. Ad-ditionally, their pictures consist of less faces and people.
Conscientiousness. A marginally significant (positive) correlation wasfound between the saturation variance feature and conscientiousness. Thisindicate that conscientious users upload pictures consisting of bleak andvivid colors.
Extraversion. We mostly found marginally significant correlations with thepicture features and the extraversion. Extraverts tend to upload pictureswith less red and orange, but with more green and blue tones. Additionally,their pictures tend to be darker (brightness low), but tend to consist of bothvivid and bleak colors (saturation variance). Additionally, the emotion thatthe pictures of extraverts consist, are low on pleasure, but high on domi-nance.
Agreeableness. A marginally significant correlation was found betweenagreeableness and the brightness mid feature. This means that the pic-tures of agreeable users do not show emphasized bright or dark areas, butare more in between.
Neuroticism. A marginally significant correlation was found on brightnessmean, brightness low, and brightness high. The positive correlation withbrightness mean indicate that extravert users tend to upload pictures thatare high on brightness. This is also reflected in the brightness low (negativecorrelation) and brightness high (positive correlation) features. Additionally,
166

O C E A NRed -0.06 0.02 -0.17ˆ -0.05 0.03Green 0.17ˆ 0.14 0.23ˆˆ 0.03 -0.12Blue -0.01 0 0.17ˆ 0.02 -0.01Yellow 0.01 0.04 0.01 0.14 -0.07Orange -0.03 -0.07 -0.16ˆ -0.02 0.06Violet 0 -0.06 -0.09 -0.07 0.06Bright.mean -0.25* -0.1 -0.19ˆ -0.07 0.22ˆBright.var. 0.06 0 0 -0.07 0.05Bright.low 0.28** 0.09 0.16ˆ -0.05 -0.16ˆBright.mid -0.09 0.06 0.04 0.15ˆ -0.06Bright.high -0.2ˆ -0.12 -0.18ˆ -0.08 0.21ˆSat.mean 0.16ˆ 0.06 0.03 -0.04 0Sat.var. 0.2ˆˆ 0.16ˆ 0.19ˆˆ 0.1 -0.05Sat.low -0.08 -0.02 0.02 0.07 0.01Sat.mid 0.08 -0.09 0.02 0.07 0.01Sat.high 0.13 0.1 0.04 -0.01 0.01Warm -0.05ˆˆ -0.04 -0.2 0 0.03Cold 0.05ˆˆ 0.04 0.2 0 -0.03Pleasure -0.19ˆˆ -0.08 -0.18ˆ -0.09 0.22ˆˆArousal 0.23* 0.09 0.1 0 -0.08Dominance 0.28** 0.11 0.17ˆ 0.05 -0.18ˆˆ# of faces -0.16ˆ 0.03 0.11 -0.11 -0.03# of people -0.22ˆˆ -0.05 -0.07 -0.01 0.07
Note. ˆp<0.1, ˆˆp<.05, *p<.01, **p<.001.
Table 1: Correlation Matrix of the picture features against the personalitytraits: (O)penness, (C)onscientiousness, (E)xtraversion, (A)greeableness,(N)euroticism.
correlations were found in the emotion expression of the pictures of ex-traverts. They show to adjust their pictures to express more pleasure butless dominance.
6 Personality prediction
Given that we found significant correlations between picture features andpersonality traits, we explored personality prediction based on these fea-tures. We trained our predictive model with the radial basis function networkclassifier in Weka, with a 10-fold cross-validation. We report the root-mean-square error (RMSE) in Table 2. The RMSE of each personality trait relatesto the [1,5] score scale.
167

Personality RMSEOpenness to experience 0.73Conscientiousness 0.69Extraversion 0.95Agreeableness 0.74Neuroticism 0.95
Table 2: Personality prediction with the root-mean-square error (RMSE).
Personality Picture propertiesOpenness to experience Green, low brightness, high saturation, cold
colors, few facesConscientiousness Saturated and unsaturated colorsExtraversion Green and blue tones, low brightness, satu-
rated and unsaturated colorsAgreeableness Few dark and bright areasNeuroticism High brightness
Table 3: Picture properties in relation to personality traits. The propertiesapply for the pictures of users who score high in the respective personalitytrait.
The RMSE values that we found are low and comparable with previouswork on personality extraction from social media trails. For example, Quer-cia et al. [10] looked at the relationship between personality traits and Twit-ter usage and reported RSME scores of 0.69, 0.76, 0.88, 0.79, and 0.85,respectively for, openness to experience, conscientiousness, extraversion,agreeableness, and neuroticsm. Our results, as well as the results of priorwork show that the most difficult traits to predict are the extraversion andthe neuroticism personality traits.
7 Discussion
We found Instagram picture features to be correlated with personality. Re-sults show that the most strongly significant correlations are found in theopenness to experience personality trait. Although we found weaker signif-icant levels for the other personality traits, we were still able to find distinctcorrelations. See Table 3 for a summary of our findings.
Based on the found correlations, we also explored the prediction of the per-sonality traits based on the picture features. Compared with the findingsof prior work (i.e., [10]), we were able to find similar results and patterns.The most successful personality traits to predict are openness to experi-
168

ence, conscientiousness, and agreeableness, whereas the more difficulttraits are extraversion and neuroticism.
8 Limitations and future work
Our study contains limitations that need to be considered. Although wewere able to obtain a fair amount of Instagram pictures (n=22,398), our per-sonality measurement was limited to 113 participants. Given that we onlyhad personality information of 113 participants to find relationships withpicture features, we decided to give attention to the marginally significantresults as well (i.e., significant levels of .1 >p>.05). A bigger sample size toassess personality traits should provide more conclusive results about themarginally significant effects that we found in this study.
In this study we solely focused on participants based in the United States.However, color interpretation and meaning could be influenced by culturalfactors. Therefore, cultures could engage in different behavior of picturetaking and applying filters. Future work should address this.
9 Conclusion
Our results suggest that there is a relation between personality traits andthe way of taking and applying filters to pictures. By analyzing pictures ofInstagram, personality traits can be inferred. Implicitly extracting personalityfrom social media trails makes it possible to facilitate systems in order toprovide a personalized experience. For example, it can help recommendersystems to overcome the cold-start problem [14], or provide a personalizeduser interface [4].
169

10 Acknowledgments
This research is supported by the Austrian Science Fund (FWF): P25655;and by the EU FP7/2013-2016 through the PHENICX project under grantagreement no.601166.
References
[1] Back, M.D., Stopfer, J.M., Vazire, S., Gaddis, S., Schmukle, S.C.,Egloff, B., Gosling, S.D.: Facebook profiles reflect actual personality,not self-idealization. Psychological science (2010)
[2] Ferwerda, B., Schedl, M.: Enhancing music recommender systemswith personality information and emotional states: A proposal. In: Pro-ceedings of the 2nd EMPIRE Workshop. pp. 1613–0073 (2014)
[3] Ferwerda, B., Schedl, M., Tkalcic, M.: Personality & emotional states:Understanding users’ music listening needs. UMAP 2015 ExtendedProceedings (2015)
[4] Ferwerda, B., Yang, E., Schedl, M., Tkalcic, M.: Personality traitspredict music taxonomy preferences. In: CHI’15 Extended Abstracts.ACM (2015)
[5] Golbeck, J., Robles, C., Edmondson, M., Turner, K.: Predicting per-sonality from twitter. In: IEEE Third Conference on Social Computing.pp. 149–156 (2011)
[6] Gosling, S.D., Gaddis, S., Vazire, S., et al.: Personality impressionsbased on facebook profiles. ICWSM
[7] John, O.P., Donahue, E.M., Kentle, R.L.: The big five inventory: insti-tute of personality and social research. UC Berkeley, CA (1991)
[8] McCrae, R.R., John, O.P.: An introduction to the five-factor model andits applications. Journal of personality 60(2), 175–215 (1992)
[9] Park, G., Schwartz, H.A., Eichstaedt, J.C., Kern, M.L., Kosinski, M.,Stillwell, D.J., Ungar, L.H., Seligman, M.E.: Automatic personality as-sessment through social media language. (2014)
[10] Quercia, D., Kosinski, M., Stillwell, D., Crowcroft, J.: Our twitter pro-files, our selves: Predicting personality with twitter. In: IEEE Third Con-ference on Social Computing. pp. 180–185 (2011)
170

[11] Rawlings, D., Ciancarelli, V.: Music preference and the five-factormodel of the neo personality inventory. Psychology of Music 25(2),120–132 (1997)
[12] Ross, C., Orr, E.S., Sisic, M., Arseneault, J.M., Simmering, M.G., Orr,R.R.: Personality and motivations associated with facebook use. Com-puters in Human Behavior 25(2), 578–586 (2009)
[13] Tkalcic, M., Ferwerda, B., Hauger, D., Schedl, M.: Personality Corre-lates for Digital Concert Program Notes. UMAP pp. 1–6 (2015)
[14] Tkalcic, M., Kunaver, M., Košir, A., Tasic, J.: Addressing the new userproblem with a personality based user similarity measure. In: DEMRA(2011)
[15] Tkalcic, M., Tasic, J.: Colour spaces: perceptual, historical and appli-cational background. IEEE EUROCON. Computer as a Tool pp. 304–308 (2003)
[16] Valdez, P., Mehrabian, A.: Effects of color on emotions. Journal ofExperimental Psychology: General 123(4), 394 (1994)
[17] Viola, P., Jones, M.J.: Robust Real-Time Face Detection. InternationalJournal of Computer Vision 57(2), 137–154 (May 2004)
171

Using Instagram Picture Features to PredictUsers’ Personality
Published in: Proceedings of the 22nd International Conference on MultiMedia Modeling(MMM 2016; Miami, FL, US)
BRUCE FERWERDA, Johannes Kepler University, Linz (AT)MARKUS SCHEDL, Johannes Kepler University, Linz (AT)MARKO TKALCIC, Free University of Bolzano, Bolzano (IT)
Abstract
Instagram is a popular social networking application, which allowsphoto-sharing and applying different photo filters to adjust the appear-ance of a picture. By applying these filters, users are able to createa style that they want to express to their audience. In this study wetried to infer personality traits from the way users manipulate the ap-pearance of their pictures by applying filters to them. To investigatethis relationship, we studied the relationship between picture featuresand personality traits. To collect data, we conducted an online surveywhere we asked participants to fill in a personality questionnaire, andgrant us access to their Instagram account through the Instagram API.Among 113 participants and 22,398 extracted Instagram pictures, wefound distinct picture features (e.g., relevant to hue, brightness, sat-uration) that are related to personality traits. Our findings suggesta relationship between personality traits and these picture features.Based on our findings, we also show that personality traits can beaccurately predicted. This allow for new ways to extract personalitytraits from social media trails, and new ways to facilitate personalizedsystems.
Keywords: Instagram, Personality, Photo Filters, Picture Features
1 Introduction
Instagram is a popular mobile photo-sharing, and social networking appli-cation, with currently over 300 million active users a month, over 70 billionpictures shared, with an average of 70 million new pictures a day. 1 Insta-gram is interconnected with an abundance of social networking sites (e.g.,Facebook, Twitter, Tumblr, and Flickr) to let its users share their pictures on.
1https://instagram.com/press/ (accessed: 08/07/2015)
172

In addition, it encourages users to apply filters to modify the color appear-ance of their pictures. At this moment Instagram offers 25 predefined photofilters that allow users to customize and modify their pictures to create thedesired visual style.
The ease with which a photo filter can be applied allow users to expressa personal style and create a seeming distinctiveness with the customizedpictures. Through the shared content and the way of applying filters, usersare able to reveal a lot about themselves to their social network. With that,the question arises: What do Instagram pictures tell about the user? Ormore specifically: What do Instagram pictures say about the personality ofthe user?
Personality traits have shown to consist of cues to infer users’ behavior,preference, and taste (e.g., [9, 26, 28]). Hence, knowing one’s person-ality can provide important information for systems to create a personal-ized user experience. It can provide systems with estimations about userpreferences, and avoid the use of extensive questionnaires or observa-tions.
There is an increasing interest in implement personality in systems (e.g., [8,11, 29]), and the implicit acquisition of personality from online behavior trails(e.g., Facebook [2, 5, 13, 24, 27], Twitter [12, 25], Flickr [7], video blogs [3,4]). In this work we join the personality extraction research. We specificallyfocus on the relationship between the personality of Instagram users andthe way they manipulate their pictures by using photo filters, in order tocreate a visual style.
Our work makes several contributions. We contribute to personality re-search, by showing relationships between personality traits and the visualstyle of users’ Instagram pictures. Additionally, we contribute to new waysto extract personality from social media (i.e., Instagram). To the best ofour knowledge, we are the first to investigate the relationship between per-sonality traits and how users try to create a visual style by applying photofilters.
An online survey was conducted where we: 1) asked participants to fill inthe widely used Big Five Inventory (BFI) personality questionnaire, and 2)grant us access to the content of their Instagram account. We extracted22,398 Instagram pictures of 113 users, and analyzed them on severalcolor-centric picture features (e.g., related to hue, saturation, value). Wefound distinct correlations between personality traits and picture features,and show that personality can be accurately predicted from the picture fea-tures. 2
2Our preliminary results of this work can be found in [10].
173

In the remainder of the paper we will continue with related work, materials,features, results, discussion, and conclusion.
2 Related work
Personality has shown to be an enduring factor that can be related to aperson’s taste, preference, and interest (e.g., [9, 26, 28]). For example,Rawlings and Ciancarelli found relationships between personality traits andmusic genre preferences [26], while Tkalcic et al. found relationships be-tween personality and classical music [28]. These relationships indicatethat personality information can be used to create useful proxy measuresfor applications to cater to a more personalized service (e.g., [8, 11, 29]).For example, Tkalcic et al. propose to use personality to enhance thenearest-neighborhood measurement for overcoming the cold-start problem(i.e., recommending items to new users) in recommender systems [29].Ferwerda et al. provide a way to use personality for adjusting the user in-terface of music applications to fit a user’s music browsing style [11].
In order to measure personality, several models have been developed. Thefive-factor model (FFM) is the most well known and widely used one inthe computing community [32], and categorizes personality into five gen-eral dimensions (traits), that describe personality in terms of: openness toexperience, conscientiousness, extraversion, agreeableness, and neuroti-cism [21]. However, unless using extensive, and time-consuming question-naires, acquiring personality traits is still a challenging task.
There is an emergent interest in how to implicitly acquire personality traitsbased on behavioral data (for an overview see [32]). Research has shownit is feasible to compute personality from behavioral data such as mobilephone usage (e.g.,[6, 23]), or with acoustic and visual cues through cam-eras and microphones (e.g., [1, 19, 22]). With the increasing connected-ness of people, recent research has started to focus on personality acqui-sition from online behavior trails, such as, video blogs (vlogs) [3, 4], Face-book behavior (e.g., [2, 13, 24, 27]) and profile pictures [5], Twitter behavior(e.g., [12, 25]), and Flickr pictures [7].
Little work has been done on personality extraction from pictures. Celli et al.focused on the content of Facebook profile pictures (e.g., facial close-ups,facial expressions, alone or with others) to extract personality [5]. Otherwork of Cristani et al. showed that personality can be extracted from thevisual features of Flickr pictures [7]. Flickr attracts a lot of advanced photog-raphers as an image hosting platform, and thereby consist of more seriousand higher quality pictures. Instagram, on the other hand, targets snap-
174

shot pictures taken with the mobile phone, and puts emphasis on applyingpredefined filters. The different usage and interactions on Flickr and Insta-gram attract different audiences, and therefore personality prediction maybe based on different cues. As Instagram is known for its photo filters tocreate certain effects, we decided to focus more on color-properties; howusers manipulate their pictures with help of the filters to achieve a certainexpression, rather then picture content.
3 Materials
To investigate the relationship between personality traits and picture fea-tures, we asked participants to fill in the 44-item BFI personality question-naire (5-point Likert scale; Disagree strongly - Agree strongly [16]). Thequestionnaire include questions that aggregate into the five basic personal-ity traits of the FFM. The distribution of each personality trait can be found inFigure 1. Additionally, we asked participants to grant us access to their In-stagram account through the Instagram API, in order to crawl their pictures.From hereon, we define the picture-collection term as all the Instagrampictures of a single user.
We recruited 126 participants through Amazon Mechanical Turk, a popularrecruitment tool for user-experiments [18]. Participation was restricted tothose located in the United States, and also to those with a very good repu-tation (≥95% HIT approval rate and ≥1000 HITs approved) 3 to avoid care-less contributions. Several comprehension-testing questions were used tofilter out fake and careless entries. The Mahalanobis distance was cal-culated to check for outliers. This left us with 113 completed and validresponses. Age (18-64, median 30) and gender (54 male, 59 female) infor-mation indicated an adequate distribution. Pictures of each participant werecrawled after the study. This resulted in a total of 22,398 pictures.
4 Features
As the goal in this study was to see how Instagram users manipulate theirpictures with photo filters, we extracted mainly color related picture features.Based on the assumption that Instagram users’ personality is manifestedthrough the way photo filters are applied, a set of features that relate tocolor were selected based on the work of Machajdik and Hanbury [20]. For
3HITs (Human Intelligence Tasks) represent the assignments a user has participated inon Amazon Mechanical Turk prior to this study.
175

0
5
10
15
20
25
1 2 3 4 5
Openness to experience
0
5
10
15
20
25
1 2 3 4 5
Conscientiousness
0
5
10
15
20
25
1 2 3 4 5
Extraversion
0
5
10
15
20
25
1 2 3 4 5
Agreeableness
0
5
10
15
20
25
1 2 3 4 5
Neuroticism
Figure 1: Collected personality distribution for each personality trait.
the color-centric features, the color space that is most closely related tothe human visual system was selected. That is, the Hue-Saturation-Value(HSV) color space [30]. The H parameter describes the hue (i.e., the colorquality of each pixel) from orange through yellow, green , blue, violet tored, on a scale from 0 to 1. The S parameter describes how saturated thecolor is. That is, the share of white in a picture (high share of white meanslow saturation). The parameter V (value) represents the brightness of thecolor. Beside the color-centric features, we additionally performed basicpicture content analysis, by counting the number of faces and the numberof people in each picture.
Hue-related features. We divided the range of the H parameter into in-tervals that correspond to the hues: orange, yellow, green, blue, violet, andred. For each of these intervals we counted the number of pixels in animage that fall into this interval and divided it with the number of all pix-els in the image. This yielded the share of the image surface that a huecovers.
Furthermore, we merged the cold colors (i.e., green, blue violet) and the
176

warm colors (i.e., orange, red, yellow) into the respective shares across animage. On a user level, the features: orange, yellow, green, blue, violet,red, warm and cold, are the average values of the color shares among allthe pictures of a user.
Saturation-related features. For each picture we calculated the averagesaturation and the variance. Images with low average saturation tend tobe bleak and colorless, while pictures with high saturation have more vividcolors. Pictures with a high saturation variance tend to have both bleak andvivid colors. Here, we also divided the saturation axis into three equallyspaced intervals and calculated the share of pixels that fall into each inter-val (low, mid, and high saturation). Pictures that have a high value in thelow saturation tend to have more bleak colors, those with a high value inthe mid saturation feature tend to have neither bleak nor vivid colors, andthose that have a high value in the high saturation feature tend to have vividcolors across most of the image area.
Value-related features. For each image we calculated the average value(value mean) and variance (value variance) across all the pixels in the im-age. These features represent how light or dark a picture is and how muchcontrast it reveals, respectively. Pictures that have a high variance tend tohave both dark and light areas, whereas pictures with a low variance tendto be equally bright across the image. Furthermore, we divided the valueaxis into three equally spaced intervals and counted the share of pixels thatfall into each of these intervals (value low, mid, and high).
Pleasure-Arousal-Dominance (PAD). As the filters Instagram users canapply to their pictures, are intended to create certain expressions, we adoptedthe PAD model of Valdez and Merhabian [31], which contains general rulesof the expression of pleasure, arousal, and dominance in a picture, andmodels these as a combination of brightness (value) and saturation lev-els:
1. Pleasure = .69 Value + .22 Saturation
2. Arousal = -.31 Value + .60 Saturation
3. Dominance = -.76 Value + .32 Saturation
Content-based features. In addition to the color-centric features, we com-puted two extra features for each user: 1) the average number of humanfaces across all the images of a user, and 2) the average number of fullpeople bodies across all the images of a user.
To extract the number of faces in a picture, we used the Viola-Jones al-gorithm [33]. We trained the algorithm to recognize the number of faces
177

in an image, by using the Haar-like features and the AdaBoost classi-fier. For extracting the number of full bodies we used the Histogram ofOriented Gradient (HOG) features with a Support Vector Machine (SVM)classifier. To achieve this, we employed Matlab’s Computer Vision SystemToolbox. 4
5 Results
We divided the results section into two parts: the first part discusses thecorrelations we found, and the second part we discuss our personality re-gressor to predict personality traits based on the picture features.
5.1 Correlations
Although the main goal of this study was to investigate the relationshipbetween personality and picture features, we decided to explore whetherwe could find correlations with personality and the usage of certain filters.We shortly discuss our results on the latter, and then continue with thecorrelations of the picture features.
5.1.1 Instagram filters
Besides crawling the pictures, we also crawled descriptives about the filterseach participant applied to their pictures, in order to explore whether certainpersonality traits are related to a more frequent use of some filters. Of thecollected 22,398 pictures from 113 participants, 1487 unique filters wereapplied in total (this also include the “Normal" filter which means that nofilter is applied). This brings that on average participants use 13 (13.15)different photo-filters to the pictures they upload to their picture-collection.Given that Instagram offers 25 different filters to apply, participants seemto use a whole range of filters. This is not so surprising, as the result ofapplying a filter depends on how the original picture looks like. So it ispossible that the visual characteristics of a picture is eventually the same,but achieved by using different filters.
With using Pearson’s correlation (r ε [-1,1]) to indicate the linear relation-ship between personality and photo filters, we found the following corre-lations: a positive correlation between the conscientiousness personalitytraits and the “Kelvin" filter (r=.203, p=.044), a negative correlation between
4http://www.mathworks.com/help/vision/index.html
178

the agreeableness personality trait, the “Crema" (r=-.205, p=.042) and the“Gotham" (r=-.204, p=.042) filter. Additionally, we found a positive correla-tion between the neuroticism personality traits and the “Hudson" (r=.224,p=.026) filter. These results imply that in general conscientiousness par-ticipants make more use of the Kelvin filter, agreeable participants usedless the Crema and Gotham filter, and neurotic participants applied morethe Hudson filter. Besides these four significant correlations, there were nostatistical significant correlations found with the remaining 21 photo filters.Given the low number of significant correlations that we found, and thatthe applied filter does not tell anything about how the end result looks like,we decided to not further pursue this direction, and continue our analysesfocusing on the picture features.
5.1.2 Picture features
For each picture from a crawled picture-collection (i.e., all the pictures ofa participant’s Instagram account), we extracted all the features that aredescribed in Section 4 (Features). As the features in participants’ picture-collection show a normal distribution, we calculated mean values for eachfeature to create a measurement of central tendency, to represent the wholepicture-collection of each participant. The mean values of the features wereused to calculate the correlation matrix (see Table 1). Pearson’s correlation(r ε [-1,1]) is reported to indicate the linear relationship between personalityand picture features. The correlation matrix shows several features relatedwith personality traits. 5 We discuss the results related to each personalitytrait below.
Openness to experience: Openness to experience was found to correlatewith the saturation mean. This indicates that the pictures of open partici-pants consist of more saturated, vivid colors. We also observed a positivecorrelation with the feature saturation variance, which means that open par-ticipants share pictures that have both vivid and bleak colors. Furthermore,a negative correlation with the feature value mean was found, indicatingthat open participants tend to share pictures that are low on brightness.This was further confirmed by the positive correlation on brightness low,and the negative correlation on value high. These correlations show thatthe pictures of open participants show more dark areas, and less brightareas. Also, a correlation was observed for the warm and cold features.Pictures of more open participants contained less warm colors (i.e., red,orange), but more cold colors (i.e., blue, green). Also, their pictures tend to
5The magnitude of the correlations are commonly found in relationships between per-sonality traits and social media trails (e.g., [2, 12, 13, 24, 25, 27])
179

O C E A NRed -0.06 0.02 -0.17ˆ -0.05 0.03Green 0.17ˆ 0.14 0.23ˆˆ 0.03 -0.12Blue -0.01 0 0.17ˆ 0.02 -0.01Yellow 0.01 0.04 0.01 0.14 -0.07Orange -0.03 -0.07 -0.16ˆ -0.02 0.06Violet 0 -0.06 -0.09 -0.07 0.06Saturation mean 0.16ˆ 0.06 0.03 -0.04 0Saturation variance 0.20ˆˆ 0.16ˆ 0.19ˆˆ 0.10 -0.05Saturation low -0.08 -0.02 0.02 0.07 0.01Saturation mid 0.08 -0.09 0.02 0.07 0.01Saturation high 0.13 0.10 0.04 -0.01 0.01Value mean -0.25* -0.10 -0.19ˆ -0.07 0.22ˆValue variance 0.06 0 0 -0.07 0.05Value low 0.28** 0.09 0.16ˆ -0.05 -0.16ˆValue mid -0.09 0.06 0.04 0.15ˆ -0.06Value high -0.20ˆ -0.12 -0.18ˆ -0.08 0.21ˆWarm -0.05ˆˆ -0.04 -0.20 0 0.03Cold 0.05ˆˆ 0.04 0.20 0 -0.03Pleasure -0.19ˆˆ -0.08 -0.18ˆ -0.09 0.22ˆˆArousal 0.23* 0.09 0.10 0 -0.08Dominance 0.28** 0.11 0.17ˆ 0.05 -0.18ˆˆ# of faces -0.16ˆ 0.03 0.11 -0.11 -0.03# of people -0.22ˆˆ -0.05 -0.07 -0.01 0.07
Note. ˆp<0.1, ˆˆp<.05, *p<.01, **p<.001.
Table 1: Correlation Matrix of the picture features against the personalitytraits: (O)penness, (C)onscientiousness, (E)xtraversion, (A)greeableness,(N)euroticism.
express less pleasure, but more arousal and dominance. Additionally, theirpictures consist in general of fewer faces and people.
Conscientiousness: A positive correlation was found between the sat-uration variance feature and conscientiousness. This indicates that con-scientious participants more frequently shared pictures consisting of bleakand vivid colors.
Extraversion: We found correlations between the picture features and ex-traversion. Extraverts tend to create pictures with less red and orange,but with more green and blue tones. Additionally, their pictures tend to bedarker (brightness low), but consist of both vivid and bleak colors (satura-tion variance). Also the emotion that the pictures of extraverts consist, are
180

low on pleasure, but high on dominance.
Agreeableness: A positive correlation was found between agreeablenessand the brightness mid feature. This means that the pictures of agreeableparticipants do not show emphasized bright or dark areas, but are more inbetween.
Neuroticism: A correlation was found on value mean, value low, andvalue high. The positive correlation with value mean indicate that partic-ipants scoring higher on the neurotic trait tend to share pictures that arehigh on brightness. This is also reflected in the value low (negative correla-tion) and value high (positive correlation) features. Additionally, correlationswere found in the emotion expression of the pictures of extraverts. Resultshow that they adjust their pictures to express more pleasure but less dom-inance.
5.2 Personality Regressor
Given the correlations that were found, we developed a personality regres-sor based on the features reported in Table 1. As prior work on predictionpersonality traits from Twitter behavior uses the same method of analy-ses [25], we compare our performance against their results. We trainedour predictive model with several classifiers in Weka, with a 10-fold cross-validation with 10 iterations. For each classifier we used, we report the root-mean-square error (RMSE) in Table 2, to indicate the root mean squaredifference between predicted and observed values. The RMSE of eachpersonality trait relates to the [1,5] score scale.
RMSE
Personality traits Radial BasisFunction Network
RandomForests
M5Rules
M5 RulesQuercia et al. [25]
Openness to experience 0.68 0.71 0.77 0.69Conscientiousness 0.66 0.67 0.73 0.76Extraversion 0.90 0.95 0.96 0.88Agreeableness 0.69 0.71 0.78 0.79Neuroticism 0.95 1.01 0.97 0.85
Table 2: Comparison of different classifiers to predict personality predictioncompared to prior work of Quercia et al. [25]. Numbers in bold representthe results that outperform prior work. Root-mean-square error (RMSE) isreported (r ∈ [1,5]).
In line with prior work of Quercia et al. [25], we started to train our predic-tive model with the M5’ rules [34]. Although our results do not outperform
181

Personality Picture propertiesOpenness to experience More green tones, lower in brightness, higher in sat-
uration, more cold colors, fewer faces and peopleConscientiousness Mix of saturated and unsaturated colorsExtraversion More green and blue tones, lower in brightness, mix
of saturated and unsaturated colorsAgreeableness Fewer dark and bright areasNeuroticism Higher in brightness
Table 3: Interpretation and summary of the correlations found between per-sonality traits and picture properties. The properties apply for the picturesof participants who score high in the respective personality trait.
prior work on most facets, we do find similar trends: extraversion and neu-roticism are the hardest personality traits to predict. As applying M5’ rulesdid not result in any improvement, we applied the random forests classi-fier. Random forests are known to have a reasonable performance whenthe features consist of high amounts of noise [15]. The results show slightimprovement over M5’ rules in general, but for the neuroticism personalitytrait, the prediction got worse. Finally, we tried using the radial basis func-tion (RBF) network, which is a neural network that has shown to work wellon smaller datasets [17]. Results show that the RBF network outperformsthe M5’ rules, as well as the random forest classifier. Compared to priorwork, the RBF network outperforms prediction of openness to experience,conscientiousness, and agreeableness. Also with the RBF network, predic-tions is most difficult for extraversion and neuroticism. Although we do notoutperform prior work on extraversion and conscientiousness, our resultsdo not differ much. In general, we show that with picture features we canachieve better personality prediction than prior work on Twitter data.
6 Discussion
We found Instagram picture features to be correlated with personality. Asummary and interpretation of the picture features can be found in Table 3.We found that most correlations appear in the openness to experience per-sonality trait. Even though, less and weaker correlations were found forthe other personality traits, we were still able to observe distinct correla-tions.
Based on the identified correlations between personality and picture fea-tures, we created a personality regressor. The results that we achievedwith our prediction model show that personality can be accurately predictedfrom picture features on Instagram. The results of the personality regressor
182

show similar patterns as prior work on personality extraction from socialmedia (i.e., Twitter) [25], and were able to outperform in predicting most ofthe personality traits. We found that the easiest and most successful pre-diction are for the openness to experience, conscientiousness, and agree-ableness personality traits, whereas the more difficult traits are extraversionand neuroticism.
7 Future work & Limitations
Our study contains limitations that need to be considered. Although wewere able to obtain a fair amount of Instagram pictures (n=22,398), ourpersonality measurement was limited to 113 participants. Given that weonly had personality information of 113 participants to find relationshipswith picture features, results would benefit from a bigger sample size.
In this study we solely focused on participants based in the United States.However, color interpretation and meaning could be influenced by culturalfactors. Therefore, cultures could engage in different behavior of picturetaking [14] and applying filters. Future work should address this. Further-more, we decided to mainly focus on the color-centric features of the pic-tures we crawled, as Instagram’s main focus is on applying photo filters.However, content analyses of the pictures would be an interesting next stepto conduct.
8 Conclusion
With this study we show that personality of Instagram users can be accu-rately predicted from color-centric features of the pictures they post. Beingable to implicitly extract personality from social media trails, gives possi-bilities to facilitate systems in order to provide a personalized experience.For example, it can help recommender systems to overcome the cold-startproblem.
9 Acknowledgments
This research is supported by the Austrian Science Fund (FWF): P25655;and by the EU FP7/’13-’16 through the PHENICX project, grant agreementno.601166.
183

References
[1] Aran, O., Gatica-Perez, D.: Cross-domain personality prediction: fromvideo blogs to small group meetings. In: Proceedings of the 15th ACMon International conference on multimodal interaction. pp. 127–130.ACM (2013)
[2] Back, M.D., Stopfer, J.M., Vazire, S., Gaddis, S., Schmukle, S.C.,Egloff, B., Gosling, S.D.: Facebook profiles reflect actual personality,not self-idealization. Psychological science (2010)
[3] Biel, J.I., Aran, O., Gatica-Perez, D.: You are known by how youvlog: Personality impressions and nonverbal behavior in youtube. In:ICWSM. Citeseer (2011)
[4] Biel, J.I., Gatica-Perez, D.: The youtube lens: Crowdsourced person-ality impressions and audiovisual analysis of vlogs. Multimedia, IEEETransactions (2013)
[5] Celli, F., Bruni, E., Lepri, B.: Automatic personality and interaction stylerecognition from facebook profile pictures. In: Proceedings of the ACMInternational Conference on Multimedia. pp. 1101–1104. ACM (2014)
[6] Chittaranjan, G., Blom, J., Gatica-Perez, D.: Mining large-scale smart-phone data for personality studies. Personal and Ubiquitous Comput-ing 17(3), 433–450 (2013)
[7] Cristani, M., Vinciarelli, A., Segalin, C., Perina, A.: Unveiling the multi-media unconscious: Implicit cognitive processes and multimedia con-tent analysis. In: Proceedings of the 21st ACM international confer-ence on Multimedia (2013)
[8] Ferwerda, B., Schedl, M.: Enhancing music recommender systemswith personality information and emotional states: A proposal. In:Proc. EMPIRE workshop (2014)
[9] Ferwerda, B., Schedl, M., Tkalcic, M.: Personality & emotional states:Understanding users’ music listening needs. UMAP 2015 ExtendedProceedings (2015)
[10] Ferwerda, B., Schedl, M., Tkalcic, M.: Predicting personality traits withinstagram pictures. In: Proceedings of the 3rd Workshop on Emotionsand Personality in Personalized Systems 2015. pp. 7–10. ACM (2015)
[11] Ferwerda, B., Yang, E., Schedl, M., Tkalcic, M.: Personality traitspredict music taxonomy preferences. In: CHI’15 Extended Abstracts.ACM (2015)
184

[12] Golbeck, J., Robles, C., Edmondson, M., Turner, K.: Predicting per-sonality from twitter. In: IEEE Third Conference on Social Computing.pp. 149–156 (2011)
[13] Gosling, S.D., Gaddis, S., Vazire, S., et al.: Personality impressionsbased on facebook profiles. ICWSM (2007)
[14] Huang, C.M., Park, D.: Cultural influences on facebook photographs.International Journal of Psychology 48(3), 334–343 (2013)
[15] Humston, E.M., Knowles, J.D., McShea, A., Synovec, R.E.: Quan-titative assessment of moisture damage for cacao bean quality us-ing two-dimensional gas chromatography combined with time-of-flightmass spectrometry and chemometrics. Journal of Chromatography A1217(12), 1963–1970 (2010)
[16] John, O.P., Donahue, E.M., Kentle, R.L.: The big five inventory: insti-tute of personality and social research. UC Berkeley, CA (1991)
[17] Khot, L.R., Panigrahi, S., Doetkott, C., Chang, Y., Glower, J., Amam-charla, J., Logue, C., Sherwood, J.: Evaluation of technique to over-come small dataset problems during neural-network based contamina-tion classification of packaged beef using integrated olfactory sensorsystem. LWT-Food Science and Technology (2012)
[18] Kittur, A., Chi, E.H., Suh, B.: Crowdsourcing user studies with me-chanical turk. In: Proceedings of the SIGCHI conference on humanfactors in computing systems. pp. 453–456. ACM (2008)
[19] Lepri, B., Subramanian, R., Kalimeri, K., Staiano, J., Pianesi, F., Sebe,N.: Connecting meeting behavior with extraversion&# x2014; a sys-tematic study. Affective Computing, IEEE Transactions on 3(4), 443–455 (2012)
[20] Machajdik, J., Hanbury, A.: Affective image classification using fea-tures inspired by psychology and art theory. In: Proceedings of theinternational conference on Multimedia. pp. 83–92. ACM (2010)
[21] McCrae, R.R., John, O.P.: An introduction to the five-factor model andits applications. Journal of personality 60(2), 175–215 (1992)
[22] Mohammadi, G., Vinciarelli, A.: Automatic personality perception: Pre-diction of trait attribution based on prosodic features. Affective Com-puting, IEEE Transactions on 3(3), 273–284 (2012)
[23] de Montjoye, Y.A., Quoidbach, J., Robic, F., Pentland, A.S.: Predict-ing personality using novel mobile phone-based metrics. In: Socialcomputing, behavioral-cultural modeling and prediction, pp. 48–55.Springer (2013)
185

[24] Park, G., Schwartz, H.A., Eichstaedt, J.C., Kern, M.L., Kosinski, M.,Stillwell, D.J., Ungar, L.H., Seligman, M.E.: Automatic personality as-sessment through social media language. (2014)
[25] Quercia, D., Kosinski, M., Stillwell, D., Crowcroft, J.: Our twitter pro-files, our selves: Predicting personality with twitter. In: IEEE Third Con-ference on Social Computing. pp. 180–185 (2011)
[26] Rawlings, D., Ciancarelli, V.: Music preference and the five-factormodel of the neo personality inventory. Psychology of Music 25(2),120–132 (1997)
[27] Ross, C., Orr, E.S., Sisic, M., Arseneault, J.M., Simmering, M.G., Orr,R.R.: Personality and motivations associated with facebook use. Com-put Hum Behav (2009)
[28] Tkalcic, M., Ferwerda, B., Hauger, D., Schedl, M.: Personality Corre-lates for Digital Concert Program Notes. UMAP pp. 1–6 (2015)
[29] Tkalcic, M., Kunaver, M., Košir, A., Tasic, J.: Addressing the new userproblem with a personality based user similarity measure. In: DEMRA(2011)
[30] Tkalcic, M., Tasic, J.: Colour spaces: perceptual, historical and appli-cational background. IEEE EUROCON. Computer as a Tool pp. 304–308 (2003)
[31] Valdez, P., Mehrabian, A.: Effects of color on emotions. Journal ofExperimental Psychology: General 123(4), 394 (1994)
[32] Vinciarelli, A., Mohammadi, G.: A survey of personality computing.Affective Computing, IEEE Transactions on 5(3), 273–291 (2014)
[33] Viola, P., Jones, M.J.: Robust Real-Time Face Detection. INT J COM-PUT VISION 57(2), 137–154 (May 2004)
[34] Witten, I.H., Frank, E.: Data Mining: Practical machine learning toolsand techniques. Morgan Kaufmann (2005)
186

Fusing Social Media Cues: PersonalityPrediction from Twitter and Instagram
Published in: Companion Proceedings of the 25th World Wide Web Conference (WWW2016; Montreal, QC, CA)
MARCIN SKOWRON, Johannes Kepler University, Linz (AT) &Austrian Research Institute for Artificial Intelligence, Vienna (AT)
BRUCE FERWERDA, Johannes Kepler University, Linz (AT)MARKO TKALCIC, Free University of Bolzano, Bolzano (IT)MARKUS SCHEDL, Johannes Kepler University, Linz (AT)
Abstract
Incorporating users’ personality traits has shown to be instrumental inmany personalized retrieval and recommender systems. Analysis ofusers’ digital traces has become an important resource for inferringpersonality traits. To date, the analysis of users’ explicit and latentcharacteristics is typically restricted to a single social networking site(SNS). In this work, we propose a novel method that integrates text,image, and users’ meta features from two different SNSs: Twitter andInstagram. Our preliminary results indicate that the joint analysis ofusers’ simultaneous activities in two popular SNSs seems to lead to aconsistent decrease of the prediction errors for each personality trait.
Keywords: Social Media Mining, User Modeling, Personality Com-puting
1 Introduction and Related Work
In recent years, social networking sites (SNSs) have become a popularmeans for information exchange and social interactions. Users’ presenceand their online activities spread across different platforms, each with theirown interactive and content-oriented characteristics. The user-generatedcontent has been shown to yield important insights into users’ interests,preferences, and sentiments toward various topics. However, to date, theanalysis of users’ explicit and latent characteristics has been typically re-stricted to a single SNS.
Personality is a psychological construct accounting for individual differencesin people [9]. The most widely used Five-Factor Model comprises five traits:
187

Openness, Conscientiousness, Extraversion, Agreeableness and Neuroti-cism [6]. As users leave rich traces of their digital activities through SNSs,the collected data has become an important resource for inferring users’personality traits. The research domain has been gathered under the um-brella of personality computing [9]. One of the earliest works was pub-lished by Golbeck et al. [2], in which a variety of features related to a user’ssocial network membership and language use in microblogs were investi-gated. Quercia et al. [7] applied features related to the user’s activity andreputation in Twitter. Kosinski et al. [4] have collected a large dataset ofFacebook users and demonstrated the predictive value of users’ Likes toinfer personality traits. The frequently applied approaches focused on datafrom a single SNS. Nowadays, as users often provide clues that enable thelinkage between their respective profiles in different SNSs, there is an in-crease of amount of multi-network data. In this work, we present a range ofmultimodal personality regressors incorporating user information from twoSNSs and evaluate them against regressors trained on data acquired froma single SNS.
2 Method
Foundational concepts of social network research, including Lewin’s fieldtheory, motivate joint analysis of different networks of an individual, includ-ing the relations between personality traits and their manifestations in differ-ent SNSs. Previous studies have demonstrated that the visual [1], linguis-tic [2] and meta [7] features extracted from users’ generated online contentcan be instrumental for inferring personality traits. As the present workanalyses users’ activities in two popular SNSs, Instagram and Twitter, pri-marily used to share images and text, we developed a pipeline that extractsimage, linguistic, and users’ meta features related to their reputation and in-fluence. For Instagram images, the annotations include: Pleasure-Arousal-Dominance (PAD), brightness, saturation, hue-related and content-basedfeatures such as person’s face or full body, drawing inspiration from featuresused in the emotion detection technique proposed in [5]. For extraction oflinguistic features from tweets and Instagram image captions, we adaptedour annotation system [8], that integrates natural language processing re-sources (e.g., LIWC, ANEW) and classifiers (e.g., Dialog Acts, Sentiment).We also included users’ reputation and influence meta features based onusers’ publicly available counts: number of followers and followees, ’Klout’and adaptation of ’TIME’ influence scores [7].
To obtain compact feature representations of the accessible information, wecompute for each extracted feature: mean, standard deviation, minimum,
188
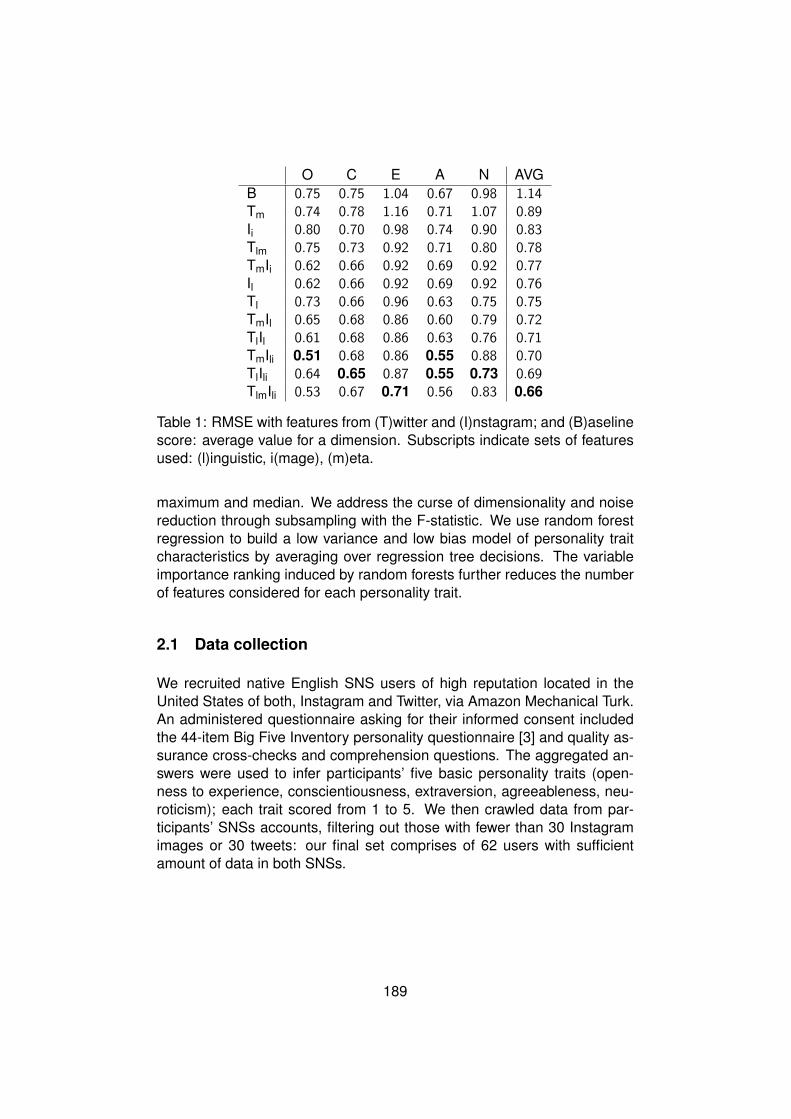
O C E A N AVGB 0.75 0.75 1.04 0.67 0.98 1.14Tm 0.74 0.78 1.16 0.71 1.07 0.89Ii 0.80 0.70 0.98 0.74 0.90 0.83Tlm 0.75 0.73 0.92 0.71 0.80 0.78TmIi 0.62 0.66 0.92 0.69 0.92 0.77Il 0.62 0.66 0.92 0.69 0.92 0.76Tl 0.73 0.66 0.96 0.63 0.75 0.75TmIl 0.65 0.68 0.86 0.60 0.79 0.72TlIl 0.61 0.68 0.86 0.63 0.76 0.71TmIli 0.51 0.68 0.86 0.55 0.88 0.70TlIli 0.64 0.65 0.87 0.55 0.73 0.69TlmIli 0.53 0.67 0.71 0.56 0.83 0.66
Table 1: RMSE with features from (T)witter and (I)nstagram; and (B)aselinescore: average value for a dimension. Subscripts indicate sets of featuresused: (l)inguistic, i(mage), (m)eta.
maximum and median. We address the curse of dimensionality and noisereduction through subsampling with the F-statistic. We use random forestregression to build a low variance and low bias model of personality traitcharacteristics by averaging over regression tree decisions. The variableimportance ranking induced by random forests further reduces the numberof features considered for each personality trait.
2.1 Data collection
We recruited native English SNS users of high reputation located in theUnited States of both, Instagram and Twitter, via Amazon Mechanical Turk.An administered questionnaire asking for their informed consent includedthe 44-item Big Five Inventory personality questionnaire [3] and quality as-surance cross-checks and comprehension questions. The aggregated an-swers were used to infer participants’ five basic personality traits (open-ness to experience, conscientiousness, extraversion, agreeableness, neu-roticism); each trait scored from 1 to 5. We then crawled data from par-ticipants’ SNSs accounts, filtering out those with fewer than 30 Instagramimages or 30 tweets: our final set comprises of 62 users with sufficientamount of data in both SNSs.
189

RMSE MAE PCCT [7] TlmIli T [2] TlmIli FB [4] TlmIli
O 0.69 0.51 0.12 0.11 0.43 0.74C 0.76 0.67 0.14 0.11 0.29 0.76E 0.88 0.71 0.16 0.17 0.40 0.65A 0.79 0.50 0.12 0.12 0.30 0.34N 0.85 0.73 0.19 0.16 0.30 0.71
AVG 0.79 0.73 0.15 0.13 0.30 0.64
Table 2: Personality traits regression accuracy of TlmIli along the state-of-the-art systems inferred from different SNSs: (T)witter, (I)nstagram, FB -Facebook, in terms of RMSE, MAE - Mean Absolute Error, PCC - PearsonCorrelation Coefficient.
3 Results and Conclusions
Table 1 presents personality regressor performances over different setsof features, using root-mean square error (RMSE) calculated over 5 in-dependent, 10-fold cross-validation runs, one for each personality trait.Results indicate that both, the set of features selected and the choice ofthe SNS or their combination, yield differences in regressor performance.The best results, overall and for each personality trait, are obtained inte-grating features extracted from both SNSs. The overall best performingregressor, TlmIli, uses a complete set of features (linguistic, image, andmeta). It is also most informative for Extraversion (RMSE: 0.71). Consci-entiousness (RMSE: 0.65), Agreeableness (RMSE: 0.55) and Neuroticism(RMSE: 0.73) are best regressed with the combination of linguistic fea-tures of tweets and captions with image features, while Openness (RMSE:0.51) using Twitter’s linguistic and meta plus Instagram image features. Asthere is no common, publicly available personality data-set that includesdata from multiple SNSs, in Table 2 we present the results of the TlmIliregressor along the state-of-the-art personality regression systems overdifferent data-sets. In the table we adopt the metrics used in the origi-nal papers [7, 4, 2]. Note that each study used different data sets acquiredfrom different SNSs, and while the presented results provide insights on theperformance of each regressor, different regressors are not directly compa-rable.
Our novel approach to Internet user personality recognition integrates userdata from two SNSs. The presented method can easily be adapted to otherSNSs and for inferring other types of explicit and latent user characteristics.Our first results indicate the potential of the proposed joint, multi-modalanalysis of user-generated data from different SNSs, justifying the ongo-ing detailed investigation, which also addresses theoretical issues such as
190

soundness conditions of such integration and includes a large scale eval-uation of the inferred users’ personality traits scores applied in recommen-dation systems.
4 Acknowledgments
This research is supported by the Austrian Science Fund (FWF): P25655,P27530-N15.
References
[1] Celli, F., Bruni, E., Lepri, B.: Automatic Personality and Interaction StyleRecognition from Facebook Profile Pictures. In: Proc. ACM Multimedia-MM ’14’. pp. 1101–04. ACM (2014), http://dl.acm.org/citation.cfm?doid=2647868.2654977
[2] Golbeck, J., Robles, C., Edmondson, M., Turner, K.: Predicting Per-sonality from Twitter. In: Proc. PASSAT and SocialCom. pp. 149–156.IEEE (2011), http://ieeexplore.ieee.org/lpdocs/epic03/wrapper.htm?arnumber=6113107
[3] John, O.P., Donahue, E.M., Kentle, R.L.: The big five inventory—versions 4a and 54. UCB, Inst. of Personality and Social Research,Berkeley, CA (1991)
[4] Kosinski, M., Stillwell, D., Graepel, T.: Private traits and attributes arepredictable from digital records of human behavior. PNAS 110(15),5802–5 (2013), http://www.pubmedcentral.nih.gov/articlerender.fcgi?artid=3625324\&tool=pmcentrez\&rendertype=abstract
[5] Machajdik, J., Hanbury, A.: Affective image classification using featuresinspired by psychology and art theory. In: Proc. ACM Multimedia - MM’10. pp. 83–92. ACM Press (2010), http://portal.acm.org/citation.cfm?doid=1873951.1873965
[6] McCrae, R.R., John, O.P.: An Introduction to the Five-Factor Model andits Applications. J. Pers. 60(2), 175 – 215 (1992)
[7] Quercia, D., Kosinski, M., Stillwell, D., Crowcroft, J.: Our twitter profiles,our selves: Predicting personality with twitter. In: Proc. PASSAT andSocialCom. pp. 180–185. IEEE (Oct 2011), http://ieeexplore.ieee.org/lpdocs/epic03/wrapper.htm?arnumber=6113111
191

[8] Skowron, M., Theunis, M., Rank, S., Borowiec, A.: Effect of affectiveprofile on communication patterns and affective expressions in interac-tions with a dialog system. In: ACII 2011, pp. 347–356. Springer (2011)
[9] Vinciarelli, A., Mohammadi, G.: A Survey of Personality Computing.IEEE Trans. Aff. Comp. 5(3), 273–291 (2014), http://ieeexplore.ieee.org/lpdocs/epic03/wrapper.htm?arnumber=6834774
192

7 User-Centric Evaluation of a MusicRecommender System
Ferwerda, B., Graus, M., Vall, A., Tkalcic, M., & Schedl, M. (2017)How Item Discovery Enabled by Diversity Leads to IncreasedRecommendation List Attractiveness. In Submission.
Ferwerda, B., Graus, M., Vall, A., Tkalcic, M., & Schedl, M. (2016)The Influence of Users’ Personality Traits on Satisfaction andAttractiveness of Diversified Recommendation Lists. In Ex-tended Proceedings of the 10th ACM Conference on Recom-mender Systems: 4th Workshop on Emotions and Personalityin Personalized Systems (Boston, MA, US).
193

How Item Discovery Enabled by DiversityLeads to Increased Recommendation ListAttractiveness
Published in: In Submission (2017)
BRUCE FERWERDA, Johannes Kepler University, Linz (AT)MARK GRAUS, Eindhoven University of Technology, Eindhoven (NL)ANDREU VALL, Johannes Kepler University, Linz (AT)MARKO TKALCIC, Free University of Bolzano, Bolzano (IT)MARKUS SCHEDL, Johannes Kepler University, Linz (AT)
Abstract
Applying diversity to a recommendation list has been shown to pos-itively influence the user experience. A higher perceived diversity isargued to have a positive effect on the attractiveness of the recom-mendation list and on the difficulty to make a choice. In a user studywe presented 100 participants with several personalized lists of rec-ommended music artists varying in levels of diversity. Participantswere asked to assess these lists on perceived diversity and attractive-ness, the experienced choice difficulty and discovery (i.e., the extentthe list enriches their taste). We found that recommendation list attrac-tiveness is influenced by two effects: 1) by diversity mediated throughdiscovery; diverse recommendation lists are perceived more attractiveif they enrich the user’s taste or 2) by the list familiarity; a higher listfamiliarity contributes to a higher list attractiveness. We additionallyrevealed how individual differences (i.e., personality and familiarity)moderate the effects found.
Keywords: Diversity, Recommender Systems, User-Centric Evalu-ation
1 Introduction
Recommender systems are usually designed in such a way that they pro-vide the most relevant items to the user. However, this often results in a setof recommendations that are too similar to each other and thereby not cov-ering the full spectrum of the user’s interest [1]. Diversifying the recommen-dations can positively influence the user experience of the user [6, 11, 12,13]. The diversification of the recommendations has been shown to con-
194

tribute to the attractiveness of the recommendation list, which can reducethe choice difficulty and increase the user’s choice satisfaction [6, 11].
Although recommendation diversification has been shown to have a posi-tive influence on the perceived attractiveness of the recommendation list.The reason behind this phenomenon has not yet been fully investigatedthough. In this paper we take a deeper look at what leads to a higherattractiveness of the recommendation list, which subsequently leads to alower choice difficulty. By testing differently diversified music recommenda-tion lists, we show that the attractiveness of the lists can be increased bylist diversity if the items contribute to enriching the taste of the user. How-ever, although the effect is weaker, list attractiveness can also be increasedby presenting a list that users are familiar with. Next to the known modera-tors, such as expertise and preference strength [9, 12], we show that users’personality plays a significant moderating role on aspects of the user ex-perience. Our findings provide new insights on how to effectively createrecommendation lists in order to increase list attractiveness and therebydecrease user’s choice difficulties.
2 Related Work
Diversification of recommendations has been shown to influence the userexperience. Too similar recommendations or lack of diversity can have neg-ative consequences [1]. Ziegler et al. [13] argued that recommendation listdiversity can have positive effects on the user perception of the recommen-dation lists, and proposed a diversity algorithm to vary the recommenda-tion list diversity without affecting the prediction accuracy. Willemsen etal. [11, 12] investigated the influence of diversity on movie recommenda-tions and found that diversity has a positive effect on the attractiveness ofthe recommendation set, the difficulty to make a choice, and eventually onthe choice satisfaction.
Personal characteristics (e.g., preference strength and expertise [9, 12])have been identified as moderators that influence the relationship betweendiversification and the user experience. Another personal characteristicthat may play a role is the user’s personality. Personality traits have beenshown to be an enduring factor with relationships to one’s taste, preference,and interest (e.g., [2, 10]), and therefore lends itself to create user mod-els with. The five-factor model (FFM) is the most known and widely usedmodel, which categorizes personality into five general dimensions that de-scribe personality in terms of: openness to experience, conscientiousness,extraversion, agreeableness, and neuroticism [5].
195

3 Data Preparation & Procedures
We created differently diversified music recommendation lists for partici-pants in order to investigate the effects underlying the increase of recom-mendation list attractiveness. Since we created the recommendation listsoff-line, we separated the study in two parts. In the first part participantswere recruited and their complete Last.fm listening history was crawled inorder to create the recommendation lists. After the lists were created, par-ticipants from the first part were invited for the second part where they wereasked to assess the diversified recommendation lists.
We recruited 254 participants through Amazon Mechanical Turk for the firstpart of the study. Participation was restricted to those located in the UnitedStates with a very good reputation (≥95% HIT approval rate and ≥1000HITs approved) and a Last.fm account with at least 25 listening events. Fur-thermore, they were asked to fill in the 44-item Big Five Inventory person-ality questionnaire [5] to measure the FFM. Control questions were askedto filter out fake and careless contributions. A compensation of $1 was pro-vided. We crawled the complete listening history of each participant andaggregated the listening events to represent artist and playcount (i.e., num-ber of times listened to an artist).
In order to prepare the music recommendation lists for each participant,we complemented our data with the LFM-1b dataset [8]. 1 This datasetconsists of the complete listening histories of 120,322 Last.fm users fromdifferent countries. Since our participants were all located in the UnitedStates, we only used United States users of the LFM-1b dataset to comple-ment our dataset with. This resulted in 10,255 additional users, which wealso aggregated into artist and playcount for each user. The final datasetconsists of user, artist, and artist playcount triplets with a total of 387,037unique artists for the creation of the recommendation lists.
We used the weighted matrix factorization algorithm by [4] on our finaldataset to calculate the recommended items. This algorithm is specificallydesigned to deal with datasets consisting of implicit feedback (e.g., artistplaycounts). We optimized the factorization hyper-parameters by conduct-ing grid-search and picking the setting that yielded the best 5-fold cross-validated mean percentile rank. Specifically, using 20 factors, confidencescaling factor α=40, regularization weight λ=1000 and 10 iterations of al-ternating least squares, we achieved the best 5-fold cross-validated meanpercentile rank of 1.78%. 2 Afterwards we factorized the whole user-artist
1Available at http://www.cp.jku.at/datasets/LFM-1b/2See [4] for details on the hyper-parameters and the definition of the mean percentile
rank metric.
196

triplets using this set of hyper-parameters.
The recommended items were diversified as was done in [11, 12] by usingthe method of [13]. By using the latent features as the basis of diversi-fication instead of additional metadata like genre information (as is donein content-based recommender systems) guarantees that diversity is ma-nipulated in line with user preferences. Previous research demonstratedthat this way of diversifying recommendations is perceived accordingly byusers [11].
A greedy selection to optimize the intra-list similarity [1] was run on thetop 200 recommended artists (i.e., the 200 artists with highest predictedrelevance) to maximize the distances between item vectors in the matrixfactorization space. This algorithm starts with a recommendation set con-sisting of the artist with highest predicted relevance. In an iterative fashionitems are added to the recommendation set until it contains 10 items.
In each step of the iteration, for each candidate item i the sum of all dis-tances from its item vector to each item vector in the recommendation setis calculated: ci =
z∑j=1
d(i, j), where z is the number of items in the rec-
ommendation set and d(i, j) is the Euclidean distance between two itemvectors i and j. All candidate items are ranked based on decreasing valueof ci (Pci) and on predicted relevance (Pri). A weighting factor β is in-troduced to balance the trade-off between predicted relevance and diver-sity. For each candidate item the combined rank is calculated followingw∗i = β ∗ Pci + (1 − β) ∗ Pri . The item with the highest combined rank is
added to the recommendation set and the next step is taken until 10 itemsare selected.
β was manipulated to achieve different levels of diversification. In the de-scribed implementation β=1 corresponds to maximum diversity, β=0 corre-sponds to maximum predicted relevance. We compared recommendationlists for different values of β in terms of the sum of distances between thelatent features scores of items in the recommendation set and their aver-age range. The list for β=0.4 showed to fall halfway between maximumrelevance and maximum diversity. Thus, the final β levels for diversificationwere set at β=0 (low), β=0.4 (medium), and β=1 (high).
After the recommendation lists were created, emails were sent out to allparticipants to invite them for the second part of the study. We created alogin screen so that we could retrieve the personalized recommendationlists for each participant. After the log in, the participant was sequentiallypresented with a recommendation list for three times, with each time a dif-ferent level of diversity (i.e., low, medium, or high. The order of presentationwas randomized). Each recommended artist was enriched with metadata
197

from Last.fm (i.e., picture, genre, top 10 songs with the number of listenersand playcounts), which was shown when hovered over the name in the list.Additionally, example songs were provided by clicking on the artist name(new browser screen linked to the artist’s YouTube page). Participants wereasked to answer questions about perceived diversity, choice simplicity, rec-ommendation attractiveness, music discovery, and list familiarity 3 beforemoving on to the next list. These questions needed to be answered foreach of the three lists.
After the participant assessed all three recommendation lists, we performeda manipulation check by placing the three lists next to each other (ran-domly ordered) and asked the participant to rank order the lists by diversity.The study ended with a short questionnaire about their music expertise(Goldsmiths Musical Sophistication Index [7]) and their general preferencestrength (adapted from [12]).
There were 103 participants who returned for the second part of the study.We included several control questions to filter out careless contributions,which left us with 100 participants for the analyses. Age: 18-65 (median28), gender: 54 male, 46 female, and were compensated with $2.
4 Results
4.1 Manipulation Check
A Wilcoxon signed-rank test was used to test the perceived diversity levelsof the recommendation lists. Results show an increase of perceived diver-sity by comparing the low diversity (M=1.28) against the medium (M=2.05,r=.60, Z=10.370, p<.001) and high condition (M=2.65, r=.80, Z=13.784,p<.001). A significant diversity increase was also found between mediumand high (r=.45, Z=7.711, p<.001).
4.2 Measures
Items in the questionnaire were assessed using a confirmatory factor anal-ysis (CFA) to determine whether they convey the predicted constructs. Af-ter deleting questions with high cross-loadings and low commonalities, themodel consisting of six constructs showed a good fit: χ2(390)=695.4, p<.001,
3Questions measuring perceived diversity, choice simplicity and recommendation attrac-tiveness were adapted from [12]. We created the questions measuring music discoveryand list familiarity in order to understand the relationship between perceived diversity andrecommendation attractiveness.
198

CFI=.96, TLI=.95, RMSEA=.05. 4 The constructs with their items areshown below (5-point Likert scale; Disagree strongly-Agree strongly. Cron-bach’s alpha (α) and the average variance extracted (AVE) of each con-struct showed good values (i.e., α>.8, AVE>.5), indicating convergent va-lidity. The square root of the AVE for each construct is higher than any of thefactor loading of the respective construct; indicating good discriminant va-lidity. For the standardized personality and music expertise questionnairessee [5] and [7]):
Choice Simplicity (AVE=.820, α=.932):
• I would find it easy to choose an artist to listen to because it stands outfrom the rest.
• I would find it difficult to choose an artist to listen to because all recom-mendations were equally bad.
• Many artists had comparable good aspects.
Recommendation Attractiveness (AVE=.881, α=.980):
• I am satisfied with the list of recommended artists.• In most ways the recommended artists were close to ideal.• The list of artist recommendations meet my exact needs.• I would give the recommended artists a high rating.• The list of artists showed too many bad items.• The list of artists was attractive.• The list of recommendations matched my preferences.
Discovery (AVE=.914, α=.955):
• The recommendations broadened my taste.• The recommendations deepened my taste.
List Familiarity (AVE=.871, α=.953):
• I am familiar with the recommended artists.• I did not know the artists from the list.• I already listen to the artists that were recommended.
Perceived Diversity (AVE=.816, α=.957):
• The list of artists was varied.4Cutoff values for the fit indices are proposed to be: CFI>.96, TLI>.95, and
RSMEA<.05 [3].
199

PersonalityTraits
Figure 1: Path model. The numbers near the arrows denote the estimatedmeans and the standard deviations. Personality: (O)penness to experi-ence, (C)onscientiousnes, (E)xtraverion, (A)greeableness, (N)euroticsm.
• All the artists were similar to each other.• Most artists were from the same genre.• Many of the artists in the lists differed from other artists in the list.• The artists differed a lot from each other on different aspects.
Strength of Preference (single item):
• I know what kind of music I like.
4.3 SEM Model
We created a path model with the subjective constructs of the CFA togetherwith the personality and music expertise constructs using structural equa-tion modeling (SEM) following the framework of Knijnenburg et al. [6] as aguideline (Figure 1). No order effects were observed in the order of pre-sentation of the lists. The fit statistics show that the model has a good fit:χ2(431)=701.4, p<.001, CFI=.96, TLI=.96, RMSEA=.04. Only effects ofp<.05 are included in the model. The diversity conditions medium and highare compared against the low diversity condition.
The medium and high diversification both show an increase in perceiveddiversity. Additionally, some of the personality traits show a moderationeffect on how the diversity of the recommendation list is perceived: thosewho scored higher on openness to experience and agreeableness perceivea higher degree of diversity of the lists.
A higher perceived diversity has a positive influence on the discovery of
200

music (i.e., enriching ones taste). This effect is higher for those scoringhigh on the neuroticism scale, but lower for those who are familiar with thelist. Discovery is furthermore influenced by list familiarity; more familiar withthe list has a negative effect on the discovery of new music. The familiaritywith the recommendation list is dependent on the level of diversity as wellas on the music expertise. A higher list diversification results in lower listfamiliarity, while a higher music expertise results in higher familiarity.
The attractiveness of the recommendations is influenced by several con-structs: perceived diversity, discovery, strength of preference, and list fa-miliarity. Perceived diversity has a negative effect on the recommendationattractiveness, this effect gets stronger for those having a predefined pref-erence. However, the effect becomes positive when it goes through thediscovery of music; a higher attractiveness is achieved when the diversifiedlist is able to enrich the music taste of people than when only recommend-ing diverse items. Furthermore, strength of preference and list familiarityhave both a positive effect on the perceived attractiveness.
The simplicity of making a choice is influenced by the recommendationattractiveness as well as by the strength of preference and list familiarity.The more attractive the recommendations are, the easier it becomes tomake a choice. This effect is moderated by two personality traits and bylist familiarity. The strength of recommendation attractiveness on choicesimplicity is lower for those scoring high on openness to experience, buthigher for those scoring high on agreeableness and those who are familiarwith the list. Also the preference strength and list familiarity plays a positiverole on the ease of making a choice.
5 Conclusion & Discussion
We showed to be able to effectively increase the diversity in the list of rec-ommendations as it was reflected in the participants’ increased perceiveddiversity. By increasing the list diversity and thereby increasing its per-ceived diversity, we show how the perceived recommendation list attrac-tiveness is influenced. Our results indicate that recommendation list at-tractiveness is influenced by two effects: 1) by diversity mediated throughdiscovery; diverse recommendation lists are perceived more attractive ifthey enrich the user’s taste, or 2) by the list familiarity; a higher familiar-ity contributes to a higher attractiveness. Although these two ways wereidentified to increase list attractiveness, list diversification yields a strongereffect to increase the attractiveness and to subsequently increase choicesimplicity.
201

Figure 2: Marginal means with error bars of one std. error of the mean:perceived diversity (PD), list familiarity (LF), discovery (DI), recommenda-tion attractiveness (RA), choice simplicity (CS).
Despite the new insights we provided on how diversification affects rec-ommendation list attractiveness, our net effect of diversification on choicesimplicity and recommendation attractiveness is negative (Figure 2). Thisin contrast to prior work [11, 12] showing opposite effects. A possible ex-planation for this opposing effect may be a domain dependency (movies incited work versus music in this study). Specifically the range in which wediversified (i.e., top 200) may be too broad for the music domain. Althoughwe took the same range as prior work, music consist of more variable com-ponents (e.g., variations in genre, artist, context). By diversifying within thetop 200, we may have created recommendation lists with items that are toofar outside the spectrum of the user’s taste; resulting in increasingly lessattractive lists. We will further investigate the reason behind our negativenet effect of diversification in future work.
In addition, we identified that personality traits play a significant moderatingrole in the relationship between recommendation attractiveness and choicesimplicity: open people seem to have more difficulties to make a choiceout of attractive items than those scoring high on agreeableness. This maybe because open people have a preference for variety [5] and therefore adiverse list, but with equally attractive items, makes it more difficult to make
202

a choice. Agreeable people, on the other hand, tend to be tactful [5]; adiverse list would allow them to make more tactical choices.
Although prior work has shown that recommendation list diversity leads toa decrease in choice difficulties by increasing the list attractiveness [12], weprovide new insights by showing that this effect occurs by enriching one’staste through the ability to discover new items. Furthermore, personal char-acteristics (e.g., expertise and strength preference) have been identified tobe important moderators (e.g., [9, 12]). With personality we found an addi-tional personal characteristic that should be taken into account.
We were unable to effectively measure choice satisfaction. Due to thewithin-subjects design of our experiment we did not ask participants tomake a choice, but rather assess the recommendation lists. However,prior work (e.g., [12, 13]) has shown that choice simplicity leads to a higherchoice satisfaction in recommender systems. We will address this questionin future work.
6 Acknowledgments
Supported by the Austrian Science Fund (FWF): P25655.
References
[1] Castells, P., Hurley, N.J., Vargas, S.: Novelty and diversity in recom-mender systems. In: Recommender Systems Handbook, pp. 881–918. Springer (2015)
[2] Ferwerda, B., Schedl, M., Tkalcic, M.: Personality & emotional states:Understanding users’ music listening needs. UMAP 2015 ExtendedProceedings
[3] Hu, L.t., Bentler, P.M.: Cutoff criteria for fit indexes in covariance struc-ture analysis: Conventional criteria versus new alternatives. Structuralequation modeling: a multidisciplinary journal 6(1), 1–55 (1999)
[4] Hu, Y., Koren, Y., Volinsky, C.: Collaborative filtering for implicit feed-back datasets. In: ICDM (2008)
[5] John, O.P., Donahue, E.M., Kentle, R.L.: The big five inventory: Ver-sions 4a and 54, institute of personality and social research. UCBerkeley (1991)
203

[6] Knijnenburg, B.P., Willemsen, M.C., Gantner, Z., Soncu, H., Newell,C.: Explaining the user experience of recommender systems. UMUAI(2012)
[7] Müllensiefen, D., Gingras, B., Stewart, L., Musil, J.: Goldsmiths musi-cal sophistication index (2012)
[8] Schedl, M.: The LFM-1b Dataset for Music Retrieval and Recommen-dation. In: Proceedings of the ACM International Conference on Mul-timedia Retrieval (ICMR). New York, USA (June 2016)
[9] Scheibehenne, B., Greifeneder, R., Todd, P.M.: What moderates thetoo-much-choice effect? Psychology & Marketing 26(3), 229–253(2009)
[10] Tkalcic, M., Ferwerda, B., Hauger, D., Schedl, M.: Personality corre-lates for digital concert program notes. UMAP 2015, Springer LNCS9146 (2015)
[11] Willemsen, M.C., Graus, M.P., Knijnenburg, B.P.: Understanding therole of latent feature diversification on choice difficulty and satisfaction.UMUAI (under revision)
[12] Willemsen, M.C., Knijnenburg, B.P., Graus, M.P., Velter-Bremmers,L.C., Fu, K.: Using latent features diversification to reduce choice dif-ficulty in recommendation lists. RecSys 11, 14–20 (2011)
[13] Ziegler, C.N., McNee, S.M., Konstan, J.a., Lausen, G.: Improving rec-ommendation lists through topic diversification. WWW p. 22 (2005)
204

The Influence of Users’ Personality Traitson Satisfaction and Attractiveness ofDiversified Recommendation Lists
Published in: Extended Proceedings of the 10th ACM Conference on RecommenderSystems (RecSys 2016): 4th Workshop on Emotions and Personality in PersonalizedSystems (EMPIRE 2016; Boston, MA, US)
BRUCE FERWERDA, Johannes Kepler University, Linz (AT)MARK GRAUS, Eindhoven University of Technology, Eindhoven (NL)ANDREU VALL, Johannes Kepler University, Linz (AT)MARKO TKALCIC, Free University of Bolzano, Bolzano (IT)MARKUS SCHEDL, Johannes Kepler University, Linz (AT)
Abstract
Diversifying recommendations has shown to be a good means to coun-teract on choice difficulties and overload, and is able to positivelyinfluence subjective evaluations, such as satisfaction and attractive-ness. Personal characteristics (e.g., domain expertise, prior prefer-ence strength) have shown to influence the desired level of diversityin a recommendation list. However, only personal characteristics thatare directly related to the domain have been investigated so far. Inthis work we take personality traits as a general user model and showthat specific traits are related to a preference for different levels of di-versity (in terms of recommendation satisfaction and attractiveness).Among 103 participants we show that conscientiousness is related toa preference for a higher degree of diversification, while agreeable-ness is related to a mid-level diversification of the recommendations.Our results have implications on how to personalize recommendationlists (i.e., the amount of diversity that should be provided) dependingon users’ personality.
Keywords: Diversity, Recommender Systems, User-Centric Evalu-ation, Personality
1 Introduction
Providing users with a diversified list of recommendations has shown tohave positive effects on the user experience. With an abundance of choicesavailable nowadays, providing diversity in the recommendations can coun-teract on the negative psychological effects that users may experience,
205

such as choice overload and choice difficulties [26]. These negative effectsare caused by recommender systems, which are originally designed to out-put recommendations that are closest to the user’s interest. The closer tothe user’s interest, the higher the accuracy of the recommender system al-gorithm, but also results in recommendations that are often too similar toeach other (e.g., same level of attractiveness to the user). This does notonly increase the chance of choice overload and choice difficulties to theuser, but also increases the possibility of not covering the full spectrum ofthe user’s interest [3].
Although prior research has shown that recommendation diversity has pos-itive effects on the user experience, differences between diversity needs ofusers have not been given a lot of attention. Domain expertise and priorchoice preferences have shown to play a role in the amount of diversity de-sired by the user [2, 6, 26]. Others have shown that diversity needs canalso be related to cultural dimensions [7, 14]. In this work we consider per-sonality traits as an indicator of satisfaction and attractiveness on differentlydiversified music recommendation lists.
The use of personality as a general model for users has gained increasedinterest. Several works revealed personality-based relationships with users’behavior, preferences, and needs (e.g., [10, 15, 25]), how to implicitly ac-quire personality traits of users from social media trails (e.g., Facebook [1,4, 12, 20], Twitter [16, 21], and Instagram [11, 13, 24]), and how personalitytraits can be implemented into a personalized system [8, 9]. With our workwe contribute to the personality research by providing more insights intopersonality-related diversity needs. We found among 103 participants thatthe conscientiousness and agreeableness personality traits play a role inthe desired amount of diversity in a recommendation list. While conscien-tious participants showed a higher degree of satisfaction and attractivenesswith the more diversified recommendations, agreeable participants weremore satisfied and found the list more attractive with medium amount ofdiversity in the recommendations.
206

2 Related work
The positive effects of recommendation list diversity has been shown byseveral researchers. Bollen et al. [2] and Willemsen et al. [26] investigatedthe influence of diversity on movie recommendations and found that diver-sity has a positive effect on the attractiveness of the recommendation set,the difficulty to make a choice, and eventually on the choice satisfaction.Besides the positive effects of diversification, also personal characteristicsplay a role on the attractiveness of the diversified recommendation list (e.g.,strength of prior preference or domain expertise [2, 23]). Bollen et al. [2]found that expertise in the domain showed a positive effect on the itemattractiveness.
The personal characteristics that have been identified so far are domainspecific to the kind of recommendations. However, a more general per-sonal characteristic may be present that influences the subjective evalua-tions with the diversified recommendations. Personality has shown to bean enduring factor, which can relate to one’s taste, preference, and inter-est (e.g., [5, 10, 25]). Chen et al. [5] and Wu et al. [27] showed relation-ships with personality and preference for diversification based on differ-ent movie characteristics (e.g., genre, artist, director). Ferwerda et al. [10]showed that music preferences can be related to the personality of the lis-tener, whereas Tkalcic et al. [25] found relationships between personalitytraits and the preference of being exposed to certain amounts of multimediameta-information.
In this work we investigate whether personality traits can be considered apersonal characteristic that influences the subjective evaluations of diver-sified recommendation lists. To this end, we rely on the widely used five-factor model (FFM), which categorizes personality into five general dimen-sions: openness to experience, conscientiousness, extraversion, agree-ableness, and neuroticism [19].
3 Data Preparation & Procedures
We created differently diversified music recommendation lists in order toinvestigate the influence of personality traits on the subjective evaluation ofthe recommendation lists. Since we created the recommendation lists off-line, we separated the study in two parts. In the first part participants wererecruited and their complete Last.fm listening history was crawled in orderto create the recommendation lists. After the lists were created, participantsfrom the first part were invited for the second part where they were asked
207

to assess the diversified recommendation lists.
We recruited 254 participants through Amazon Mechanical Turk for the firstpart of the study. Participation was restricted to those located in the UnitedStates with a very good reputation (≥95% HIT approval rate and ≥1000HITs approved) and a Last.fm account with at least 25 listening events.Furthermore, they were asked to fill in the 44-item Big Five Inventory per-sonality questionnaire [19] to measure the FFM. Control questions wereasked to filter out fake and careless contributions. A compensation of $1was provided. We crawled the complete listening history of each participantand aggregated the listening events to represent artist and playcount (i.e.,number of times listened to an artist).
In order to prepare the music recommendation lists for each participant,we complemented our data with the LFM-1b dataset [22]. 1 This datasetconsists of the complete listening histories of 120,322 Last.fm users fromdifferent countries. Since our participants were all located in the UnitedStates, we only used the United State users of the LFM-1b dataset to com-plement our dataset. This resulted in 10,255 additional users, which wealso aggregated into artist and playcount for each user. The final datasetconsists of user, artist, and artist playcount triplets with a total of 387,037unique artists for the creation of the recommendation lists.
We used the weighted matrix factorization algorithm of [18] on our finaldataset to calculate the recommended items. This algorithm is specificallydesigned to deal with datasets consisting of implicit feedback (e.g., artistplaycounts). We optimized the factorization hyper-parameters by conduct-ing grid-search and picking the setting that yielded the best 5-fold cross-validated mean percentile rank. Specifically, using 20 factors, confidencescaling factor α=40, regularization weight λ=1000 and 10 iterations of al-ternating least squares, we achieved the best 5-fold cross-validated meanpercentile rank of 1.78%. 2 Afterwards we factorized the whole user-artisttriplets using this set of hyper-parameters.
The recommended items were diversified as was done in [26] by using themethod of [28]. By using the latent features as the basis of diversificationinstead of additional metadata like genre information (as is done in content-based recommender systems) guarantees that diversity is manipulated inline with user preferences. Previous research demonstrated that this way ofdiversifying recommendations is perceived accordingly by users [26].
A greedy selection to optimize the intra-list similarity [3] was run on thetop 200 recommended artists (i.e., the 200 artists with highest predicted
1Available at http://www.cp.jku.at/datasets/LFM-1b/2See [18] for details on the hyper-parameters and the definition of the mean percentile
rank metric.
208

relevance) to maximize the distances between item vectors in the matrixfactorization space. This algorithm starts with a recommendation set con-sisting of the artist with highest predicted relevance. In an iterative fashionitems are added to the recommendation set until it contains 10 items.
In each step of the iteration, for each candidate item i the sum of all dis-tances from its item vector to each item vector in the recommendation setis calculated: ci =
z∑j=1
d(i, j), where z is the number of items in the rec-
ommendation set and d(i, j) is the Euclidean distance between two itemvectors i and j). All candidate items are ranked based on decreasing valueof ci (Pci) and on predicted relevance (Pri). A weighting factor β is in-troduced to balance the trade-off between predicted relevance and diver-sity. For each candidate item the combined rank is calculated followingw∗i = β ∗ Pci + (1 − β) ∗ Pri . The item with the highest combined rank is
added to the recommendation set and the next step is taken until 10 itemsare selected.
β was manipulated to achieve different levels of diversification. In the de-scribed implementation β=1 corresponds to maximum diversity, β=0 corre-sponds to maximum predicted relevance. We compared recommendationlists for different values of β in terms of the sum of distances between thelatent features scores of items in the recommendation set and their aver-age range. The list for β=0.4 showed to fall halfway between maximumrelevance and maximum diversity. Thus, the final β levels for diversificationwere set at β=0 (low), β=0.4 (medium), and β=1 (high).
After the recommendation lists were created, emails were sent out to allparticipants to invite them for the second part of the study. We created a lo-gin screen so that we could retrieve the personalized recommendation listsfor each participant. After the log in, the participant was sequentially pre-sented with a recommendation list for three times, with each time a differentlevel of diversity (i.e., low, medium, or high). The order of presentation wasrandomized. Each recommended artist was enriched with metadata fromLast.fm (i.e., picture, genre, Top-10 songs with the number of listeners andplaycounts), which was shown when hovered over the name in the list.Additionally, example songs were provided by clicking on the artist name(new browser screen linked to the artist’s YouTube page). Participants wereasked to answer questions about perceived diversity, recommendation sat-isfaction, and recommendation attractiveness 3 before moving on to thenext list. These questions needed to be answered for each of the threelists.
3Questions measuring perceived diversity and recommendation attractiveness wereadapted from [26].
209
After the participant assessed all three recommendation lists, we performeda manipulation check by placing the three lists next to each other (randomlyordered) and asked the participant to rank order the lists by diversity.
There were 103 participants who returned for the second part of the study.We included several control questions to filter out careless contributions,which left us with 100 participants for the analyses. Age: 18-65 (median28), gender: 54 male, 46 female, and were compensated with $2.
4 Results
4.1 Manipulation Check
A Wilcoxon signed-rank test was used to test the perceived diversity levelsof the recommendation lists. Results show an increase of perceived diver-sity by comparing the low diversity (M=1.28) against the medium (M=2.05,r=.60, Z=10.370, p<.001) and high condition (M=2.65, r=.80, Z=13.784,p<.001). A significant diversity increase was also found between mediumand high (r=.45, Z=7.711, p<.001).
4.2 Measures
Items in the questionnaire were assessed using a confirmatory factor anal-ysis (CFA) with repeated ordinal dependent variables and a weighted leastsquares estimator to determine whether the questions convey the predictedconstructs. After deleting questions with high cross-loadings and low com-monalities, the model consisting of three constructs showed a good fit:χ2(32)=108.6, p<.001, CFI=.99, TLI=.98, RMSEA=.06. 4 The constructswith their items are shown below (5-point Likert scale; Disagree strongly-Agree strongly). The Cronbach’s alpha (α) and the average variance ex-tracted (AVE) of each construct showed good values (i.e., α>.8, AVE>.5),indicating convergent validity. Also, the square root of the AVE for eachconstruct is higher than any of the factor loadings (FL) of the respectiveconstruct, which indicates good discriminant validity.
Perceived Diversity (AVE=.723, α=.887):
• The list of artists was varied. (FL=.858)• Many of the artists in the lists differed from other artists in the list. (FL=.837)
4Cutoff values for a good model fit are proposed to be: CFI>.96, TLI>.95, andRSMEA<.05 [17].
210

• The artists differed a lot from each other on different aspects. (FL=.855)
Recommendation Satisfaction (AVE=.821, α=.932):
• I am satisfied with the list of recommended artists.(FL=.927)
• In most ways the recommended artists were close to ideal. (FL=.905)• The list of artist recommendations meet my exact needs. (FL=.885)
Recommendation Attractiveness (AVE=.771, α=.931):
• I would give the recommended artists a high rating.(FL=.874)
• The list of artists showed too many bad items.(FL=-.830)
• The list of artists was attractive. (FL=.914)• The list of recommendations matched my preferences.
(FL=.893)
4.3 Analysis
We used a repeated measures ANOVA in order to investigate the influenceof personality traits on the subjective evaluations of the diversified musicrecommendation lists. Below the results of personality traits on the differentsubjective evaluations are provided. The effects between diversity levelsare all compared against the low diversity condition.
4.3.1 Personality on Perceived Diversity
Results show that Mauchly’s test is not violated (χ2(2)= .115, p=.944), sosphericity can be assumed. The results show that there are no signifi-cant main effects of the different personality traits on perceived diversity.However, a general difference in perceived diversity can be assumed (F (2,22)=51.029, p<.001). Exploring the differences between the levels of di-versified recommendation lists show that there is an increase in perceiveddiversity when comparing the low diversified list against the medium (F (1,11)=11.596, p<.001) and the high diversified lists (F (1, 11)=31.191, p<.001). This confirms once more that our diversification was effective andwas perceived as such by the participants.
211

4.3.2 Personality on Recommendation Satisfaction
Mauchly’s test shows that sphericity is not violated (χ2(2)= 1.830, p=.401),and therefore no correction is needed. Assessing the effect of the differentpersonality traits on the recommendation satisfaction, the following person-ality traits show a main effect: conscientiousness (F (4, 22)=2.454, p<.05)and agreeableness (F (4, 22)=3.886, p<.05). Additional analyses by look-ing at the levels between the diversity levels (i.e., low, medium, and highdiversification) show that conscientious participants are increasingly satis-fied when provided a higher degree of diversity: medium diversity (F (2,11)=3.994, p<.05) and high diversity (F (2, 11)=4.036, p<.05). However, thesatisfaction differences for agreeable participants show a higher satisfac-tion for the medium diversification (F (2, 11)=9.660, p<.05) than for the highdiversification (F (2, 11)=4.036, p<.05).
4.3.3 Personality on Recommendation Attractiveness
Assessing Mauchly’s test shows that there is no violating of sphericity (χ2(2)=1.860 p=.395). Also here, results show main effects for the conscientious-ness (F (4, 22)=3.157, p<.05) and agreeableness (F (4, 22)=3.469, p<.05)personality traits. By looking at the differences between the levels of diver-sification, we found similar patterns as with satisfaction. Results show thatconscientious participants were increasingly more attracted to more diver-sified recommendation lists: medium (F (2, 11)=2.955, p<.05), high (F (2,11)=7.866, p<.05). Participants scoring high on the agreeableness person-ality traits show to be more attracted to the medium (F (2, 11)=5.933, p<.05)diversified list than to the high (F (2, 11)=5.314, p<.05) diversified list.
5 Conclusion & Discussion
Our results show that certain personality traits (i.e., conscientiousness andagreeableness) are related to the subjective evaluations of diversified rec-ommendation lists. We found that conscientious people judged a higherdegree of diversity more attractive and were more satisfied with it, whereasagreeable people showed to have more interest (i.e., list attractiveness andsatisfaction) in a medium degree of diversity.
The relationships that we found can be used in personality-based systemsas proposed in [8]. With the increased connectedness of applications, suchas recommender systems, with social networking sites, users’ personalitycan be acquired without the need of behavioral data in the application (e.g.,
212

via Facebook [1, 4, 12, 20], Twitter [16, 21], or Instagram [11, 13, 24]). Byidentifying relationships with users’ personality traits, such as in this work,cross-domain inferences about users’ preferences and needs can be madeand implemented to provide a personalized experience to users.
6 Acknowledgments
Supported by the Austrian Science Fund (FWF): P25655.
References
[1] Back, M.D., Stopfer, J.M., Vazire, S., Gaddis, S., Schmukle, S.C.,Egloff, B., Gosling, S.D.: Facebook profiles reflect actual personality,not self-idealization. Psychological Science 21, 372–374 (2010)
[2] Bollen, D., Knijnenburg, B.P., Willemsen, M.C., Graus, M.: Under-standing choice overload in recommender systems. In: Proceedingsof the fourth ACM conference on RecSys. pp. 63–70. ACM (2010)
[3] Castells, P., Hurley, N.J., Vargas, S.: Novelty and diversity in recom-mender systems. In: Recommender Systems Handbook, pp. 881–918. Springer (2015)
[4] Celli, F., Bruni, E., Lepri, B.: Automatic personality and interaction stylerecognition from facebook profile pictures. In: Proceedings of the ACMMM (2014)
[5] Chen, L., Wu, W., He, L.: How personality influences users’ needs forrecommendation diversity? In: Proceeding of CHI’13 EA. ACM (2013)
[6] Ekstrand, M.D., Harper, F.M., Willemsen, M.C., Konstan, J.A.: Userperception of differences in recommender algorithms. In: Proceedingsof the 8th ACM Conference on Recommender systems. pp. 161–168.ACM (2014)
[7] Ferwerda, B., Schedl, M.: Investigating the relationship between diver-sity in music consumption behavior and cultural dimensions: A cross-country analysis. In: Proc. of the 1st Workshop on SOAP (2016)
[8] Ferwerda, B., Schedl, M.: Enhancing Music Recommender Systemswith Personality Information and Emotional States: A Proposal. In:Proceedings of the 2nd Workshop on EMPIRE (2014)
213

[9] Ferwerda, B., Schedl, M.: Personality-Based User Modeling for MusicRecommender Systems. In: Proceedings of the European Conferenceon Machine Learning and Principles and Practice of Knowledge Dis-covery in Databases (ECML PKDD 2016). Riva del Garda, Italy (2016)
[10] Ferwerda, B., Schedl, M., Tkalcic, M.: Personality & emotional states:Understanding users’ music listening needs. UMAP 2015 ExtendedProceedings
[11] Ferwerda, B., Schedl, M., Tkalcic, M.: Predicting Personality Traitswith Instagram Pictures. In: Proceedings of the 3rd Workshop on EM-PIRE (2015)
[12] Ferwerda, B., Schedl, M., Tkalcic, M.: Personality Traits and the Rela-tionship with (Non-)Disclosure Behavior on Facebook. In: Companionof the 25th International WWW Conference (2016)
[13] Ferwerda, B., Schedl, M., Tkalcic, M.: Using Instagram Picture Fea-tures to Predict Users’ Personality. In: Proceedings of the 22nd Inter-national Conference on MMM. Miami, USA (January 2016)
[14] Ferwerda, B., Vall, A., Tkalcic, M., Schedl, M.: Exploring Music Diver-sity Needs Across Countries. In: Proceedings of the 24th InternationalConference on UMAP. Halifax, Canada (July 2016)
[15] Ferwerda, B., Yang, E., Schedl, M., Tkalcic, M.: Personality Traits Pre-dict Music Taxonomy Preferences. In: ACM CHI ’15 EA (2015)
[16] Golbeck, J., Robles, C., Edmondson, M., Turner, K.: Predicting Per-sonality from Twitter. In: Proceedings of the 3rd International Confer-ence on SocialCom (2011)
[17] Hu, L.t., Bentler, P.M.: Cutoff criteria for fit indexes in covariance struc-ture analysis: Conventional criteria versus new alternatives. Structuralequation modeling: a multidisciplinary journal 6(1), 1–55 (1999)
[18] Hu, Y., Koren, Y., Volinsky, C.: Collaborative filtering for implicit feed-back datasets. In: ICDM (2008)
[19] John, O.P., Donahue, E.M., Kentle, R.L.: The big five inventory: Ver-sions 4a and 54, institute of personality and social research. UCBerkeley (1991)
[20] Park, G., Schwartz, H.A., Eichstaedt, J.C., Kern, M.L., Kosinski, M.,Stillwell, D.J., Ungar, L.H., Seligman, M.E.: Automatic Personality As-sessment Through Social Media Language. Journal of Personality andSocial Psychology 108 (November 2014)
214

[21] Quercia, D., Kosinski, M., Stillwell, D., Crowcroft, J.: Our twitter pro-files, our selves: Predicting personality with twitter. In: Proceedings ofthe 3rd International Conference on SocialCom (2011)
[22] Schedl, M.: The LFM-1b Dataset for Music Retrieval and Recommen-dation. In: Proceedings on ICMR (2016)
[23] Scheibehenne, B., Greifeneder, R., Todd, P.M.: What moderates thetoo-much-choice effect? Psychology & Marketing 26(3), 229–253(2009)
[24] Skowron, M., Ferwerda, B., Tkalcic, M., Schedl, M.: Fusing SocialMedia Cues: Personality Prediction from Twitter and Instagram. In:Companion Proceedings of the 25th International WWW Conference(2016)
[25] Tkalcic, M., Ferwerda, B., Hauger, D., Schedl, M.: Personality corre-lates for digital concert program notes. UMAP 2015, Springer LNCS9146 (2015)
[26] Willemsen, M.C., Knijnenburg, B.P., Graus, M.P., Velter-Bremmers,L.C., Fu, K.: Using latent features diversification to reduce choice dif-ficulty in recommendation lists. RecSys 11, 14–20 (2011)
[27] Wu, W., Chen, L., He, L.: Using personality to adjust diversity in rec-ommender systems. In: Proceedings of the 24th ACM Conference onHypertext and Social Media. pp. 225–229. ACM (2013)
[28] Ziegler, C.N., McNee, S.M., Konstan, J.a., Lausen, G.: Improving rec-ommendation lists through topic diversification. WWW p. 22 (2005)
215

8 General Conclusion
This dissertation provides a novel comprehensive way for creating apersonalized music recommender system with personality and cul-tural information. To come back to the two RQs that this dissertationaddresses:
1. How do personality traits and cultural background relate to be-havior, preferences, and needs?
2. How can personality traits be implicitly acquired from SNSs?
In order to answer RQ1, several studies were conducted (see §5 [13,19, 23, 24, 25, 52] and §7 [16, 15]) covering a wide range of differentfacets for a music recommender system. In §5.1 [24] and §5.2 [25]studies were conducted that are useful for creating user interfaces.The results of these studies show that there is a relationship betweenmusic browsing strategies and personality traits. With the abundanceof music, these results could be applied to adjust the interface topresent music that is already in line with the user’s preferred way ofmusic browsing to present an interface that is littered with differentpossibilities.
The study in §5.3 [19] looked at personality related music prefer-ences and how a preference changes depending on the mood so thata better music recommendation can be given to the user. In §5.4 [52]a study was conducted that showed relationships between person-ality and supportive multimedia material about music. The studiesconducted in §5.5 [23], §5.6 [13], §7.1 [16], and §7.2 [15] looked atdiversity in music listening behavior and needs to better understandthe amount of diversity that should be provided in a playlist. The stud-ies in §5.5 [23] and §5.6 [13] looked at diversity from a country per-spective, and analyzed listening behavior. In §7.1 [16] and §7.2 [15]diversity was investigated on a personality level, recommendationswere provided, and a user-centric evaluation was performed to as-sess different levels of diversity.
For RQ2, several studies were conducted involving SNSs, whichare shown in the works under §6 [18, 20, 21, 22, 49]. The workin §6.1 [18] revealed the psychological mechanism underlying shar-ing and posting behavior on Facebook so that mechanisms can becreated to promote sharing and posting of content. Promoting shar-ing and positing behavior is necessary as implicit personality acqui-sition is usually dependent on the content available. The studies
216

conducted in §6.2 [20], §6.3 [22], §6.4 [21], and §6.5 [49] showedhow to implicitly acquire personality traits from SNSs. The worksof §6.2 [20] and §6.3 [22] showed the implicit personality acquisi-tion from Instagram picture features (i.e., the characteristics of themodified pictures). In §6.4 [21], we showed how to implicitly acquirepersonality from Facebook when user data is limited, and §6.5 [49]showed the improvement of personality acquisition by fusion SNSsdata from Instagram and Twitter.
Although various new insights were gained in this dissertation, it wasnot possible to create and test a full-fledged music recommendersystem based on all the works. During the course of the studies it be-came clear that it would be challenging to gather enough eligible par-ticipants for the works independently, let alone gather enough partici-pants to test a whole system with all the results implemented. There-fore, unfortunately, the user-centric evaluation was only done on mu-sic recommendation diversity (see the works in §7 [15, 16]). Never-theless, by studying diverse areas of a music recommender system,this dissertation provides a holistic and novel view of how personal-ity and cultural information can be applied to provide a personalizedexperience to the user (see §4 [13, 14, 17]). The studies do not onlyhave implications as a whole, but have separate scientific contribu-tions as well. The results of the works in §5 [13, 19, 23, 24, 25, 52]and §7 [15, 16] contribute to the personality and cultural research byshowing new relationships with behavior, preferences, and needs.Furthermore, the works in §6 [18, 20, 21, 22, 49] add to the researchtask of personality acquisition by providing new ways to implicitly ac-quire personality traits from SNSs.
217

References
[1] Adomavicius, G., Tuzhilin, A.: Toward the next generation of rec-ommender systems: A survey of the state-of-the-art and possi-ble extensions. Knowledge and Data Engineering, IEEE Trans-actions on 17(6), 734–749 (2005)
[2] Back, M.D., Stopfer, J.M., Vazire, S., Gaddis, S., Schmukle,S.C., Egloff, B., Gosling, S.D.: Facebook profiles reflect actualpersonality, not self-idealization. Psychological science (2010)
[3] Balabanovic, M., Shoham, Y.: Fab: content-based, collabora-tive recommendation. Communications of the ACM 40(3), 66–72 (1997)
[4] Bollen, D., Knijnenburg, B.P., Willemsen, M.C., Graus, M.: Un-derstanding choice overload in recommender systems. In: Pro-ceedings of the fourth ACM conference on RecSys. pp. 63–70.ACM (2010)
[5] Burke, R.: Hybrid recommender systems: Survey and ex-periments. User Modeling and User-Adapted Interaction 12(4),331–370 (2002)
[6] Cantador, I., Fernandez-tobıas, I., Bellogın, A.: Relating Per-sonality Types with User Preferences in Multiple EntertainmentDomains. In: Extended Proceedings of the ACM Conference onRecommender Systems (RecSys): Workshop on Emotions andPersonality in Personalized Systems (EMPIRE) (2013)
[7] Castells, P., Hurley, N.J., Vargas, S.: Novelty and diversity inrecommender systems. Recommender Systems Handbook pp.881–918 (2015)
[8] Celli, F., Bruni, E., Lepri, B.: Automatic personality and inter-action style recognition from facebook profile pictures. In: Pro-ceedings of the ACM International Conference on Multimedia.pp. 1101–1104. ACM (2014)
[9] Chen, L., Wu, W., He, L.: How personality influences users’needs for recommendation diversity? In: CHI’13 Extended Ab-stracts on Human Factors in Computing Systems. pp. 829–834.ACM (2013)
[10] Chia, P.H., Yamamoto, Y., Asokan, N.: Is this app safe?: alarge scale study on application permissions and risk signals. In:
218

the International World Wide Wide (WWW) Conference. ACM(2012)
[11] Ekstrand, M.D., Riedl, J.T., Konstan, J.A.: Collaborative filter-ing recommender systems. Foundations and Trends in Human-Computer Interaction 4(2), 81–173 (2011)
[12] Ferwerda, B.: The soundtrack of my life: Adjusting the emotionof music. In: Collaborating with Intelligent Machines (workshop),at the ACM Conference on Human Factors in Computing Sys-tems (CHI) (2015)
[13] Ferwerda, B., Schedl, M.: Investigating the relationship betweendiversity in music consumption behavior and cultural dimen-sions: A cross-country analysis. In: Extended Proceedings ofthe 24th International Conference on User Modeling, Adapta-tion and Personalization (UMAP): 1st Workshop on Surprise,Opposition, and Obstruction in Adaptive and Personalized Sys-tems (SOAP) (2016)
[14] Ferwerda, B., Schedl, M.: Personality-based user modeling formusic recommender systems. In: Proceedings of the EuropeanConference on Machine Learning and Principles and Practiceof Knowledge Discovery in Databases (2016)
[15] Ferwerda, B., Graus, M., Vall, A., Tkalcic, M., Schedl, M.: Theinfluence of users’ personality traits on satisfaction and attrac-tiveness of diversified recommendation lists. In: Extended Pro-ceedings of the 10th ACM Conference on Recommender Sys-tems (RecSys): 4th Workshop on Emotions and Personality inPersonalized Systems (EMPIRE) (2016)
[16] Ferwerda, B., Graus, M., Vall, A., Tkalcic, M., Schedl, M.: Howitem discovery enabled by diversity leads to increased recom-mendation list attractiveness. In: In Submission (2017)
[17] Ferwerda, B., Schedl, M.: Enhancing music recommender sys-tems with personality information and emotional states: A pro-posal. In: Proceedings of the 2nd Workshop on Emotions andPersonality in Personalized Services held in conjuction with the22nd Conference on User Modeling, Adaptation and Personal-ization. Aalborg, Denmark (2014)
[18] Ferwerda, B., Schedl, M., Tkalcic, M.: To post or not to post:The effects of persuasive cues and group targeting mechanisms
219

on posting behavior. In: Proceedings of the International Con-ference on Social Computing (SocialCom) (2014)
[19] Ferwerda, B., Schedl, M., Tkalcic, M.: Personality & emotionalstates: Understanding users’ music listening needs. In: Pro-ceedings of the 23th International Conference on User Model-ing, Adaptation and Personalization (UMAP 2015). Dublin, Ire-land (2015)
[20] Ferwerda, B., Schedl, M., Tkalcic, M.: Predicting personalitytraits with instagram pictures. In: Extended Proceedings of theACM Conference on Recommender Systems (RecSys): Work-shop on Emotions and Personality in Personalized Systems(EMPIRE) (2015)
[21] Ferwerda, B., Schedl, M., Tkalcic, M.: Personality traits andthe relationship with (non-) disclosure behavior on facebook. In:Proceedings of the 25th International Conference Companionon World Wide Web. pp. 565–568 (2016)
[22] Ferwerda, B., Schedl, M., Tkalcic, M.: Using instagram pic-ture features to predict users’ personality. In: Proceedings ofthe International Conference on MultiMedia Modeling (MMM).Springer (2016)
[23] Ferwerda, B., Vall, A., Tkalcic, M., Schedl, M.: Exploring Mu-sic Diversity Needs Across Countries. In: Proceedings of the24th International Conference on User Modeling, Adaptationand Personalization (UMAP 2016). Halifax, Canada (July 2016)
[24] Ferwerda, B., Yang, E., Schedl, M., Tkalcic, M.: Personal-ity traits predict music taxonomy preferences. In: Proceedingsof the 33rd Annual ACM Conference Extended Abstracts onHuman Factors in Computing Systems. pp. 2241–2246. ACM(2015)
[25] Ferwerda, B., Yang, E., Schedl, M., Tkalcic, M.: Personality andtaxonomy preferences, and the influence of category choice setsize on the user experience for music streaming services. In:Under Review (2016)
[26] Golbeck, J., Robles, C., Edmondson, M., Turner, K.: Predict-ing personality from twitter. In: Proceedings of the InternationalConference on Social Computing (SocialCom). pp. 149–156.IEEE (2011)
220

[27] Gosling, S.D., Gaddis, S., Vazire, S., et al.: Personality impres-sions based on facebook profiles. Proceedings of the Interna-tional Conference on Web and Social Media (ICWSM) (2007)
[28] Halko, S., Kientz, J.A.: Personality and persuasive technology:an exploratory study on health-promoting mobile applications.Persuasive technology pp. 150–161 (2010)
[29] Herlocker, J.L., Konstan, J.A., Borchers, A., Riedl, J.: An algo-rithmic framework for performing collaborative filtering. In: Pro-ceedings of the 22nd annual international ACM SIGIR confer-ence on Research and development in information retrieval. pp.230–237. ACM (1999)
[30] Herlocker, J.L., Konstan, J.A., Terveen, L.G., Riedl, J.T.: Evalu-ating collaborative filtering recommender systems. ACM Trans-actions on Information Systems (TOIS) 22(1), 5–53 (2004)
[31] Hofstede, G., Hofstede, G.J., Minkov, M.: Cultures and organi-zations: Software of the mind, vol. 2. Citeseer (1991)
[32] House, R.J., Hanges, P.J., Javidan, M., Dorfman, P.W., Gupta,V.: Culture, leadership, and organizations: The GLOBE study of62 societies. Sage publications (2004)
[33] Hu, R., Pu, P.: Acceptance issues of personality based recom-mender systems. In: Proceedings of the ACM Conference onRecommender Systems (RecSys). ACM (2009)
[34] Hudson, N.W., Fraley, R.C.: Volitional personality trait change:Can people choose to change their personality traits? Journalof personality and social psychology 109(3), 490 (2015)
[35] John, O.P., Donahue, E.M., Kentle, R.L.: The big five inventory:Versions 4a and 54, institute of personality and social research.UC Berkeley (1991)
[36] Jung, C.: Psychological Types. No. v. 6 in Bollingen Series No.20, Princeton University Press (1976)
[37] Kitayama, S., Park, H.: Cultural shaping of self, emotion, andwell-being: How does it work? Social and Personality Psychol-ogy Compass (2007)
[38] Knijnenburg, B.P., Willemsen, M.C., Gantner, Z., Soncu, H.,Newell, C.: Explaining the user experience of recommendersystems. User Modeling and User-Adapted Interaction 22(4-5),441–504 (2012)
221

[39] Krauskopf, C.J., Saunders, D.R.: Personality and ability: Thepersonality assessment system. Univ Pr of Amer (1994)
[40] Larsen, R.J., Buss, D.M.: Personality psychology. Jastrebarsko:Naklada Slap (2008)
[41] McCrae, R.R., John, O.P.: An introduction to the five-factormodel and its applications. Journal of Personality (1992)
[42] McNee, S.M., Riedl, J., Konstan, J.A.: Being accurate is notenough: how accuracy metrics have hurt recommender sys-tems. In: CHI’06 extended abstracts on Human factors in com-puting systems. pp. 1097–1101. ACM (2006)
[43] Park, G., Schwartz, H.A., Eichstaedt, J.C., Kern, M.L., Kosinski,M., Stillwell, D.J., Ungar, L.H., Seligman, M.E.: Automatic per-sonality assessment through social media language. Journal ofpersonality and social psychology 108(6), 934 (2015)
[44] Quercia, D., Kosinski, M., Stillwell, D., Crowcroft, J.: Our twitterprofiles, our selves: Predicting personality with twitter. In: Pro-ceedings of the International Conference on Social Computing(SocialCom). pp. 180–185. IEEE (2011)
[45] Rentfrow, P.J., Gosling, S.D.: The do re mi’s of everyday life:the structure and personality correlates of music preferences.Journal of personality and social psychology 84(6), 1236 (2003)
[46] Ricci, F., Rokach, L., Shapira, B.: Introduction to recommendersystems handbook. Springer (2015)
[47] Ross, C., Orr, E.S., Sisic, M., Arseneault, J.M., Simmering,M.G., Orr, R.R.: Personality and motivations associated withfacebook use. Computers in Human Behavior 25(2), 578–586(2009)
[48] Scheibehenne, B., Greifeneder, R., Todd, P.M.: What mod-erates the too-much-choice effect? Psychology & Marketing26(3), 229–253 (2009)
[49] Skowron, M., Tkalcic, M., Ferwerda, B., Schedl, M.: Fusingsocial media cues: personality prediction from twitter and in-stagram. In: Proceedings of the 25th International ConferenceCompanion on World Wide Web (WWW). pp. 107–108 (2016)
[50] Swearingen, K., Sinha, R.: Beyond algorithms: An hci perspec-tive on recommender systems. In: Proceedings of the ACM
222

Special Interest Group on Information Retrieval (SIGIR): Work-shop on Recommender Systems. vol. 13, pp. 1–11. Citeseer(2001)
[51] Tintarev, N., Masthoff, J.: A survey of explanations in recom-mender systems. In: Data Engineering Workshop, 2007 IEEE23rd International Conference on. pp. 801–810. IEEE (2007)
[52] Tkalcic, M., Ferwerda, B., Hauger, D., Schedl, M.: Personalitycorrelates for digital concert program notes. In: Proceedings ofthe Conference on User modeling, Adaptation, and Personal-ization (UMAP) (2015)
[53] Tkalcic, M., Kunaver, M., Kosir, A., Tasic, J.: Addressing the newuser problem with a personality based user similarity measure.In: Extended Proceedings of the Conference on User Modeling,Adaptation, and Personalization: Workshop on Decision Mak-ing and Recommendation Acceptance Issues in RecommenderSystems (DEMRA) (2011)
[54] Trompenaars, F., Hampden-Turner, C.: Riding the Waves of Cul-ture — Understanding Diversity in Global Business. McGraw-Hill Education, 3rd edn. (2012)
[55] Vinciarelli, A., Mohammadi, G.: A survey of personality comput-ing. Affective Computing, IEEE Transactions on 5(3), 273–291(2014)
[56] Willemsen, M.C., Knijnenburg, B.P., Graus, M.P., Velter-Bremmers, L.C., Fu, K.: Using latent features diversification toreduce choice difficulty in recommendation lists. In: ExtendedProceedings of the ACM Conference on Recommender Sys-tems (RecSys): Workshop on Human Decision Making in Rec-ommender Systems. vol. 11, pp. 14–20 (2011)
[57] Winne, J.F., Gittinger, J.W.: An introduction to the personalityassessment system. Journal of Community Psychology 1(2),99–163 (1973)
[58] Ziegler, C.N., McNee, S.M., Konstan, J.a., Lausen, G.: Improv-ing recommendation lists through topic diversification. Proceed-ings of the Internationa World Wide Web (WWW) Conferencep. 22 (2005)
223