Improving the Quality of Oral Healthcare through Case ... 5(1).pdf · Principles of Medicaid Dental...
33
Improving the Quality of Oral Healthcare through Case Management Module 5 Principles of Medicaid Dental Practice Management - Part 2
Transcript of Improving the Quality of Oral Healthcare through Case ... 5(1).pdf · Principles of Medicaid Dental...

Improving the Quality of Oral
Healthcare through Case Management
Module 5
Principles of Medicaid Dental Practice Management - Part 2

Acknowledgements Improving the Quality of Oral Healthcare through Case Management is a professional education and training program designed to advance the knowledge, skill, and competency of the dental workforce.
The curricula is made up of 6 training modules which have been made available through the generous support of the following organizations and agencies:
� Rhode Island Department of Health
� Rhode Island Executive Office of Health and Human Services
� Rhode Island Dental Association
� Medicaid|Medicare|CHIP Services Dental Association
� Health Resources and Services Administration

Goals of the Course To provide professional education and training to
dental personnel in an effort to:
1. Improve the quality oral healthcare services;
2. Improve the oral health outcomes of all;
3. To lower the costs of oral healthcare across the healthcare delivery system.

Overview of the Course I. Introduction
II. Learning Modules:
1. Principles of Quality Improvement
2. Principles of Medicaid Dental Practice Management-Part 1
3. Goal Setting
4. Process and Outcome Measurement
5. Principles of Medicaid Dental Practice Management- Part 2
6. Principles of Case Management
7. Module Post-tests
III. 1.5 Continuing Education Units (CEU) will be granted upon completion of each module and submission of the respective post-test.
IV. RI EOHHS Certification will be granted upon completion of all modules and post-tests
and submission of all post-tests.

Advisory Team and Faculty
� RobertBartro,DDS� PaulCalitri,DMD
� MartyDellapenna,RDH,MEd
� JeffDodge,DMD
� MaryFoley,RDH,MPH
� DeborahFuller,DMD
� MaryAnnHeran,RDH,BS
� MarieJones-Bridges,RDH,BS
� LaurieLeonard,MS� BethMarooBan
� TimothyMarBnez,DMD
� LynnDouglasMouden,DDS,MPH
� JoanPillsbury� ReneeRulin,MD
� JohnVerbeyst,DMD

Module 5 Learning Objectives
Participants will gain understanding, knowledge, skill, and competency regarding (the):
� Excess demand
� Low demand
� Emergencies
� Additional data reports
� Additional barriers

Data Analysis and
Considerations for
Managing Your Practice

Consider Excess Demand
� Too many new patients in the daily schedule?
� High rate of “emergencies” as new patients?
� Long waits between appointments for existing patients?
� High rate of patients lost to follow-up?
� Short appointments lengths as practice tries to accommodate as many patients as possible?

Consider Impact of Excess Demand
� Inability to complete treatments in a timely manner
� Lots of chaos in the office due to high volume of patients � long waits to check in � Long waits to be taken into clinical area � Practice routinely falls behind
� Patients get fed up and leave without being seen
� Unhappy patients who will seek care elsewhere and badmouth the practice
� Staff are exhausted, frustrated, and stressed out—poor staff morale and high turnover rates

Manage Excess Demand
� Use your practice management system to assess data
� Monitor processes and practice protocols � Assess service delivery (claims) data by provider � Assess scheduling
� Document and demonstrate negative outcomes of failing to manage demand appropriately
� Understand and accept that the dental office has a finite capacity that cannot currently meet the demand

Manage Excess Demand: Increase Capacity
� Best way to increase ability to meet demand is to: � manage current capacity effectively to generate
needed financial resources � add more providers
� add more operatories � add more dental sites � increase hours of operation, etc.

Manage Excess Demand � Designate priority populations for dental care (e.g.
children, pregnant women, people with chronic health conditions such as diabetes or heart disease)
� Create designated appointments in the daily schedule to preserve and protect access for priority populations
� Use scripting to explain why access to the dental office is limited— keep messaging consistent

Consider Low Demand � Empty chairs means lost revenue the dental program
needs to meet operating costs
� Staff with too much free time can develop bad work habits
� Dental offices can become inefficient without challenges presented by full schedules
� Good staff may leave to find more rewarding jobs elsewhere
� Inability to meet operating costs can lead to reductions in staff, operatories, sites, and hours of operations.

Manage Low Demand
� Determine root causes for lack of demand � Small population in need of care
� Competition among peers—too many dentists in vicinity
� Barriers to care � transportation issues
� distance
� inconvenient operating hours
� cost of care
� language and /or cultural issues, etc.
� Patient/population previous experience of care — fear?
� Previous unsatisfactory experience in your office
� Implement patient survey and inquire about these topics

Manage Low Demand
� Remove barriers to care wherever possible
� Improve the patient overall and care experience
� Monitor internal/external sources of referrals � (i.e., primary care medicine, family practice, OB/GYN, WIC,
Head Start, other health, community, and human service agencies serving children and families.)
� Participate in culturally and linguistically appropriate case management services
� Implement case management practices

Access-# Patients
• Total Visits • Number of Unduplicated Patients • Number of New Patients
Productivity
• Visits per Day • Procedures per Day • Revenue per Day • Number of no-shows
Financial
• Gross charges • Net Revenue • Bottom Line
Quality • Number of children ages 6-9 years and 12-14 years who receive at least one dental sealant on a permanent tooth
• Number of at–risk children who receive 2 or more fluoride varnish treatments in a year • Number of pregnant women who received a dental exam, and at least one preventive service • Percentage of dental patients with a Phase 1 Completed Treatment Plan
Practice Goals

Transaction Report (CDT Code)
� Transactions are procedures with ADA codes attached to them
� Transaction reports reveal type of services at: � Visit level � Practice level
� Assess types of procedures: � Number of each type � Medicaid covered/non-
covered � Non-Medicaid covered

Determine Practice “True” Scope of Service
Scope of Service
Scope of Service
Quarter 1 Quarter 2 # of Procedures % # of Procedures % Diagnostic #DIV/0! Diagnostic #DIV/0! Preventive #DIV/0! Preventive #DIV/0! Restorative #DIV/0! Restorative #DIV/0! Endodontics #DIV/0! Endodontics #DIV/0! Periodontics #DIV/0! Periodontics #DIV/0! Prosthodontics #DIV/0! Prosthodontics #DIV/0! Emergency #DIV/0! Emergency #DIV/0! Oral Surgery #DIV/0! Oral Surgery #DIV/0! Totals 0 #DIV/0! Totals 0

Monitor Provider Performance Provider Performance Monthly Provider Performance
Dr. X
Visits # of Days Worked
Avg. # of Visits per Day # Procedures
Procedures per Visit Gross Charges Net Revenue Revenue Per Visit
Month 1 #DIV/0! #DIV/0! #DIV/0! Month 2 #DIV/0! #DIV/0! #DIV/0! Month 3 #DIV/0! #DIV/0! #DIV/0! Month 4 #DIV/0! #DIV/0! #DIV/0! Month 5 #DIV/0! #DIV/0! #DIV/0! Month 6 #DIV/0! #DIV/0! #DIV/0! Month 7 #DIV/0! #DIV/0! #DIV/0! Month 8 #DIV/0! #DIV/0! #DIV/0! Month 9 #DIV/0! #DIV/0! #DIV/0! Month 10 #DIV/0! #DIV/0! #DIV/0! Month 11 #DIV/0! #DIV/0! #DIV/0! Month 12 #DIV/0! #DIV/0! #DIV/0!

Consider Barriers to Goals
� No shows
� Last minute cancellations
� Scheduling issues
� Insufficient support staff
� Lack of goals and accountability
� Individual provider/staff issues
� Insufficient instruments, supplies,
� Equipment issues
� Lack of EDR/PMS
� Overrun with emergencies

Assessing “No Shows”
� Calculate “no-shows” as the percentage of scheduled appointments for which the patient failed to show or cancelled at the last minute.
� Don’t subtract open slots caused by no-shows/last minute cancellations that staff were able to fill with walk-ins/emergencies
� Example: 8,000 scheduled appointments, 2,400 no-shows/last minute cancellations (even if the practice managed to fill 1,800 of those open slots with emergencies/walk-ins)=30% No-Show rate
� Use dummy codes to track no-shows

Managing “No-Shows”
� Develop and implement a strong office policy
� Enforce consistently
� Utilize social marketing to promote preventive health values and importance of keeping dental appointments
� Establishing culture of accountability
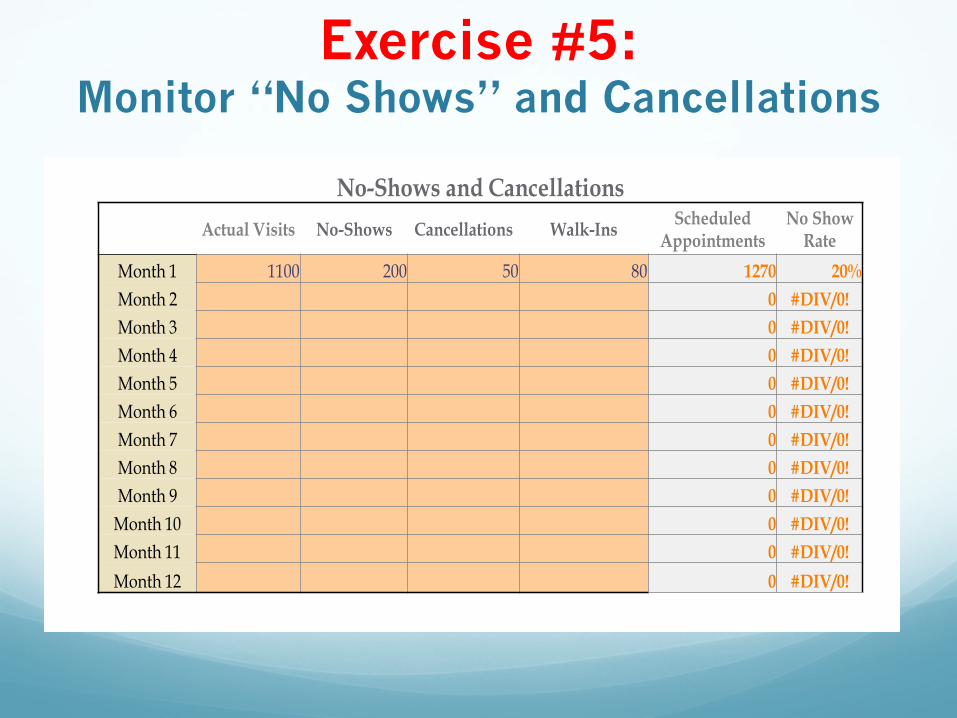
Exercise #5: Monitor “No Shows” and Cancellations
No-Shows and Cancellations
Actual Visits No-Shows Cancellations Walk-Ins Scheduled
Appointments No Show
Rate Month 1 1100 200 50 80 1270 20% Month 2 0 #DIV/0! Month 3 0 #DIV/0! Month 4 0 #DIV/0! Month 5 0 #DIV/0! Month 6 0 #DIV/0! Month 7 0 #DIV/0! Month 8 0 #DIV/0! Month 9 0 #DIV/0!
Month 10 0 #DIV/0! Month 11 0 #DIV/0! Month 12 0 #DIV/0!

Emergencies
� Prevent your dental office from being overrun by emergencies
� Always use an emergency code in every emergency visit, even if definitive treatment is provided (e.g, extraction) (or use a no-charge dummy code)
� Calculate emergencies using D0140 or create a dummy code to track emergencies)
� Calculate emergency rate as percentage of overall visits
� Example: 8,000 visits; 1,500 visits were coded as emergencies=18.8% emergency rate

Impact of Poor Emergency Management
� Emergencies add to overall chaos, stress, and unpredictability in the practice
� Emergency visits tend to reimburse poorly
� Emergencies can interfere with the care of regularly scheduled patients
� Key is to develop a system and policy for managing emergencies that provides sufficient access while preserving the care of regularly schedule patients, minimizing disruption to the practice and maintaining financial sustainability.

Align Goals Know Your Numbers
� How much revenue do you expect to collect?
� How many annual visits did you provide last year?
� How will this change next year?
� What will it cost to run the dental practice next year?
� What is the expected payer mix?
� Are my patients:
� Receiving preventive services?
� Completing their treatment plans?
� On preventive maintenance?

Know Your Numbers
The Profit and Loss Statement
� Gross charges
� Total net revenue
� Total direct
� Indirect expenses
Know Your Numbers
45
The Profit and Loss Statement
• Gross charges • Total net revenue • Total direct • Indirect expenses
Was there more net revenue than it cost to run the program?
Did it cost more to run the program than was brought in to pay the bills?

Income Gross Patient Service Revenue Medicaid $2,200,000 Self-Pay/Sliding Fee Scale $600,000 Commercial $400,000 Total Gross Charges $3,200,000 Less Contractual Adjustments Medicaid ($1,500,000) Commercial ($160,000) Less Sliding Scale Adjustments ($250,000) Net Patient Service Revenue Medicaid $700,000 Self-Pay/Sliding Fee Scale $350,000 Commercial $240,000 Total Net Patient Revenue $1,290,000
Grant Funds Dental Grant (330 Award) $300,000 Total Grant Funds $300,000
Total Income $1,590,000
Expense Salary Provider Salary Expense $650,000 Support Staff/Admin $350,000 Total salary $1,000,000 Benefits $250,000 Total salary and benefits $1,250,000
Non-Salary Advertising/Promotion $5,000 Bad Debt Expense $40,000 Bank Charges/Credit Card Fees $7,500 Computer (maintenance fees/licensing $20,000 Contract Services $30,000 Dental Supplies $95,000 Depreciation $60,000 Equipment Rental/Repair $15,000 Rent $36,000 Utilities $10,000 Insurance (Liability and Workers' Comp) $15,000 Lab Fees $30,000 Office Supplies $10,000 Postage/Printing $3,000 Professional Development $3,000 Telephone/Internet $6,000 Travel Expense $4,000 Total Non-Salary Expenses $389,500 Total Direct Expenses $1,639,500
Net Margin before Indirect Expenses ($49,500)
Total Indirect Expenses (Administrative Allocation & Overhead) $125,000
Total Expenses $1,764,500
Net Income (Loss) ($174,500)

Next Steps
� Train your team in the Principles of Quality Improvement
� Re-assess Office Goals � Access; � Productivity � Financial � Quality

Principles of Medicaid Dental
Practice Management - Part 2
Take Module 5 Post-Test Now

Faculty
Marty Dellapenna, RDH, MEd
Ms.MarthaDellapennaistheMSDACenterDirector.Inthisrole,Ms.DellapennaprovidesoversighttotheprojectsandacBviBesofeachthefivedivisionswithintheCenter.SheistheformerProjectManagerfortheRhodeIslandOralHealthAccessProject.Ms.DellapennajoinedtheRIDepartmentofHumanServicesintheCenterforChildandFamilyHealthin2003throughitsprojectmanagementcontractor,Xerox.Ms.Dellapenna’sprimaryroleatthatBmewastomanagethedevelopmentofRIteSmiles,thestate’sfirstmanagedcaredentalprogramforyoungchildren.Ms.DellapennaisalsothecurrentChairoftheCenterforMedicareandMedicaidServices(CMS)OralHealthTechnicalAdvisoryGroup.

Faculty Mary E. Foley, RDH, MPH
Ms.MaryE.FoleyistheExecuBveDirectoroftheMedicaid|Medicare|CHIPServicesDentalAssociaBon(MSDA).Ms.FoleyisadentalhygienistandholdsaMastersDegreeinPublicHealthwithaconcentraBoninEpidemiologyandBiostaBsBcsfromtheUniversityofMassachuse[sSchoolofPublicHealthandHealthPolicy.Earlierinhercareer,sheservedastheDirectoroftheMassachuse[sDepartmentofPublicHealth,OfficeofOralHealth.Inthisroleshehadoversightofstatedentalpublichealthprogramsaddressingsurveillance;access;prevenBon;andeducaBon.JustpriortohercurrentposiBon,Ms.FoleyservedastheDeanoftheForsythSchoolofDentalHygieneattheMassachuse[sCollegeofPharmacyandHealthSciencesinBoston,Massachuse[s.SincejoiningtheMedicaid|Medicare|CHIPServicesDentalAssociaBon,Ms.FoleyhasbeeninstrumentalinbroadeningnaBonalstakeholdercollaboraBon,andadvancingstateprogrampolicyandprotocolstoimprovethehealth,healthcareandcostsforallMedicaidprogramsandtheirbeneficiaries.

Faculty Timothy S. Martinez, D.M.D.
TimothyS.MarBnez,DMD,istheAssociateDeanofCommunityPartnershipsandAccesstoCareattheUNECollegeofDentalMedicine.Dr.MarBnezrecentlyrelocatedtotheNewEnglandareaa`erspendingsixandahalfyearsdevelopingthecommunity-baseddentalprogramsforWesternUniversityofHealthSciencesCollegeofDentalMedicineinPomona,California.HeservedasprogramevaluatorattheForsythInsBtutefrom2010to2011;statedentalMedicaiddirectorattheCommonwealthofMassachuse[s,ExecuBveOfficeofHealthandHumanServicesfrom2006to2009;anddentalconsultantattheOfficeofPublicProtecBon,BoardofRegistraBoninDenBstry,Massachuse[sDepartmentofPublicHealthfrom2005to2009.Dr.MarBnezalsoservedasdentaldirectorforHarborHealthServicesInc.from1999to2003anddentaldirectoratBostonHealthcarefortheHomelessfrom1994to2003.HeearnedaDoctorofDentalMedicinedegreefromtheHarvardSchoolofDentalMedicine.