Improving the Monitoring and Evaluation of Agricultural Extension...
33
Improving the Monitoring and Evaluation of Agricultural Extension Programs By Murari Suvedi and Gail Vander Stoep MEAS Discussion Paper 5 July 2016
Transcript of Improving the Monitoring and Evaluation of Agricultural Extension...

Improving the Monitoring and Evaluation of Agricultural Extension Programs
By Murari Suvedi and Gail Vander Stoep
MEAS Discussion Paper 5 July 2016

© Murari Suvedi, Gail Vander Stoep, and MEAS Project.
This work is licensed under a Creative Commons Attribution 3.0 Unported License.
Users are free:
• To share — to copy, distribute and transmit the work.
• To remix — to adapt the work.
Under the following conditions:
• Attribution — Users must attribute the work to the authors
but not in any way that suggests that the authors endorse
the user or the user’s use of the work.
Technical editing by Leslie Johnson.
This Discussion Paper was produced as part of the United States Agency for International
Development (USAID) project “Modernizing Extension and Advisory Services” (MEAS, www.meas-extension.org).
Leader with Associates Cooperative Agreement No. AID-OAA-L-10-00003.
The report was made possible by the generous support of the American people through USAID. The contents are
the responsibility of the authors and do not necessarily reflect the views of USAID or the United States government.

Improving the Monitoring and Evaluation
of Agricultural Extension Programs MEAS Discussion Paper Series on Good Practices and Best Fit Approaches
in Extension and Advisory Service Provision
Dr. Murari Suvedi (Michigan State University)
Dr. Gail Vander Stoep (Michigan State University)

1
The Modernizing Extension and Advisory Services (MEAS) Discussion Paper series is designed to further
the comparative analysis and learning from international extension efforts. The papers contain a review
of extension and advisory service best practices drawn from the global body of experience in
successfully reaching resource-limited farmers. The papers identify the underlying principles associated
with high levels of success in reaching women and men farmers and how, in differing contexts, these
core principles have been successfully adapted to fit local conditions in establishing productive,
profitable and sustainable relationships with individual producers, producer groups, the private sector
and associated research and education institutions.
The series, and the companion MEAS Working Papers, include papers on a wide range of topics, such as
the realities of pluralistic extension provisioning, sustainable financing, human resource development,
the role of farmer organizations, linking farmers to markets, the importance of gender, health and
nutrition, use of information and communication technologies and climate change adaptation. The
papers target policy makers, donor agency and project staff, researchers, teachers and international
development practitioners. All papers are available for download from the MEAS project website,
www.meas-extension.org.
The Editors,
Brent M. Simpson, Michigan State University, and
Paul McNamara, University of Illinois Urbana-Champaign

2
Table of Contents
Introduction ................................................................................................................................................................... 1
Description and relevance of program evaluation ................................................................................................... 2
Monitoring and evaluation ....................................................................................................................................... 3
Challenges in Evaluation of Agricultural Extension Programs ....................................................................................... 4
Extension is complex and evaluation is messy ......................................................................................................... 5
From inputs, outputs, and outcomes to impacts: Improving what and how we evaluate ....................................... 6
Experimental evaluation studies to measure changes ............................................................................................. 6
Non-experimental evaluation studies to measure changes ..................................................................................... 8
Lessons Learned: Strategies for Improving Evaluation Practice .................................................................................. 12
Integrating evaluation into design of projects ........................................................................................................ 12
Choosing appropriate evaluation criteria and indicators ....................................................................................... 13
Measuring and reporting objectively ...................................................................................................................... 14
Selecting appropriate evaluation tools ................................................................................................................... 15
Selecting appropriate data sources ........................................................................................................................ 16
Carefully selecting, training, and monitoring data collectors ................................................................................. 17
Selecting randomized and/or representative samples ........................................................................................... 18
Selecting a sample using random (probability) sampling ....................................................................................... 18
Appropriately analyzing data .................................................................................................................................. 21
Quantitative analysis .......................................................................................................................................... 22
Qualitative analysis ............................................................................................................................................ 23
Communicating and utilizing evaluation findings ................................................................................................... 23
Conclusions .................................................................................................................................................................. 25
References ................................................................................................................................................................... 27

1
Introduction Agricultural extension services exist throughout the world. Their primary function has been to facilitate
learning and extend new knowledge and technologies in non-formal educational settings to improve
agricultural productivity and increase farmers’ incomes. This knowledge and new technology can
originate from research institutions, peer farmers, or the broader community. Agricultural extension
systems have evolved such that extension workers are trained for and engaged in the communication of
agricultural research findings and recommendations to farmers. However, as extension workers
everywhere know, just because ‘knowledge is extended’ through training, demonstrations, and other
strategies of information dissemination, new behaviors and implementation of new practices are not
automatic. As expressed by Rogers (2003), diffusion of agricultural, economic, and other innovations is
complex and must consider
diverse factors that facilitate or
inhibit diffusion of new
knowledge and innovative
practices. Evaluation can help to
discover and understand those
factors in diverse contexts.
Most countries have some type of
system for agricultural extension,
with an overarching goal to
enhance food and nutrition
security through increased
agricultural productivity and
profitability. Yet, extension services are organized in many ways. Different countries have created
different types of extension systems based on purpose, goals, context, and types and level of external
support. Most agricultural extension services are managed as public goods. In some countries, they are
delivered in collaboration with agribusinesses, such as seed, fertilizer, and pesticide providers, and often
have a focus on technology transfer. Many countries emphasize advisory work by responding to
requests from farmers and agribusiness operators. Recent developments have led to decentralized and
pluralistic extension systems through which a variety of providers assist farmers in forming groups,
marketing their agricultural products, and partnering with a broad range of service providers, such as
credit institutions. Additionally, extension services often support human resource development and
facilitate empowerment (Swanson, B. and R. Rajalahti 2010).
Setting up extension operations has been one of the largest institutional development efforts in
developing countries (Anderson, J.R. and G. Feder 2004), with hundreds of thousands of extension
professionals engaged. However, faced with declining public budgets and the need to support many
development programs, policy makers and funding agencies increasingly are demanding information
about how extension program funds are used and about the impacts of these programs (see Box 1). As a
result, there is a growing need for monitoring and evaluation.
Box 1. Accountability Questions Asked by Entities Funding
Extension
Should the government and donors continue to fund
extension programs?
Are the extension programs effective?
How would you improve or terminate ineffective extension
programs?
What new programs should be implemented to meet the
needs of farmers, or to address changes of the rural
agricultural clients you intend to serve?

2
This chapter describes the need for monitoring and evaluation and addresses many issues related to
improving the quality of measuring impacts of agricultural extension services using rigorous but cost-
effective methods. It provides guidelines for reporting extension outputs, client satisfaction with
extension services, and some outcomes. It also describes strategies for improving evaluation practice
across numerous facets of evaluation. The chapter concludes by reiterating the importance of building
local evaluation capacity and re-emphasizing the need for disseminating and using results to improve
extension programs/services and their impacts.
Description and relevance of program evaluation Evaluation is a process of systematically assessing the operation and/or outcomes and impacts of a
program or project by collecting evidence to determine if certain acceptable standards have been met
and to answer other relevant questions (see Box 2). This implies that clear, measurable objectives are
created for each program or project prior to its implementation. Evaluation results based on these
predetermined objectives, as well as assessments of unintended consequences, are used to improve the
program or project, or to decide that it should be disbanded.
Evaluation is not a new concept. It is something we all do, informally or formally. In informal settings,
every human engages in some form of evaluation every day when making judgments about what we do
or experience, and to help us make daily decisions. Choice-making requires cognitive analysis that
involves judging, appraising, or determining the worth, value, quality, and/or impacts of various options.
The most important, and the most difficult, judgment to make is determining the value of a program
(Steele, S. 1975). A highly valued program is likely to receive continued or additional funding and other
support. However, “value” is not a singular,
concrete factor across all contexts. Rather,
“value” is based on conscious and
subconscious criteria. Thus, clear criteria
for, or indicators of, value should be
identified early in the project/program
planning process and reflected in clear,
measurable objectives.
Informal and formal evaluations can anchor
two ends of a continuum. At one end of the
continuum, informal evaluations are
unsystematic; criteria and evidence used in
making judgments are implicit and often
personal. They can, therefore, be biased
and misleading (Seepersad, J., and T.H.
Henderson 1984). At the other end, formal
evaluations are systematic and use explicit
criteria and evidence to make judgments
about a program’s relevance, effectiveness, efficiency, and/or impacts (Horton, D. et al 1993). Findings
are made public, partially to defend conclusions and partially to solicit review and validation by others.
Box 2. Evaluation to Determine Project or Policy
Effectiveness
Program Effectiveness: Focus is on effectiveness of an
intervention (program, project, or policy) in meeting
objectives.
Resource Effectiveness: Focus is on analysis of
benefits and costs of an intervention, including cost
per beneficiary.
Service to Diverse Audiences: Focus is on which
programs, policies, and practices are most effective
with different target groups (e.g., women, ultra-poor,
ethnic minorities).
Experiential Effectiveness: Focus is on how users of
extension services perceive service quality, or their
intention to use new information and/or technology.

3
Evaluation is both an art and a science. The art of evaluation involves identifying purposes and
audiences, creating appropriate designs, and interpreting data about a program or policy. The science of
evaluation involves systematically gathering and analyzing evidence about the outcomes and impacts.
Monitoring and evaluation Monitoring helps to ensure that programs are implemented in accordance with their design and
objectives, and helps answer questions such as “Are we doing the right thing? Are we doing it right?”
Extension managers use monitoring to track progress by gathering periodic information on project
inputs and activities and, based on data, adjust an ongoing program’s personnel, resource allocation,
and/or staff recognition, and often are linked with formal impact assessments. Most extension systems
have set up a data collection system on what extension program is offered to whom, where and how
many benefitted, etc.
Generally, extension managers track resources (e.g., funds, personnel, and supplies) and processes (e.g.,
occurrence of meetings, demonstrations, and publications). Ideally, monitoring is built in to projects so
that key indicators of progress throughout a program or project can serve as a basis upon which to
evaluate outcomes of the intervention
(Khandker, S. R., G.B. Koolwal and H.A. Samad
2010).
Impact evaluations are used to provide
evidence about whether or not specific
extension programs are good investments.
They are based on the comparison of observed
changes in the project target outcomes (e.g.,
changes in a target population, quality of some
resource or life condition, production levels,
economic gains) from prior to and after the
launch of the project/program or
implementation of a policy. They utilize
quantitative analysis, using a counterfactual (i.e., control group) to estimate the extent to which changes
in impacts can be attributed to the project intervention. Usually, impact assessments use an
experimental or quasi-experimental design. (See examples in Box 3.)
Most public extension services have a general monitoring and evaluation unit. These units gather
periodic data on several general output variables, including number of female and male participants,
types of extension activities implemented, crop and livestock activities and conditions, market
information, and ongoing and emerging educational needs of their clientele. In an effort to improve
monitoring effectiveness, Misra (1998) offers 10 principles for successful and effective monitoring (see
Box 4). However, public extension services have not been able to make full use of monitoring data for
specific program improvement and personnel management purposes.
Monitoring of program performance and impact evaluation are related, but they require different
methods and levels of rigor. Monitoring tracks key indicators of progress over the course of a program
Box 3. Examples of Questions for Formative
Evaluation as Part of Monitoring
Are farmers receiving agronomic information in
a timely manner?
Are extension meetings attracting a sufficient
number of farmers for successful
implementation of a program or project?
Are demonstrations conducted as planned?
Are farmers adopting new practices?

4
to provide contextual descriptions as a basis on which to evaluate outcomes of the intervention
(Khandker, S. R., G.B. Koolwal and H.A. Samad 2010). Similar to monitoring, operation evaluation seeks
to understand whether or not implementation of a program has unfolded as planned. The aim is to
compare what was planned with what was actually delivered to determine if gaps exist between
planned and realized outputs (Khandker, S. R., G.B. Koolwal and H.A. Samad 2010).
Box 4. Misra’s Ten Principles for Monitoring (1998)
1. Monitoring must be simple. A complex or complicated monitoring system is self-defeating.
2. Monitoring must be timely. Timeliness is critical so that appropriate modifications in a
project or program can be made soon enough to increase chances for project success.
3. Monitoring must be relevant. Monitoring must match objectives, generate useful
information.
4. Monitoring information should be dependable. Management will rely on monitoring
findings only if the information is believed to be reasonably accurate.
5. Monitoring efforts should be participatory. It should include all stakeholders concerned
with extension (e.g., field-level personnel, subject-matter specialists, extension clients
[farmers]).
6. Monitoring must be flexible. It is iterative in nature, and becomes routine over time.
7. Monitoring should be action-oriented. It should follow pragmatic approaches, keeping
requirements of extension’s clients uppermost in consideration.
8. Monitoring must be cost-effective.
9. Monitoring efforts should be top-management-oriented. Monitoring units should keep in
mind requirements of top management when designing and operating a monitoring system.
10. Monitoring units represent specialized undertakings. Monitoring is not merely concerned
with the collection and analysis of data, but with diagnosing problems and suggesting
alternative practical solutions.
Challenges in Evaluation of Agricultural Extension Programs Agricultural extension organizations are complex. The structures of extension organizations, their goals
and objectives, methods of information delivery, and accountability requirements are not uniform. In
most countries, the goal of agricultural extension has been the transfer of technology or improved
farming practices. In some countries, extension focuses on non-formal education to farmers. Thus, it is
not possible to offer a recipe for best practices on monitoring and evaluation. Therefore, the remainder
of this paper presents common problems and issues associated with monitoring and evaluation of
agricultural programs and offers suggestions to address these issues.

5
Extension is complex and evaluation is messy People hold different meanings of evaluation. Evaluation professionals use a wide array of research
methods, ranging in rigor and complexity from casual observation to randomized experimental design.
In the context of agricultural extension, however, program evaluation is not a common practice for
various reasons. Staff members may lack evaluation capacity; the organization does not have the
necessary support structure and services, such as in-service training, to promote the use of evaluation;
or no funds are allocated to finance evaluation.
Extension service is a public good in most countries. Generally, it is not required to provide impact data.
Also, it is difficult to attribute specific impacts at the farm level to extension services because many
factors affect the performance of extension services. Such factors include budget allocation, timely
release of funds, staff motivation and incentives, timely availability of inputs, and accountability (both
upward to management and downward to clients) (Anderson J.R. and G. Feder 2004).
There are two schools of thought about evaluation of public non-formal education programs such as
agricultural extension. One school believes that evaluation involves value judgments and, thus, absolute
accuracy is neither necessary nor attainable. Therefore, evaluation should be structured to serve as a
learning process. The other school considers that evaluation is useful only insofar as it provides credible
evidence to inform real-world decision-making. This school believes that sound evaluations are based on
empirical evidence or data. Accordingly, program evaluators should be able to identify cause-and-effect
relationships between an activity designed to induce change (such as a demonstration of home garden)
and a particular desired outcome (such as increased vegetable consumption resulting in improved
nutrition of family members). This requires fairly good evaluation design and statistical knowledge to
analyze impact data.
Determining cause-and-effect relationships may require experimental or quasi-experimental research
designs in which an experimental group (or groups) receives a specific treatment(s) while the control
group receives no treatment. Use of a control group (also termed a comparison group or counterfactual)
enables evaluators to discount many alternative explanations for the effect of the treatment. So,
comparisons are essential in scientific investigations. In the case of extension, comparing farmers
receiving extension services with an equivalent group receiving no extension services makes it possible
to draw well-supported conclusions. However, to guide such evaluative studies, program managers and
policy makers must understand basic research designs, gather sound data, and use statistical tests to
determine if changes are due to extension programs. Additionally, they must be able to communicate
impact information to stakeholders. Lack of or limited capacity in these skills, combined with limited
funding to hire evaluation specialists, creates challenges to conducting comprehensive and timely
evaluations of extension programs.
Furthermore, conducting an evaluation does not ensure that results will be used for program
improvement. Many factors influence the use of evaluation results. An evaluation report may be only
one of many sources of information for decision makers, who may also get less formally collected
information about an extension program from advisors, colleagues, farmer organizations, interest
groups, and/or the media. Some decision makers may not be interested in making programmatic
changes if they are moving out of extension work and, thus, have no personal vested interest. Others

6
may not implement recommendations because of ideological or political reasons. Often, implementing
recommendations requires more resources than are available. Thus, understanding decision makers,
stakeholders and the real potential for use of results is critical to deciding whether or not to conduct a
specific evaluation.
From inputs, outputs, and outcomes to impacts: Improving what and
how we evaluate Evaluations of agricultural extension programs historically have not focused on long-term impacts.
Often, extension educators gather demographic information about participants. Sometimes they
administer end-of-program evaluation surveys to ascertain positive or negative perceptions of the
program, and then associate these perceptions with socio-demographic characteristics such as sex, race,
residence, or educational level. This information is integrated with other activities of the organization
and reported to national level decision makers. Although information about outputs and perceptions is
helpful, it does not provide information about the impact of the extension program or service.
Acknowledging this weakness, USAID now is placing considerable emphasis on measuring and
documenting project achievements, impacts, and shortcomings using rigorous evaluation methods. The
new evaluation policy of USAID (2011) defines impact evaluation as that which:
“…measures the change in development outcome that is attributable to a defined intervention; impact
evaluations are based on models of cause and effect and require a credible and rigorously defined
counterfactual to control for factors other than the intervention that might account for the observed
change. Impact evaluations in which comparisons are made between beneficiaries that are randomly
assigned to either a “treatment” or a “control” group provide the strongest evidence of a relationship
between the intervention under study and the outcome measured” (p. 4).
As indicated earlier, “impact” means lasting or longer-term effects. What difference did the extension
program or project make in the lives of the people? Did it improve food availability or food utilization?
Did it increase local use of local foods and reduce incidents of illness? Did it increase income? Despite
USAID’s recent policy that strongly encourages use of experimental designs to assess causal impacts of
extension programs, most agricultural extension programs have yet to utilize rigorous evaluation
methods due to the high costs in time, resources, and money. Many extension systems do not have staff
trained in experimental methods and statistical analysis. Therefore, traditional methods, results of
which can be useful for some purposes, still are employed most often.
Experimental evaluation studies to measure changes Evaluators of agricultural extension services and programs have a variety of methodological approaches
from which to choose, depending on the context, the length of project implementation, purpose of the
evaluation, and logistical constraints. Experimental studies, as indicated previously, provide the most
rigorous and direct assessments of cause-and-effect outcomes of extension programs and services. A
pre- and post-program evaluation can explain whether the program has had any effect on the
participants. Two sample evaluation questions for a pre-/post-program assessment are: Do farmers who
7
attend extension meetings adopt hybrid corn varieties earlier than those who do not? Do farmers who
attend extension meetings generate a higher net income per hectare than those who do not?
Three ingredients are essential in the conduct of an experiment: control of the research context;
manipulation of the independent variable(s); and observations or measurement of change(s) in the
dependent variable(s). Control of context means providing a carefully controlled situation in which the
effect of the variable of interest (independent variable) can be investigated. Manipulation is the process
of creating different treatment groups or conditions to facilitate observation of the impacts of
independent variables on dependent variables. Observations are made, via use of various measurement
tools or strategies, with respect to specified characteristics/conditions of the dependent variable(s).
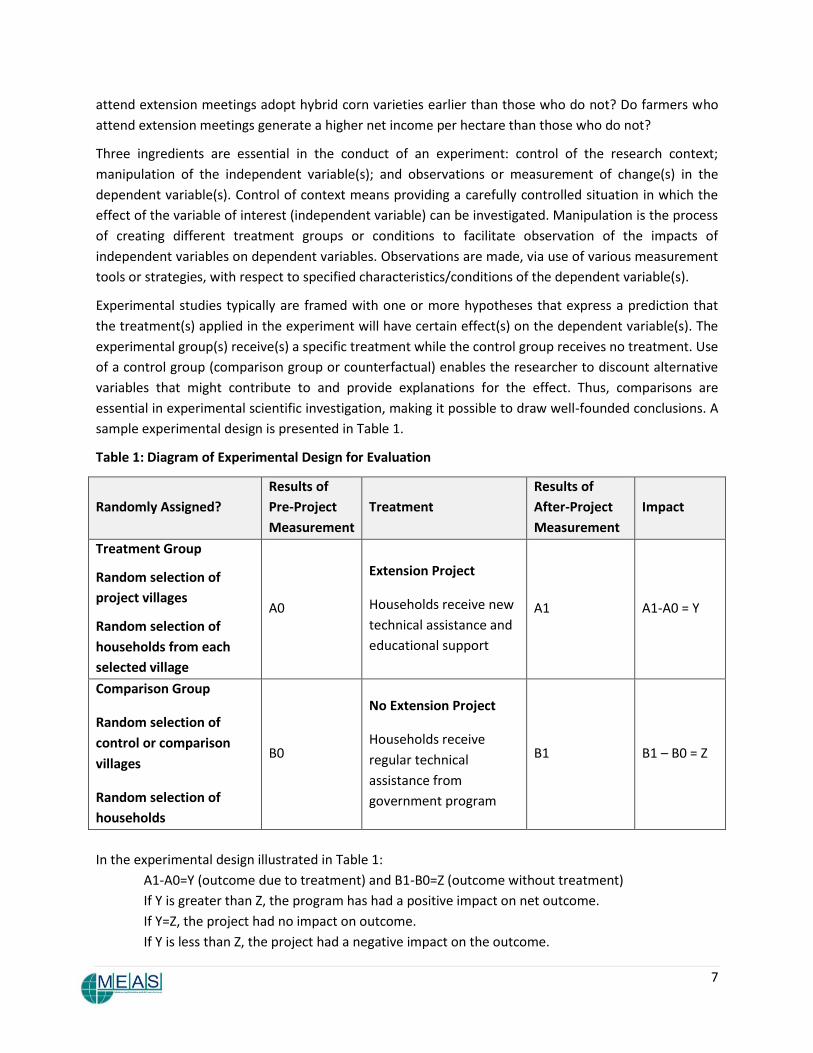
Experimental studies typically are framed with one or more hypotheses that express a prediction that
the treatment(s) applied in the experiment will have certain effect(s) on the dependent variable(s). The
experimental group(s) receive(s) a specific treatment while the control group receives no treatment. Use
of a control group (comparison group or counterfactual) enables the researcher to discount alternative
variables that might contribute to and provide explanations for the effect. Thus, comparisons are
essential in experimental scientific investigation, making it possible to draw well-founded conclusions. A
sample experimental design is presented in Table 1.
Table 1: Diagram of Experimental Design for Evaluation
Randomly Assigned?
Results of
Pre-Project
Measurement
Treatment
Results of
After-Project
Measurement
Impact
Treatment Group
Random selection of
project villages
Random selection of
households from each
selected village
A0
Extension Project
Households receive new
technical assistance and
educational support
A1 A1-A0 = Y
Comparison Group
Random selection of
control or comparison
villages
Random selection of
households
B0
No Extension Project
Households receive
regular technical
assistance from
government program
B1 B1 – B0 = Z
In the experimental design illustrated in Table 1:
A1-A0=Y (outcome due to treatment) and B1-B0=Z (outcome without treatment)
If Y is greater than Z, the program has had a positive impact on net outcome.
If Y=Z, the project had no impact on outcome.
If Y is less than Z, the project had a negative impact on the outcome.

8
This experimental design could use panel data (pre- and post-project data collected from the same
households) or repeated cross-section data (pre- and post-project data collected from different
households within the same general population in the villages). Both sampling strategies allow
comparison between the treatment group and control group (or counterfactual) in terms of changes in
outcomes over time relative to the outcomes observed in pre-intervention baseline data. Results of this
design provide good evidence of program impacts.
Non-experimental evaluation studies to measure changes Despite the rigor and appropriateness of experimental evaluation designs, in the context of public
agricultural extension and advisory service evaluation, it is difficult to establish a control or comparison
group, maintain uniform treatments, and measure long-term impacts. More often extension programs
or projects make use of ex post studies for evaluation (see box 5).
Box 5. Types of ex post Studies Conducted after Program/Project Completion
Cross-section Surveys: Surveys are popular for collecting evaluative data and are used to measure
people's opinions, attitudes, beliefs, behaviors, reactions, and attributes in response to specific
questions. Cross-section surveys query respondents within a target population at one point in time.
Case Studies: Case studies use a mix of methods to obtain information that, together, provides in-
depth information about a single unit, project, or organization. Using a systematic process, the
evaluator captures the essence of a situation through personal discussion and interaction with
relevant stakeholders, observation of behaviors and other variables, and/or review of existing
documents. Yin (1984) describes case studies as explanatory, descriptive, or exploratory.
Focus Groups: Focus groups, which are in-depth guided discussions with a small group representing a
target population, traditionally are used in marketing research to find out what a particular segment
of the public needs or wants, and what they will consume. In recent years, this technique has been
used to identify community needs and issues, to obtain citizens' perceptions on a defined area of
interest, and to generate program alternatives. In the case of ex post evaluation, focus groups are
used to assess the impacts of a particular program on individuals and communities.
Benefit-Cost Analysis (BCA) and Return on Investment (ROI): These are two common types of
analysis used to determine the economic feasibility of new technology or development alternatives.
BCA is a tool used to identify, express in money terms, and then compare all the costs and benefits
of a policy, program, or project.
ROI is a performance measure used to evaluate the financial efficiency of an investment.
Many administrators and funders are interested particularly in economic impacts. Thus, social scientists
with a background in economics also are engaged in impact evaluation. However, valuing the economic
impacts of extension programs is not simple. Often, economists depend on secondary data, such as
census records, to track impacts. They also utilize surveys to gather information for determining

9
impacts. Richardson and Moore (2000) describe a variety of indicators and tools for valuing economic
impacts (see Box 6).
Khandker, S. R., G.B. Koolwal and H.A. Samad (2010) offer econometric methods to address the issue of
lack of counterfactual, or control group. Two frequently used methods are ‘propensity score matching’
and the ‘double-difference method.’ “Propensity Score Matching (PSM) constructs a statistical
comparison group that is based on the probability of participating in the treatment, using observed
characteristics. Participants then are matched on the basis of this probability, or propensity score, to
non-participants. Average treatment effect of the program then is calculated as the mean difference in
outcomes across the two groups.” (Khandker et al., 2010, p. 53).
The Double Difference (DD) method compares data on project participants and comparison or control
groups before and after the program interventions. This method requires baseline data on participants
and members of the comparison group. Follow-up surveys after program interventions should be
conducted on the same units. Frequently, evaluators combine both PSM and DD methods, as illustrated
by two African case studies in Box 7 below.
Box 6. Indicators and Tools for Valuing Economic Impacts
Reduced Cost: This indicator measures the money saved by a participant. For example, a farmer
adopts a less expensive pest management practice after attending an Integrated Pest Management
(IPM) training program. The reduced cost is equal to the cost of regular pest management practice
minus the cost of the new IPM practice.
Savings: Similar to reduced cost, this indicator identifies the amount of savings or increased savings
attributable to implementation of a farming or other practice learned from an extension program, as
experienced by participants before and after the program.
Increased Income: This indicator compares the income of a program participant before and after the
program. For example, a farmer’s income may increase as a result of planting a new variety of rice
that has a higher yield per hectare, or because of value-added practices – such as use of improved
driers for large cardamom or implementation of organic farming practices – implemented as a result
of extension information or training.
Increased Productivity: This indicator is derived by computing economic value by measuring the
increase in productivity by the same number of workers or units of production due to adoption of a
new practice learned from an extension program or demonstration. For example, extension programs
teach farmers how to use a new technology. The higher profits from use of the new technology minus
the cost of buying the technology equals increased productivity.
Value Added: This indicator refers to the additional profit, or value, assigned to a crop or product that
is used in a new way, or processed in a way that adds value beyond the cost of the processing. For
example, a program that teaches fruit farmers to make jam or jelly enables farmers to add value to
the fruit. The profit from selling jelly, after costs of making the jelly are considered, minus the profit
made from selling the fruit equals the value added.
Expected Value: This method estimates how much income a new business will earn. Banks rely on

10
this method when deciding whether or not to make a loan. The income of similar businesses, along
with the quality of the business plan, is used to estimate the income of the new business. For
example, extension agents can use this method to estimate the value of an extension program that
teaches participants how to start a small business. The combined expected values of the businesses
started within a specified timeframe, as a result of extension training offered to potential new
business entrepreneurs, could be considered the value of the extension program.
Alternative Opportunity Cost of Capital: Extension programs can teach participants how to make
more money by using existing capital in different or more efficient ways. For example, land could be
used to grow a higher value crop. The income from the higher value crop is compared to the income
from the lower value crop to estimate the economic worth of the extension program that made
farmers aware of and assisted them in changing to the new, higher value crop.
Willingness to Pay: The willingness of clients or consumers to pay for some item or service may be
considered an economic benefit when this willingness exceeds what would be considered a standard
norm for a product or service. If the price of a product is marketed more effectively, is a value-added
product, or reaches a new niche clientele as a result of extension training or assistance, this
willingness to pay can be considered the value of the extension services.
Source: Richardson, J. G., and C.L. Moore 2002
Box 7. International Food Policy Research Institute Case Studies Using Econometric Methods
East Africa Farmer Field Schools: A longitudinal quasi-experimental evaluation was conducted to
document the impact of Farmer Field Schools on agricultural productivity and farmers in East Africa.
An ex post facto design combining a double difference method, with matching estimators (propensity
score matching and covariate matching), was used. Findings indicated that Farmer Field Schools had
positive impacts on production and income among women, low-literacy, and medium-land-size
farmers. Participation in Farmers Field Schools increased their income overall by 61 percent, and
improved both agricultural income and crop productivity.
Source: Davis et al 2011
Pro-poor Development in Nigeria: Propensity score matching was used to measure the impact of a
pro-poor community-driven development project in Nigeria. The study selected 1,728 comparable
project beneficiaries and non-beneficiaries. The study also used double difference methods to
compare the impact indicators. Results showed that the Fadama II project succeeded in targeting the
poor and women farmers in productive asset acquisition. Participation in the project also increased
the income of beneficiaries by about 60 percent. The project also increased demand for postharvest
handling technologies.
Source: Nkonya, E. et al 2008
For practical and limited resource reasons, it is not possible for all agricultural extension programs and
policies to be assessed using experimental methods (with randomized sampling) to document impacts of
programs and projects on families, communities, and society. In the United States, Duttweiler (2008)

11
examined 675 published evaluation studies and found that the primary purpose for evaluation was
program improvement. Most studies used quantitative methods, particularly ex post facto, correlation
research, and survey research methods. Most have focused on educational methods improvement,
program accountability (including outcome and impact), needs assessments, staff development needs,
audience analysis, and customer satisfaction. Use of surveys has been the predominant data collection
method for evaluation. However, qualitative methods – focus groups, key informant interviews, and/or
case studies – often are utilized to supplement or complement survey data. Such qualitative studies can
offer the depth of information needed about program and policy impacts on the intended audiences.
Additionally, mixed method approaches might offer better documentation of outcomes and impacts.
Use of mixed methods allows extension managers to both gain in-depth understanding of phenomena
related to extension’s target audiences, its staff, and programs and to generalize to appropriate
populations based on the more rigorous quantitative methods. As interest in assessment of impacts – to
supplement recording of outputs and opinions – increases, new tools are emerging to begin to tackle
the difficult challenge of assessing long-term impacts. One example is “ripple effect mapping.”
Ripple effect mapping
Ripple effect mapping is a qualitative tool used to assess how direct impacts of an extension program or
projects may, over time and geography, spread indirectly to others, thus resulting in expanded impacts
over time . . . thus, a ripple effect. Additionally, it can be used to identify unintended impacts. Assume
that, immediately after a project’s or program’s completion, traditional impact assessment was
conducted. Evaluators might have gathered basic demographic information about program or training
participants, such as family size, farm size, crop yields, and household incomes.
Combined with observed or reported
actions taken as a result of the program or
training, a direct impact evaluation would
result.
To conduct a ripple effect assessment at
some time and/or location(s) distant from
the original training, representatives of
targeted groups (both who attended the
program or training and those who did
not) are brought together to discuss the
direct and indirect impacts of a program
resulting from social network
communication, observation of successes
by early adopters, and other vectors; the
ways in which information about successes
has spread; and characteristics of “credible
others.”
Using focus groups, incorporating guiding
questions and graphic representations of
Figure 1. Example of Mind Map: Graphic Representation
Useful in Ripple Effect Mapping
Source: Burnett, G. 2005

12
the vectors and channels for spreading impacts, is one way to implement ripple effect mapping. (Flage,
L. 2011; Flage, L. and S. Chazdon, n.d.; Kollock, D. A. 2011) Box 8 presents an agriculture-based example.
Box 8. Example of Ripple Effect Mapping
Assume district X has 5,000 farmers growing rice in a total area of 15,000 hectares. Suppose 100
farmers participated in a training program on rice production. Of these, 20 farmers adopted use of the
new variety recommended by extension within the first year after the training/demonstration. After
10 years, an additional 60 of the originally trained farmers and 25 farmers in district X, and 30 farmers
in adjacent districts, who did not participate in the training program now are planting the new variety
of rice. Extension staff members notice this increase and want to better understand the factors
influencing broader adoption of the new rice variety.
To better understand this “ripple effect,” extension evaluators convene one or more groups of
farmers who are planting the new rice variety, regardless of whether or not they attended the original
training. Facilitators guide them through a “mapping” exercise, using graphic drawing tools to record
the guided discussions. Participants share their personal stories about when, why, and how they
began using the new rice variety. Participants also identify the production results (crop yield and
economic gains) as well as other, unintended and indirect, results (perhaps improved health of farm
families, more involvement by women, all children attending school). Additionally, social and
communication networks (e.g., word-of-mouth, market-place sharing, personal observation, social
media, communication via cell phones, radio program production updates) can be mapped to better
understand how and why impacts spread over time and space.
Lessons Learned: Strategies for Improving Evaluation
Practice Evaluation in extension and rural advisory services should be a learning process for all involved.
Evaluation results should be utilized in improving programs and developing more effective policies to
serve rural populations. As part of the evaluation process, the monitoring process should be developed
to track key indicators of progress over the course of each extension project. Suggestions are provided
in this section for selecting appropriate programs and projects, for enhancing rigor and quality in each
component and phase of evaluation, for collaborative work with extension partners, and for effectively
integrating evaluation efforts throughout extension programs and services.
Integrating evaluation into design of projects Planning appropriate and effective evaluation begins with the planning of an extension project itself.
First, evaluators and extension personnel must have clear understanding of project goals and objectives,
the nature and purpose of interventions planned, target audience(s) to be reached, duration of the
project intervention, and resources available (e.g., time, money, staff expertise, partner organizations,
and networks). Additionally, stakeholders must be consulted and engaged in selection of evaluation
design. Collectively, the following questions should be answered:

13
Who wants the evaluation, why, and by when?
Who will be using the evaluation results, and for what purposes?
Does the evaluation client seek in-depth understanding of impacts on individuals or social
groups, or do they want more generalizable results?
What resources are available to conduct the evaluation?
Is the desired evaluation feasible (based on all the above), and is the project of high enough
benefit to warrant the expense of formal evaluation?
Based on answers to the questions above, decisions are made about the appropriate duration of the
evaluation process (e.g., a one-time study, a pre/post study, or a longitudinal study); which evaluation
method, or mixed methods, is most appropriate; and, if assessment of causality is desired, whether an
experimental design is needed or a quasi-experimental design is sufficient. Careful attention to a host of
factors involved with the selection and design of an evaluation process can enhance the effectiveness,
efficiency, and usefulness of evaluation results. These factors are discussed in the following sections.
Choosing appropriate evaluation criteria and indicators For an evaluation to be valid and useful to the results users, it must employ sound indicators to measure
change. Indicators are observable phenomena that point toward the intended and/or actual condition
of situations, programs, or outcomes. They are markers that can be observed to show that something
has changed or improved. Indicators, when incorporated into an appropriate monitoring system, can
help people notice changes at an early stage of a program’s implementation. Quality indicators of an
evaluation process are that it must be: relevant to project objectives; simple and unambiguous;
realizable given logistical, time, technical, or other constraints; conceptually well grounded; and can be
updated at regular intervals (see Box 9).
Good evaluations start with baseline data to
establish benchmarks. Baseline data are
gathered before the start of intervention.
Thus, having indicators identified early in a
project planning process is critical. This helps
to identify truly needed projects as well as to
frame effective, efficient evaluations. Also
critical to effective evaluation is selection of
indicators that are appropriate to the project
goals, objectives, and intended impacts.
Examples of indicators to evaluate the
effectiveness of extension programs focusing
on agricultural production would be fundamentally different from programs intended to improve
nutrition, even if planting of a new high yield, healthier variety of potato or rice might result in both
types of impacts. Box 10 provides examples of matching indicators to different goals.
Box 9. Criteria for Selecting Indicators
An appropriate, effective indicator must:
be measurable;
be relevant to the impact being evaluated;
be easy to use;
result in representative results;
be easy to interpret;
be responsive to changing inputs;
have a reference against which to compare it;
be measurable at a reasonable cost; and
be updateable.

14
Box 10. Examples of Indicators for Varied Intended Impacts
GOAL EXAMPLES OF INDICATORS
Increased productivity Change in yield/unit (e.g., kilograms of rice
production per hectare, liters of milk per animal)
Reduced cost Change in cost of production (e.g., cost per
kilogram of meat production)
Reduced inputs Change in input use as measured by cost/unit (e.g.,
cost of irrigation or fertilizers/pesticides per
hectare)
Improved nutrition of young children Change in prevalence of underweight children
under 5 years of age
Improved health of women Change in prevalence of anemia (or other diseases
or conditions) of women
Measuring and reporting objectively Evaluation essentially involves measurement of indicators by collecting quantitative and qualitative
data. Quantitative methods measure a finite number of pre-specified outcomes and are appropriate for
large-scale projects that intend to judge effects, attribute cause, compare or rank, classify, and
generalize results. These methods are accepted as credible and applicable to large populations,
particularly when generalizability is important.
Qualitative methods take many forms, including rich descriptions of people, places, conversations, and
behavior. The open-ended nature of qualitative methods allows the person being interviewed to answer
questions from his or her own experience and perspective. Qualitative methods yield good evaluation
data as long as they are collected objectively and reported in as unbiased a way as possible.
Selection of methods should consider purpose of the evaluation, quality of evidence, and users of
evaluation results. By using mixed methods, quantitative data can be complemented with qualitative
information to provide a richer description of impacts.
Validity and reliability of data collection instruments are related directly to objective measurement.
Validity asks the question, “Does the evaluation instrument measure what it purports to measure?” One
way to assess validity of an evaluation instrument is to use a panel of experts consisting of persons who
are knowledgeable of the project being evaluated. Panel members review the instrument in terms of its
content, format, and audience appropriateness.
Reliability asks the question, “Does the instrument consistently yield the same results with the same
group of people under the same conditions?” Reliability looks for consistency, accuracy, and
dependability of an instrument. Usually, reliability is established by conducting a pilot test or pre-test.
A pre-test provides a means of testing the method and instrument before actual data collection in the
field. It is usually associated with quantitative methods, though qualitative and participatory methods
also can be pre-tested. Pre-testing can prevent costly errors and wasted effort. Box 11 presents
questions associated with pre-testing.

15
A frequently asked question about reliability is, “What value of reliability coefficient is adequate to
establish the instrument’s reliability?” There is no hard and fast answer to this question. Consider what
type and how important a decision is to be made based on the evaluation results. The more important
the decision to be made, the higher the reliability needed. Generally, an alpha value of 0.7 is considered
the cutoff for acceptable reliability (Kerlinger, F. N. and H.B. Lee 2000).
Box 11. Types of Questions Addressed with Pre-testing
Are the issues to be discussed, the questions to be asked, and/or the words to be used clear and
unambiguous?
Is the technique or instrument appropriate for the people being interviewed or observed?
Are instructions for the interviewer or observer easy to follow?
Are the techniques and/or forms for recording information clear and easy to use?
Are procedures clear and standardized?
Will the technique or instrument provide the necessary information?
Does the technique or instrument provide reliable and valid information?
Selecting appropriate evaluation tools After deciding on the most appropriate methodological approach to use (quantitative, qualitative, or
mixed methods), it is important to select appropriate tools and techniques associated with that method.
As with all decisions related to evaluation, the selection of tools and techniques should be consistent
with the purpose, user, and intended use of the results; the context for and impacted population to be
evaluated; resources available for conducting the evaluation; and the stage of program planning and
implementation for which the evaluation is intended. Some examples of evaluation methods, tools, and
techniques as commonly used during progressive stages of extension program planning,
implementation, and completion are identified in Table 2.
Table 2: Common Evaluation Tools and Techniques by Program Stage
Program Stage
Types of Studies
Typical Questions Answered Examples of Evaluation Tools
and Techniques
Planning Stage
Needs Assessment
Feasibility Study
Baseline Study
What are the felt and unfelt needs of the audience?
Can extension address these needs? Do they fit with extension’s mission?
Is the program or project socially, economically, environmentally feasible?
Surveys
Focus Groups
Observation
Content Analysis
(e.g., of office records)
Economic Analysis
(e.g., benefit/cost analysis)

16
Program Stage
Types of Studies
Typical Questions Answered Examples of Evaluation Tools
and Techniques
Imple-mentation Stage
Formative Evaluation
Program Monitoring
Is the program meeting its objectives of intended outcomes?
Is the audience satisfied with the program?
Are the media delivering program messages?
Annual Monitoring Reports
(e.g., staff time and activity reports, crop yield, seed cost)
Adoption Patterns for New Technology
Evaluative Studies of Knowledge, Attitude, and Behavior Change
Customer Satisfaction Surveys
Content Analysis of News Releases
Concluding or Results Stage
Impact Assessment
Summative Evaluation
Has the program addressed the needs or gaps identified?
Is the program achieving desired outcomes?
Is the program cost effective?
Pre- and Post-project Data Analysis
Cohort Studies
Panel Studies
Surveys
(e.g., personal interviews, telephone surveys, mail surveys, online surveys)
Economic Analysis
Selecting appropriate data sources Data sources also are important. Evaluation data can be gathered from primary or secondary sources.
Primary sources include original documents, the first reporting of facts, and the first grouping of the raw
data collected either by the evaluator or obtained from some other source/method. Secondary sources
are materials that combine and synthesize data from multiple primary sources. There is no one “best”
method. Selecting appropriate data sources should be based on the relative merits of each source and
influenced by the type of information desired, time availability, and resources available to conduct an
evaluation. Data source selection also should consider population type and the nature of the issue to be
evaluated. If original data is to be collected, the specific format or source should consider all the above
plus question form and content, response rates desired and expected from a specific population, and
temporal duration of the data collection process.

17
Carefully selecting, training, and monitoring data collectors Surveys and personal interviews are popular forms of data collection for evaluating extension projects
and programs. Evaluation projects generally utilize more than one person to collect data. Although many
factors may affect data quality, minimizing interviewer variance is critical for acquiring valid and reliable
data. In addition to potential diversity among the interviewers themselves, there exist a variety of
factors reflecting interviewers’ interactions with interviewees, the instrument, and the interview context
that might affect data quality. Figure 2 identifies various interviewer characteristics, all elements that
may affect their understanding of a questionnaire or guiding questions, and their interactions with both
the context and interviewees that might affect the nature and quality of the data. As so many factors
may affect variance in results attributed to interviewers, careful selection and training of interviewers
can help ensure data quality and consistency. If possible, evaluators should identify and select data
collectors at the time of finalizing data collection instruments and plans. They must understand the local
culture and should have good reading and writing skills, good listening skills, and the ability to build
rapport quickly. Trained interviewers having no special attachment to the project/program being
evaluated often are the best choice.
Figure 2: Factors That Can Contribute to Interviewer Variance
Interviewer
Characteristics
Appearance
Motives
Beliefs & attitudes
Perceptions
Expectations
Skills & knowledge
Respondent
Characteristics
Knowledge
Interest & motivation
Confidence
Strength of convictions
Expectations
Skills & knowledge
Survey Conditions
& Setting
Mode of interview
Standardization
Interviewer training
Interviewer supervision
Monitoring/observation
Questionnaire
Definition clarity
Terminology & jargon
Question form
Instructions
Question wording
Question topic
Interviewer variance results from the interactions
among all these factors.
Adapted from Biemer, P. P. and L.E. Lyberg 2003

18
Training of data collectors is essential prior to actual data collection. Training topics should include, as
relevant to a specific evaluation, an introduction to the study, role of the interviewer, confidentiality
procedures, review of the questionnaire and interview protocols, standardized interviewing techniques,
probing, recording responses, gaining cooperation, and presentation of scenarios. Pre-testing or pilot-
testing of instruments offers an opportunity for hands-on training for data collectors.
A common problem with using personal interviews as an evaluation technique is falsification of data.
Falsified information may include fabrication of entire interviews, deliberate skipping of some questions,
or fabrication of contextual factors and interviewee characteristics (socio-demographics). Incomplete
surveys and inconsistent answers are common problems with personal interviews. Direct supervision,
random verification with sample respondents, and close monitoring help minimize such problems.
Frequent checking for completeness of information or data collected, timely adjustment of procedures
or tools to fit changing conditions, and timely data entry into a computer database for safe-keeping and
analysis contribute to the level of data quality for data analysis. Numerous electronic devices such as
PDAs, smartphones, and tablet computers, in conjunction with electronic forms, increasingly are being
used to collect survey data. In addition to the ease of using such devices, they can be “stamped” with
geo-position data to facilitate geospatial analysis.
Selecting randomized and/or representative samples Evaluation of extension programs and projects usually involves first-hand collection of data from people.
Thus, the evaluator must make numerous decisions about the sample population then develop an
appropriate sampling plan. The population is the total group from which samples are taken for statistical
measurement. Rather than surveying every person in a given population (census), evaluators often
survey or interview a sample of the population. Using samples is less costly in terms of time, money,
materials, human resources, and effort than surveying or interviewing an entire population. Sample size
and type depends on what is to be evaluated and whether the selected methodological approach is
quantitative or qualitative. For quantitative methods, appropriate statistical analyses, combined with an
appropriate sampling plan and a relatively high response rate, can provide accurate and precise results.
A good sample is a subset of the population that reflects the characteristics of, or is representative of,
the target population (Fink, A. 1995). A sample is representative if important characteristics (e.g., age,
educational level, ethnicity, income) are similarly distributed. A representative sample can be used to
make estimates about the whole group. Sampling methods usually are categorized in two types: random
(probability) sampling and purposeful (non-probability) sampling.
Selecting a sample using random (probability) sampling Random, or probability, sampling is based on random selection of units from the identified population.
This sampling method eliminates subjectivity in choosing a sample and provides a statistical basis for
claiming that a sample is representative of the target population. Every member of the target
population has a known probability of being included in the sample. Several types of random
(probability) sampling techniques are available to evaluators (see Box 12).
Choosing an appropriate sample size requires consideration of numerous factors that influence it. As a
general rule of thumb, Kerlinger and Lee (2000) suggest that researchers “use as large a sample as

19
possible . . . the smaller the sample the larger the error, and the larger the sample the smaller the error”
(p. 175). Nevertheless, the most relevant consideration is that the sample is representative of the target
population. Factors to consider when determining sample size are listed in Box 13.

20
Box 12. Types of Random Sampling Strategies
Simple Random Sampling: All individuals in the population have an equal and independent chance of
being selected as a member of the sample. Random samples can be drawn by using randomly
generated lists with a computer, or by using a random numbers table.
Stratified Random Sampling: To ensure that certain population subgroups are represented in the
sample in proportion to their numbers in the population, individuals within each subgroup, called a
“stratum,” are numbered separately, then a random sample is selected from each stratum. This
strategy is more complicated than simple random sampling; using many subgroups, or “strata,” can
lead to a large, expensive sample. Therefore, clear rationale should exist for selecting any stratum.
Cluster Random Sampling: In this strategy, the sampling unit is not the individual, but rather a
naturally occurring group of individuals, such as a classroom, neighborhood, village, club, or farmers’
group. Clusters are selected randomly, with all members of the selected clusters included in the
sample. Cluster sampling is used in large-scale evaluations.
Box 13. Factors to Consider in Determining Sample Size
Characteristics of Population: Sample size must consider the amount of variability in the population
to be sampled. A relatively homogeneous population may permit a relatively small sample size;
conversely, a more heterogeneous one may require a larger population size.
Sampling Error: The difference between an estimate taken from the population and that taken from
the sample when the same method is used to gather the data is called the sampling error. It is larger
when the sample size is small. Therefore, it is advisable to use the largest sample size possible, given
constraints of time, money, human resources, and materials.
Confidence Interval: Confidence intervals are used to specify the range in which an estimated effect
is expected to lie. It relates to how sample results are used to make statements about the overall
population. Confidence intervals often are used to demonstrate reliability of an estimate. A common
rule of thumb is that a 95% confidence interval is adequate.
Type I Error: Type I error is made when an effect is shown where one does not exist (similar to a false
positive in pregnancy testing). Potential for Type I error is reduced with larger sample sizes.
Type II Error: Type II error is made when results show no impact of a program when, in fact, an
impact has occurred. Type II error is reduced with larger sample sizes.
Minimum Detectable Effect Size (MDES): MDES is the smallest true program effect that can be
detected for a given “power” and “level of significance.” The smaller the effect size we want to detect,
the larger a sample size we need for a given power.
Cluster sampling is ideal for impact evaluation of large-scale agricultural extension projects using
experimental or quasi-experimental designs. Bloom (2005) asserts that it is extremely important to

21
randomize an adequate number of clusters and far less important how many individuals per group are
sampled. Jin and Maredia (2011) developed a table to show sample sizes, using cluster sampling,
resulting in a range of minimum detectable effect sizes for a two-tailed hypothesis test, assuming equal
variances without covariates and a power level of (1-β) = 0.8, a significance level of (α)=0.05, an
interclass correlation of (ρ) = 0.10, and the number of clusters being 60% for treatment and 40% for
control groups (or P=0.6). Table 3 displays the required group size (n) for a given number of clusters.
The key message illustrated in Table 3 is that it is important to have enough clusters from which to
collect the data to achieve the desired minimum detectable effect (MDE). For example, if each cluster
has 30 individuals or households, it would take 50 clusters to achieve a MDE of .29 (shaded gray, with
red numbers). In another example, if the evaluator wants to achieve a MDE of 0.40 (shaded yellow),
they could select either 40 clusters of 10 individuals/households each (n= 400) or 30 clusters of 20
individuals/households each (n= 600). The gain in ability to detect MDE is much greater from increasing
the number of clusters (J) than increasing the number of individuals (n) in each cluster (Bloom, H.S.
2007).
Table 3. Truncated Table Showing Minimum Detectable Effect Size as a Function of Number of Clusters
and Sample Size per Cluster
Randomized Group Size (n)
# of
Clust
ers
(J)
Multi-
plier 10 15 20 25 30 35 40 45 50 60 70
5 4.10 1.60 1.47 1.40 1.35 1.32 1.30 1.28 1.27 1.26 1.24 1.23
10 3.20 0.88 0.81 0.77 0.75 0.73 0.72 0.71 0.70 0.70 0.69 0.68
20 2.96 0.58 0.53 0.50 0.49 0.48 0.47 0.46 0.46 0.45 0.45 0.44
30 2.90 0.46 0.42 0.40 0.39 0.38 0.38 0.37 0.37 0.36 0.36 0.36
40 2.87 0.40 0.36 0.35 0.34 0.33 0.32 0.32 0.31 0.31 0.31 0.30
50 2.85 0.35 0.32 0.31 0.30 0.29 0.29 0.28 0.28 0.28 0.27 0.27
60 2.82 0.32 0.30 0.28 0.27 0.27 0.26 0.26 0.26 0.26 0.25 0.25
70 2.80 0.30 0.27 0.26 0.25 0.25 0.24 0.24 0.24 0.23 0.23 0.23
Adapted from: Jin and Maredia 2011
Appropriately analyzing data Sound design and sampling are necessary, but not sufficient, to ensure a quality evaluation. Appropriate
and robust statistical analysis is critical to credible results. Choice of analytical technique depends, in
part, on whether the data are quantitative or qualitative. But rigor is an essential characteristic for both.

22
Quantitative analysis Evaluation data usually are collected in the form of numbers. Quantitative data help determine
relationships or differences between variables. There is a relationship between variables when
knowledge of one property (characteristic) of a case reduces uncertainty about another property
(characteristic) of the case. If results show a relationship between variables, it means that variables tend
to “go together” in a systematic way.
Correlation statistics measure the relationship between two variables, often between a dependent
variable and an independent variable (e.g., number of new production practices adopted and rice yield),
and are reported within a range of +1 (perfect positive correlation) to -1 (perfect negative correlation).
Positive relationships indicate that, as the value of x increases, the value of y increases. Negative
relationships indicate that, as the value of x increases, the value of y decreases. A correlation coefficient
value of 0 means there is no linear relationship between the variables.
Correlations are used with questions such as: Do farmers who attend extension workshops on a regular
basis adopt more new practices than those who do not? Are female farmers more likely than male
farmers to intend to adopt hybrid maize seed? It is important to note that correlations identify
relationships between variables, but they do not establish causation. Table 4 provides a guide for
common data analysis methods and statistical tests.
Table 4: Selection Guide for Common Statistical Methods
Scale of
Measurement
of Data
Statistical
Method
Testing for:
Differences
(between groups)
Testing for:
Relationships
(within one group)
Categorical
Nominal
Ordinal
Non-parametric Test
Cross-tab or
Chi-square
Contingency coefficient:
Phi coefficient
Cramer’s statistic
Kendall Tau b (square table)
Kendall Tau c (rectangular table)
Nominal
Interval
Ratio
Parametric Test
(use random sample; assume data come from normally distributed population, and equality of variance)
Independent variable should be categorical; dependent variable should be interval or ratio scale.
Use T-test for independent groups to compare means for 2 groups.
Use T-test for matched-pairs to compare pre/post (before/after) mean scores.
Use ANOVA to compare means of >3 groups.
Use Pearson correlation to determine linear relationship between 2 variables measured at interval or ratio scale.
Use regression to determine relationship between two or more variables.
Use discriminant analysis if independent variable is measured at interval/ratio scale and dependent variable is dichotomous.
Adapted from: Suvedi, 2011

23
Advanced statistical tools and data analysis software are available to assist in determining impacts of
extension programs on people, communities, or the environment. A practical concern with use of
statistical tools is forgetting to test the assumptions of the tools, which must be met to permit use of the
specific tools and to facilitate proper interpretation of results (Miller, L. E. 1998).
Qualitative analysis Qualitative data are mainly narrative data that come in many forms and from a variety of sources.
Sources include personal interviews, focus group interviews, key informant interviews, case studies,
daily journals and diaries, documents, and testimonials or storytelling based on personal accounts of
experience. Data collection primarily involves the use of participatory methods. Use of participatory
methods enables inclusion in impact evaluations of voices of underrepresented groups – such as the
poor, the landless, and women – often missed in other types of studies (Chambers, R. 2009).
Evaluators who specialize in qualitative analysis use a method called ‘content analysis.’ Content analysis
is a systematic technique for analyzing the substance of a variety of documents, transcriptions, and
open-ended survey comments. This process includes carefully reading the information, then identifying,
coding, and categorizing the main themes, topics, and/or patterns in the information. Coding involves
attaching some alphanumeric symbol to phrases, sentences, or strings of words that follow a similar
theme or pattern. This process allows placing these themes into categories to draw meanings.
Guidelines for facilitating qualitative data analysis are presented in Box 14.
Box 14. Guidelines for Qualitative Analysis
Get to know your data. Read and re-read the text or listen to the tapes before you begin the
analysis. Quality analysis depends on understanding the data and its context.
Review each evaluation question (clarify the purpose of each). Focus on relevant program topics and
criteria.
Classify information into different themes or patterns, organizing them into coherent categories
that summarize and bring meaning to the text.
Identify themes, patterns, and connections within and between categories.
Interpret the findings by using themes and connections to explain them.
Adapted from: Taylor-Powell, E., and M. Renner. (2003).
Communicating and utilizing evaluation findings The most challenging task for evaluators is to develop useful results from the data and then to share the
results with its users. Program administrators and managers have a responsibility to report evaluation
findings to stakeholders and other audiences who may have an interest in the results. Additionally, it
should be remembered that use of results is different from simply reporting and disseminating them
(Patton, M.Q. 2008b). Use of findings means making thoughtful and deliberate decisions based on those
results. Thus, communication with stakeholders should occur throughout the evaluation process to help
ensure meaningful, acceptable, and useful results.

24
High quality evaluations should contribute to improvements in programs and policies. Evaluators who
are committed to having their work used must ensure that their findings reach intended users in a
timely manner. In fact, relatively new thinking in evaluation posits that the job of evaluation is not
complete until the results are used. Evaluators should, in collaboration with stakeholders, deliberatively
build in clear strategies for integrating evaluation and for using the results during the extension program
planning process. In fact, Patton (2008a) advocates that evaluation itself be evaluated based on whether
or not results are actually used to inform decisions, make changes in programs, reallocate funds and
other resources, and propose policy. Such an approach is termed utilization-focused evaluation.
Additionally, telling the truth to those who may not want to hear it is another purpose of evaluation.
Not all information, however, is useful to all stakeholders. Also, not all stakeholders are information
users. Therefore, getting the right information to the right people at the right time is essential so that
information intended for specific uses is likely to be successful. Evaluators must determine the most
effective media formats and venues to reach specific stakeholder groups, and tailor the focus and depth
of the reports to specific groups, as not all stakeholders prefer or use the same formats. For example,
some prefer short oral presentations; others prefer written reports. Typically, using more than one
method is needed to reach all the stakeholders and intended users. The most important thing is sharing
evaluation findings in a timely manner with appropriate stakeholders (Patton, M.Q. 2008a). Varied
media formats for sharing evaluation results are listed in Box 15.
Box 15. Formats and Venues for Reporting Evaluation Results
Verbal reports Audio-visuals
Media appearances Journal or newspaper articles
Executive summaries (varied distribution) News releases
Public meetings or workshops Newsletters, bulletins, and brochures
Personal discussions Poster presentations
Web pages (static and dynamic) Evaluation reports
Radio broadcasts Cell phone networks & apps
QR codes linked to information Text messages
In a world that is constantly changing technologically, as illustrated with extensive diffusion of cell
phone technology into many remote villages and to farmers globally, it is critical that extension systems
and services continue to modify and expand their information dissemination systems. For example,
extension managers might consider networking people (extension staff as well as in-field innovators) via
online “Ask an Expert/Ask an Innovative Farmer” web sites. They might consider using texting, QR codes,
or tailor-made real-time data-reporting “apps.” Some might opine that many of these new technologies
provide messages that are too brief to be useful. However, these new “cryptic” messages can be used to
link users to more comprehensive sources, or to link them directly to other people.
Sometimes an evaluator must report negative findings. For example, a program may not be meeting its
objectives; a program is being mismanaged; or program changes are needed to increase effectiveness or
efficiency. Evaluation can identify negative results as well as their potential causes or contributing
factors. Thus, negative results can be just as important as positive results in making decisions. Reporting

25
these difficulties can help avoid future mistakes and suggest ways to improve. However, negative
findings must be reported in a manner that helps promote learning and improvement rather than
engender feelings of failure.
Conclusions As stated in the introduction of this chapter, agricultural extension is changing rapidly. The conventional
top-down, supply-driven extension system no longer appears to be an appropriate model. Some
countries have been promoting decentralized and/or bottom-up extension systems; others are
considering market-driven or fee-for-service systems. Non-governmental organizations are extending
education and training services to farmers and agribusinesses. In most countries, central governments
provide an overall policy framework for extension, but a variety of actors (public organizations, civil
societies, and private firms) provide a range of services to farmers and agribusiness operators. A more
recently proposed model is one in which extension staff work more collaboratively with those who have
been viewed traditionally as “clients,” thus more clearly becoming partners in issue identification, action
selection, solution finding, and program planning. Regardless of the extension model in place, demand
for accountability has increased, partly due to increased competition for resources among agencies and
organizations. High quality, integrated evaluation helps address issues of accountability.
In traditional as well as evolving extension systems, employees continue to be highly valuable assets.
The quality of their educational programs depends heavily upon the professional roles played by
extension educators, as educators, trainers, and partners. To perform their roles effectively, all
extension educators should possess sound technical knowledge and skills in the subject matter with
which they work. These technical skills and competencies are necessary, but not sufficient, for extension
educators to serve effectively. Because we live in an era of accountability, funding agencies demand to
know about impacts of extension work. Knowledge and skills in applied research and evaluation can help
respond to these demands and, thus, should be recognized as core competencies for all extension
educators. To summarize, every extension educator should be able to:
understand the different types and levels of program evaluation;
develop outcomes and indicators to evaluate a program;
design evaluation instruments and understand the uses of participatory evaluation;
design and implement formative, summative, and impact evaluations;
apply quantitative and qualitative data analysis tools and techniques, as appropriate, to analyze
and interpret evaluation data;
communicate findings to appropriate audiences; and
use results of evaluation to improve programming.
Sound program evaluation requires a fairly good knowledge of research methods, measurement, data
collection and analysis, and interpretation of results. Most front-line educators lack adequate
knowledge and skills in planning and conducting agricultural extension program evaluations
(Radhakrishna, R. and M. Martin 1999; Suvedi 2011). Thus, investment in agricultural extension must
consider investment in human capacity building through in-service/on-the-job training and pre-service

26
professional education. Immediate investments are needed to upgrade the current monitoring and
reporting systems, strengthen applied research and evaluation skills of mid-level managers and trainers
who supervise the work of front-line educators, and build reward systems that recognize work on
impact evaluation to keep the extension system dynamic, effective, and valued. Suggestions for
addressing these challenges include establishing vibrant staff development programs, motivating staff to
engage in program evaluation work, mentoring those willing to include evaluation in their programs,
and incentivizing those who gain evaluation skills through training and subsequent inclusion of
evaluation in their programs. Ultimately, in-service and pre-service training programs are the building
blocks for local capacity building.
Perhaps a strong building block toward designing and implementing relevant evaluation programs would
be implementation of basic monitoring programs that would provide baseline data for subsequent
evaluation, provide obvious and direct benefits to the farmers themselves, and accustom farmers to
regular use of technology to provide these benefits. A current example of an innovative monitoring
system, developed by Catholic Relief Services (CRS) with funding by MEAS and in response to diverse
members of the Agriculture Learning Alliance (ALA), is Farmbook, a field-based, technology-facilitated
system that enables farmers, working with field agents, to plan their farm businesses based on
monitoring their productivity and profitability. Using PDAs, smartphones, or tablet computers, farmers
can input relevant data into pre-designed forms using one of several software packages (e.g., iForm-
Maker, Form Maker Pro, Form2Go, Wufoo, Formstack), some of them available free of charge via the
Internet. With some software, geo-positions can be auto-stamped to the data, facilitating geographic
analysis and data mapping. Farmers can record things such as inputs, yields, weather conditions, labor
patterns and costs, and sales. Advantages of using such technology include providing real-time access by
farmers to information such as market prices, loan rates, and weather predictions to help them make
wise farm management decisions, and to access supplemental training information on demand.
Farmer engagement and empowerment are direct advantages of these monitoring and training systems.
Evaluators also can benefit from farmers’ adoption and use of these technologies. Ultimately, data
collected regularly through such methods can be used as baseline data for comparative evaluations as
well as used as partial sources for other types of evaluation. Farmers who have become familiar and
comfortable with using technology increasingly will be able to respond effectively and in a timely
manner to technology-based surveys and other evaluation tools.
Additionally, because program evaluation expertise tends to originate from international aid agencies
and organizations, there is a need to develop evaluation capacity at the national level in many countries.
Extension organizations should identify and train staff to serve as national leaders for program
evaluation. International aid agencies may contribute to the development of a network of evaluators so
evaluation practitioners can share empirical studies to benefit each other. Building national in-country
and local capacity is a major step toward sustainability of extension services.

27
References Anderson, J. R., and G. Feder (2004). Agricultural extension: Good Intentions and hard reality. The World
Bank Research Observer, 19(1), 41-60.
Biemer, P. P. and L.E. Lyberg (2003). Introduction to survey quality. Hoboken, NJ: John Wiley & Sons.
Bloom, H. S. (2005). Randomizing groups to evaluate place-based programs. In H. S. Bloom (Ed.),
Learning more from social experiments: Evolving analytic approaches (pp. 115-172). New York, NY:
Russell Sage Foundation.
Bloom, H. S. (Instructor). (21 June 2007). Sample size and statistical power I and II [PowerPoint and
training video]. In Institute for Education Science: 2007 IES Research Training Institute: Cluster
randomized trials, Session 7. Retrieved from
http://ies.ed.gov/ncer/whatsnew/conferences/rct_traininginstitute/presentations.asp
Burnett, G. (2005). Mind map [Photo of mind map drawing]. Retrieved from
http://en.wikipedia.org/wiki/File:Mindmap.gif
Chambers, R. (2009). So that poor count more: Using participatory methods for impact evaluation.
Journal of Development Effectiveness, 1(3), 243-246.
Davis, K. et al (2011). Impact of farmer field schools on agricultural productivity and poverty in East
Africa. World Development, 40(2), 402-413.
Duttweiler, M. W. (2008). The value of evaluation in Cooperative Extension. In Braverman, M. T., Engle,
M., Arnold, M.E., Rennekamp, R. A. (Eds.), Program evaluation in a complex organizational system:
Lessons from Cooperative Extension: New directions for evaluation (120, Winter 2008). Vancouver,
BC: American Evaluation Association and San Francisco, CA: Jossey-Bass. Pp. 87-100.
Fink, A. (1995). How to sample in surveys. Thousand Oaks, CA: Sage Publications.
Flage, L. (2011). Mapping program outcomes using ripple effect mapping: Focus group agenda. As
adapted with permission from Kollock, D. (2010). Retrieved from http://expeng.anr.msu.edu
Flage, L. and S. Chazdon (n.d.). Mapping the Impacts of Extension Programs [PowerPoint]. North Dakota
State University Extension and University of Minnesota Extension. Retrieved from
http://expeng.anr.msu.edu
Horton, D. et al (1993). Monitoring and evaluating agricultural research: A sourcebook. Wallingford: CAB
International.
Jin, S. and M. Maredia (2011). Impact evaluation design for the Lesotho-MCA Land Reform and
Administration Project. East Lansing, MI: Michigan State University.
Kerlinger, F. N. and H.B. Lee (2000). Foundations of behavioral research (4th ed.). Belmont, CA:
Wadsworth Publishing Co.
Khandker, S. R., G.B. Koolwal and H.A. Samad (2010). Handbook on impact evaluation: Quantitative
methods and practices. Washington, DC: World Bank Publications.

28
Kollock, D. A. (2011). Ripple effect mapping for evaluation. Washington State University curriculum.
Pullman, WA: Washington State University.
Miller, L. E. (1998). Appropriate analysis. Journal of Agricultural Education, 39(2), 1-10.
Misra, D. C. (1998). Monitoring extension programmes and resources. In Swanson, B., Bentz, R., &
Sofranko, A. (Eds.), Improving agricultural extension. A reference manual. Rome, Italy: Food and
Agriculture Organization of the United Nations.
Nkonya, E. et al (2008). Impacts of a pro-poor community-driven development project in Nigeria.
Discussion Paper 00756. Washington, DC: International Food Policy Research Institute.
Patton, M. Q. (2008a). sup wit eval ext? In Braverman, M. T., Engle, M., Arnold, M.E., Rennekamp, R. A.
(Eds.), Program evaluation in a complex organizational system: Lessons from Cooperative Extension:
New directions for evaluation (120, Winter 2008). Vancouver, BC: American Evaluation Association
and San Francisco, CA: Jossey-Bass. Pp. 101-115.
Patton, M. Q. (2008b). Utilization-focused evaluation (4th ed.). Thousand Oaks, CA: Sage Publications.
Radhakrishna, R. and M. Martin (1999). Program evaluation and accountability training needs of
extension agents. Journal of Extension, 37(3). Retrieved from www.joe.org/joe/1999june/rb1.php
Richardson, J. G., and C.L. Moore (2002). Determining extension program economic benefit values. AEE
01-2002, Department of Agricultural and Extension Education, Raleigh, NC: North Carolina State
University.
Rogers, E. M. (2003). Diffusion of innovations (5th ed.). New York, NY: Free Press.
Seepersad, J., and T.H. Henderson. (1984). Evaluating extension programs. In Swanson, B. E. (Ed.),
Agricultural extension: A reference manual. Rome, Italy: Food and Agriculture Organization.
Steele, S. (1975). An emerging concept of program evaluation. Journal of Extension, 13(2), 13-22.
Retrieved from http://www.joe.org/joe/1975march/index.php
Suvedi, M. (2011). Evaluation of agricultural extension and advisory services: A MEAS training module.
Modernizing Extension and Advisory Services Project. Washington, DC: USAID.
Swanson, B. and R. Rajalahti. (2010). Strengthening agricultural extension and advisory systems:
Procedures for assessing, transforming, and evaluating extension systems (Paper 45). Washington,
DC: The World Bank, Agriculture and Rural Development.
Taylor-Powell, E., and M. Renner. (2003). Analyzing qualitative data. (G3658-12). Madison, WI:
University of Wisconsin-Extension, Cooperative Extension Publishing Operations.
USAID, Bureau for Policy, Planning, and Learning. (2011). Evaluation policy. Retrieved from
www.usaid.gov/evaluation/USAID_EVALUATION_POLICY.pdf?020911
Yin, R. K. (1984). Case study research: Design and methods. Applied Social Research Methods Series, 5.
Newbury Park, CA: Sage.