Improving the intelligibility of dysarthric speech -...
17
Improving the intelligibility of dysarthric speech Alexander B. Kain a, * , John-Paul Hosom a , Xiaochuan Niu a , Jan P.H. van Santen a , Melanie Fried-Oken b , Janice Staehely b a Center for Spoken Language Understanding, OGI School of Science & Engineering, Oregon Health & Science University, Portland, OR, USA b Departments of Neurology and Otolaryngology, Oregon Institute on Disability and Development, Oregon Health & Science University, Portland, OR, USA Received 29 July 2006; received in revised form 18 April 2007 Abstract Dysarthria is a speech motor disorder usually resulting in a substantive decrease in speech intelligibility by the general population. In this study, we have significantly improved the intelligibility of dysarthric vowels of one speaker from 48% to 54%, as evaluated by a vowel identification task using 64 CVC stimuli judged by 24 listeners. Improvement was obtained by transforming the vowels of a speaker with dysarthria to more closely match the vowel space of a non-dysarthric (target) speaker. The optimal mapping feature set, from a list of 21 candidate feature sets, proved to be one utilizing vowel duration and F1–F3 stable points, which were calculated using shape-constrained isotonic regression. The choice of speaker-specific or speaker-independent vowel formant targets appeared to be insignificant. Compar- isons with ‘‘oracle’’ conditions were performed in order to evaluate the analysis/re-synthesis system independently of the transformation function. Ó 2007 Elsevier B.V. All rights reserved. Keywords: Speech processing; Speech transformation; Speech modification; Intelligibility; Dysarthria 1. Introduction Dysarthria refers to a group of speech disorders result- ing from disturbances in muscular control over the speech mechanism due to damage of the central or peripheral ner- vous system. Individuals with dysarthria have problems in oral communication due to paralysis, weakness, or incoor- dination of the speech musculature (Darley et al., 1969). This neurogenic motor speech impairment is associated with diseases and conditions that are chronic or long-term (Yorkston et al., 1999). Some neurological conditions, such as traumatic brain injury or stroke, produce a non-progres- sive dysarthria, while others, such as Huntington’s disease, Parkinson’s disease or amyotrophic lateral sclerosis (ALS), produce a degenerative dysarthria that degrades speech over time. Dysarthria can be described as an impairment in one or more of the processes of speech production: res- piration, phonation, resonance, articulation, and prosody. The disorder of movement is due to abnormal neuromus- cular execution that may affect the speed, strength, range, timing, or accuracy of speech movements (Duffy, 2005). For example, an individual with ataxic dysarthria second- ary to Friedrich’s ataxia may present with a slow rate for individual and repetitive speech movements, an excessive range of speech movements, reduced muscle tone and irregular speech rhythm. The patient’s speech may include imprecise consonants and distorted vowels, irregular articulatory breakdowns, excessive or equal stress to all syl- lables, and a slow rate of speech with a phonatory-prosodic insufficiency described as harsh, monotonous and mono- loudness. Individuals with Parkinson’s disease usually present with a hypokinetic dysarthria. They complain that their voice is quieter or weak, their speech rate is too fast, words are indistinct and that it is often difficult to get speech started. Persons with multiple sclerosis, on the other hand, may complain of slurred speech with changes in 0167-6393/$ - see front matter Ó 2007 Elsevier B.V. All rights reserved. doi:10.1016/j.specom.2007.05.001 * Corresponding author. Tel.: +1 503 329 9604; fax: +1 503 748 1306. E-mail address: [email protected] (A.B. Kain). URL: www.cslu.ogi.edu (A.B. Kain). www.elsevier.com/locate/specom Speech Communication 49 (2007) 743–759
Transcript of Improving the intelligibility of dysarthric speech -...
www.elsevier.com/locate/specom
Speech Communication 49 (2007) 743–759
Improving the intelligibility of dysarthric speech
Alexander B. Kain a,*, John-Paul Hosom a, Xiaochuan Niu a, Jan P.H. van Santen a,Melanie Fried-Oken b, Janice Staehely b
a Center for Spoken Language Understanding, OGI School of Science & Engineering, Oregon Health & Science University, Portland, OR, USAb Departments of Neurology and Otolaryngology, Oregon Institute on Disability and Development, Oregon Health & Science University, Portland, OR, USA
Received 29 July 2006; received in revised form 18 April 2007
Abstract
Dysarthria is a speech motor disorder usually resulting in a substantive decrease in speech intelligibility by the general population. Inthis study, we have significantly improved the intelligibility of dysarthric vowels of one speaker from 48% to 54%, as evaluated by a vowelidentification task using 64 CVC stimuli judged by 24 listeners. Improvement was obtained by transforming the vowels of a speaker withdysarthria to more closely match the vowel space of a non-dysarthric (target) speaker. The optimal mapping feature set, from a list of 21candidate feature sets, proved to be one utilizing vowel duration and F1–F3 stable points, which were calculated using shape-constrainedisotonic regression. The choice of speaker-specific or speaker-independent vowel formant targets appeared to be insignificant. Compar-isons with ‘‘oracle’’ conditions were performed in order to evaluate the analysis/re-synthesis system independently of the transformationfunction.� 2007 Elsevier B.V. All rights reserved.
Keywords: Speech processing; Speech transformation; Speech modification; Intelligibility; Dysarthria
1. Introduction
Dysarthria refers to a group of speech disorders result-ing from disturbances in muscular control over the speechmechanism due to damage of the central or peripheral ner-vous system. Individuals with dysarthria have problems inoral communication due to paralysis, weakness, or incoor-dination of the speech musculature (Darley et al., 1969).This neurogenic motor speech impairment is associatedwith diseases and conditions that are chronic or long-term(Yorkston et al., 1999). Some neurological conditions, suchas traumatic brain injury or stroke, produce a non-progres-sive dysarthria, while others, such as Huntington’s disease,Parkinson’s disease or amyotrophic lateral sclerosis (ALS),produce a degenerative dysarthria that degrades speechover time. Dysarthria can be described as an impairment
0167-6393/$ - see front matter � 2007 Elsevier B.V. All rights reserved.
doi:10.1016/j.specom.2007.05.001
* Corresponding author. Tel.: +1 503 329 9604; fax: +1 503 748 1306.E-mail address: [email protected] (A.B. Kain).URL: www.cslu.ogi.edu (A.B. Kain).
in one or more of the processes of speech production: res-piration, phonation, resonance, articulation, and prosody.The disorder of movement is due to abnormal neuromus-cular execution that may affect the speed, strength, range,timing, or accuracy of speech movements (Duffy, 2005).For example, an individual with ataxic dysarthria second-ary to Friedrich’s ataxia may present with a slow rate forindividual and repetitive speech movements, an excessiverange of speech movements, reduced muscle tone andirregular speech rhythm. The patient’s speech may includeimprecise consonants and distorted vowels, irregulararticulatory breakdowns, excessive or equal stress to all syl-lables, and a slow rate of speech with a phonatory-prosodicinsufficiency described as harsh, monotonous and mono-loudness. Individuals with Parkinson’s disease usuallypresent with a hypokinetic dysarthria. They complain thattheir voice is quieter or weak, their speech rate is too fast,words are indistinct and that it is often difficult to getspeech started. Persons with multiple sclerosis, on the otherhand, may complain of slurred speech with changes in

744 A.B. Kain et al. / Speech Communication 49 (2007) 743–759
pitch, hypernasal speech, hoarseness and poor loudnesscontrol.
Very little data are available on the estimated incidenceor prevalence of people with dysarthria in the UnitedStates. Yorkston et al. (1988) contend that motor speechdisorders probably represent a significant proportion ofthe communication disorders seen in medical speech-lan-guage pathology practices. Duffy (2005) found that 36.5%of speech pathology diagnostic consultations from theDepartment of Neurology at the Mayo Clinic from 1987to 1990 were motor speech disorders. Another study of77 patients with multiple sclerosis showed that 51% hadmild to severe dysarthria (Harteliusa et al., 2000). Thesepercentages may be extrapolated to the larger populationof individuals with neurologic disease who have requiredspeech pathology evaluations in the past.
The type of treatment for persons with dysarthria isdependent on a number of circumstances, including diag-nosis, severity of dysarthria, present needs and prognosis,environment, and the speaker’s acceptance or motivationfor speaking. Generally, treatment options range frombehavioral techniques to speech generating devices thatreplace the patient’s speech.
Speech generating devices fall within the clinical field ofaugmentative and alternative communication (Beukelmanand Mirenda, 2005). Certainly dysarthric speakers preferto use their own natural skills to express thoughts. How-ever, listeners prefer synthetic speech over natural dysar-thric speech, if the latter has low intelligibility (Drageret al., 2004). Often a dysarthric speaker will use naturalspeech and a device together, depending on the message,listener, environment, and importance of the interaction.For example, a person with moderate dysarthria secondaryto a stroke might use a speech generating device to con-verse over the telephone with his children, but rely on dys-arthric speech in a romantic dinner setting.
Devices are developed with three critical features inmind: the type of user input (e.g. keyboard, pointers, orhead movements), the type of output (e.g. play-back ofrecorded speech or synthesized speech), and the type of lan-guage representation, which is the form of symbols thatwill be used to represent thought and language (e.g. photo-graphs/pictures (Words+ Inc.; Visser), alphabet, orsymbols (Prentke Romich Company; Semantic Compac-tion Systems)). While speech generating devices can replaceor supplement natural speech, they have not yet beendesigned to mimic the speed or ease of production that isexperienced by oral communicators.
To date, only one device exists on the commercialmarket that attempts to improve the natural dysarthricspeech itself. The Speech Enhancer device (ElectronicSpeech Enhancement Inc) claims to ‘‘clarify’’ dysarthricspeech; however, no published controlled research isavailable. The exact nature of their electronic algorithmis proprietary. We speculate that it is an adaptive equal-izer that continuously adjusts the gain in several fre-quency bands to fit a target spectral envelope, in order
to amplify those regions of speech most relevant tospeech perception.
In this article, we report on our recent research with thegoal of enabling people with dysarthria to be understoodby the general population. Our approach is to transform
the original dysarthric speech signal by performing adetailed speech analysis, applying a trained transformation
function to the obtained speech features, and to synthesize anew speech signal from the transformed speech features.The resulting speech signals have been used as stimuli ina formal perceptual listening test to measure the efficacyof our method. In the present work, we aim to answer threequestions: (1) Can vowels from a dysarthric speaker betransformed for improved intelligibility, (2) How dospeaker-specific or speaker-independent vowel formant tar-gets affect the intelligibility of transformed speech, and (3)What is an appropriate feature set for both input and out-put of the transformation function.
The rest of the article is organized as follows: Section 2reviews our preliminary work on this subject. Section 3introduces the key ideas of our approach and discussesthe speech corpus (Section 3.2) as well as the analysis(Section 3.3), transformation (Section 3.4), and synthesis(Section 3.5) of speech in detail. The design, administra-tion, and results of an evaluation of our method are dis-cussed in Section 4, and we conclude with Section 5.
2. Preliminary experiments
In a first experiment (Hosom et al., 2003), we studied theeffects of modifications to the dysarthric speech signal.Specifically, we measured the contributions of prosodyand short-term spectra of certain speech sounds to theintelligibility of sentences. Using ‘‘hybrid’’ stimuli createdfrom parallel natural and dysarthric speech recordings ofnonsense sentences (Menendez-Pidal et al., 1996), we foundthat replacing the short-term spectrum of a dysarthricspeaker (identified as LL) with a non-dysarthric speaker’sshort-term spectrum (while keeping the prosody of thedysarthric speaker) led to an intelligibility of 87% as com-pared to a baseline of 68%. Moreover, replacing just vow-els, liquids, and glides (VLG) led to an intelligibility of75%, whereas replacing all non-VLG speech soundsresulted in an intelligibility of 73%. Replacing the prosody(pitch, duration, and energy) of the utterance with that of anon-dysarthric speaker, while keeping the dysarthric short-term spectrum, led to an intelligibility of 75%. These resultsdemonstrated the potential of improving the intelligibilityof dysarthric speech by a partial modification of the speechsignal, even though the factors that influence intelligibilityare both numerous and co-dependent.
A similar approach was taken by Maassen and Povel,who modified deaf speech with the intent to increase itsintelligibility (Maassen and Povel, 1984). Replacing thefundamental frequency trajectory with an artificial oneyielded a 7% improvement (from 20% to 27% wordscorrectly identified). They also experimented with replacing
Recording Database
Voicing
Overlap-add
Energy
Modification
F0
Generation
Formant
Modification
Energy
Analysis
Formant
Synthesis
Formant
Analysis
2 Band
Filter Bank
formants energy
input speech waveform
unvoiced
voiced speech
highpass
output speech waveform
CV boundaries
formants’ F0’ energy’
voiced’
lowpass
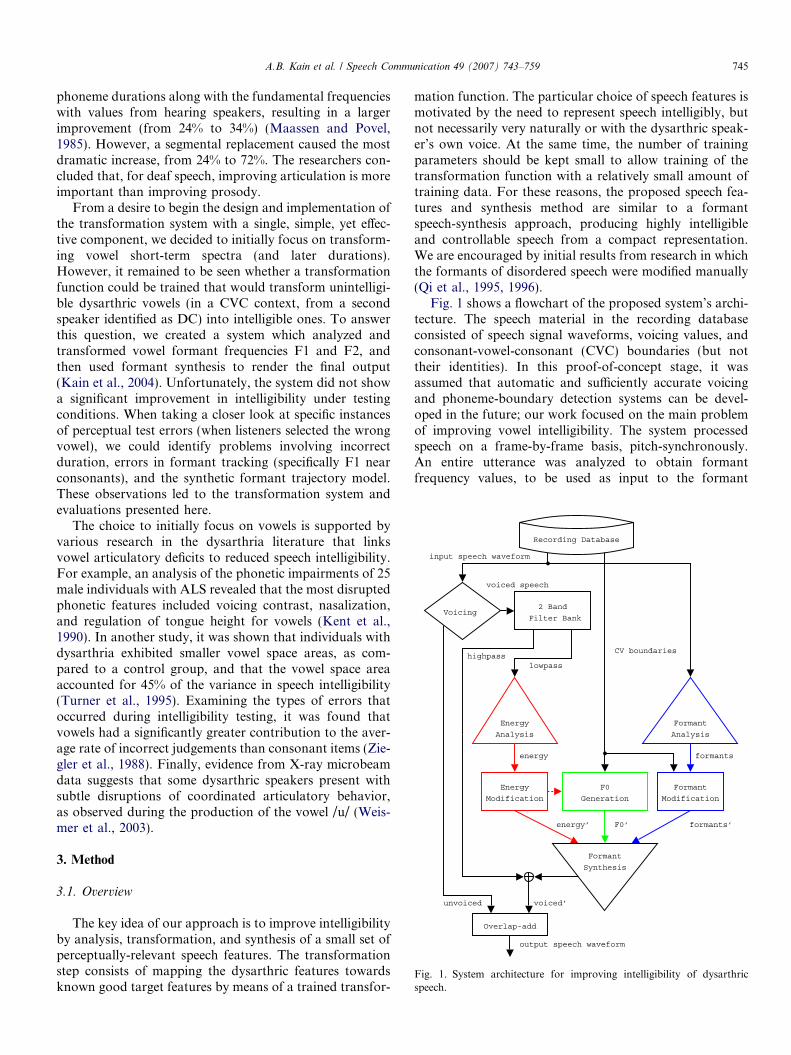
Fig. 1. System architecture for improving intelligibility of dysarthricspeech.
A.B. Kain et al. / Speech Communication 49 (2007) 743–759 745
phoneme durations along with the fundamental frequencieswith values from hearing speakers, resulting in a largerimprovement (from 24% to 34%) (Maassen and Povel,1985). However, a segmental replacement caused the mostdramatic increase, from 24% to 72%. The researchers con-cluded that, for deaf speech, improving articulation is moreimportant than improving prosody.
From a desire to begin the design and implementation ofthe transformation system with a single, simple, yet effec-tive component, we decided to initially focus on transform-ing vowel short-term spectra (and later durations).However, it remained to be seen whether a transformationfunction could be trained that would transform unintelligi-ble dysarthric vowels (in a CVC context, from a secondspeaker identified as DC) into intelligible ones. To answerthis question, we created a system which analyzed andtransformed vowel formant frequencies F1 and F2, andthen used formant synthesis to render the final output(Kain et al., 2004). Unfortunately, the system did not showa significant improvement in intelligibility under testingconditions. When taking a closer look at specific instancesof perceptual test errors (when listeners selected the wrongvowel), we could identify problems involving incorrectduration, errors in formant tracking (specifically F1 nearconsonants), and the synthetic formant trajectory model.These observations led to the transformation system andevaluations presented here.
The choice to initially focus on vowels is supported byvarious research in the dysarthria literature that linksvowel articulatory deficits to reduced speech intelligibility.For example, an analysis of the phonetic impairments of 25male individuals with ALS revealed that the most disruptedphonetic features included voicing contrast, nasalization,and regulation of tongue height for vowels (Kent et al.,1990). In another study, it was shown that individuals withdysarthria exhibited smaller vowel space areas, as com-pared to a control group, and that the vowel space areaaccounted for 45% of the variance in speech intelligibility(Turner et al., 1995). Examining the types of errors thatoccurred during intelligibility testing, it was found thatvowels had a significantly greater contribution to the aver-age rate of incorrect judgements than consonant items (Zie-gler et al., 1988). Finally, evidence from X-ray microbeamdata suggests that some dysarthric speakers present withsubtle disruptions of coordinated articulatory behavior,as observed during the production of the vowel /u/ (Weis-mer et al., 2003).
3. Method
3.1. Overview
The key idea of our approach is to improve intelligibilityby analysis, transformation, and synthesis of a small set ofperceptually-relevant speech features. The transformationstep consists of mapping the dysarthric features towardsknown good target features by means of a trained transfor-
mation function. The particular choice of speech features ismotivated by the need to represent speech intelligibly, butnot necessarily very naturally or with the dysarthric speak-er’s own voice. At the same time, the number of trainingparameters should be kept small to allow training of thetransformation function with a relatively small amount oftraining data. For these reasons, the proposed speech fea-tures and synthesis method are similar to a formantspeech-synthesis approach, producing highly intelligibleand controllable speech from a compact representation.We are encouraged by initial results from research in whichthe formants of disordered speech were modified manually(Qi et al., 1995, 1996).
Fig. 1 shows a flowchart of the proposed system’s archi-tecture. The speech material in the recording databaseconsisted of speech signal waveforms, voicing values, andconsonant-vowel-consonant (CVC) boundaries (but nottheir identities). In this proof-of-concept stage, it wasassumed that automatic and sufficiently accurate voicingand phoneme-boundary detection systems can be devel-oped in the future; our work focused on the main problemof improving vowel intelligibility. The system processedspeech on a frame-by-frame basis, pitch-synchronously.An entire utterance was analyzed to obtain formantfrequency values, to be used as input to the formant

Table 1Number of vowel occurrences in the speech corpus
Vowel /i:/ /I/ /E/ /@/ /u/ /U/ /^/ /A/Total 39 42 38 38 31 18 31 41
746 A.B. Kain et al. / Speech Communication 49 (2007) 743–759
modification operation. Unvoiced frames of speech, how-ever, were passed directly to the output. Additionally,any speech frequencies above 4 kHz were passed through,unmodified, to the output signal.
To generate the voiced regions of the transformedspeech, the system performed modifications to the energyand formant features, and generated a new F0 trajectoryfrom the CVC boundary information. Energy modificationwas applied because the dysarthric speech often containedsignificant energy flutter (variations in energy), likelycaused by high levels of ‘‘vocal fry’’ (Titze, 2000). Similarly,the F0 trajectory of a dysarthric speaker often containedsignificant jitter (variations in F0). In our experiments,we discarded the original F0 values, which were often esti-mated with large errors, in favor of a synthetic F0 contour,generated by a simple superpositional intonation model(van Santen and Mobius, 2000). Formants were modifiedby estimating a representative formant vector for the entiredysarthric vowel, mapping that vector to the transformedformant vector using a nonlinear, trained function, andthen creating the transformed formant trajectory. Finally,vowel durations were modified.
It should be noted that our method did not employother, simpler modifications to the signal, such as dynamicvolume compression/expansion schemes. Even thoughthese modifications are commonly believed to improvethe intelligibility of the speech signal (and are thus com-monly used in simple speech enhancement devices for per-sons with dysarthria and other speech processing areassuch as broadcasting), the authors wanted to measureimprovements that were only a consequence of theproposed method.
3.2. Database design and recording
In order to deal with the formidable complexity of thetask, we limited ourselves to studying CVC contexts froma special-purpose database. We also used an additionaldatabase for analysis of vowel targets.
3.2.1. CVC Database
The vowels in the CVC ‘‘words’’ consisted of 4 frontvowels (/i:/, /I/, /E/, and /@/, using Worldbet symbolsfor transcription (Hieronymus) and 4 back vowels (/u/,/U/, /^/, and /A/). These vowels represent typical vocal-tract configurations in American English. The vowel />/was omitted because in West-Coast American English thisvowel is often identical to /A/. Diphthongs were omittedbecause of their dynamics. The consonants consisted of 6stops (/p/, /b/, /t/, /d/, /k/, and /g/), 4 fricatives (/v/, /s/,/z/, and /S/), and 3 approximants (/l/, /j/, and /w/). The /j/and /w/ approximants occurred only in the initial conso-nant position, as they are never syllable-final phonemesin English. The /l/ approximant occurred only in the initialconsonant position because word-final /l/ causes a highdegree of ‘‘coloring’’ of the preceding vowel. These conso-nants cover a variety of places of articulation and manner
of articulation among the consonants of English. Nasalconsonants were omitted because they may cause nasaliza-tion of the neighboring vowel, which makes formant track-ing more difficult. The list of CVC words was constructedby randomly generating a unique CVC combination andadding this CVC word to the final list of words only if thatCVC word occurred in a 125,000-word pronunciation dic-tionary of American English (Carnegie Mellon University,2004). The final number of vowel occurrences is shown inTable 1.
The speech data were utterances from one dysarthricspeaker (speaker DC) and one non-dysarthric speaker(speaker JH). The dysarthric speaker was a female nativespeaker of American English presenting with Friedrich’sataxia. Clinically, she was judged to be about 70% intelligi-ble and her moderately dysarthric speech was characterizedby vowel distortions, monostress and monoloudness,hypernasality, reduced vocal range with a harsh, strangledquality to connected speech. The non-dysarthric speakerwas a male native speaker of American English. Eachspeaker read 278 isolated monosyllabic CVC words. Thespeech signal was recorded directly to a hard drive usinga head-mounted AKG HSC 200 electret microphone andMAudio Delta 1010 A/D converter. Waveforms wererecorded and stored in 16 kHz, 16-bit PCM format.Recordings were made in a quiet, but not acousticallydampened, room. The recording interface for the dysar-thric speaker (who was not familiar with phonetic alpha-bets) consisted of (a) the CVC word, presented on thescreen, (b) a word that rhymed with the CVC word, pre-sented on the screen, and (c) the play-back of a previouslyrecorded sample of this CVC from the non-dysarthricspeaker. The dysarthric subject then spoke the CVC wordafter a short tone prompt. Recording of all 278 words bythe dysarthric speaker was performed in a single, 1.25 hoursession with several rest breaks.
After recording, each utterance from both the non-dysarthric and dysarthric speaker was manually segmentedinto a sequence of phoneme labels with time alignments.
The CVC database was prepared into several rotationsof test and training sets. First, all words from the corpusfor both the non-dysarthric and the dysarthric speakerwere analyzed (see Section 3.3). Then, the data was splitinto training (214 feature vectors) and testing (64 featurevectors) data sets. Care was taken to ensure that the testingdata set contained a uniform distribution of all availablevowels (8 occurrences of all 8 vowels). Actual assignmentswere performed by random permutation. By seeding therandom number generator with 10 different starting states,we obtained 10 different versions (rotations) of splitting thecorpus data into training and testing partitions.

A.B. Kain et al. / Speech Communication 49 (2007) 743–759 747
3.2.2. Vowel-target database
In addition to the 278 CVC words from the dysarthricspeaker, nine words were recorded several times at record-ing sessions over a period of several months. These wordswere selected in order to elicit formant values that reachedtheir intended targets with minimal coarticulatory influence.These nine words were (with pronunciation indicated inparentheses): ‘‘he’’ (/h i:/), ‘‘hit’’ (/h I t/), ‘‘heck’’ (/h E k/),‘‘hack’’ (/h @ k/), ‘‘who’’ (/h u/), ‘‘hook’’ (/h U k/), ‘‘huff’’(/h ^ f/), ‘‘ha’’ (/h A/), and ‘‘hoe’’ (/h oU/).
3.3. Analysis
Energy, voicing, and formant (F1–F3) features werederived using the ESPS Waves+ software package. Wespecifically tuned the getformant parameters (preempha-
sis = 0.99, lpcorder = 20; all other parameters were at theirdefault settings) to avoid making F1 errors at the edges ofthe vowel. Even so, errors in both formant frequency andbandwidth estimation occurred at times. We decided tonot correct these values, in order to demonstrate that theproposed algorithm works with imperfect, but automatic
formant estimation. Additionally, we measured the initialand final formant slopes by taking the average of the firstorder difference in the initial third and final third of thevowel region.
It has been assumed that there exists a target vocal-tractconfiguration during the production of each monoph-thong, and that this configuration corresponds to a certainformant pattern, which can be measured from the acousticdata at a stable point or section of the vowel that is leastinfluenced by context. There have been different ways ofchoosing the stable point or section in previous studies ofthe formant characteristics of vowels. Stevens and House(1963) studied formant values at temporal midpoints ofvowels. Lindblom (1963) represented Swedish vowels withthe values of the first three formants at the time at whichthe first derivative of the corresponding trajectory waszero. In a study by Di Benedetto (1989), the samplingpoints of formants were chosen at the time at which F1reached its maximum. The motivation for this choice wasthe concave upward shape of the F1 trajectory of a vowelbetween two consonants, which is consistent with the pre-diction of acoustic theory. In fact, under the shape assump-tion, the maximum F1 point is equivalent to the point atwhich the first derivative is zero. However, the numeric cal-culation of the derivative amplifies the noise of trajectorymeasurements, which makes it difficult to reliably deter-mine the zero point automatically from data. This difficultyis more severe for dysarthric speech due to more irregular-ities. Therefore, in the present study, we chose the maxi-mum point on the F1 trajectory of each vowel toapproximate its stable point.
As for the F2 trajectory of a vowel, we assumed that itcould only be in one of the following four shapes: concaveupward or downward, or monotonically increasing ordecreasing. When it was in the concave upward or down-
ward shape (as determined by shape-constrained regres-sion, explained below), we chose the maximum orminimum point as the stable point of the F2 trajectory.We have observed that the maximum or minimum doesnot necessarily occur at the same instant of time as themaximum of the F1 trajectory. This observation could bea consequence of the fact that different articulators canmove relatively independently during speech production.When the F2 trajectory was monotonically increasing ordecreasing, we chose the stable point as the median F2value of the trajectory.
The procedure to measure F1 and F2 values at stablepoints was as follows. The formant trajectories wereextracted by the formant tracker at 10 ms intervals. Thena third-order median filter was used to suppress impulsivenoise in the trajectory data. A forward–reverse low-pass fil-ter, whose impulse response was a five-tap normalizedHanning window, was used to smooth the F1 and F2trajectories. Within the vowel section, the maximum ofthe F1 trajectory was then obtained. In order to automat-ically determine the shape of the F2 trajectory of the vowel,F2 data were tested by four types of shape-constrainedregressions, including an increasing isotonic regression, adecreasing isotonic regression, a unimodal regression, anda reverse unimodal regression. The shape was determinedby the least regression error among the tests. Accordingto the shape of the F2 trajectory, the stable point and F2value were determined. The F1 and F2 values measuredat the stable points were used as the estimates of formanttargets during the training and modification process.
The four shape-constrained regressions worked asfollows. Given a sequence of numbers fY igN
i¼1, the increas-ing isotonic regression found fbY igN
i¼1 to minimizePN
i¼1ðY i�bY iÞ2=N , subject to the monotonicity restriction, bY 1 6bY 2 6 � � � 6 bY N . The problem was solved with the pool-adjacent-violators algorithm (Barlow et al., 1980):
(1) Start with Y1 and move to the right until Yi > Yi+1.Pool Yi and the adjacent Yi+1, by replacing them bothwith their average Y �i .
(2) Check whether Y i�1 6 Y �i . If not, pool {Yi�1,Yi,Yi+1} into their average. Continue to the left untilthe monotonicity requirement is satisfied. Then pro-ceed to the right. The final solutions are fbY igN
i¼1.
The decreasing isotonic regression performed a similaroperation to the above algorithm with the opposite mono-tonicity restriction and violator check. It found a monoton-ically non-increasing solution.
The unimodal regression assumed each point of theinput sequence could be the unique peak. It applied theincreasing regression to the left part of the sequence andthe decreasing regression to the right part of the sequence,and calculated the total mean-square error of the estima-tion. The peak with the least mean-square error was chosento be the solution. The reverse unimodal regressionsearched for a unique valley in a similar way by using a
748 A.B. Kain et al. / Speech Communication 49 (2007) 743–759
decreasing, and then an increasing regression of the inputsequence.
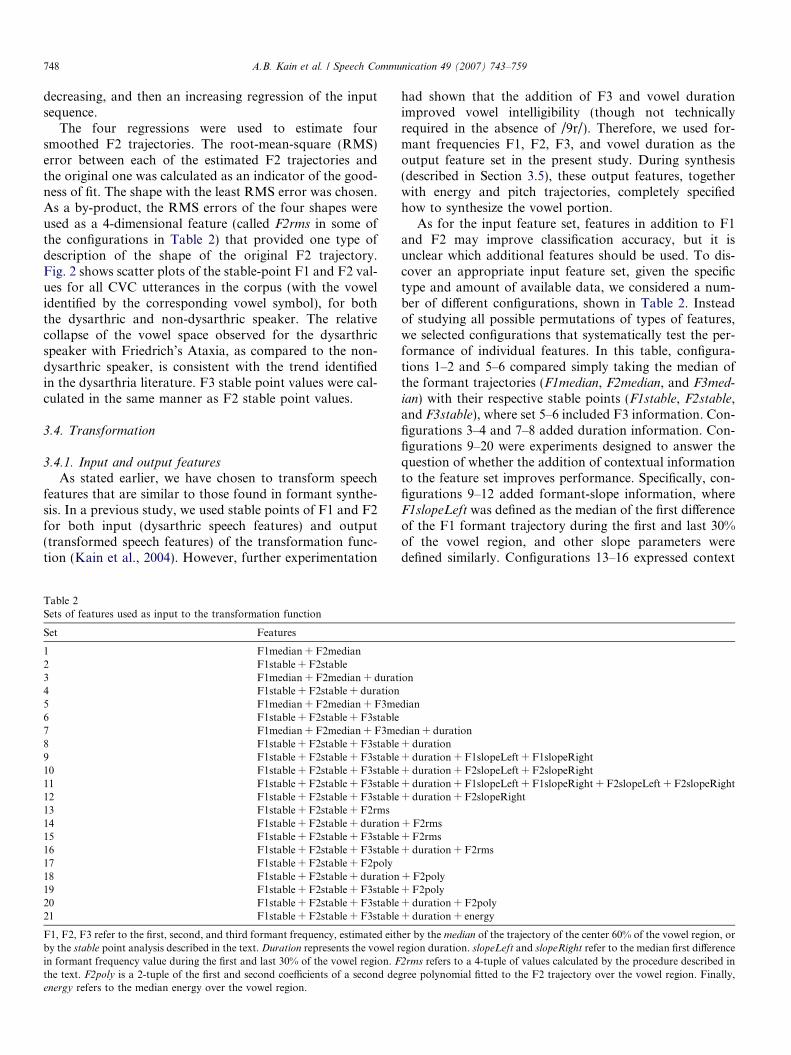
The four regressions were used to estimate foursmoothed F2 trajectories. The root-mean-square (RMS)error between each of the estimated F2 trajectories andthe original one was calculated as an indicator of the good-ness of fit. The shape with the least RMS error was chosen.As a by-product, the RMS errors of the four shapes wereused as a 4-dimensional feature (called F2rms in some ofthe configurations in Table 2) that provided one type ofdescription of the shape of the original F2 trajectory.Fig. 2 shows scatter plots of the stable-point F1 and F2 val-ues for all CVC utterances in the corpus (with the vowelidentified by the corresponding vowel symbol), for boththe dysarthric and non-dysarthric speaker. The relativecollapse of the vowel space observed for the dysarthricspeaker with Friedrich’s Ataxia, as compared to the non-dysarthric speaker, is consistent with the trend identifiedin the dysarthria literature. F3 stable point values were cal-culated in the same manner as F2 stable point values.
3.4. Transformation
3.4.1. Input and output featuresAs stated earlier, we have chosen to transform speech
features that are similar to those found in formant synthe-sis. In a previous study, we used stable points of F1 and F2for both input (dysarthric speech features) and output(transformed speech features) of the transformation func-tion (Kain et al., 2004). However, further experimentation
Table 2Sets of features used as input to the transformation function
Set Features
1 F1median + F2median2 F1stable + F2stable3 F1median + F2median + durat4 F1stable + F2stable + duration5 F1median + F2median + F3me6 F1stable + F2stable + F3stable7 F1median + F2median + F3me8 F1stable + F2stable + F3stable9 F1stable + F2stable + F3stable10 F1stable + F2stable + F3stable11 F1stable + F2stable + F3stable12 F1stable + F2stable + F3stable13 F1stable + F2stable + F2rms14 F1stable + F2stable + duration15 F1stable + F2stable + F3stable16 F1stable + F2stable + F3stable17 F1stable + F2stable + F2poly18 F1stable + F2stable + duration19 F1stable + F2stable + F3stable20 F1stable + F2stable + F3stable21 F1stable + F2stable + F3stable
F1, F2, F3 refer to the first, second, and third formant frequency, estimated eithby the stable point analysis described in the text. Duration represents the vowel rin formant frequency value during the first and last 30% of the vowel region. F
the text. F2poly is a 2-tuple of the first and second coefficients of a second deenergy refers to the median energy over the vowel region.
had shown that the addition of F3 and vowel durationimproved vowel intelligibility (though not technicallyrequired in the absence of /9r/). Therefore, we used for-mant frequencies F1, F2, F3, and vowel duration as theoutput feature set in the present study. During synthesis(described in Section 3.5), these output features, togetherwith energy and pitch trajectories, completely specifiedhow to synthesize the vowel portion.
As for the input feature set, features in addition to F1and F2 may improve classification accuracy, but it isunclear which additional features should be used. To dis-cover an appropriate input feature set, given the specifictype and amount of available data, we considered a num-ber of different configurations, shown in Table 2. Insteadof studying all possible permutations of types of features,we selected configurations that systematically test the per-formance of individual features. In this table, configura-tions 1–2 and 5–6 compared simply taking the median ofthe formant trajectories (F1median, F2median, and F3med-
ian) with their respective stable points (F1stable, F2stable,and F3stable), where set 5–6 included F3 information. Con-figurations 3–4 and 7–8 added duration information. Con-figurations 9–20 were experiments designed to answer thequestion of whether the addition of contextual informationto the feature set improves performance. Specifically, con-figurations 9–12 added formant-slope information, whereF1slopeLeft was defined as the median of the first differenceof the F1 formant trajectory during the first and last 30%of the vowel region, and other slope parameters weredefined similarly. Configurations 13–16 expressed context
ion
dian
dian + duration+ duration+ duration + F1slopeLeft + F1slopeRight+ duration + F2slopeLeft + F2slopeRight+ duration + F1slopeLeft + F1slopeRight + F2slopeLeft + F2slopeRight+ duration + F2slopeRight
+ F2rms+ F2rms+ duration + F2rms
+ F2poly+ F2poly+ duration + F2poly+ duration + energy
er by the median of the trajectory of the center 60% of the vowel region, oregion duration. slopeLeft and slopeRight refer to the median first difference2rms refers to a 4-tuple of values calculated by the procedure described in
gree polynomial fitted to the F2 trajectory over the vowel region. Finally,

200 300 400 500 600 700 800 900 1000800
1000
1200
1400
1600
1800
2000
2200
2400
2600
i:
i:
i:i:i:
i:
i:
i:
i:i:
i:
i:
i:i:i:
i:
i: i:
i:
i: i:
i:
i: i:
i:
i:
i:
i:
i:
i:
i:
i:
i:
i:
i:i:i:i:
i:
II
I
I
I
I
I
I
II
II
III
I
II
I I
I
I
I
I
I
I
I
I
I
I
I
I
II
I
I
I
III
II
I E
E
E
E
E
E
E
EE
EE
EE
E
E
E
E
E
E
E
EE
E
EE
E
E
EE
EE
E
E
E E
E
E
E
@@@
@@
@
@
@@
@@
@
@
@
@@ @
@@@ @@@
@@
@
@
@@
@
@
@@@
@
@
@
@
u
u
uu
uuu
u
u
uuu
u
u
u
u u
u
u
u
u
uu
u
u
u
u
u
uU
UU
U
U
U
U
UU
UU
U
U U
UUU
UU
^
^
^
^
^
^^
^^
^^
^^^
^
^
^
^ ^
^
^
^
^
^
^
^^
^
^
^
^
^^
^
A
A
AA
A AA
A
A
AAAA
A
A
A
AA
AA
A
A
AA
A
A
A
A
AA
A
A
AA
A
A
A
A
A
A
F1 [Hz]
F2
[Hz]
200 300 400 500 600 700 800 900 1000800
1000
1200
1400
1600
1800
2000
2200
2400
2600
i:i:i:
i:
i:i:
i:i:i:i:
i:i:
i:i:i:
i:i:
i:i:i:
i: i:
i:
i:
i:i:
i: i:i:
i:
i:
i:i:
i:
i:
i:i: i:i:
III
I
I
I
I
I
I
I
II
II
I II
I
II
I
I
II I
I
I III
I I
I
I
II
I
I
I
I
I I
I
E
EE
E
E
E EE EE
E E
EE
EE
E
E
E
E
E
E E
EEE
EE
E
E EE
EEE
EE
E
@
@
@@
@@
@@
@@ @
@
@
@ @
@
@
@
@
@
@
@ @
@@
@
@
@
@@@
@@ @@
@
@
@
u
u
u
u
u
u
uuu
u
u
u
u
u
u
u
uu
u
u
uu
u
uu
u
u
u
uU
U
U
U
U
U
U
UUU
UU
UU
UU
U
U
U ^^
^^
^
^
^^
^^
^
^
^
^^
^
^
^
^
^^
^
^
^
^^ ^
^^
^
^^
^
AAAAA
AA
AA A
A
AA
AA
AAA
AAA
AAA A AA
A
A
AAA
AA AA
A
AA
A
F1 [Hz]
F2
[Hz]
a
b
Fig. 2. Scatter plots of the stable-point F1 and F2 values for all CVC utterances in the corpus, with the vowel identified by the corresponding vowelsymbol, for both the dysarthric (top panel) and non-dysarthric (bottom panel) speaker (color online). (a) Dysarthric speech and (b) non-dysarthric speech.
A.B. Kain et al. / Speech Communication 49 (2007) 743–759 749
by adding the F2 distances (called F2rms, a 4-dimensionalvector) of the vowel to the four template curves, asdescribed at the end of Section 3.3. Configurations 17–20included context by fitting a second-order polynomial tothe formant trajectory and adding the polynomial coeffi-cients as a 2-dimensional vector F2poly. Finally, configura-tion 21 added vowel energy to the best performingconfiguration from configurations 1–20, which was config-uration 8. The best performing set was selected by an objec-tive-evaluation criterion described in Section 3.4.3.
Having considered the types of features to be used asinput and output to the transformation function, we nowdiscuss the origin of the data itself. As input, we used the
training dataset of the dysarthric speaker, as described inSection 3.2. As for output targets, we used vowel-specific,context-independent target values; of these, the formantfrequency values were either generic or individual. The gen-eric values were derived from the average female values ofPeterson and Barney’s seminal work (Peterson and Barney,1952). Individual values were more difficult to determine,because the subject’s dysarthria often prevented intelligiblespeech. Individual values were derived from numerousrecordings made by the subject of the nine vowel-evokingwords in the vowel-target database (see Section 3.2.2). Sev-eral recordings of each word were listened to, in order tofind the most acceptable rendition. Formant targets were

750 A.B. Kain et al. / Speech Communication 49 (2007) 743–759
estimated from manual inspection of the spectrogram atthe center of the vowel of the selected recording. Then, aformant-synthesis program was used to synthesize vowelsfrom these estimated values. The formant frequency valueswere then iteratively modified, in small increments, accord-ing to the following three criteria: (1) no formant frequencywas changed more than 200 Hz from its original estimatedvalue, (2) formants were changed until each synthetic vowelwas considered a completely intelligible rendition of its tar-get vowel by two of the authors, and (3) as few formantchanges as possible were made when meeting the first twocriteria. Table 3 lists the specific formant frequency targetvalues. We note that estimating intelligible output targetsfrom dysarthric speech may not always be possible in thegeneral case.
For target values of vowel duration values, we consid-ered using the average non-dysarthric speaker vowel dura-tions directly, or these durations adjusted for the differencein speaking rate between the two speakers. The speaking-rate difference could be measured from the average ratioof (a) just the vowel durations, (b) all phone durations,or (c) whole word durations. Analysis of the corpusrevealed that all three of these ratios were close to 1.8,i.e. the dysarthric speaker spoke almost twice as slowly asthe non-dysarthric speaker. However, informal perceptualtests showed that preserving relative consonant-to-vowelduration ratios within a speaker did not contribute toimproved vowel intelligibility. Therefore, we chose touse the unadjusted, average normal vowel durations astargets.
There are two reasons why we used context-independentvowel-specific targets as compared to earlier work, whichused parallel recordings from a non-dysarthric speaker(Kain et al., 2004). First, there may be a formant mismatchbetween the targets of the dysarthric and the non-dysar-thric speaker. (In our corpus, we had available a femaledysarthric speaker and a male non-dysarthric speaker.)For example, a certain CVC combination with female con-sonants and a male vowel may lead to an abnormal F2 tra-jectory, not due to a discontinuity, but because of therelative differences between the consonant and vowel for-mant targets. However, even same-gender speakers may
Table 3Output target feature values
Vowel (word) F1 (Hz) F2 (Hz)
Generic Individual Generic
/i:/ (he) 310 300 2790/I/ (hit) 430 400 2480/E/ (heck) 610 600 2330/@/ (hack) 860 750 2050/u/ (who) 370 350 950/U/ (hook) 470 500 1160/^/ (huff) 760 700 1400/A/ (ha) 850 750 1220
Formant frequencies are available as generic and individual values. The formerwhile the latter were based on formant frequency values estimated from utter
not be well suited to each other. Second, we hypothesizethat it is not necessary to map stable-point variance (whichmay be due to lack of articulatory control or due to for-mant undershoot) within a vowel, but instead it is only nec-essary to predict the target directly. For the case ofvariance due to lack of control, it is beneficial to map tothe target values; in the case of undershoot, it is acceptable
to map to the target values. We hypothesize that preservingundershoot throughout the mapping does not aid inimproving intelligibility. Furthermore, it then also becomespossible to specify vowel-target values directly withoutrequiring several vowels in various CVC contexts to mea-sure the stable-point variance.
3.4.2. Training
The relationship between dysarthric speech features xand normal, or intelligible, speech features y varies depend-ing upon the speakers and is not known a priori. Therefore,we had to train a transformation function F by first estab-lishing a mathematical model of the relationship between xand y, and then estimating the parameters h of this modelfrom a training dataset such that FðxjhÞ is a good predic-tor of y.
The transformation function was implemented as a mix-ture of target vectors weighted by posterior probabilities ofa Gaussian Mixture Model (GMM). Specifically,
y ¼Fðxjt; hÞ ¼XQ
q¼1
tq � pðcqjx; hÞ ð1Þ
where tq is the qth target feature vector from a set of Q
target vectors and the term p(cqjx,h) denotes the GMMposterior probability that the input vector x belongs toclass cq, given by
pðcqjx; hÞ ¼aq �Nðx; lq;RqÞPQi¼1ai �Nðx; li;RiÞ
ð2Þ
with
Nðx; l;RÞ ¼ e�0:5ðx�lÞR�1ðx�lÞ
ð2pÞN=2ffiffiffiffiffiffiffiffiffiffiffiffiffiffidetðRÞ
p ð3Þ
F3 (Hz) Duration (ms)
Individual Generic Individual
2300 3310 2900 2121900 3070 2650 1381850 2990 2750 1671800 2850 2850 2571150 2670 2400 1791100 2680 2700 1201500 2780 2800 1501300 2810 2750 224
were taken from Peterson and Barney’s work (Peterson and Barney, 1952),ances in the speech corpus.
A.B. Kain et al. / Speech Communication 49 (2007) 743–759 751
Model parameters h = (a1. . .Q,l1. . . Q,R1. . .Q) were estimatedby supervised training (full covariances were used). Eachvowel was assigned exactly one component (Q = 8). Addi-tional experiments showed that using more components ledto deteriorating performance, due to the limited number ofdata points. Formant frequencies were converted fromHertz to the Bark scale, and duration values were givenin milliseconds.
An alternative to Eq. (1) would be to simply predict thetarget vector with the maximum posterior probability.However, unlike in speech recognition, we are not requiredto reduce acoustic input features to single symbols. Hence,we preferred to ‘‘pass on’’ any ambiguity in the classifica-tion of the input dysarthric speech to the transformedspeech, in order to maximize chances of the human listenerusing additional cues to disambiguate the dysarthric speak-er’s intent.
Eq. (1) is a variation of the transformation function usedin previous work (Kain et al., 2004). Previously, we hadmodeled the covariance of the joint normal and dysarthricspeech features, resulting in the ability to use a mixture oflinear transformations for prediction. In the currentapproach, however, we modeled only the source covari-ances, leading to a drastic reduction in the number ofmodel parameters. This change was made necessary byour decision to use vowel-specific targets for whichcovariance data were not available, instead of modelingthe distribution of the non-dysarthric speaker in the speechcorpus. (As mentioned in Section 3.4.1, we hypothesizethat the non-dysarthric speaker’s covariance does not needto be modeled for the goal of improving vowel intel-ligibility.)
2 3 48
9
10
11
12
13
14
15
i:
IE
uU
^
i:
I
u U
i:
I
u U
F1 [
F2
[bar
k]
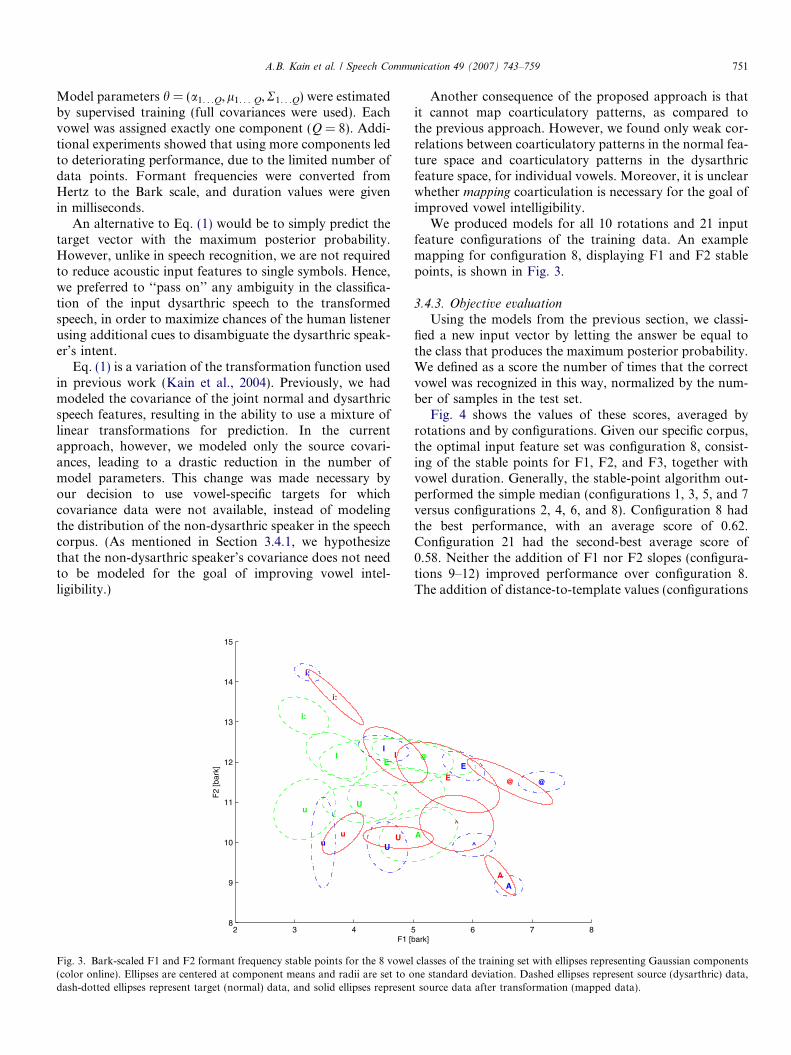
Fig. 3. Bark-scaled F1 and F2 formant frequency stable points for the 8 vowel(color online). Ellipses are centered at component means and radii are set to odash-dotted ellipses represent target (normal) data, and solid ellipses represen
Another consequence of the proposed approach is thatit cannot map coarticulatory patterns, as compared tothe previous approach. However, we found only weak cor-relations between coarticulatory patterns in the normal fea-ture space and coarticulatory patterns in the dysarthricfeature space, for individual vowels. Moreover, it is unclearwhether mapping coarticulation is necessary for the goal ofimproved vowel intelligibility.
We produced models for all 10 rotations and 21 inputfeature configurations of the training data. An examplemapping for configuration 8, displaying F1 and F2 stablepoints, is shown in Fig. 3.
3.4.3. Objective evaluation
Using the models from the previous section, we classi-fied a new input vector by letting the answer be equal tothe class that produces the maximum posterior probability.We defined as a score the number of times that the correctvowel was recognized in this way, normalized by the num-ber of samples in the test set.
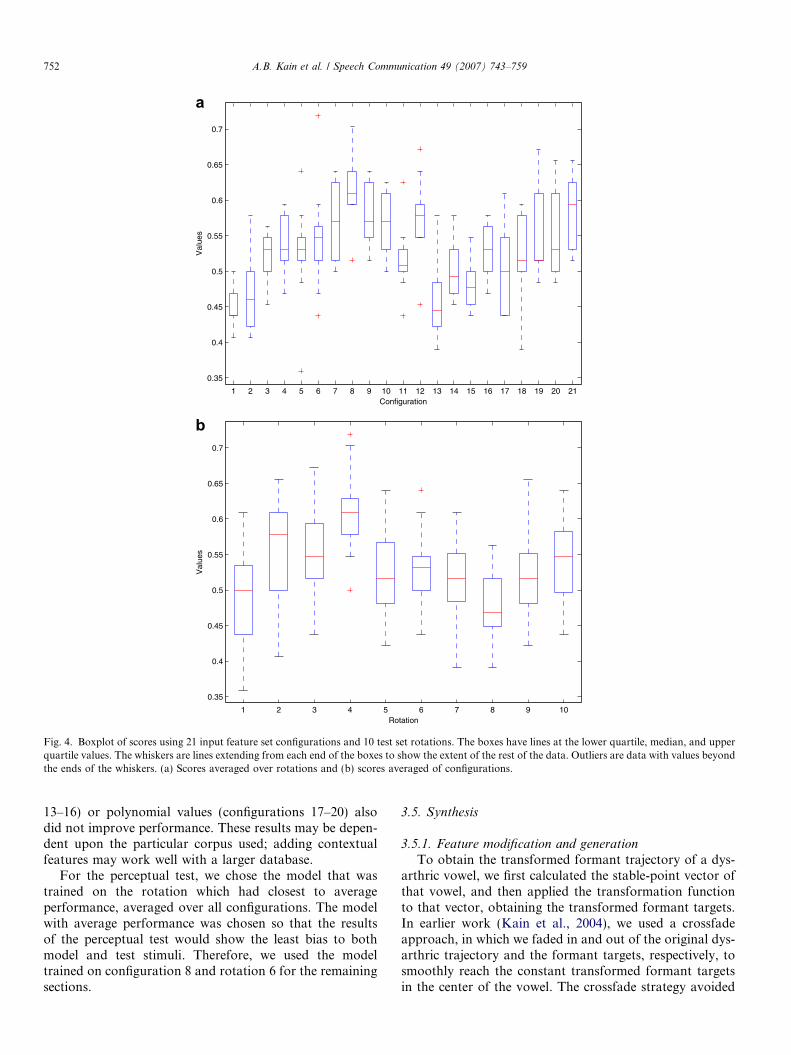
Fig. 4 shows the values of these scores, averaged byrotations and by configurations. Given our specific corpus,the optimal input feature set was configuration 8, consist-ing of the stable points for F1, F2, and F3, together withvowel duration. Generally, the stable-point algorithm out-performed the simple median (configurations 1, 3, 5, and 7versus configurations 2, 4, 6, and 8). Configuration 8 hadthe best performance, with an average score of 0.62.Configuration 21 had the second-best average score of0.58. Neither the addition of F1 nor F2 slopes (configura-tions 9–12) improved performance over configuration 8.The addition of distance-to-template values (configurations
5 6 7 8
@
A
E
@
^
A
E @
^
A
bark]
classes of the training set with ellipses representing Gaussian componentsne standard deviation. Dashed ellipses represent source (dysarthric) data,t source data after transformation (mapped data).
1 2 3 4 5 6 7 8 9 10 11 12 13 14 15 16 17 18 19 20 21
0.35
0.4
0.45
0.5
0.55
0.6
0.65
0.7
Val
ues
Configuration
1 2 3 4 5 6 7 8 9 10
0.35
0.4
0.45
0.5
0.55
0.6
0.65
0.7
Val
ues
Rotation
a
b
Fig. 4. Boxplot of scores using 21 input feature set configurations and 10 test set rotations. The boxes have lines at the lower quartile, median, and upperquartile values. The whiskers are lines extending from each end of the boxes to show the extent of the rest of the data. Outliers are data with values beyondthe ends of the whiskers. (a) Scores averaged over rotations and (b) scores averaged of configurations.
752 A.B. Kain et al. / Speech Communication 49 (2007) 743–759
13–16) or polynomial values (configurations 17–20) alsodid not improve performance. These results may be depen-dent upon the particular corpus used; adding contextualfeatures may work well with a larger database.
For the perceptual test, we chose the model that wastrained on the rotation which had closest to averageperformance, averaged over all configurations. The modelwith average performance was chosen so that the resultsof the perceptual test would show the least bias to bothmodel and test stimuli. Therefore, we used the modeltrained on configuration 8 and rotation 6 for the remainingsections.
3.5. Synthesis
3.5.1. Feature modification and generation
To obtain the transformed formant trajectory of a dys-arthric vowel, we first calculated the stable-point vector ofthat vowel, and then applied the transformation functionto that vector, obtaining the transformed formant targets.In earlier work (Kain et al., 2004), we used a crossfadeapproach, in which we faded in and out of the original dys-arthric trajectory and the formant targets, respectively, tosmoothly reach the constant transformed formant targetsin the center of the vowel. The crossfade strategy avoided
C C
time
F1
dysarthric trajectorytarget trajectorycrossfaded trajectory
V
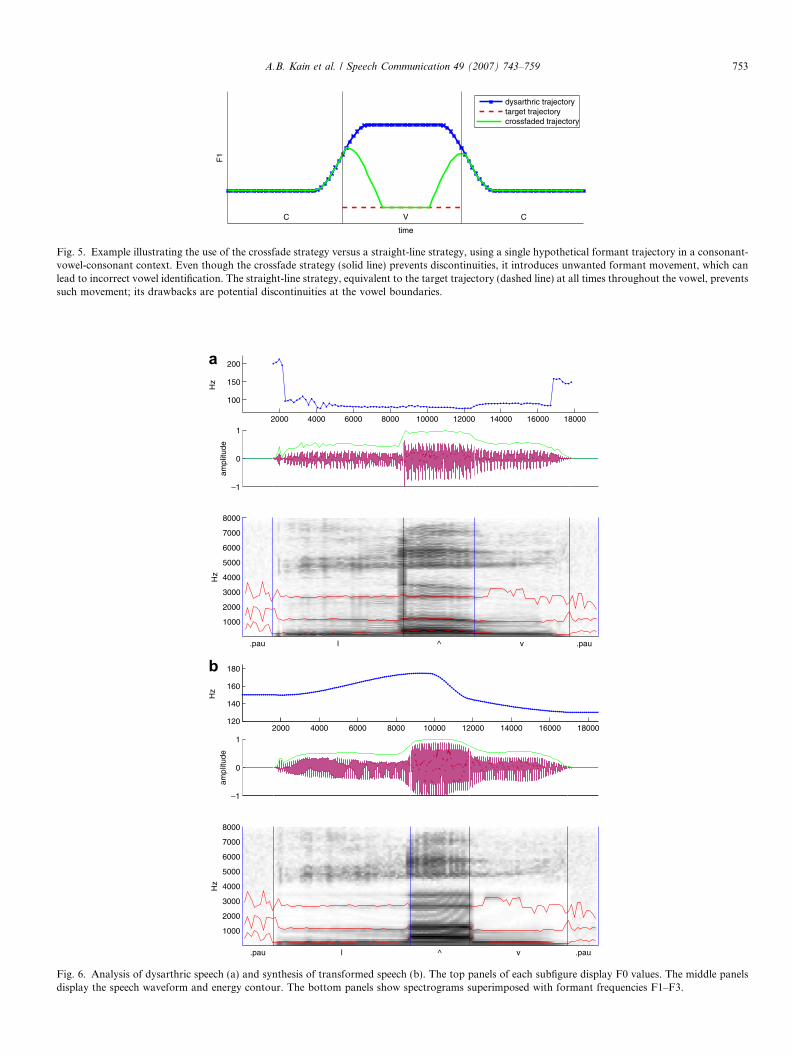
Fig. 5. Example illustrating the use of the crossfade strategy versus a straight-line strategy, using a single hypothetical formant trajectory in a consonant-vowel-consonant context. Even though the crossfade strategy (solid line) prevents discontinuities, it introduces unwanted formant movement, which canlead to incorrect vowel identification. The straight-line strategy, equivalent to the target trajectory (dashed line) at all times throughout the vowel, preventssuch movement; its drawbacks are potential discontinuities at the vowel boundaries.
2000 4000 6000 8000 10000 12000 14000 16000 18000
100
150
200
Hz
–1
0
1
ampl
itude
.pau l ^ v .pau
1000
2000
3000
4000
5000
6000
7000
8000
Hz
2000 4000 6000 8000 10000 12000 14000 16000 18000120
140
160
180
Hz
–1
0
1
ampl
itude
.pau l ^ v .pau
1000
2000
3000
4000
5000
6000
7000
8000
Hz
a
b
Fig. 6. Analysis of dysarthric speech (a) and synthesis of transformed speech (b). The top panels of each subfigure display F0 values. The middle panelsdisplay the speech waveform and energy contour. The bottom panels show spectrograms superimposed with formant frequencies F1–F3.
A.B. Kain et al. / Speech Communication 49 (2007) 743–759 753

754 A.B. Kain et al. / Speech Communication 49 (2007) 743–759
formant trajectory discontinuities that may occur due toformant modification taking places in the vowel regiononly, even though all voiced regions were re-synthesized.However, in subsequent experiments we found that thisapproach could lead to perceptually detrimental formantmovements, which ultimately could lead to incorrect vowelidentification, as illustrated by Fig. 5. The formantmovement was caused by dysarthric formant frequencyvalues at the vowel boundaries, but normal formant fre-quency values at the center of the vowel. Therefore, wereverted to a simpler, straight-line trajectory model, whichused only the constant transformed formant frequencyvalues throughout the duration of the vowel. Despitepotentially large discontinuities in the formant trajectoriesat vowel boundaries, this very simple model was judgedadequate for the task based on informal perceptual testsFig. 6.
To generate the F0 contour, we used a superpositionalmodel (van Santen and Mobius, 2000), in which we consid-ered the first third of the vowel duration in the CVC con-text as the center of the peak location of a single accentcurve, superimposed on a simple descending phrase curve.Energy modification was performed by median filteringand subsequently smoothing the dysarthric energy trajec-tory with a zero-phase finite impulse response filter, usinga normalized Hanning window as coefficients.
3.5.2. Formant synthesis
Synthesis was performed in a pitch-synchronous, over-lap-add framework, using an asymmetrical trapezoidalwindow spanning two pitch periods. First, synthetic speechwaveforms were created using residual-excited all-pole fil-ters estimated by high-order linear prediction. Then, thesignal in voiced regions from 0 to 4 kHz was replaced witha formant-synthesized signal. Higher frequencies (4–8 kHz)in the voiced regions were left unmodified. This frameworkallowed for high-quality energy, pitch and duration modi-fications, while still allowing complete control over thelower formant frequencies and bandwidths.
During formant synthesis, the waveform was generatedby a simple formant synthesizer, similar to implementa-tions by Klatt (1987). Open quotient (OQ) and spectral tilt(TL) parameters of the Klatt glottal source model werechosen manually (OQ = 0.6 and TL = 0.8), and were fixed
Table 4Stimulus conditions and their associated configurations
Stimulus condition Duration Pitch E
A – dysarthric dysarthric dysarthric dyB – dysarthric-map-generic mapping synthetic smC – dysarthric-map-individual mapping synthetic smD – dysarthric-oracle-generic oracle synthetic smE – dysarthric-oracle-individual oracle synthetic smF – normal-synth-individual normal synthetic smG – normal-synth-contextdependent normal synthetic smH – normal normal normal no
for all utterances. For each speech frame, we produced twoperiods of excitation using the synthetic F0 values.
During voiced consonants, the original formant infor-mation was used. In the region of the transformed vowel,the formant frequency values of the transformed formantsF1–F3, together with fixed F4–F8 values (at 3500, 4500,5500, and 6500 Hz), were used to calculate filter parametersfor an all-pole filter. Bandwidths B1–B8 were fixed at 100,100, 150, 150, 150, 550, 950, and 950 Hertz, respectively.Finally, the excitation signal was filtered using the resultingformant filter, and the resulting frame energy was adjustedto match the specified desired energy.
4. Evaluation
4.1. Stimuli
Of the 10 rotations of training and testing partitions ofthe CVC database (Section 3.2.1), we chose one rotationfor evaluation of intelligibility by perceptual testing. Inorder to obtain a fair representation of the data, weselected the rotation with the average performance on theobjective evaluation. This decision was made under theassumption that the rotation with best objective-evaluationperformance had, by chance, a particularly good selectionof CVCs for training and testing, and that the rotation withthe worst objective-evaluation performance had, bychance, a particularly poor selection of CVCs for trainingand testing. The training partition of the selected rotationwas used to train the mapping function, and the testingpartition was used to perform mapping and generate CVCsfor perceptual evaluation.
The 64 testing CVCs were presented to listeners in eightconditions. These conditions are listed in Table 4. (Theordering of conditions in the table is based on expectedintelligibility levels; the order of discussion here is slightlydifferent, in order of ease of explanation.) The dysarthriccondition (condition A) was the original recording fromthe dysarthric speaker. This condition was tested in orderto determine the intelligibility of this speaker on thesematerial. Intelligibility significantly below 100% wasexpected. The normal condition (condition H) was the ori-ginal recording from the non-dysarthric speaker. Thiscondition was tested in order to determine the intelligibility
nergy Unvoiced Voiced Formants
sarthric dysarthric dysarthric n/aoothed dysarthric synthetic map-gen.oothed dysarthric synthetic map-ind.oothed dysarthric synthetic oracle-genericoothed dysarthric synthetic oracle-individualoothed normal synthetic normal-individualoothed normal synthetic normal-contextdependentrmal normal normal n/a
A.B. Kain et al. / Speech Communication 49 (2007) 743–759 755
of this speaker on these material; intelligibility close to100% was expected.
The normal-synth-contextdependent condition (conditionG) was an analysis and re-synthesis of the CVC from thenon-dysarthric speaker, with formant frequency valuesbased on the vowel in its particular CVC context. (Re-synthesis involved a number of simplifications from theoriginal recording, including synthetic pitch-contour gener-ation, synthetic energy-contour generation, and formantsynthesis using a flat formant trajectory throughout thevowel.) Intelligibility somewhat worse than condition Hwas expected. The normal-synth-individual condition (con-dition F) was an analysis and re-synthesis of the CVC fromthe non-dysarthric speaker. In this case, formant frequencyvalues were set to those of the individual speaker, but werebased only on the vowel identity, not on the vowel’s con-text. The formant frequency values for each vowel in thiscondition were computed using the interactive proceduredescribed in Section 3.4.1. We expected intelligibility tobe somewhat worse than in condition G.
The dysarthric-oracle-individual condition (condition E)was an analysis and re-synthesis of the CVC from the dys-arthric speaker. In this case, the formant frequency valuesused in synthesis were the mapping function’s target values(the normal speaker’s formants for the given vowel), repre-senting the outcome of a hypothetical perfect mapping.(The term ‘‘oracle’’ indicates a mapping function that hasaccess to knowledge that would not be present in a normaltest condition.) Similar to condition F, the target formantfrequency values were the individual formant frequency val-ues. We expected intelligibility to be much better than con-dition A (as a result of using formant frequencies known toyield perception of the correct vowel in isolation), butworse than condition F (because consonant regions weresynthetic copies of the dysarthric speech, and vowel iden-tity may depend in part on information in the consonantregions). The dysarthric-oracle-generic condition (conditionD) was identical with condition E, except that the targetformant frequencies were the generic values, as describedin Section 3.4.2. We expected intelligibility to be close tothat of condition E.
The dysarthric-map-individual condition (condition C)was an analysis and re-synthesis of the CVC from the dys-arthric speaker, but using the results from the mappingfunction (vowel identity was not used to compute outputformant frequencies), and with the individual formant fre-quencies as targets learned during mapping. This conditionrepresented a true test of the ability to improve the intelli-gibility of dysarthric speech. We expected intelligibility tobe better than intelligibility of condition A (due to the map-ping of the vowel space), but worse than condition E(because the mapping function does not always yield theideal target values on test data). Finally, the dysarthric-
map-generic condition (condition B) was identical withcondition C, except that the target formant values learnedby the mapping function were the generic formants. Thiscondition was also a true test of the ability to improve
intelligibility. We expected the intelligibility level to beclose to that of condition C, but because we could notsafely predict whether B or C should yield better results,both conditions were used in testing.
The comparison of conditions A and B, and the compar-ison of conditions A and C, tests the effectiveness of theproposed transformation method. Comparing conditionsB and D, and comparing conditions C and E, tests theeffectiveness of the mapping function. (The mapping func-tion was not expected to be perfect, due to one-to-manymappings inherent in expanding the vowel space, thelimited amount of training data, and simple (and probablyincomplete) feature representations.) Comparing condi-tions B and C, and comparing conditions D and E, teststhe utility of speaker-independent formant targets againstspeaker-dependent formant targets. Comparing conditionsE and F tests the contribution of consonant regions tovowel identity. Comparing conditions F and G tests theimportance of maintaining context-dependent units in this(flat-trajectory) synthesis framework, and comparingconditions G and H tests the quality of the flat-trajectoryformant synthesis, pitch generation, and energy generation.
4.2. Test administration
With 64 CVCs in eight conditions, a total of 512 uniquestimuli were available for evaluation. Evaluation was con-ducted by 24 listeners, each of whom evaluated 128 stimuli.Each of the 512 stimuli were evaluated six times, by adifferent listener each time. Each listener heard all CVCstwice, with the two presentations of a CVC in different con-ditions each time. (Subsequent analysis of results showedthat performance on a CVC did not, on average, improveon the second presentation of that CVC, and so learningeffects were minimal.) The order of presentation of theCVCs was randomized, but all listeners heard the CVCsin the same (random) ordering, to normalize the effect ofthe order of CVC presentation on different listeners.
We developed a perceptual test for vowels based on theprocedures described by Kent et al. (1989). Listeners hearda stimulus and indicated the identity of the vowel that theyperceived. The intelligibility was computed as the numberof correctly perceived vowels divided by the total numberof vowels. Listening tests were conducted over speakersin a quiet, but not sound-isolated, room, in order to bettermatch the test conditions with an expected real-world con-dition of transformed speech played over speakers. Listen-ers reported normal hearing, were native speakers ofAmerican English, and had no clinical or research experi-ence with dysarthria. Listeners were paid for theirparticipation.
Testing was conducted using a graphical user interfacedesigned for this experiment. After reading instructionspresented on a screen and entering a listener ID number,the listener was guided through three familiarizationstages. In the first stage, a fixed set of eight words weredisplayed on the screen. Each single-syllable word was
756 A.B. Kain et al. / Speech Communication 49 (2007) 743–759
pronounced with one of the eight vowels used in this study,namely ‘‘heed’’ (for /i:/), ‘‘hid’’ (for /I/), ‘‘heck’’ (for /E/),‘‘had’’ (for /@/), ‘‘who’’ (for /u/), ‘‘hook’’ (for /U/),‘‘hut’’ (for /^/), and ‘‘hot’’ (for /A/). Clicking on a wordcaused the vowel associated with that word to be playedover the speakers. Listeners were encouraged to familiarizethemselves with the words and associated vowel sounds,and each word had to be clicked on at least once beforeproceeding to the second stage. In the second stage, the lis-tener went through a process similar to the actual test. Thelistener heard a CVC ‘‘word,’’ and had to select the wordon the screen with the vowel most similar to the word thatthey heard. At this stage, all words were spoken by thenon-dysarthric speaker, JH. This stage familiarized the lis-tener with the format of the test, while providing relativelyeasy tasks. After identifying 10 of these stimuli, the userproceeded to the third stage of familiarization. The thirdstage was identical to the second stage, except that therewere six samples from the dysarthric speaker, DC. Oneof these samples was simply a CVC recording; othersamples were synthetic CVCs similar to the stimuli in thetest. This stage familiarized the listener with the type ofstimuli that would be heard during the actual test. Aftercompleting the three familiarization stages, the listenerevaluated the 128 test stimuli. Recorded informationincluded the correct (intended) vowel identity, the per-ceived vowel identity, the stimulus condition, and the timerequired to provide a response. (The time information,however, was not used in the final evaluation.)
Based on our previous perceptual tests using these CVCstimuli, we expected intelligibility of the normal conditionto be close to 100%. If a listener scored dramatically lowerthan expected, this was considered evidence that thelistener either had an unreported hearing problem, or thatthe listener had difficulty performing the conceptual map-ping from heard CVC (e.g. ‘‘push’’) to the word on thescreen with the most similar vowel (e.g. ‘‘hook’’). Neitherof these conditions were considered relevant to the goalof evaluating vowel intelligibility, and so we set a thresholdof at least 90% reported intelligibility on the normal condi-tion for each listener. We conducted testing until 24 listen-ers passed this threshold of acceptance, eliminating 9listeners in the process.
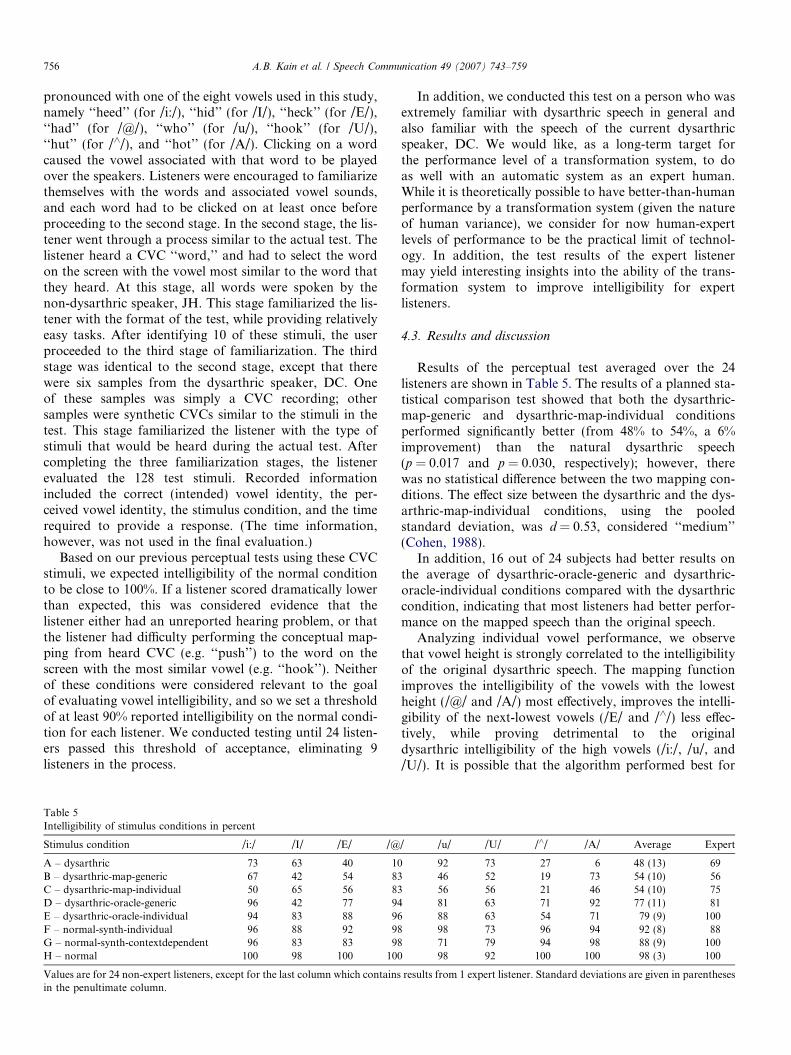
Table 5Intelligibility of stimulus conditions in percent
Stimulus condition /i:/ /I/ /E/ /@
A – dysarthric 73 63 40 10B – dysarthric-map-generic 67 42 54 83C – dysarthric-map-individual 50 65 56 83D – dysarthric-oracle-generic 96 42 77 94E – dysarthric-oracle-individual 94 83 88 96F – normal-synth-individual 96 88 92 98G – normal-synth-contextdependent 96 83 83 98H – normal 100 98 100 100
Values are for 24 non-expert listeners, except for the last column which containsin the penultimate column.
In addition, we conducted this test on a person who wasextremely familiar with dysarthric speech in general andalso familiar with the speech of the current dysarthricspeaker, DC. We would like, as a long-term target forthe performance level of a transformation system, to doas well with an automatic system as an expert human.While it is theoretically possible to have better-than-humanperformance by a transformation system (given the natureof human variance), we consider for now human-expertlevels of performance to be the practical limit of technol-ogy. In addition, the test results of the expert listenermay yield interesting insights into the ability of the trans-formation system to improve intelligibility for expertlisteners.
4.3. Results and discussion
Results of the perceptual test averaged over the 24listeners are shown in Table 5. The results of a planned sta-tistical comparison test showed that both the dysarthric-map-generic and dysarthric-map-individual conditionsperformed significantly better (from 48% to 54%, a 6%improvement) than the natural dysarthric speech(p = 0.017 and p = 0.030, respectively); however, therewas no statistical difference between the two mapping con-ditions. The effect size between the dysarthric and the dys-arthric-map-individual conditions, using the pooledstandard deviation, was d = 0.53, considered ‘‘medium’’(Cohen, 1988).
In addition, 16 out of 24 subjects had better results onthe average of dysarthric-oracle-generic and dysarthric-oracle-individual conditions compared with the dysarthriccondition, indicating that most listeners had better perfor-mance on the mapped speech than the original speech.
Analyzing individual vowel performance, we observethat vowel height is strongly correlated to the intelligibilityof the original dysarthric speech. The mapping functionimproves the intelligibility of the vowels with the lowestheight (/@/ and /A/) most effectively, improves the intelli-gibility of the next-lowest vowels (/E/ and /^/) less effec-tively, while proving detrimental to the originaldysarthric intelligibility of the high vowels (/i:/, /u/, and/U/). It is possible that the algorithm performed best for
/ /u/ /U/ /^/ /A/ Average Expert
92 73 27 6 48 (13) 6946 52 19 73 54 (10) 5656 56 21 46 54 (10) 7581 63 71 92 77 (11) 8188 63 54 71 79 (9) 10098 73 96 94 92 (8) 8871 79 94 98 88 (9) 10098 92 100 100 98 (3) 100
results from 1 expert listener. Standard deviations are given in parentheses

A.B. Kain et al. / Speech Communication 49 (2007) 743–759 757
low vowels because the separation between F0 and F1 ismaximal; another possibility is that performance was bestfor low vowels because of the greater overlap between vow-els along the F1 dimension, compared with the F2 dimen-sion, for the dysarthric speaker. If one could detect andexclude high vowels from processing and only transformmedial and low vowels, the rate of intelligibility wouldincrease to about 63%, for a 15% improvement.
Tables 6(a) through (d) show confusion matrices for thedysarthric, dysarthric-map-individual, dysarthric-oracle-individual, and normal-synth-individual conditions. Study-ing the first confusion matrix, we observe that most errorsare made in judging the height and the duration of thevowel, for example responding /I/ for a given /E/ andresponding /^/ for a given /A/, respectively. Typically, lis-teners judged the height of the vowel as too high. Less con-fusion occurred with regard to the backness of the vowel.The next confusion matrix in Table 6 reflects the changesthat occurred after applying the transformation to the
Table 6Confusion matrix for selected conditions. Target and response vowels aregiven in the first column and the first row, respectively
Vowel /i:/ /I/ /E/ /@/ /u/ /U/ /^/ /A/
(a) Condition A – dysarthric
/i:/ 35 7 2 0 2 2 0 0/I/ 2 30 4 0 7 4 1 0/E/ 0 18 19 1 1 4 5 0/@/ 0 13 22 5 0 4 4 0/u/ 0 0 0 0 44 3 1 0/U/ 0 2 0 0 10 35 1 0/^/ 0 8 7 0 7 11 13 2/A/ 0 1 0 1 1 14 28 3
(b) Condition C – dysarthric-map-individual
/i:/ 24 13 2 1 1 1 6 0/I/ 7 31 8 0 2 0 0 0/E/ 0 8 27 11 0 0 2 0/@/ 0 0 8 40 0 0 0 0/u/ 0 0 0 0 27 15 6 0/U/ 0 0 1 2 7 27 11 0/^/ 0 13 15 3 0 0 10 7/A/ 0 0 0 3 0 3 20 22
(c) Condition E – dysarthric-oracle-individual
/i:/ 45 2 0 0 1 0 0 0/I/ 2 40 3 0 0 2 1 0/E/ 0 1 42 3 0 0 2 0/@/ 0 0 2 46 0 0 0 0/u/ 0 0 0 0 42 6 0 0/U/ 0 0 0 0 1 30 17 0/^/ 0 0 6 16 0 0 26 0/A/ 0 0 0 7 0 0 7 34
(d) Condition F – normal-synth-individual
/i:/ 46 2 0 0 0 0 0 0/I/ 3 42 3 0 0 0 0 0/E/ 0 0 44 4 0 0 0 0/@/ 0 0 0 47 1 0 0 0/u/ 0 0 0 0 47 1 0 0/U/ 0 0 0 0 3 35 10 0/^/ 0 0 0 0 0 0 46 2/A/ 0 0 0 2 0 0 1 45
dysarthric speech. We observe that the front vowels arenow less likely to be confused with the back vowels, andvice versa, with the exception of the vowel /^/. Addition-ally, the mapping ‘‘adjusted’’ the height of the vowels sothat listeners are now less likely to judge vowels as toohigh, at the expense of judging vowels too low more oftenthan before. Similar observations can be made in the caseof the dysarthric-oracle-individual and normal-synth-indi-vidual condition results displayed in Tables 6(c) and (d).
Most of our expectations of relative intelligibility(Section 4.1) were met. In particular, dysarthria-map-gen-eric and dysarthria-map-individual were both better thanthe dysarthria condition, the dysarthria-oracle conditionshad greater intelligibility than the dysarthria-map condi-tions, the dysarthria-map conditions had lower intelligibil-ity than the normal-synth conditions, and the normal-synthconditions had lower intelligibility than the normal condi-tion. One exception to our expected performance was thatthe normal-synth-individual condition had greater intelligi-bility than the normal-synth-contextdependent condition;however, the difference in intelligibility was not statisticallysignificant.
In summary, testing showed that the proposed mappingmethod is statistically significantly more intelligible thanthe original dysarthric speech for this dysarthric speaker.However, the transformation function does not yieldnearly the same intelligibility levels as the oracle condition,indicating that the mapping is quite imperfect. The use ofspeaker-independent targets or speaker-dependent targetshad, for the average listener, no effect on intelligibility.The large difference in intelligibility between the dysar-thria-oracle conditions and the normal-synth-individualconditions indicates that a large amount of informationabout the vowel identity is located in the consonant regionsof the CVCs, as the only difference between these condi-tions was in those regions. This is consistent with manyprevious studies on the importance of consonants on vowelclassification (Strange et al., 1976). The use of context-dependent vowel targets had no significant impact, com-pared with context-independent vowel targets. The synthe-sis framework, including the flat-trajectory model andother simplifications, caused a dramatic decrease in intelli-gibility, from 98% to approximately 90%.
Conditions B–E represent changes to a number ofacoustic features simultaneously, including F0, vowelduration, source characteristics, formant frequencies, andformant bandwidths. Therefore, our results report on thecombined effect only; the individual contribution of eachmodification to improved intelligibility is unknown.
The results for the single expert listener illustrate a num-ber of interesting points. First, the proposed method doesnot yield intelligibility results for the average listener thatare as good as intelligibility of the original speech heardby the expert listener. However, the transformation system,when used with the individual’s formant targets, did improveintelligibility even for the expert listener (from 69% to75%). When the transformation system was used with

758 A.B. Kain et al. / Speech Communication 49 (2007) 743–759
generic formant targets, however, intelligibility for thisexpert listener decreased below the intelligibility level ofthe original speech. It is unclear whether this difference inperformance from individual targets and generic targets isdue to familiarity of the expert listener with the dysarthricspeaker’s voice, larger concatenation errors between voweland consonant for the generic formant targets, or someother factor(s). A similar pattern is seen in the oracle con-dition; the generic formant targets yield intelligibility of81%, while the individual formant targets yield vowel intel-ligibility of 100%, which is even greater than the intelligibil-ity of the normal-synth-individual condition (88%). Thisparticular expert listener appears to utilize context-depen-dent vowel information, as her normal-synth-individualresult was 88%, but her normal-synth-contextdependentresult was 100%. In general, this listener seems to listento the entire CVC in order to determine the vowel identity,even more so than the average listener. It is unfortunatethat more such expert listeners were not available to us,which prevents any claims of statistical significance frombeing made.
5. Conclusion
In this study, we have significantly improved theintelligibility of dysarthric vowels from 48% to 54%, asevaluated by a vowel identification task using 64 CVCstimuli judged by 24 listeners. The optimal mapping featureset from a list of 21-candidate feature sets proved to be oneutilizing vowel duration and F1–F3 stable points, whichwere calculated using shape-constrained isotonic regres-sion. The choice of speaker-specific or speaker-independentvowel formant targets appeared to be insignificant. Weak-nesses in the transformation function were obviatedthrough comparisons with ‘‘oracle’’ conditions. Also, thesynthesis-framework itself has been shown to have a nega-tive impact on intelligibility. The authors would like tostress that the results in this paper are highly preliminary,as they pertain only to a single person with dysarthriaand cannot be generalized to dysarthric speech in general.Even when categorized as having the same type of dysar-thria, speakers are enormously variable in their speechcharacteristics. Other speakers may have worse or betterlevels of improvement. Moreover, the effect size was merelymedium.
To extend our work to sentence-level processing, addi-tional challenges must be met. Firstly, a consonant-vowelboundary detector must be implemented that yields satis-factory results on dysarthric speech. Secondly, additionalconsideration must be given to diphthongs, which consistof more than a single stable point. Finally, F0 predictionwill be more complex, and potentially semantically mean-ingless, although the dysarthric speech energy trajectorymay be used for cues about word emphasis and syllablestress. Even with these additions, such an algorithm wouldbe relatively ‘‘light-weight’’ and executable in real-time ona wearable computer.
Possible avenues to further increase intelligibilityinclude:
• Instead of using formant stable points as transformationfeatures, the mapping function may benefit from usingformant frequency values that have been ‘‘de-coarticu-lated’’ from their surrounding environment, using anapproach similar to that taken by Niu and van Santen(2003).
• It has been shown that even just two formant frequencytargets (at 20% and 80%) perform better than flat for-mant frequency trajectories (Hillenbrand and Nearey,1999). Therefore, a more sophisticated formant trajec-tory model is likely to improve the intelligibility ofdysarthric speech.
• In the case of using generic formant target values, it maybe better to choose a naturally large vowel space(Bradlow et al., 1996) to maximize the acoustic distancebetween vowels.
• In previous experiments (Hosom et al., 2003), we haveshown that consonants contribute greatly to improvedoverall intelligibility. Moreover, consonants also con-tribute specifically to vowel intelligibility, as demon-strated by our current results. Therefore, work ontransforming consonants is likely to bring improvementsto overall intelligibility. However, variability in dysar-thric consonants forms a significant hurdle.
• Additional non-acoustic inputs describing the speechproduction state may aid in transformation accuracy.We are currently experimenting with a non-invasivedevice that can give reliable information about thestatus of the velopharyngeal port (Niu et al., 2006).
• A highly intelligible, but much more error-proneapproach consists of coupling a speech recognizer witha Text-to-Speech system, functioning as a ‘‘language-interpreter’’ device. Some research studying dysarthricspeech recognition has already been carried out (Ferrieret al., 1995).
Acknowledgements
This research was conducted with support from NSFGrant 0117911 ‘‘Making Dysarthric Speech Intelligible’’.Oregon Health & Science University (OHSU), Dr. Kain,Dr. Hosom, and Dr. Jan van Santen have a significantfinancial interest in BioSpeech, Inc., a company that mayhave a commercial interest in the results of this researchand technology. This potential conflict was reviewed anda management plan approved by the OHSU Conflict ofInterest in Research Committee and the Integrity ProgramOversight Council was implemented.
References
Barlow, R.E., Barholomew, D.J., Bremner, J.M., Brunk, H.D., 1980.Statistical Inference under Order Restrictions. Wiley, Chichester.

A.B. Kain et al. / Speech Communication 49 (2007) 743–759 759
Beukelman, D.R., Mirenda, P., 2005. Augmentative and AlternativeCommunication Management of Severe Communication Disorders inChildren and Adults, third ed. Paul H. Brookes, Baltimore, MD.
Bradlow, A.R., Toretta, G.M., Pisoni, D.B., 1996. Intelligibility of normalspeech: Global and fine-grained acoustic–phonetic talker characteris-tics. Speech Comm. 20, 255–272.
Carnegie Mellon University, 2004. The CMU Pronouncing Dictionaryv0.6. <http://www.speech.cs.cmu.edu>.
Cohen, J., 1988. Statistical Power Analysis for the Behavioral Sciences,second ed. Lawrence Earlbaum Associates, Hillsdale, NJ.
Darley, F., Aronson, A., Brown, J., 1969. Differential diagnostic patternsof dysarthria. J. Speech Hearing Res. 12 (2), 246–269.
Di Benedetto, M.-G., 1989. Vowel representation: Some observations ontemporal and spectral properties of the first formant frequency. J.Acoust. Soc. Amer. 86 (1), 55–66.
Drager, K., Hustad, K., Gable, K., 2004. Telephone communication:Synthetic and dysarthric speech intelligibility and listener preferences.Augment. Alternat. Comm. 20 (2), 103–112.
Duffy, J., 2005. Motor Speech Disorders: Substrates, Differential Diag-nosis and Management, second ed. Mosby, St. Louis, MO.
Electronic Speech Enhancement Inc., The Speech Enhancer. <http://www.speechenhancer.com>.
Ferrier, L., Shane, H., Ballard, H., Carpenter, T., Benoit, A., 1995.Dysarthric speakers’ intelligibility and speech characteristics in relationto computer speech recognition. Augment. Alternat. Comm. 11 (3),165–175.
Harteliusa, L., Runmarkerb, B., Andersenb, O., 2000. Prevalence andcharacteristics of dysarthria in a multiple-sclerosis incidence cohort:Relation to neurological data. Int. J. Phoniatrics Speech TherapyComm. Pathol. 52 (4), 160–177.
Hieronymus, J.L., ASCII Phonetic Symbols for the World’s Languages:Worldbet, Bell Labs Technical Memorandum.
Hillenbrand, J.M., Nearey, T.M., 1999. Identification of resynthesized /hVd/ utterances: Effects of formant contour. J. Acoust. Soc. Amer. 105(6), 3509–3523.
Hosom, J.P., Kain, A.B., Mishra, T., van Santen, J.P.H., Fried-Oken, M.,Staehely, J., 2003. Intelligibility of modifications to dysarthric speech.In: Proc. of ICASSP, pp. 878–881.
Kain, A.B., Niu, X., Hosom, J., Miao, J. van Santen, 2004. Formant re-synthesis of dysarthric speech. In: IEEE Workshop on SpeechSynthesis, Pittsburgh, PA, pp. 25–30.
Kent, R.D., Weismer, G., Kent, J.F., Rosenbek, J.C., 1989. Towardphonetic intelligibility testing in dysarthria. J. Speech Hearing Disor-ders 54, 482–499.
Kent, R.D., Kent, J.F., Weismer, G., Sufit, R.L., Rosenbek, J.C., Martin,R.E., Brooks, B.R., 1990. Impairment of speech intelligibility in menwith amyotrophic lateral sclerosis. J. Speech Hearing Disorders 55 (4),721–728.
Klatt, D., 1987. Review of text-to-speech conversion for English. J.Acoust. Soc. Amer. 82 (3), 737–793.
Lindblom, B., 1963. Spectrographic study of vowel reduction. J. Acoust.Soc. Amer. 35 (11), 1773–1781.
Maassen, B., Povel, D.J., 1984. The effect of correcting fundamentalfrequency on the intelligibility of deaf speech and its interaction withtemporal aspects. J. Acoust. Soc. Amer. 76 (6), 1673–1681.
Maassen, B., Povel, D.J., 1985. The effect of segmental and suprasegmen-tal corrections on the intelligibility of deaf speech. J. Acoust. Soc.Amer. 78 (3), 877–886.
Menendez-Pidal, X., Polikoff, J.B., Peters, S.M., Leonzio, J.E., Bunnell,H., 1996. The nemours database of dysarthric speech. In: Proc. ofICSLP, Philadelphia, PA, vol. 3, pp. 1962–1965.
Niu, X., van Santen, J.P.H., 2003. A formant-trajectory model andits usage in comparing coarticulatory effects in dysarthric andnormal speech. In: Models and Analysis of Vocal Emissions forBiomedical Applications (MAVEBA), 3rd Internat. Workshop,pp. 233–236.
Peterson, G.E., Barney, H.L., 1952. Control methods used in a study ofthe vowels. J. Acoust. Soc. Amer. 24 (2), 175–184.
Prentke Romich Company, The Pathfinder Communications Device.<http://www.prentrom.com>.
Qi, Y., Weinberg, B., Bi, N., 1995. Enhancement of female esophageal andtracheoesophageal speech. J. Acoust. Soc. Amer. 98 (5), 2461–2465.
Semantic Compaction Systems, The Minspeak Language RepresentationTechnique. <http://www.minspeak.com>.
Shuster, L.I., 1996. Linear predictive coding parameter manipulation/synthesis of incorrectly produced /r/. J. Speech Hearing Res. 39 (4),827–832.
Stevens, K.N., House, A.S., 1963. Perturbation of vowel articulations byconsonantal context: An acoustical study. J. Speech Hearing Res. 6 (2),111–128.
Strange, W., Shankweiler, D.P., Edman, T.R., 1976. Consonant environ-ment specifies vowel identity. J. Acoust. Soc. Amer. 60 (1), 213–224.
Titze, I., 2000. Principles of Voice Production, National Center for Voiceand Speech, Iowa City, IA.
Turner, G.S., Tjaden, K., Weismer, G., 1995. The influence of speak-ing rate on vowel space and speech intelligibility for individualswith amyotrophic lateral sclerosis. J. Speech Hearing Res. 38, 1001–1013.
van Santen, J.P.H., Mobius, B., 2000. A quantitative model of F0generation and alignment. Intonation – Analysis, Modelling andTechnology. Kluwer, Dordrecht, pp. 269–288.
Visser, J., pVoice: Dynamic Screen Communication Software. <http://www.pvoice.org>.
Weismer, G., Yunusova, Y., Westbury, J.R., 2003. Interarticulatorcoordination in dysarthria: An X-ray microbeam study. J. SpeechLang. Hearing Res. 46 (5), 1247–1261.
Words+ Inc., ‘‘Say-it! SAM’’ tablet computer including software titles ‘‘EZ Keys’’, ‘‘Speaking Dynamically Pro’’, ‘‘Boardmaker, and TalkingScreen’’. <http://www.words-plus.com>.
X. Niu, A.B. Kain, J.P. van Santen, 2006. A noninvasive, low-cost deviceto study the velopharyngeal port during speech and some preliminaryresults. In: Proc. of ICSLP, pp. 957–960.
Yorkston, K.M., Beukelman, D.R., Bell, K.R., 1988. Clinical Manage-ment of Dysarthric Speakers. PRO-ED, Inc., Austin, TX.
Yorkston, K., Beukelman, D., Strand, E., Bell, K., 1999. Management ofMotor Speech Disorders in Children and Adults. PRO-ED, Inc.,Austin, TX.
Ziegler, W., Hartmann, E., von Cramon, D., 1988. Word identificationtesting in the diagnostic evaluation of dysarthric speech. Clin.Linguistics Phonetics 2, 291–308.