Improving the Human Dimension in NASA LCLUC
20
Prepared by Dan Brown – U. Michigan Chris Justice – U. Maryland Emilio Moran – Indiana U. B. L. Turner II – Arizona State U. Strengthening the Human Dimension in the NASA LCLUC
Transcript of Improving the Human Dimension in NASA LCLUC

Prepared byDan Brown – U. Michigan
Chris Justice – U. MarylandEmilio Moran – Indiana U.
B. L. Turner II – Arizona State U.
Strengthening the Human Dimension in the NASA LCLUC

NASA LCLUC Program
“The LCLUC Program, through an interdisciplinary approach, is developing and using NASA remotesensing technologies to improve understanding of human interactions with the environment and, thus, provides a scientific foundation for understanding the sustainability, vulnerability and resilience of human land-use and terrestrial ecosystems.”
LCLUC Web Site
http://lcluc.umd.edu/

LCLUC IntentNASA
satellite & data technology
EnvironmentalDimensions
HumanDimensions
LCLUC

•LCLUC began with NRA’s focused on regional case studies & social processes of land change
– assumption: understanding processes will improve process driven models critical for global environmental & climate change communities _– impact: attention to drivers & movement beyond simple PAT variables (Population, Affluence, Technology) – issues unresolved:
•Some comparative-synthesis work BUT general rules not reached•Models developed in specific cases, but few integrated models
•Subsequent LCLUC NRA’s on LC Data sets, Carbon, Hydrology, Model Projections & Adaptation
– retains a strong emphasis on regional scale initiatives and in-country partnerships (e.g. NEESPI, MAIRS) but HD component patchy– steady decline in HD elements on proposals
• proposals tend to be strong on remote sensing or HD but not both– some, but not all, of this decline may be linked to spatial resolution of RS imagery & the emergence of other programs with emphasis on HD (e.g., CNH, NIH, Biocomplexity).
•challenge of regional to global scale understanding not met.•LCLUC seeks to rectify trend & reinvigorate the HD element
From Then To Now

LCLUC PracticeNASA
satellite & data technology
EnvironmentalDimensions
HumanDimensions
LCLUC
Abundance of this Need to improve presenceof this & even HD links minusstrong ties to ED
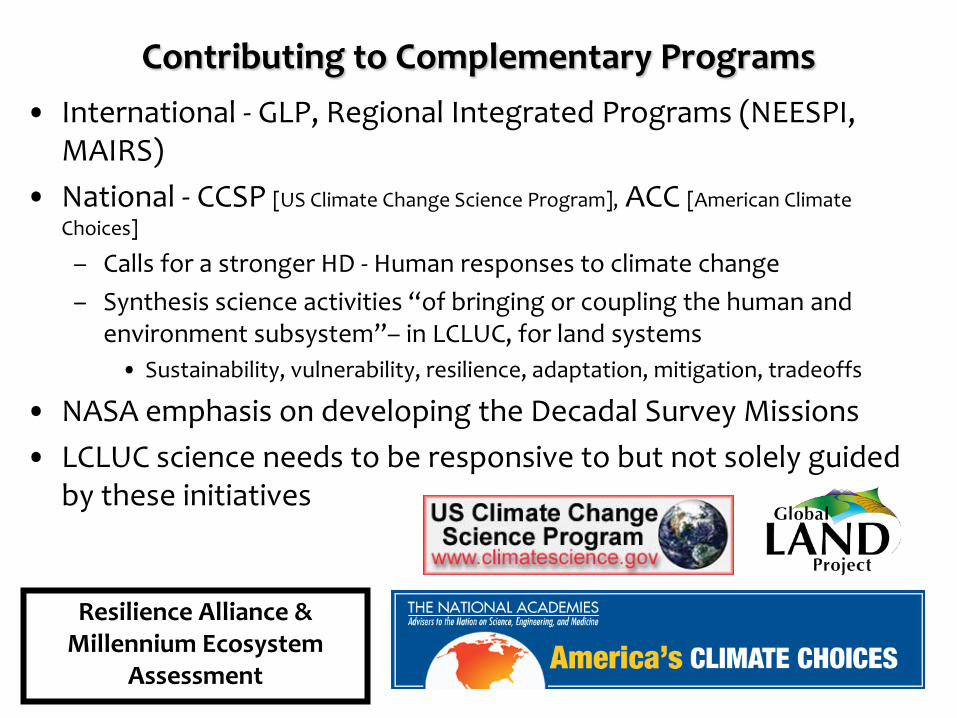
Contributing to Complementary Programs• International - GLP, Regional Integrated Programs (NEESPI,
MAIRS) • National - CCSP [US Climate Change Science Program], ACC [American Climate
Choices]
– Calls for a stronger HD - Human responses to climate change – Synthesis science activities “of bringing or coupling the human and
environment subsystem”– in LCLUC, for land systems • Sustainability, vulnerability, resilience, adaptation, mitigation, tradeoffs
• NASA emphasis on developing the Decadal Survey Missions • LCLUC science needs to be responsive to but not solely guided
by these initiatives
Resilience Alliance &Millennium Ecosystem
Assessment

Areas for HD Emphasis?• Inferring & Scaling -- Human Behavior• Land System Trade-Offs• Topical Themes
– Climate Change, Land Use and HD– Urbanization– Institutions and LU Decisions– Global economy and international protocols
• LCLUC in Integrated Models

Inferring & Scaling Human Behavior• Address population behavior and outcomes at 1 m resolution & upscale to 30 and 250
m resolutions to learn rules for more precise coarse-grain or regional assessments & thus improving behavioral dimensions of regional studies
– 4 LTERs already undertaking for questions of household lawns, water use, and climate change
• Work of this sort needs to be integrated with social information, from surveys to censuses, and understanding of scaling relationships in social/environmental process dynamics.
National LandCover Dataset
UTCLand Cover
48% 28%
Color InfraredAerial Imagery
UTC Estimates
Social InteractionsOwnership RegimesA: Private propertyB: Community propertyOwnership FragmentationC: One ownerD: Many ownersSettlement PatternsE: Courtyard patternF: Row pattern

Altamira – Brasil Novo - Medicilandia
(McCracken et al 1999, 2002, Moran et al 2002, Brondizio et al 2002)

The colonist footprint: Average deforestation trajectories across cohorts
02
46
81012
1416
1820
def70 def73 def75 def78 def79 def85 def88 def91 def96
deforestation periods
Ave
rage
per
cent
age
defo
rest
ed o
n fa
rm
lots
cohort 1, < 1973(n=121)cohort 2, 1973-76(n=1033)cohort 3, 1976-79(n=791)cohort 4, 1979-85(n=443)cohort 5, 1985-88(n=176)cohort 6, 1988-91(n=90)cohort 7, 1991-96(n=531)cohort 8, new(n=533)
Average distribution of deforestation events by cohorts

Land System Tradeoffs• What are the tradeoffs among
environmental services & between those services & human subsystem outcomes by “architecture” (kind, amount & pattern) of LCLUC & its change
– Permits id’ of hotspots of coupled system vulnerability – or poor resilience
– Potentially powerful planning information for sustainable cities and land systems
• What are the changes in these tradeoffs as scale of analysis changes
– Solutions applicable for one scale may not serve other scales
+ Biodiversity+ Available soil P+ Evapotranspiration - Soil moisture- On farm incomeCHOICE OF STATE AGENTS
- Biodiversity- Availlable soil P- Evapotranspiration + Soil moisture+ On farm income-CHOICE OF FARMERS
CHOICE OF STATE AGENTS AT ONE SCALE NEGATED BY CHOICE OF FARMERS AT ASCENDING SCALE

Expanding Topical Themes• Climate change, LU & HD
– Link HD processes and LULUC as a driver of or mitigation strategy & adaptation to CC– Already an issue in ULTERs and international agendas (e.g., REDD)– Research questions (examples):
• How does climate change, and its perception at the farm gate, affect property rights? • As cropping zones migrate poleward, how can flexible systems of land uses be designed to
migrate with changing conditions? • What are the social and institutional dimensions that facilitate or impede such adjustments to
climate change?
• Global urbanization demands attention to urban problems-issues– Emissions, pollution, disease-health, and population movement across the urban and peri-urban
landscape
• Global economy and protocols-accords (macro-structures) affect local-regional land systems, often with unknown time lags
– Global commodity prices, REDD, cap and trade, certification programs
• Understanding adaptation of land systems to climate & environment change– Institutions facilitating-inhibiting adaptations, environmental justice– Feedbacks between adaptations and environmental change

Integrated Models
• Develop “true” CHES, CHANS, SES Models in which – process-based land-system models are integrated with other Earth
System models (all spatially explicit & thus NASA linked)– such models can address
• tradeoffs within and between the coupled systems • adaptation, resilience, mitigation as system properties
• System-dynamics and agent-based models provide means to represent these dynamics but challenges remain:
– Right scaling processes to question and modeling at scales that allow integration with other earth system models.
– Integrating micro (e.g., survey, field) and macro (e.g., multi-temporal satellite images of pattern) data with models.

Value of Integrated Modeling
Outcomes of interest:
Adaptive Capacity
Vulnerability
Equity
Well being
Outcomes of Interest:
Water Quantity and Quality
Biodiversity
Ecosystem productivity
• We can simultaneously evaluate outcomes of interest in the social and environmental systems. Only by taking them together dynamically can this set of outcomes can help us define sustainability.
Land Cover Change
Land Use Change
Social System Natural System

4th IGBP Congress, 5-9 May 2008, Capetown
SERD model for scenario analysisModel uses socio-political & environmental drivers in a model that combines agent-based and stock-flow approaches.
Outputs include• #households
• #commuters
• #farms
• green land area
• GHG emissions
• carbon balance
Gaube et al. 2009, Landscape Ecology, forthcoming

Suggested Next Steps for Human Dimensions in LCLUC

0
25
50
75
100
0
25
50
75
100
100
a
c
d
b
% Forest 2001
0
25
50
75
100
0
25
50
75
100
Deforestation Trajectories 1970-2001
(a) Regional
Legal Amazon Pará State
(b) Subregions BR-163 subregion
Transamazon subregion Marajó Island subregion
(c)Riverine and upland communities, Amazon estuary subregion (n = 6)
(d) Traditional populations, Flona Tapajós (n = 14)
Figure 1

Scale Analyses
• The earlier figure shows the different outcome of analysis at each scale
• At Amazon Basin scale, we have one trajectory of deforestation, mirrored by what we see at Para state (due to size of the state and its hot spot status)
• However, focus on the Basin, turns out to be a focus on a piece of it, and overlooks the very different outcomes in other states of the Basin, and at other scales, where temporal and spatial dynamics are different….


New Methods needed in the humid tropicsThis is not a HD issue per se]
The use of optical remote sensing techniques has inherent limitations due to cloud coverage. This fact is important in the humid tropics, because of cloud cover. To overcome these difficulties, SAR data has been used as a complement.
The potential of radar data in C and L bands for analyzing tropical forest changes, has been demonstrated by several researchers. SAR data in one polarization presents limitations. The launching of new polarimetric radar satellites, such as ALOS/PALSAR (L-band) and RADARSAT2, may improve discrimination of land cover classes.
One can link the use of the above polarimetric radar data, together with Landsat data, in achieving the goals of this project—and the capabilities of polarimetric radars in LCLUC science.
Next figure shows an example linking spatially the ALOS/Palsar and TM data coverages


![NASA update 2014-Sopron.ppt - lcluc.umd.edu...Update Garik Gutman, LCLUC Program Manager NASA Headquarters Washington, DC 1. RBI OMPS-Limb [[TSIS-2]] ... (thermal IR issues) – Landsat-9](https://static.fdocuments.net/doc/165x107/5f70f3cd8908a96f45306b1c/nasa-update-2014-lclucumdedu-update-garik-gutman-lcluc-program-manager.jpg)