Improving shallow foundations resting on saturated loose...
14
Transcript of Improving shallow foundations resting on saturated loose...
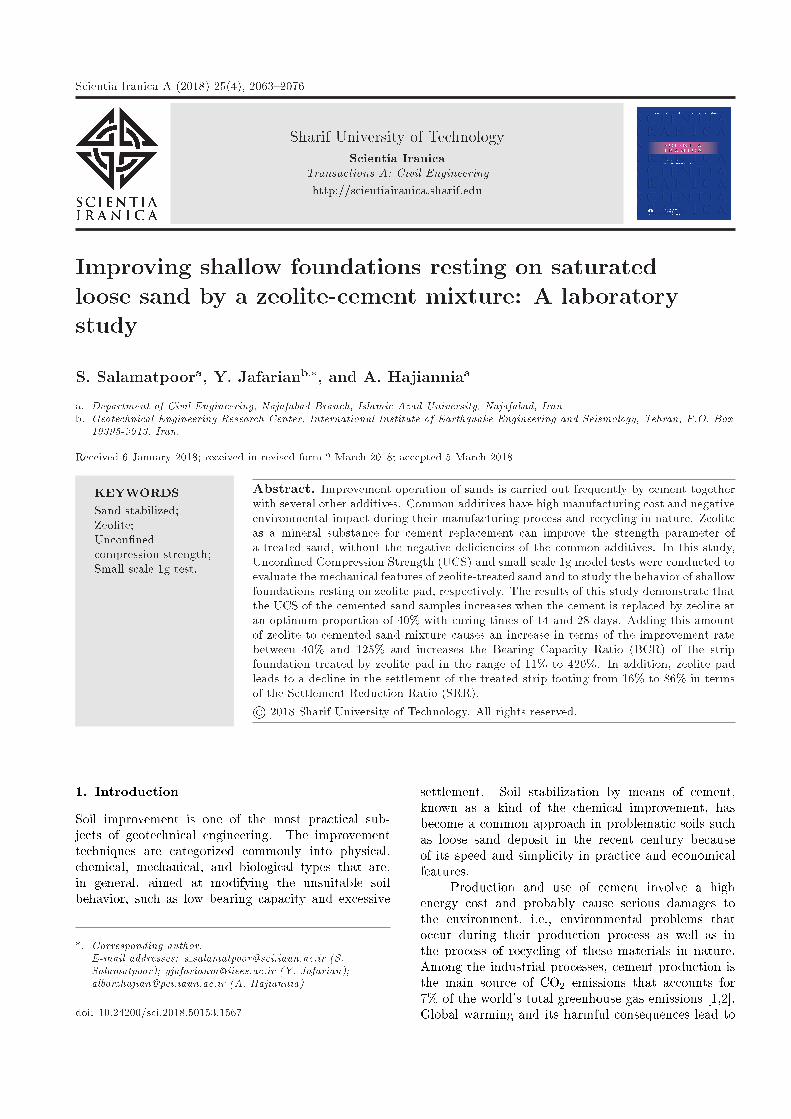
Scientia Iranica A (2018) 25(4), 2063{2076
Sharif University of TechnologyScientia Iranica
Transactions A: Civil Engineeringhttp://scientiairanica.sharif.edu
Improving shallow foundations resting on saturatedloose sand by a zeolite-cement mixture: A laboratorystudy
S. Salamatpoora, Y. Jafarianb;�, and A. Hajianniaa
a. Department of Civil Engineering, Najafabad Branch, Islamic Azad University, Najafabad, Iran.b. Geotechnical Engineering Research Center, International Institute of Earthquake Engineering and Seismology, Tehran, P.O. Box
19395-3913, Iran.
Received 6 January 2018; received in revised form 2 March 2018; accepted 5 March 2018
KEYWORDSSand stabilized;Zeolite;Uncon�nedcompression strength;Small-scale 1g test.
Abstract. Improvement operation of sands is carried out frequently by cement togetherwith several other additives. Common additives have high manufacturing cost and negativeenvironmental impact during their manufacturing process and recycling in nature. Zeoliteas a mineral substance for cement replacement can improve the strength parameter ofa treated sand, without the negative de�ciencies of the common additives. In this study,Uncon�ned Compression Strength (UCS) and small-scale 1g model tests were conducted toevaluate the mechanical features of zeolite-treated sand and to study the behavior of shallowfoundations resting on zeolite pad, respectively. The results of this study demonstrate thatthe UCS of the cemented sand samples increases when the cement is replaced by zeolite atan optimum proportion of 40% with curing times of 14 and 28 days. Adding this amountof zeolite to cemented sand mixture causes an increase in terms of the improvement ratebetween 40% and 125% and increases the Bearing Capacity Ratio (BCR) of the stripfoundation treated by zeolite pad in the range of 11% to 420%. In addition, zeolite padleads to a decline in the settlement of the treated strip footing from 16% to 86% in termsof the Settlement Reduction Ratio (SRR).© 2018 Sharif University of Technology. All rights reserved.
1. Introduction
Soil improvement is one of the most practical sub-jects of geotechnical engineering. The improvementtechniques are categorized commonly into physical,chemical, mechanical, and biological types that are,in general, aimed at modifying the unsuitable soilbehavior, such as low bearing capacity and excessive
*. Corresponding author.E-mail addresses: s [email protected] (S.Salamatpoor); [email protected] (Y. Jafarian);[email protected] (A. Hajiannia)
doi: 10.24200/sci.2018.50153.1567
settlement. Soil stabilization by means of cement,known as a kind of the chemical improvement, hasbecome a common approach in problematic soils suchas loose sand deposit in the recent century becauseof its speed and simplicity in practice and economicalfeatures.
Production and use of cement involve a highenergy cost and probably cause serious damages tothe environment, i.e., environmental problems thatoccur during their production process as well as inthe process of recycling of these materials in nature.Among the industrial processes, cement production isthe main source of CO2 emissions that accounts for7% of the world's total greenhouse gas emissions [1,2].Global warming and its harmful consequences lead to
2064 S. Salamatpoor et al./Scientia Iranica, Transactions A: Civil Engineering 25 (2018) 2063{2076
seeking the application of sustainable materials withthe least amount of energy and costs in their productionprocess, as well as a reduction in environmental impactsduring their recycling process in nature. One of thesealternatives is a natural zeolite, which reduces the en-vironmental drawbacks of cement. Moreover, utilizingother additives to the cemented sand improves thebrittle behavior of cemented sand. In recent years, uti-lizing pozzolanic materials as a substitute for a portionof the applied cement has become quite common toreduce probable environmental impacts, modify soilspeci�cations, and save the costs.
Natural zeolite is a pozzolanic material made upof volcanic material that contains large quantities ofreactive silicon dioxide (SiO2) and aluminum oxide(AI2O3). Calcium hydroxide (Ca(OH)2) produced bythe hydration of Portland cement reacts with zeo-lite, causing chemical improvement of the interfacialmicrostructure between the blended cement paste [3-5]. Generally, natural zeolite, which contains highpozzolanic activity, leads to the improvement of themechanical strength and durability of cement andconcrete properties [6].
Most studies on zeolite are focused on the im-provement of the mechanical features of concrete, andits performance in geotechnical engineering �eld hasbeen rarely addressed. Tuncan et al. [7] studied thefeatures of mixed zeolite-Bentonite in terms of strengthparameters. They conducted UCS and triaxial tests,and found that adding zeolite to the mixture increasesthe specimens' strength remarkably. Furthermore, theB=Z (Bentonite to Zeolite) ratio of 0.1 is known as theideal mixing ratio in the back�ll construction.
The studies conducted on the bearing capacityof the foundations constructed on loose sand clearlyshow that such foundations may experience a sig-ni�cant lack of shear strength due to earthquake-induced liquefaction [8]. Furthermore, Jafarian etal. [9] investigated bearing capacity and settlement ofstrip and square footings resting on saturated sand,subjected to various intensities of upwards seepage.Although extensive researches have been carried out forsettlement reduction of foundations in such conditions,more investigations seem to be required to evaluatevarious soil improvement techniques for foundationtreatment. Dash et al. [10] assessed the impact ofgeocell reinforcement on the bearing capacity of stripfoundation on sand. They concluded that the bestresult could be obtained when the ratio of geocellinstallation depth to foundation width is 0.1.
In this paper, the mechanical e�ect of zeolite onthe shear strength of cemented sand is investigatedthrough the Uncon�ned Compression Strength test(UCS) within the �rst stage. Reviewing the resultssuggests an optimum proportion of zeolite among allthe considered proportions and introduces an ideal
combination of the stabilization of cemented sand sam-ples. Subsequently, several experiments are conductedusing small-scale 1g model tests to investigate thebehavior of strip foundations resting on the zeolite-cemented sand pads. In the following sections, thetesting procedure and the results are explained indetail; in addition, the e�ects of the thickness ofthe zeolite pad on bearing capacity and settlement ofshallow foundation will be discussed.
2. Experimental investigations
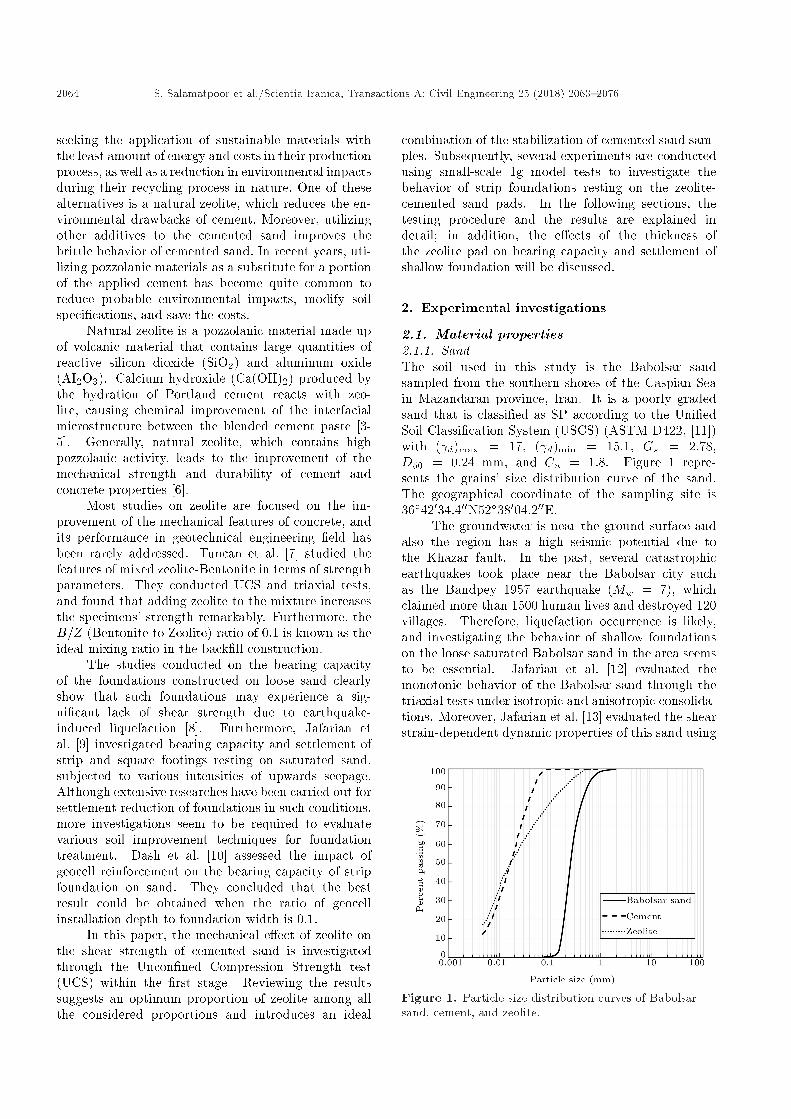
2.1. Material properties2.1.1. SandThe soil used in this study is the Babolsar sandsampled from the southern shores of the Caspian Seain Mazandaran province, Iran. It is a poorly gradedsand that is classi�ed as SP according to the Uni�edSoil Classi�cation System (USCS) (ASTM D422, [11])with ( d)max = 17, ( d)min = 15:1, Gs = 2:78,D50 = 0:24 mm, and Cu = 1:8. Figure 1 repre-sents the grains' size distribution curve of the sand.The geographical coordinate of the sampling site is36�42034:400N52�38004:200E.
The groundwater is near the ground surface andalso the region has a high seismic potential due tothe Khazar fault. In the past, several catastrophicearthquakes took place near the Babolsar city suchas the Bandpey 1957 earthquake (Mw = 7), whichclaimed more than 1500 human lives and destroyed 120villages. Therefore, liquefaction occurrence is likely,and investigating the behavior of shallow foundationson the loose saturated Babolsar sand in the area seemsto be essential. Jafarian et al. [12] evaluated themonotonic behavior of the Babolsar sand through thetriaxial tests under isotropic and anisotropic consolida-tions. Moreover, Jafarian et al. [13] evaluated the shearstrain-dependent dynamic properties of this sand using
Figure 1. Particle size distribution curves of Babolsarsand, cement, and zeolite.
S. Salamatpoor et al./Scientia Iranica, Transactions A: Civil Engineering 25 (2018) 2063{2076 2065
a resonant column and cyclic triaxial experiments. Theexperimental results indicate that con�ning pressurehas an important in uence on the shear modulus ofthe tested samples and, by increasing mean con�ningpressure, the e�ect of relative density and initialstress anisotropy on the shear modulus increases. Inaddition, Salamatpoor and Salamatpoor [14] comparedthe liquefaction potential of the Babolsar sand withthirteen case histories using the concept of lique�edshear strength ratio. The results of these studies indi-cate that the Babolsar sand is potentially susceptibleto signi�cant strain softening due to monotonic andcyclic loads. Since the region is densely populatedand numerous shallow foundations are constructed,sand improvement studies are necessary to reducethe probable risks arising from the shear failure offoundations in these areas.
2.1.2. CementIn this paper, Portland cement type II (ASTMC150/C150M-17 [15]) was utilized in the experiments.This type of cement, which is appropriate for structuresexposed to soil or water containing sulfate ions, wasobtained from Mazandaran Cement Company as themost widely used cement in the construction industryin the North of Iran.
2.1.3. ZeoliteThe natural zeolite of the clinoptilolite type was uti-lized in this study, which was extracted from the AftarMine located 30 km far from Semnan Province in thecentral region of Iran (35�3704400N53�0102200E). Basedon the recent exploration study, the proven reservesof zeolite in the mine are over 600 thousand tons;currently, 85 percent of the total zeolite extraction inIran is extracted from this mine.
The zeolite is classi�ed as low plasticity silt (ML)according to the Uni�ed Soil Classi�cation System with(Gs = 2:2), and its color is a light cream. Figure 1represents particle size distribution curves of the sand,cement, and zeolite used in this study. Furthermore,Table 1 presents the physical characteristics and chem-ical composition of the cement and zeolite, respectively.
2.2. Description of experiments, samplepreparation, and testing procedure
In this study, two series of experiments were conducted.In the �rst series, to evaluate the mechanical be-havior of zeolite-cemented sand mixtures, Uncon�nedCompressive Strength (UCS) tests were performedto determine an optimum proportion of zeolite as acomplementary additive to the cemented sand. Theoptimum proportion of zeolite denotes the most e�-cient amount of this substance in the sand that resultsin the highest strength enhancement. In the secondseries of the experiments, several small-scale 1g modeltests were performed to investigate the behavior of strip
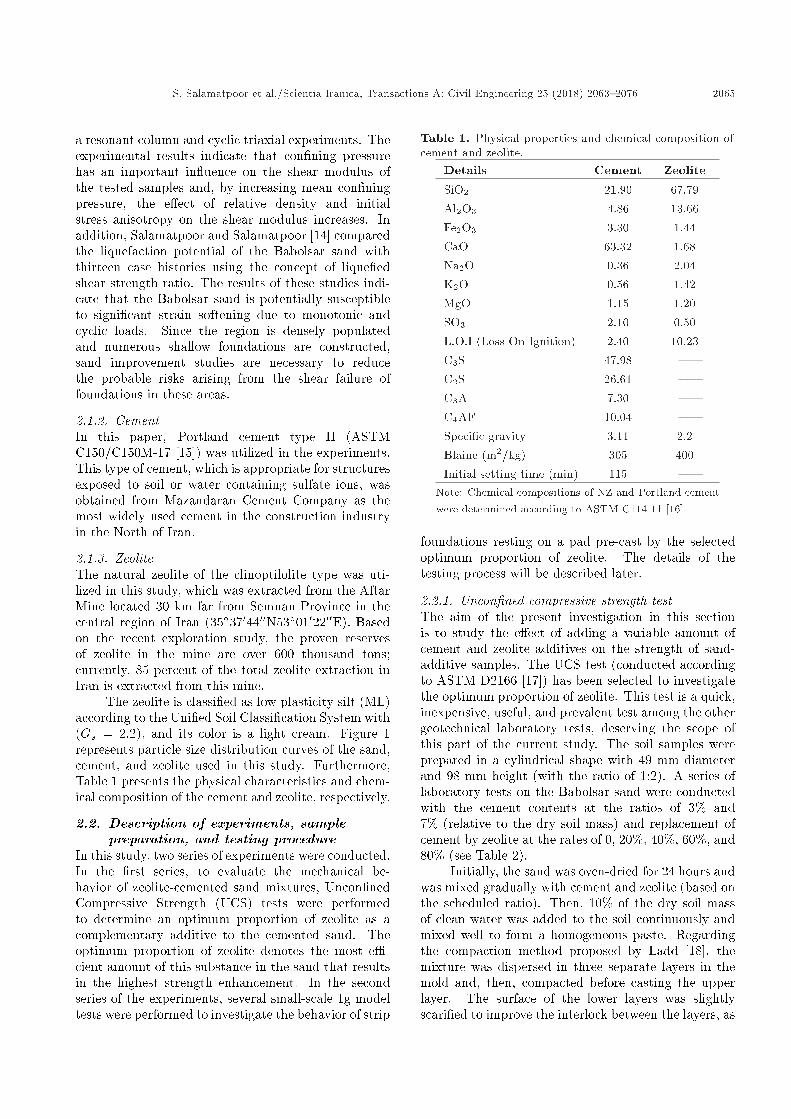
Table 1. Physical properties and chemical composition ofcement and zeolite.
Details Cement Zeolite
SiO2 21.90 67.79Al2O3 4.86 13.66Fe2O3 3.30 1.44CaO 63.32 1.68Na2O 0.36 2.04K2O 0.56 1.42MgO 1.15 1.20SO3 2.10 0.50L.O.I (Loss On Ignition) 2.40 10.23C3S 47.98 |C2S 26.61 |C3A 7.30 |C4AF 10.04 |Speci�c gravity 3.11 2.2Blaine (m2/kg) 305 400Initial setting time (min) 115 |
Note: Chemical compositions of NZ and Portland cementwere determined according to ASTM C114-11 [16].
foundations resting on a pad pre-cast by the selectedoptimum proportion of zeolite. The details of thetesting process will be described later.
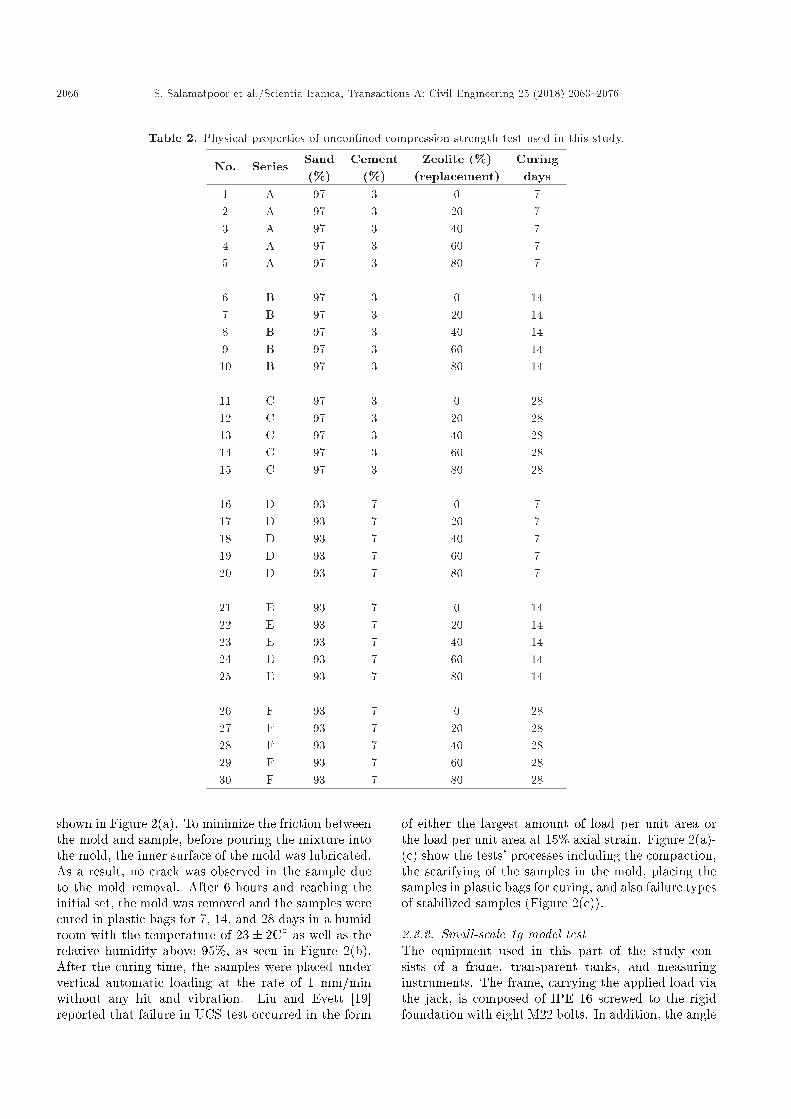
2.2.1. Uncon�ned compressive strength testThe aim of the present investigation in this sectionis to study the e�ect of adding a variable amount ofcement and zeolite additives on the strength of sand-additive samples. The UCS test (conducted accordingto ASTM D2166 [17]) has been selected to investigatethe optimum proportion of zeolite. This test is a quick,inexpensive, useful, and prevalent test among the othergeotechnical laboratory tests, deserving the scope ofthis part of the current study. The soil samples wereprepared in a cylindrical shape with 49 mm diameterand 98 mm height (with the ratio of 1:2). A series oflaboratory tests on the Babolsar sand were conductedwith the cement contents at the ratios of 3% and7% (relative to the dry soil mass) and replacement ofcement by zeolite at the rates of 0, 20%, 40%, 60%, and80% (see Table 2).
Initially, the sand was oven-dried for 24 hours andwas mixed gradually with cement and zeolite (based onthe scheduled ratio). Then, 10% of the dry soil massof clean water was added to the soil continuously andmixed well to form a homogeneous paste. Regardingthe compaction method proposed by Ladd [18], themixture was dispersed in three separate layers in themold and, then, compacted before casting the upperlayer. The surface of the lower layers was slightlyscari�ed to improve the interlock between the layers, as
2066 S. Salamatpoor et al./Scientia Iranica, Transactions A: Civil Engineering 25 (2018) 2063{2076
Table 2. Physical properties of uncon�ned compression strength test used in this study.
No. Series Sand(%)
Cement(%)
Zeolite (%)(replacement)
Curingdays
1 A 97 3 0 72 A 97 3 20 73 A 97 3 40 74 A 97 3 60 75 A 97 3 80 7
6 B 97 3 0 147 B 97 3 20 148 B 97 3 40 149 B 97 3 60 1410 B 97 3 80 14
11 C 97 3 0 2812 C 97 3 20 2813 C 97 3 40 2814 C 97 3 60 2815 C 97 3 80 28
16 D 93 7 0 717 D 93 7 20 718 D 93 7 40 719 D 93 7 60 720 D 93 7 80 7
21 E 93 7 0 1422 E 93 7 20 1423 E 93 7 40 1424 E 93 7 60 1425 E 93 7 80 14
26 F 93 7 0 2827 F 93 7 20 2828 F 93 7 40 2829 F 93 7 60 2830 F 93 7 80 28
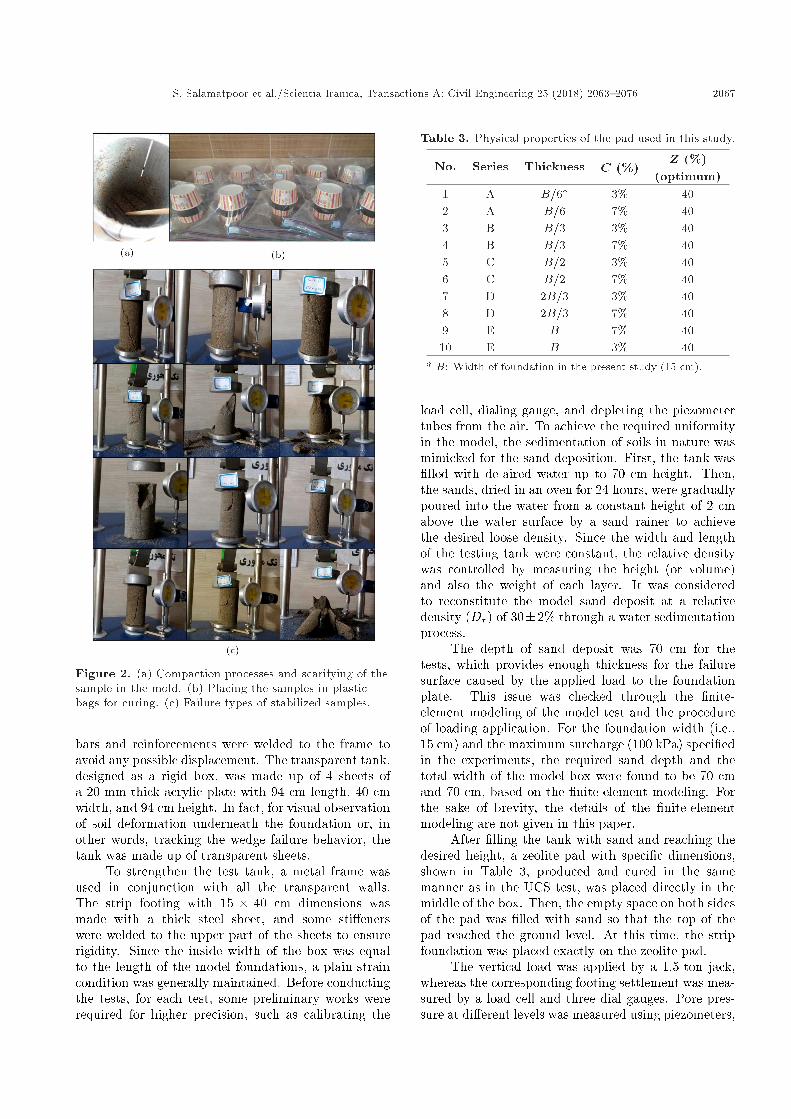
shown in Figure 2(a). To minimize the friction betweenthe mold and sample, before pouring the mixture intothe mold, the inner surface of the mold was lubricated.As a result, no crack was observed in the sample dueto the mold removal. After 6 hours and reaching theinitial set, the mold was removed and the samples werecured in plastic bags for 7, 14, and 28 days in a humidroom with the temperature of 23 � 2C� as well as therelative humidity above 95%, as seen in Figure 2(b).After the curing time, the samples were placed undervertical automatic loading at the rate of 1 mm/minwithout any hit and vibration. Liu and Evett [19]reported that failure in UCS test occurred in the form
of either the largest amount of load per unit area orthe load per unit area at 15% axial strain. Figure 2(a)-(c) show the tests' processes including the compaction,the scarifying of the samples in the mold, placing thesamples in plastic bags for curing, and also failure typesof stabilized samples (Figure 2(c)).
2.2.2. Small-scale 1g model testThe equipment used in this part of the study con-sists of a frame, transparent tanks, and measuringinstruments. The frame, carrying the applied load viathe jack, is composed of IPE 16 screwed to the rigidfoundation with eight M22 bolts. In addition, the angle
S. Salamatpoor et al./Scientia Iranica, Transactions A: Civil Engineering 25 (2018) 2063{2076 2067
Figure 2. (a) Compaction processes and scarifying of thesample in the mold. (b) Placing the samples in plasticbags for curing. (c) Failure types of stabilized samples.
bars and reinforcements were welded to the frame toavoid any possible displacement. The transparent tank,designed as a rigid box, was made up of 4 sheets ofa 20-mm-thick acrylic plate with 94 cm length, 40 cmwidth, and 94 cm height. In fact, for visual observationof soil deformation underneath the foundation or, inother words, tracking the wedge failure behavior, thetank was made up of transparent sheets.
To strengthen the test tank, a metal frame wasused in conjunction with all the transparent walls.The strip footing with 15 � 40 cm dimensions wasmade with a thick steel sheet, and some sti�enerswere welded to the upper part of the sheets to ensurerigidity. Since the inside width of the box was equalto the length of the model foundations, a plain-straincondition was generally maintained. Before conductingthe tests, for each test, some preliminary works wererequired for higher precision, such as calibrating the
Table 3. Physical properties of the pad used in this study.
No. Series Thickness C (%)Z (%)
(optimum)1 A B=6� 3% 402 A B=6 7% 403 B B=3 3% 404 B B=3 7% 405 C B=2 3% 406 C B=2 7% 407 D 2B=3 3% 408 D 2B=3 7% 409 E B 7% 4010 E B 3% 40
* B: Width of foundation in the present study (15 cm).
load cell, dialing gauge, and depleting the piezometertubes from the air. To achieve the required uniformityin the model, the sedimentation of soils in nature wasmimicked for the sand deposition. First, the tank was�lled with de-aired water up to 70 cm height. Then,the sands, dried in an oven for 24 hours, were graduallypoured into the water from a constant height of 2 cmabove the water surface by a sand rainer to achievethe desired loose density. Since the width and lengthof the testing tank were constant, the relative densitywas controlled by measuring the height (or volume)and also the weight of each layer. It was consideredto reconstitute the model sand deposit at a relativedensity (Dr) of 30�2% through a water sedimentationprocess.
The depth of sand deposit was 70 cm for thetests, which provides enough thickness for the failuresurface caused by the applied load to the foundationplate. This issue was checked through the �nite-element modeling of the model test and the procedureof loading application. For the foundation width (i.e.,15 cm) and the maximum surcharge (100 kPa) speci�edin the experiments, the required sand depth and thetotal width of the model box were found to be 70 cmand 70 cm, based on the �nite-element modeling. Forthe sake of brevity, the details of the �nite-elementmodeling are not given in this paper.
After �lling the tank with sand and reaching thedesired height, a zeolite pad with speci�c dimensions,shown in Table 3, produced and cured in the samemanner as in the UCS test, was placed directly in themiddle of the box. Then, the empty space on both sidesof the pad was �lled with sand so that the top of thepad reached the ground level. At this time, the stripfoundation was placed exactly on the zeolite pad.
The vertical load was applied by a 1.5-ton jack,whereas the corresponding footing settlement was mea-sured by a load cell and three dial gauges. Pore pres-sure at di�erent levels was measured using piezometers,
2068 S. Salamatpoor et al./Scientia Iranica, Transactions A: Civil Engineering 25 (2018) 2063{2076
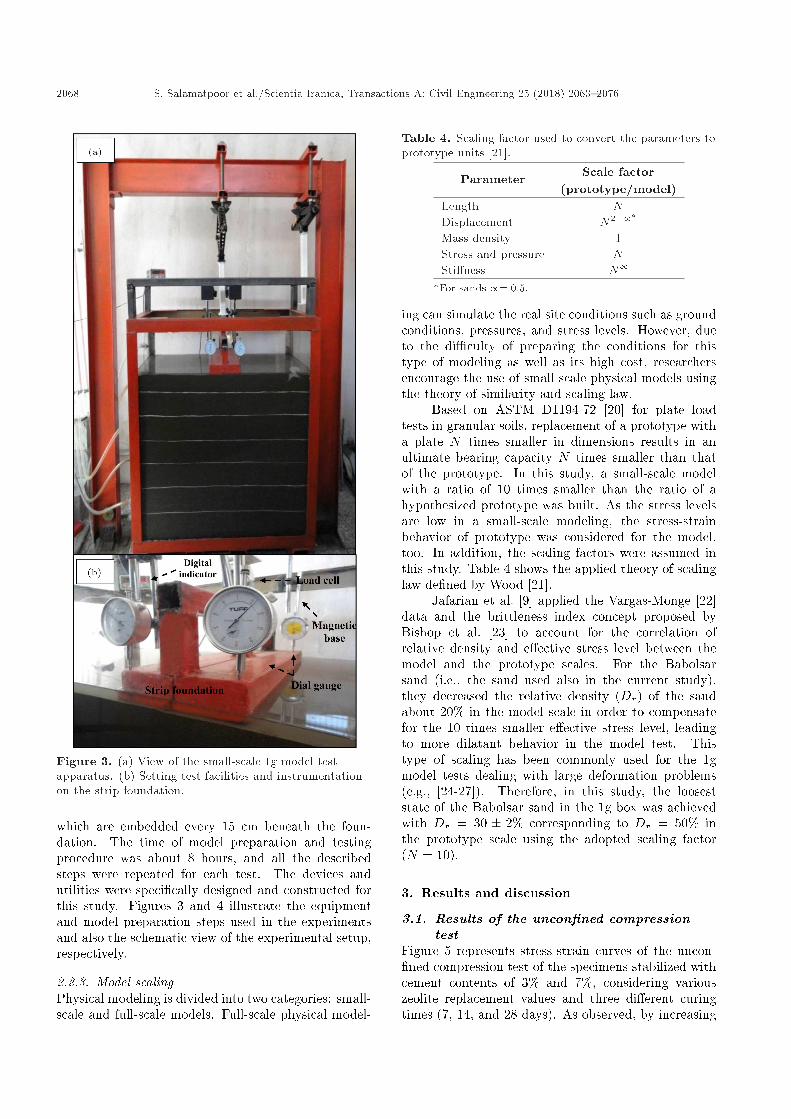
Figure 3. (a) View of the small-scale 1g model testapparatus. (b) Setting test facilities and instrumentationon the strip foundation.
which are embedded every 15 cm beneath the foun-dation. The time of model preparation and testingprocedure was about 8 hours, and all the describedsteps were repeated for each test. The devices andutilities were speci�cally designed and constructed forthis study. Figures 3 and 4 illustrate the equipmentand model preparation steps used in the experimentsand also the schematic view of the experimental setup,respectively.
2.2.3. Model scalingPhysical modeling is divided into two categories: small-scale and full-scale models. Full-scale physical model-
Table 4. Scaling factor used to convert the parameters toprototype units [21].
Parameter Scale factor(prototype/model)
Length NDisplacement N2�/�
Mass density 1Stress and pressure NSti�ness N/�For sands /= 0:5.
ing can simulate the real site conditions such as groundconditions, pressures, and stress levels. However, dueto the di�culty of preparing the conditions for thistype of modeling as well as its high cost, researchersencourage the use of small-scale physical models usingthe theory of similarity and scaling law.
Based on ASTM D1194-72 [20] for plate loadtests in granular soils, replacement of a prototype witha plate N times smaller in dimensions results in anultimate bearing capacity N times smaller than thatof the prototype. In this study, a small-scale modelwith a ratio of 10 times smaller than the ratio of ahypothesized prototype was built. As the stress levelsare low in a small-scale modeling, the stress-strainbehavior of prototype was considered for the model,too. In addition, the scaling factors were assumed inthis study. Table 4 shows the applied theory of scalinglaw de�ned by Wood [21].
Jafarian et al. [9] applied the Vargas-Monge [22]data and the brittleness index concept proposed byBishop et al. [23] to account for the correlation ofrelative density and e�ective stress level between themodel and the prototype scales. For the Babolsarsand (i.e., the sand used also in the current study),they decreased the relative density (Dr) of the sandabout 20% in the model scale in order to compensatefor the 10 times smaller e�ective stress level, leadingto more dilatant behavior in the model test. Thistype of scaling has been commonly used for the 1gmodel tests dealing with large deformation problems(e.g., [24-27]). Therefore, in this study, the looseststate of the Babolsar sand in the 1g box was achievedwith Dr = 30 � 2% corresponding to Dr = 50% inthe prototype scale using the adopted scaling factor(N = 10).
3. Results and discussion
3.1. Results of the uncon�ned compressiontest
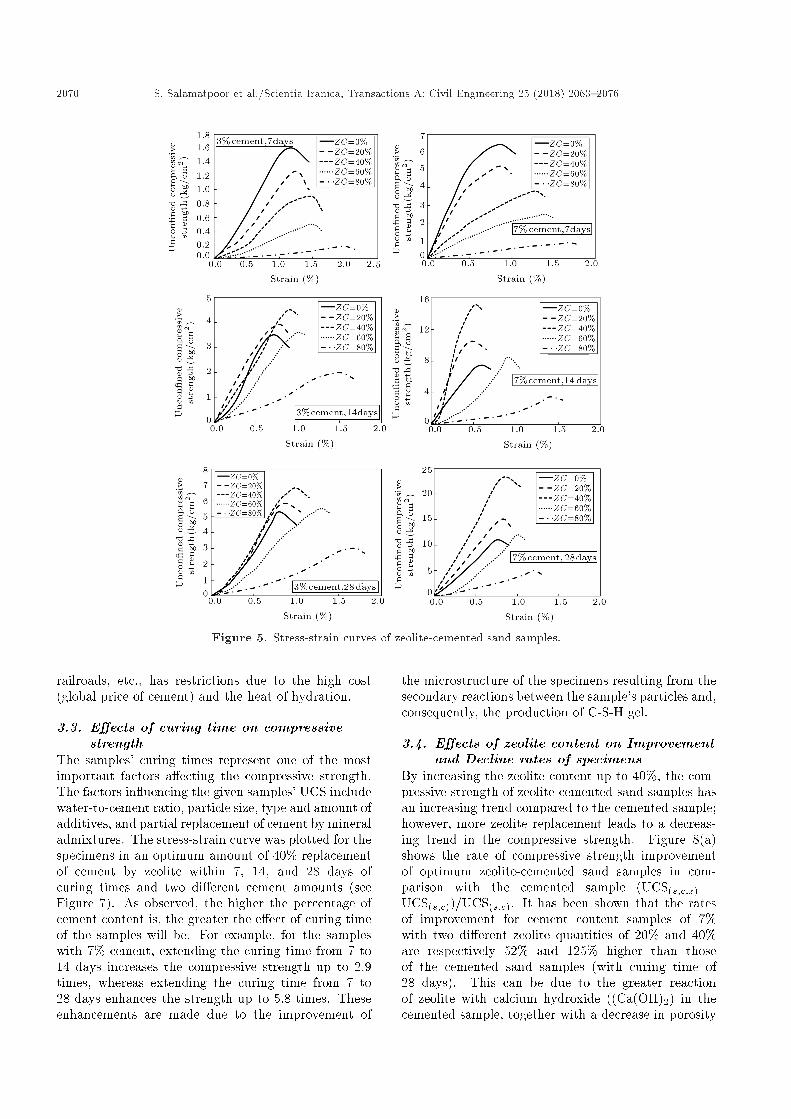
Figure 5 represents stress-strain curves of the uncon-�ned compression test of the specimens stabilized withcement contents of 3% and 7%, considering variouszeolite replacement values and three di�erent curingtimes (7, 14, and 28 days). As observed, by increasing
S. Salamatpoor et al./Scientia Iranica, Transactions A: Civil Engineering 25 (2018) 2063{2076 2069
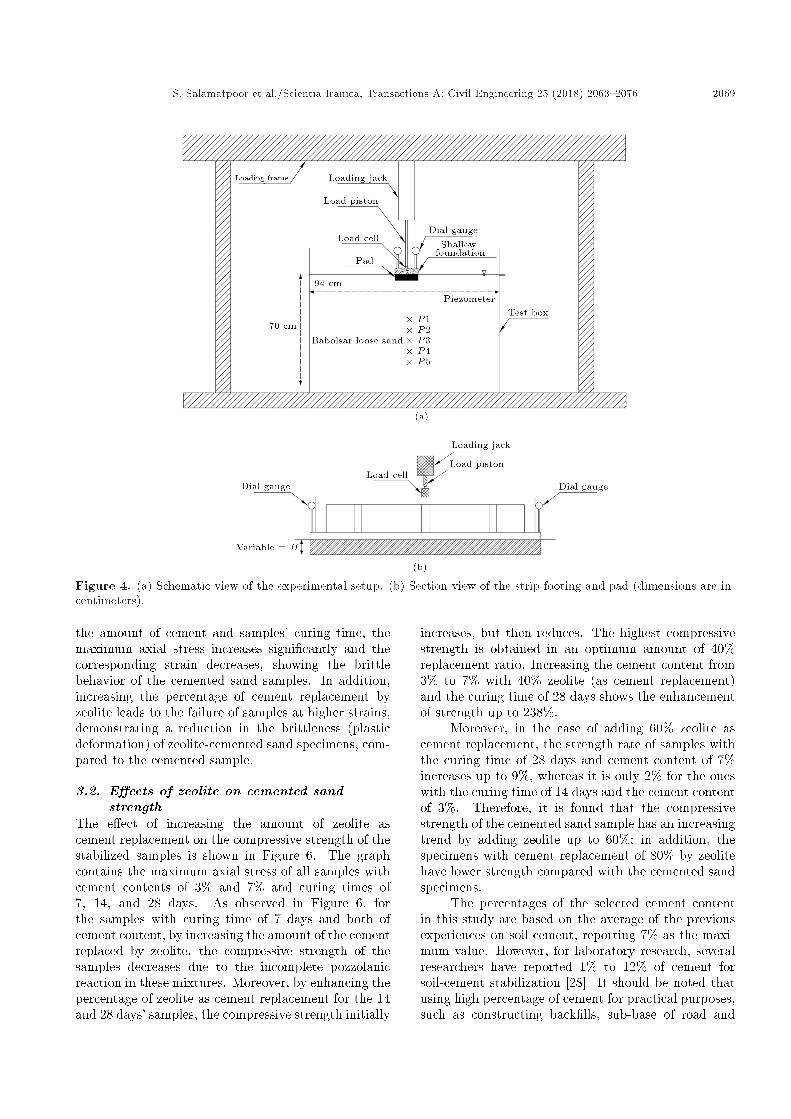
Figure 4. (a) Schematic view of the experimental setup. (b) Section view of the strip footing and pad (dimensions are incentimeters).
the amount of cement and samples' curing time, themaximum axial stress increases signi�cantly and thecorresponding strain decreases, showing the brittlebehavior of the cemented sand samples. In addition,increasing the percentage of cement replacement byzeolite leads to the failure of samples at higher strains,demonstrating a reduction in the brittleness (plasticdeformation) of zeolite-cemented sand specimens, com-pared to the cemented sample.
3.2. E�ects of zeolite on cemented sandstrength
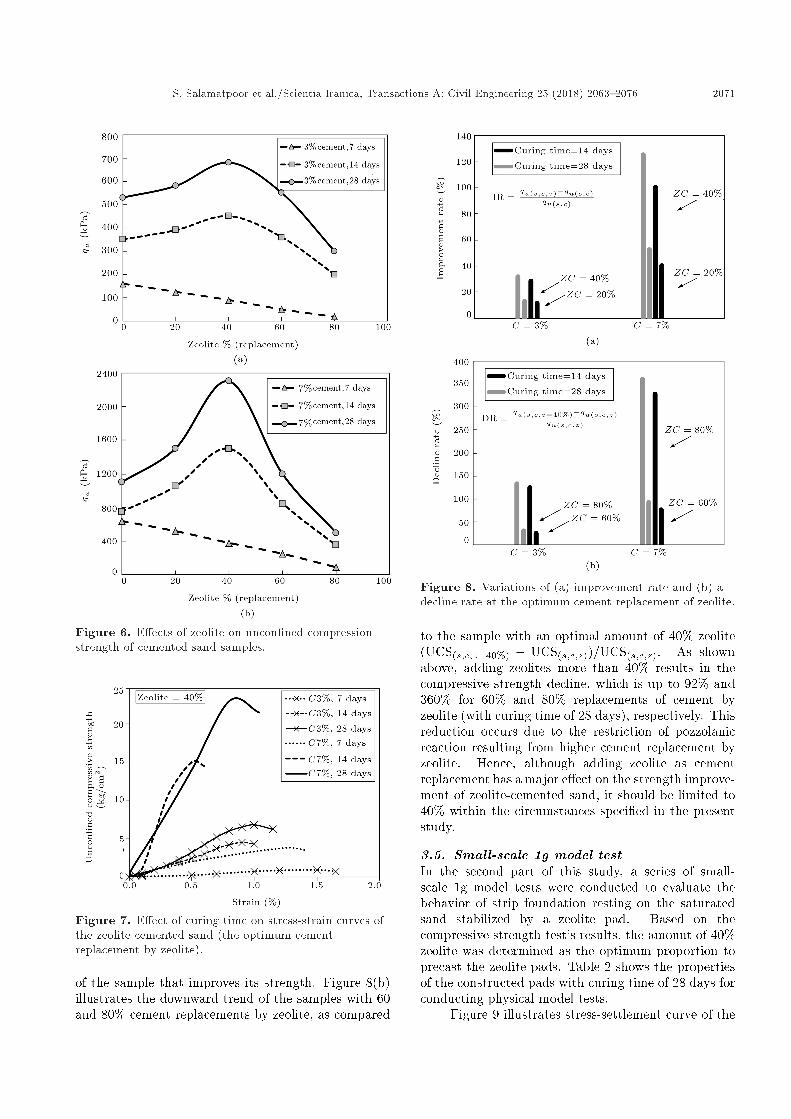
The e�ect of increasing the amount of zeolite ascement replacement on the compressive strength of thestabilized samples is shown in Figure 6. The graphcontains the maximum axial stress of all samples withcement contents of 3% and 7% and curing times of7, 14, and 28 days. As observed in Figure 6, forthe samples with curing time of 7 days and both ofcement content, by increasing the amount of the cementreplaced by zeolite, the compressive strength of thesamples decreases due to the incomplete pozzolanicreaction in these mixtures. Moreover, by enhancing thepercentage of zeolite as cement replacement for the 14and 28 days' samples, the compressive strength initially
increases, but then reduces. The highest compressivestrength is obtained in an optimum amount of 40%replacement ratio. Increasing the cement content from3% to 7% with 40% zeolite (as cement replacement)and the curing time of 28 days shows the enhancementof strength up to 238%.
Moreover, in the case of adding 60% zeolite ascement replacement, the strength rate of samples withthe curing time of 28 days and cement content of 7%increases up to 9%, whereas it is only 2% for the oneswith the curing time of 14 days and the cement contentof 3%. Therefore, it is found that the compressivestrength of the cemented sand sample has an increasingtrend by adding zeolite up to 60%; in addition, thespecimens with cement replacement of 80% by zeolitehave lower strength compared with the cemented sandspecimens.
The percentages of the selected cement contentin this study are based on the average of the previousexperiences on soil-cement, reporting 7% as the maxi-mum value. However, for laboratory research, severalresearchers have reported 1% to 12% of cement forsoil-cement stabilization [28]. It should be noted thatusing high percentage of cement for practical purposes,such as constructing back�lls, sub-base of road and
2070 S. Salamatpoor et al./Scientia Iranica, Transactions A: Civil Engineering 25 (2018) 2063{2076
Figure 5. Stress-strain curves of zeolite-cemented sand samples.
railroads, etc., has restrictions due to the high cost(global price of cement) and the heat of hydration.
3.3. E�ects of curing time on compressivestrength
The samples' curing times represent one of the mostimportant factors a�ecting the compressive strength.The factors in uencing the given samples' UCS includewater-to-cement ratio, particle size, type and amount ofadditives, and partial replacement of cement by mineraladmixtures. The stress-strain curve was plotted for thespecimens in an optimum amount of 40% replacementof cement by zeolite within 7, 14, and 28 days ofcuring times and two di�erent cement amounts (seeFigure 7). As observed, the higher the percentage ofcement content is, the greater the e�ect of curing timeof the samples will be. For example, for the sampleswith 7% cement, extending the curing time from 7 to14 days increases the compressive strength up to 2.9times, whereas extending the curing time from 7 to28 days enhances the strength up to 5.8 times. Theseenhancements are made due to the improvement of
the microstructure of the specimens resulting from thesecondary reactions between the sample's particles and,consequently, the production of C-S-H gel.
3.4. E�ects of zeolite content on Improvementand Decline rates of specimens
By increasing the zeolite content up to 40%, the com-pressive strength of zeolite-cemented sand samples hasan increasing trend compared to the cemented sample;however, more zeolite replacement leads to a decreas-ing trend in the compressive strength. Figure 8(a)shows the rate of compressive strength improvementof optimum zeolite-cemented sand samples in com-parison with the cemented sample (UCS(s;c;z) �UCS(s;c))=UCS(s;c). It has been shown that the ratesof improvement for cement content samples of 7%with two di�erent zeolite quantities of 20% and 40%are respectively 52% and 125% higher than thoseof the cemented sand samples (with curing time of28 days). This can be due to the greater reactionof zeolite with calcium hydroxide ((Ca(OH)2) in thecemented sample, together with a decrease in porosity
S. Salamatpoor et al./Scientia Iranica, Transactions A: Civil Engineering 25 (2018) 2063{2076 2071
Figure 6. E�ects of zeolite on uncon�ned compressionstrength of cemented sand samples.
Figure 7. E�ect of curing time on stress-strain curves ofthe zeolite-cemented sand (the optimum cementreplacement by zeolite).
of the sample that improves its strength. Figure 8(b)illustrates the downward trend of the samples with 60and 80% cement replacements by zeolite, as compared
Figure 8. Variations of (a) improvement rate and (b) adecline rate at the optimum cement replacement of zeolite.
to the sample with an optimal amount of 40% zeolite(UCS(s;c;z=40%) � UCS(s;c;z))=UCS(s;c;z). As shownabove, adding zeolites more than 40% results in thecompressive strength decline, which is up to 92% and360% for 60% and 80% replacements of cement byzeolite (with curing time of 28 days), respectively. Thisreduction occurs due to the restriction of pozzolanicreaction resulting from higher cement replacement byzeolite. Hence, although adding zeolite as cementreplacement has a major e�ect on the strength improve-ment of zeolite-cemented sand, it should be limited to40% within the circumstances speci�ed in the presentstudy.
3.5. Small-scale 1g model testIn the second part of this study, a series of small-scale 1g model tests were conducted to evaluate thebehavior of strip foundation resting on the saturatedsand stabilized by a zeolite pad. Based on thecompressive strength test's results, the amount of 40%zeolite was determined as the optimum proportion toprecast the zeolite pads. Table 2 shows the propertiesof the constructed pads with curing time of 28 days forconducting physical model tests.
Figure 9 illustrates stress-settlement curve of the
2072 S. Salamatpoor et al./Scientia Iranica, Transactions A: Civil Engineering 25 (2018) 2063{2076
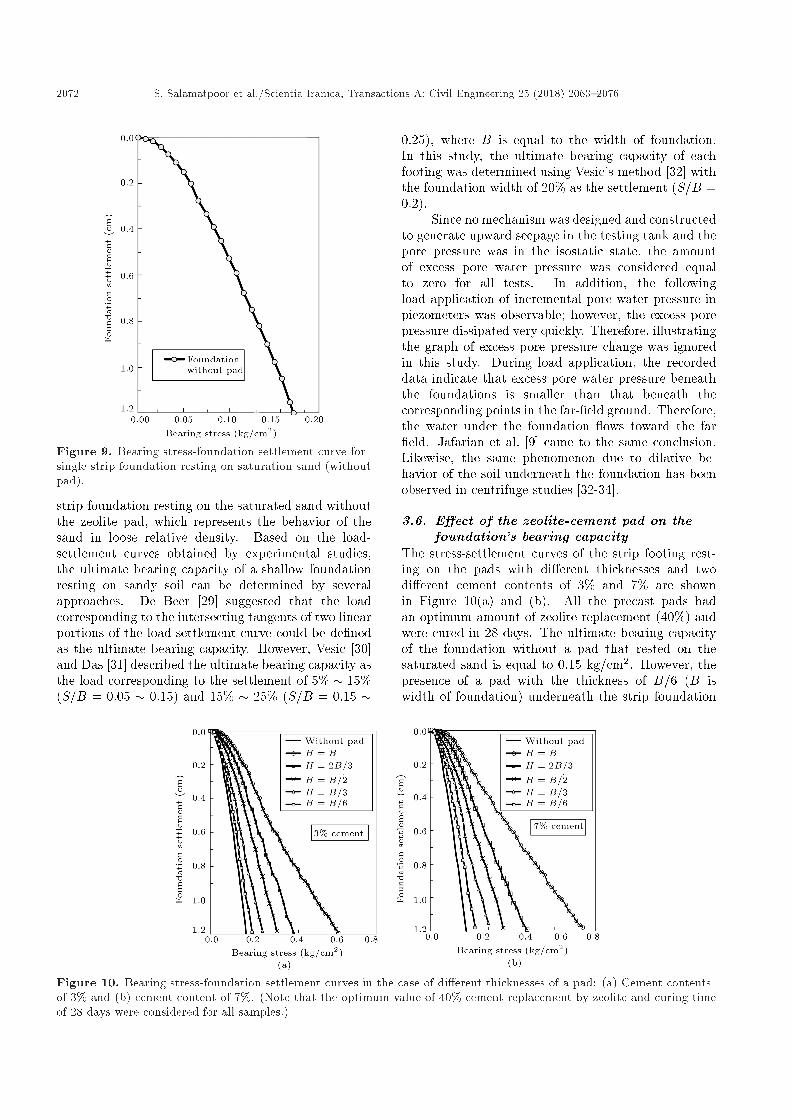
Figure 9. Bearing stress-foundation settlement curve forsingle strip foundation resting on saturation sand (withoutpad).
strip foundation resting on the saturated sand withoutthe zeolite pad, which represents the behavior of thesand in loose relative density. Based on the load-settlement curves obtained by experimental studies,the ultimate bearing capacity of a shallow foundationresting on sandy soil can be determined by severalapproaches. De Beer [29] suggested that the loadcorresponding to the intersecting tangents of two linearportions of the load-settlement curve could be de�nedas the ultimate bearing capacity. However, Vesic [30]and Das [31] described the ultimate bearing capacity asthe load corresponding to the settlement of 5% � 15%(S=B = 0:05 � 0:15) and 15% � 25% (S=B = 0:15 �
0:25), where B is equal to the width of foundation.In this study, the ultimate bearing capacity of eachfooting was determined using Vesic's method [32] withthe foundation width of 20% as the settlement (S=B =0:2).
Since no mechanism was designed and constructedto generate upward seepage in the testing tank and thepore pressure was in the isostatic state, the amountof excess pore water pressure was considered equalto zero for all tests. In addition, the followingload application of incremental pore water pressure inpiezometers was observable; however, the excess porepressure dissipated very quickly. Therefore, illustratingthe graph of excess pore pressure change was ignoredin this study. During load application, the recordeddata indicate that excess pore water pressure beneaththe foundations is smaller than that beneath thecorresponding points in the far-�eld ground. Therefore,the water under the foundation ows toward the far�eld. Jafarian et al. [9] came to the same conclusion.Likewise, the same phenomenon due to dilative be-havior of the soil underneath the foundation has beenobserved in centrifuge studies [32-34].
3.6. E�ect of the zeolite-cement pad on thefoundation's bearing capacity
The stress-settlement curves of the strip footing rest-ing on the pads with di�erent thicknesses and twodi�erent cement contents of 3% and 7% are shownin Figure 10(a) and (b). All the precast pads hadan optimum amount of zeolite replacement (40%) andwere cured in 28 days. The ultimate bearing capacityof the foundation without a pad that rested on thesaturated sand is equal to 0.15 kg/cm2. However, thepresence of a pad with the thickness of B=6 (B iswidth of foundation) underneath the strip foundation
Figure 10. Bearing stress-foundation settlement curves in the case of di�erent thicknesses of a pad: (a) Cement contentsof 3% and (b) cement content of 7%. (Note that the optimum value of 40% cement replacement by zeolite and curing timeof 28 days were considered for all samples.)
S. Salamatpoor et al./Scientia Iranica, Transactions A: Civil Engineering 25 (2018) 2063{2076 2073
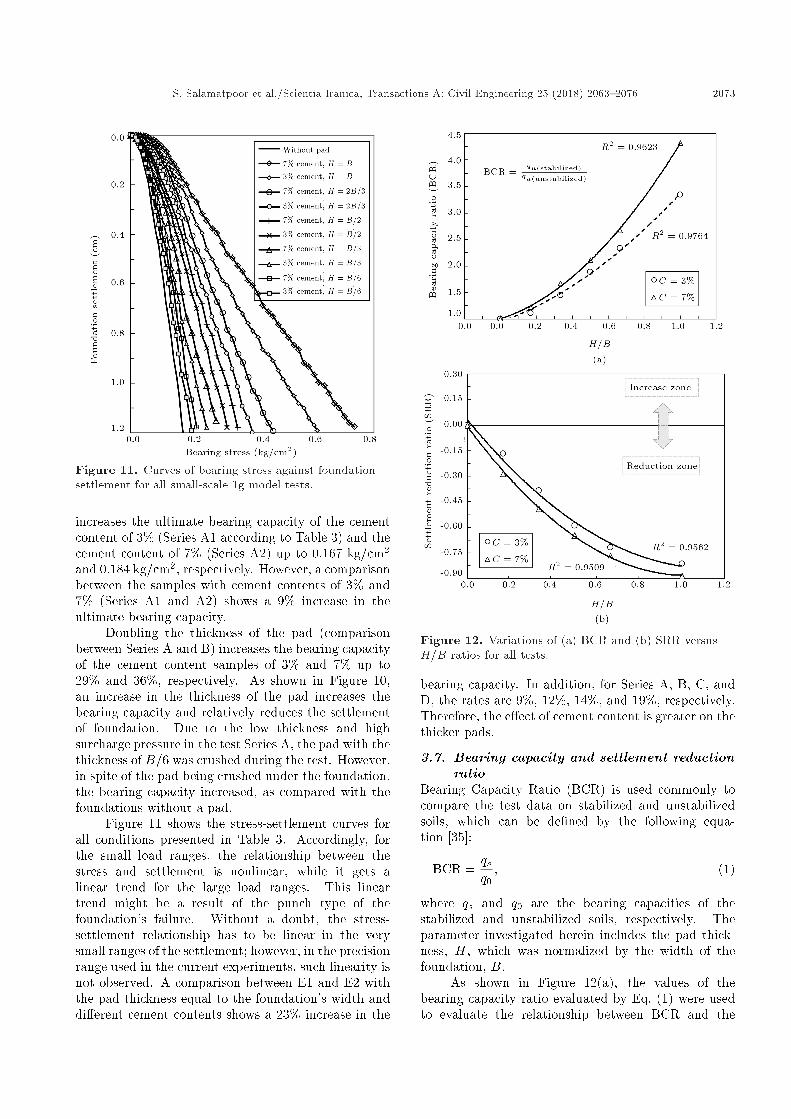
Figure 11. Curves of bearing stress against foundationsettlement for all small-scale 1g model tests.
increases the ultimate bearing capacity of the cementcontent of 3% (Series A1 according to Table 3) and thecement content of 7% (Series A2) up to 0.167 kg/cm2
and 0.184 kg/cm2, respectively. However, a comparisonbetween the samples with cement contents of 3% and7% (Series A1 and A2) shows a 9% increase in theultimate bearing capacity.
Doubling the thickness of the pad (comparisonbetween Series A and B) increases the bearing capacityof the cement content samples of 3% and 7% up to29% and 36%, respectively. As shown in Figure 10,an increase in the thickness of the pad increases thebearing capacity and relatively reduces the settlementof foundation. Due to the low thickness and highsurcharge pressure in the test Series A, the pad with thethickness of B=6 was crushed during the test. However,in spite of the pad being crushed under the foundation,the bearing capacity increased, as compared with thefoundations without a pad.
Figure 11 shows the stress-settlement curves forall conditions presented in Table 3. Accordingly, forthe small load ranges, the relationship between thestress and settlement is nonlinear, while it gets alinear trend for the large load ranges. This lineartrend might be a result of the punch type of thefoundation's failure. Without a doubt, the stress-settlement relationship has to be linear in the verysmall ranges of the settlement; however, in the precisionrange used in the current experiments, such linearity isnot observed. A comparison between E1 and E2 withthe pad thickness equal to the foundation's width anddi�erent cement contents shows a 23% increase in the
Figure 12. Variations of (a) BCR and (b) SRR versusH=B ratios for all tests.
bearing capacity. In addition, for Series A, B, C, andD, the rates are 9%, 12%, 14%, and 19%, respectively.Therefore, the e�ect of cement content is greater on thethicker pads.
3.7. Bearing capacity and settlement reductionratio
Bearing Capacity Ratio (BCR) is used commonly tocompare the test data on stabilized and unstabilizedsoils, which can be de�ned by the following equa-tion [35]:
BCR =qsq0; (1)
where qs and q0 are the bearing capacities of thestabilized and unstabilized soils, respectively. Theparameter investigated herein includes the pad thick-ness, H, which was normalized by the width of thefoundation, B.
As shown in Figure 12(a), the values of thebearing capacity ratio evaluated by Eq. (1) were usedto evaluate the relationship between BCR and the
2074 S. Salamatpoor et al./Scientia Iranica, Transactions A: Civil Engineering 25 (2018) 2063{2076
H=B ratio obtained from Table 3, where H=B is theratio of the pad thickness to the foundation width.Accordingly, an increase in H=B ratio results in theBCR increase. The value of BCR in the ratio ofH=B = 0 (in the case of a foundation without anypad, qs = q0) is equal to 1; further to that, thevalues for H=B = 0:16, H=B = 0:33, H=B = 0:5,H=B = 0:66, andH=B = 1 are equal to 1.22, 1.67, 2.12,2.67, and 4.23, respectively (with the cement content of7%). Moreover, an increase in cement content improvesBCR, whereas the impact of the di�erence between thecement contents of 3% and 7% is more pronounced athigher H=B ratios. The coe�cients of determinationvalues (R2) were greater than 0.95, indicating that theregression lines �t the data properly.
The values of Settlement Reduction Ratio (SRR)for all tests are plotted with the H=B ratio as presentedin Figure 12(b). The SRR is de�ned here as the ratio ofthe settlement of the pad-stabilized foundation to thatof the unstabilized foundation at a speci�ed footingpressure (q = 0:15 kg/cm2).
By placing a pad with the thickness of B=6(Series A2) beneath the foundation, the settlement ratereduces up to 26%, as compared to the condition inwhich there is no pad. For the values of H = B=3(test B2), H = B=2 (Series C2), H = 2B=3 (SeriesD2), and H = B (Series E2) with the cement contentof 7%, the SRR rates decrease up to 65%, 76%, and86%, respectively. Therefore, an increase in the H=Bratio leads to SRR reduction, and the data fall intothe reduction zone. In addition, the rates of SRRvariation for the cement contents of 3% and 7% arethe same for all the H=B ratios, containing a rangeof 6%. Therefore, although the e�ect of the cementcontent on the BCR is higher in the higher H=B ratio,it does not in uence SRR by increasing the H=B ratio.
4. Conclusion
In this study, two series of experiments were performedto investigate the impact of adding zeolite to thecemented sand. In the �rst series of experiments, 30uncon�ned compression strength tests were performedto determine the optimum proportion of zeolite in thecemented sand samples to cement contents of 3% and7% (relative to dry soil mass) and 0, 20, 40, 60, and80% replacements of cement by zeolite. In the secondseries of experiments, the sandy soil was stabilized bythe optimum amount of zeolite (40%) determined fromthe �rst series, and some small-scale 1g model testswere conducted to evaluate the behavior of the stripfoundations resting on the zeolite pad.
The following conclusions can be summarizedbased on the experimental results of this study:
1. Replacing cement by zeolite up to 40% (the op-
timum zeolite content) causes an increase in thecompressive strengths of the samples with curingtimes of 14 and 28 days up to 40% to 125%,respectively. This increase in the strength is dueto the pozzolanic activity of zeolite and a reductionin hydration reaction in this period;
2. In the case of 40% cement replacement by zeoliteand curing times of 14 and 28 days, specimens withmore cement content have a higher increase rate instrength and the higher zeolite e�ect;
3. Increasing the amount of cement from 3% to 7%leads to an increase in the strengths of zeolite andcemented sand from 2.5 to 2.93% in curing times of14 and 28 days, respectively. In addition, throughthe partial replacement of cement by zeolite, thebehavior of specimens changes from the brittle stateto plastic state at failure;
4. Compared with cemented sand, the compressivestrengths for blends with 60% replacement of ce-ment by zeolite and curing times of 14 and 28 daysincrease up to 2% and 9%. Therefore, sampleswith a 60% zeolite addition have higher strengththan cemented sand samples, whereas increasingthe amount of zeolite in samples with curing time of7 days decreases compressive strength linearly dueto the incomplete pozzolanic reaction;
5. Using a pad with the thickness of B=6 increasesthe bearing capacity of stabilized strip footing forthe pads with cement contents of 3% and 7% upto 11% and 23%, respectively, whereas increasingthe thickness of pad by 2 times (B=3) leads toincreasing the bearing capacity up to 44% and67%. As a result, utilizing pad beneath the stripfoundations resting on the saturated loose sandcauses an increase in the bearing capacity and areduction in the settlement;
6. Increasing the H=B ratio results in the increase ofthe BCR and a reduction in the SRR. Moreover,increasing the cement content causes an increase ofthe BCR rate up to 9% and 23% for H = B=6 toH = B states, respectively, whereas the SRR ratein this range is constantly 6%.
Nomenclature
B Width of foundationBCR Bearing Capacity RatioC Cement contentCu Coe�cient of uniformityDr Relative densityD50 Mean e�ective diameterGs Speci�c gravity
S. Salamatpoor et al./Scientia Iranica, Transactions A: Civil Engineering 25 (2018) 2063{2076 2075
qs Bearing capacity of foundation restingon stabilized sand (pad)
q0 Bearing capacity of foundation restingon unstabilized sand (without pad)
qu Uncon�ned compressive strengthR2 Coe�cient of variationSRR Settlement Reduction RatioZ Replacement of cement by zeolite( d)max Maximum dry unit weight( d)min Minimum dry unit weight
References
1. Mehta, P.K. \Reducing the environmental impact ofconcrete", Concrete International, 23(10), pp. 61-66(2001).
2. Damtoft, J.S., Lukasik, J., Herfort, D., Sorrentino,D., and Gartner, E.M. \Sustainable development andclimate change initiatives", Cement and Concrete Re-search, 38(2), pp. 115-127 (2008).
3. Khajeh, A., Mola-Abasi, H., and Naderi Semsani,S. \Parameters controlling tensile strength of zeolitecemented sands", Scientia Iranica A (In Press). DOI:10.24200/sci.2017.4585.
4. Perraki, T., Kakali, G., and Kontoleon, F. \The e�ectof natural zeolites on the early hydration of Port-land cement", Microporous and Mesoporous Materials,61(1-3), pp. 205-212 (2003).
5. Caputo, D., Liguori, B., and Colella, C. \Someadvances in understanding the pozzolanic activity ofzeolites: The e�ect of zeolite structure", Cement andConcrete Research, 30(5), pp. 455-462 (2008).
6. Canpolat, F., Y�lmaz, K., Kose, M.M., Sumer, M.,and Yurdusev, M.A. \Use of zeolite, coal bottomash and y ash as replacement materials in cementproduction", Cement and Concrete Research, 34(5),pp. 731-735 (2004).
7. Tuncan, A., Tuncan, M., Koyuncu, H., and Guney,Y. \Use of natural zeolites as a land�ll liner", WasteManagement & Research, 21(1), pp. 54-61 (2003).
8. Jafarian, Y., Mehrzad, B., Lee, C.J., and Haddad,A.H. \Centrifuge modeling of seismic foundation-soil-foundation interaction on lique�able sand", Soil Dy-namics and Earthquake Engineering, 97, pp. 184-204(2017).
9. Jafarian, Y., Haddad, A., and Mehrzad, B. \Load-settlement mechanism of shallow foundations restedon saturated sand with upward seepage", InternationalJournal of Geomechanics, 17(3), pp. 1-14 (2016).
10. Dash, S.K., Krishnaswamy, N.R., and Rajagopal,K. \Bearing capacity of strip footings supported ongeocell-reinforced sand", Geotextiles and Geomem-branes, 19(4), pp. 235-256 (2001).
11. ASTM D422 \Standard test method for particle-sizeanalysis of soils", ASTM International, West Con-shohocken, PA (2003).
12. Jafarian, Y., Ghorbani, A., Salamatpoor S. andSalamatpoor, S. \Monotonic triaxial experiments toevaluate steady-state and liquefaction susceptibilityof Babolsar sand", Journal of Zhejiang UniversityScience-A, 14(10), pp. 739-750 (2013).
13. Jafarian, Y., Javdanian, H., and Haddad, A. \Dynamicproperties of calcareous and siliceous sands underisotropic and anisotropic stress conditions", Soils andFoundations, 58(1), pp. 172-184 (2018).
14. Salamatpoor, S. and Salamatpoor, S. \Evaluation ofBabolsar sand behaviour by using static triaxial testsand comparison with case history", Open Journal ofCivil Engineering, 4(3), pp. 181-197 (2014).
15. ASTM C150/C150M-17 \Standard speci�cation forPortland cement", ASTM International, West Con-shohocken, PA (2017).
16. ASTM C114-11 \Standard test methods for chemicalanalysis of hydraulic cement", ASTM International,West Conshohocken, PA (2011).
17. ASTM D2166 \Standard test method for uncon�nedcompressive strength of cohesive soil", ASTM Interna-tional, West Conshohocken, PA (2006).
18. Ladd, R.S. \Preparing test specimens using undercompaction", Geotechnical Testing Journal, 1(1), pp.16-23 (1978).
19. Liu, C. and Evett, J.B., Soils and Foundations, 4thEdn., Pearson Education, New Jersey (2004).
20. ASTM D1194-72 \Standard test method for bearingcapacity of soil for static load and spread footings",ASTM International, West Conshohocken, PA (1987).
21. Wood, D.M., Geotechnical Modeling, E. & F.N. SponPress, London (2004).
22. Vargas-Monge, W. \Ring shear tests on large deforma-tion of sand", Ph.D. thesis, University of Tokyo (1998).
23. Bishop, A.W., Green, G.E., Garga, V.K., Andresen, A.and Brown, J.D. \A new ring shear apparatus and itsapplication to the measurement of residual strength",G�eotechnique, 21(4), pp. 273-328 (1971).
24. Kagawa, T. \On the similitude in model vibration testsof earth structures", In Proceedings on Japan Societyof Civil Engineers, pp. 69-77 (1978).
25. Iai, S. \Similitude for shaking table tests on soil-structure- uid model in 1g gravitational �eld", Soilsand Foundations, 29(1), pp. 105-118 (1989).
26. Towhata, I., Earthquake Geotechnical Engineering,Springer, Berlin (2007).
27. Otsubo, M., Towhata, I., Hayashida, T., Liu, B. andGoto, S. \Shaking table tests on liquefaction mitiga-tion of embedded lifelines by back�ll with recycledmaterials", Soils and Foundations, 56(3), pp. 365-378(2016).
2076 S. Salamatpoor et al./Scientia Iranica, Transactions A: Civil Engineering 25 (2018) 2063{2076
28. Mitchell J.K. \Soil improvement-State-of-the-art re-port", In Proceedings of the 10th International Confer-ence on Soil Mechanics and Foundation Engineering,Balkema, Rotterdam, Netherlands, pp. 509-565 (1981).
29. De Beer, E.E. \Experimental determination of theshape factors and the bearing capacity factors of sand",G�eotechnique, 20(4), pp. 387-411 (1970).
30. Vesic, A.S. \Analysis of ultimate loads of shallowfoundations", Journal of the Soil Mechanics and Foun-dations Division, 99(1), pp. 45-73 (1973).
31. Das, B.M., Shallow Foundations: Bearing Capacityand Settlement, 2nd Edn., CRC Press (2009).
32. Liu, L. and Dobry, R. \Seismic response of shallowfoundation on lique�able sand", Journal of Geotech-nical and Geoenvironmental Engineering, 123(6), pp.557-567 (1997).
33. Adalier, K., Elgamal, A., Meneses, J. and Baez, J.I.\Stone columns as liquefaction counter measure innon-plastic silty soils", Soil Dynamics and EarthquakeEngineering, 23(7), pp. 571-584 (2003).
34. Dashti, S., Bray, J.D., Pestana, J.M., Riemer, M.and Wilson, D. \Mechanisms of seismically inducedsettlement of buildings with shallow foundations onlique�able soil", Journal of Geotechnical and Geoen-vironmental Engineering, 136(1), pp. 151-164 (2010).
35. Binquet, J. and Lee, K.L. \Bearing capacity tests onreinforced earth slabs", Journal of the GeotechnicalEngineering Division, 101(12), pp. 1241-1255 (1975).
Biographies
Sina Salamatpoor is currently a PhD candidate inGeotechnical Engineering at Islamic Azad Universityof Najafabad, Iran. He also received his BSc (2010)and MSc (2012) degrees in Civil Engineering fromIslamic Azad University (Ayatollah Amoli Branch) andGeotechnical Engineering from University of Guilan,Iran, respectively. He has been working from 2010to the present time on projects as a structural andgeotechnical consulting engineer in various construc-tion companies. Subsequently, he was awarded the�rst rank in 2012 among the Civil Engineers in Mazan-daran Construction Engineering Organization, Iran.
His research interests include testing and modeling ofgeotechnical materials, �nite-element modeling, andits applications to geotechnical engineering, numericaland experimental investigations of soil improvement,advance soil mechanic, soil liquefaction, geotechnicalearthquake engineering, foundation engineering andgeo-engineering education. To date, he has publishedvarious scienti�c papers in journals and conferences asan author or co-author.
Yaser Jafarian is currently the faculty member ofInternational Institute of Earthquake Engineering andSeismology (IIEES). He started the academic activityas an Assistant Professor at the Civil Engineering De-partment of Semnan University since 2009 and, then,moved to IIEES. His professional research �elds involvemultiple areas of geotechnical earthquake engineeringincluding dynamic soil properties, soil liquefaction,seismic stability and displacement of earth slopes, prob-abilistic geohazard analysis, and dynamics analysis ofseafront structures. Currently, he has focused on phys-ical and numerical modeling of foundations and quaywalls tolerating large seismic ground deformations suchas liquefaction condition. He has also been involved inanalysis and design of various routine and complicatedprojects including geotechnical site investigation, soilimprovement (micropile, stone column, nailing, etc.),analysis and design of marine geotechnical structures(breakwater, quay walls, etc.). Dr. Jafarian publishedhis researches' outcomes in more than 25 journalpapers, 40 conference proceedings, and 4 technicalreports.
Alborz Hajiannia is an Assistant Professor at theDepartment of Civil Engineering in Islamic Azad Uni-versity of Najafabad, Iran. He received his MSc (2000)and PhD (2012) degrees in Geotechnical Engineeringfrom Amirkabir University of Technology. His researchinterests are numerical and experimental investigationsof soil improvement, advance soil mechanic, geotechni-cal earthquake engineering, slope stability, and founda-tion engineering.