Improving Productivity, Cycle Time, and Operating Performance
49
Improving Productivity, Cycle Time, and Operating Performance By: Fletcher L. Groves, III Vice President SAI Consulting
-
Upload
caesar-mcclure -
Category
Documents
-
view
24 -
download
1
description
Improving Productivity, Cycle Time, and Operating Performance. By: Fletcher L. Groves, III Vice President SAI Consulting. FastForward ™. Where is the homebuilding industry headed over the next five to ten years? - PowerPoint PPT Presentation
Transcript of Improving Productivity, Cycle Time, and Operating Performance

Improving Productivity, Cycle Time, and Operating
Performance
By:
Fletcher L. Groves, III
Vice President
SAI Consulting

FastForward™
Where is the homebuilding industry headed over the next five to ten years?
How will the industry handle issues like competition, growth, consolidation, alternative delivery systems, and
integrated value streams?

An Industry Perspective
Reference PointOur Survey of
Management Practices in the Homebuilding Industry
� Cycle Time� Growth Strategies� Consolidation� Supply Chain
Management� Value Disciplines� Customization� Recruiting, Rewarding,
and Retaining Management

“What is your mid-term (five to seven year) estimate of the number of homebuilding companies that will be
active in the markets you serve?”- 1999 Reference Point survey
4549
3538
20
13
0
10
20
30
40
50
60
1997 1999
FewerSameMore

“Within the same timeframe, where do you think your own operation will be?”
- 1999 Reference Point survey
6871
3027
3 20
10
20
30
40
50
60
70
80
1997 1999
Larger
No Change
Smaller

“What will be the primary contributor to your growth?”- 1999 Reference Point survey
41
21
39
00
5
10
15
20
25
30
35
40
45
Overall
Geographic Expansion
New Market ShareAdditional Market Share
Vertical Integration

“What will be the primary contributor to your growth?”- 1999 Reference Point survey
63
30
38
0
60
4338
10
19
0 0 00
10
20
30
40
50
60
70
Custom/Semi-Custom Semi-Production Production
Geographic Expansion
New Market ShareAdditional Market Share
Vertical Integration

“Long-term (beyond 10 years), can you see the type of drastic consolidation in local homebuilding operations
that has occurred in other industries?”- 1999 Reference Point survey
55
71
77
46
29
23
0 10 20 30 40 50 60 70 80 90
Custom/Semi-Custom
Semi-Production
Production
No
Yes

“Long-term, can you foresee the type outright circumvention of established delivery systems that has
occurred in other industries?”- 1999 Reference Point survey
46
50
58
55
50
42
0 10 20 30 40 50 60 70
Custom/Semi-Custom
Semi-Production
Production
NoYes

“Long-term, do you see homebuilding companies taking the lead in managing all of the activities that go into the
process of creating the housing product?”- 1999 Reference Point survey
82
71
83
18
29
17
0 20 40 60 80 100
Custom/Semi-Custom
Semi-Production
Production
No
Yes

What does it all mean?
� The demand for housing cannot profitably support this aggregate level of anticipated growth.
� The untapped opportunity is in vertical integration.
� The battle will increasingly be fought over productivity-driven improvements in operating performance.

I. Making the Connection
The relationship between Productivity, Cycle Time, and Operating
Performance.
The impact of faster Cycle Time on the operation of a homebuilding
company.

II. Seeing the Big Picture
Improvement is a process - not a destination.
Understanding what it is you are trying to improve - and how you will measure
your progress.
The right approach.

III. Getting Horizontal
The process perspective.
Eliminating non-value-added work from operating processes and freeing
capacity.
Making the rest of the work flow evenly and continuously.

IV. Getting Results
Finding the constraint.
Managing the constraint and improving its performance.
More-for-Less: Taking advantage of the improvement in productivity.
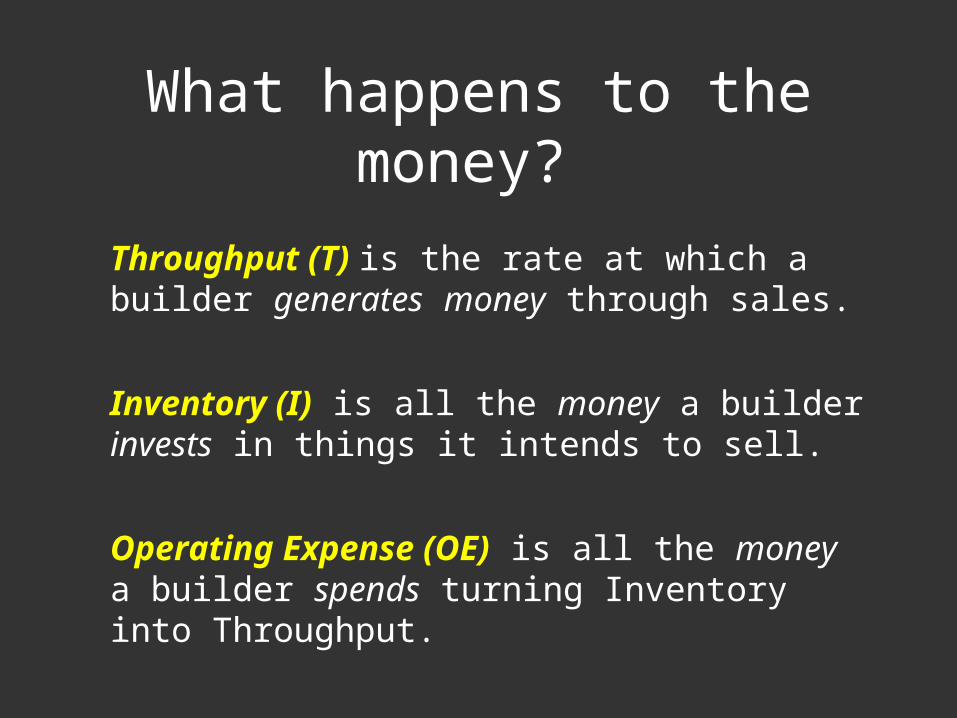
What happens to the money?
� Throughput (T) is the rate at which a builder generates money through sales.
� Inventory (I) is all the money a builder invests in things it intends to sell.
� Operating Expense (OE) is all the money a builder spends turning Inventory into Throughput.

Productivity
� Productivity is the ratio between Throughput (Contribution) and Operating Expense - the ratio between money generated and money spent.
� It increases when you produce the same revenue at a lower fixed cost, or more revenue at the same fixed cost.
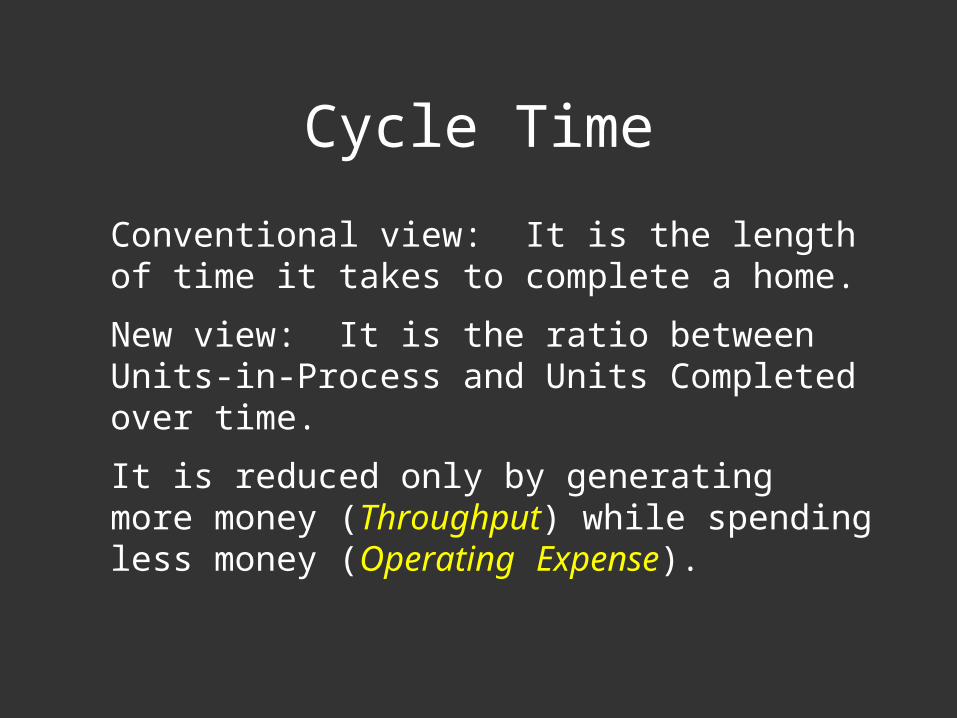
Cycle Time
� Conventional view: It is the length of time it takes to complete a home.
� New view: It is the ratio between Units-in-Process and Units Completed over time.
� It is reduced only by generating more money (Throughput) while spending less money (Operating Expense).

Operating Performance
� Operating Performance is determined by the impact of operational decisions on Throughput, Inventory, and Operating Expense.
� It improves whenever Throughput is increased and Inventory and Operating Expense are decreased.

Crucial Connections
� Productivity, Cycle Time, and Operating Performance are linked by Cause-and-Effect - they mean nothing apart from one another.
� They are also linked by their common elements - Throughput, Inventory, and Operating Expense.

Cause-and-Effect
When Cycle Time gets . . .longer . . . shorter . . .
Throughput
BacklogWorking CapitalWork-in-Process
Operating Expense

Building faster . . .
. . . reduces Cost - both variable and fixed
. . . increases Production Capacity
. . . improves Cash Flow
. . . reduces Working Capital Requirements
. . . reduces Work-in-Process
. . . improves Quality and On-Time Delivery
. . . shortens Lead Time
. . . increases NOI and ROA

“From contract to closing, how long does it typically take your company to complete a home?”
- 1999 Reference Point study
160
209
150
170
127
151
0 50 100 150 200 250
1997 Overall = 141days
1999 Overall = 168days
Production
Semi-Production
Custom/Semi-Custom

“How long does it take your company to complete work in the following sub-processes?”
- 1999 Reference Point survey
41
38
38
54
119
105
126
145
0 50 100 150 200 250
Overall
Production
Semi-Production
Custom/Semi-Custom
Contract-to-StartStart-to-CompletionCompletion-to-Closing

The Problem with Estimates
Estimates are not accurate - builders almost always under-estimate their cycle times.
Estimates tend to reflect averages, and average cycle time is not a useful
measure.
Estimates and averages do not provide any useful insight into Operating Performance
and Productivity.
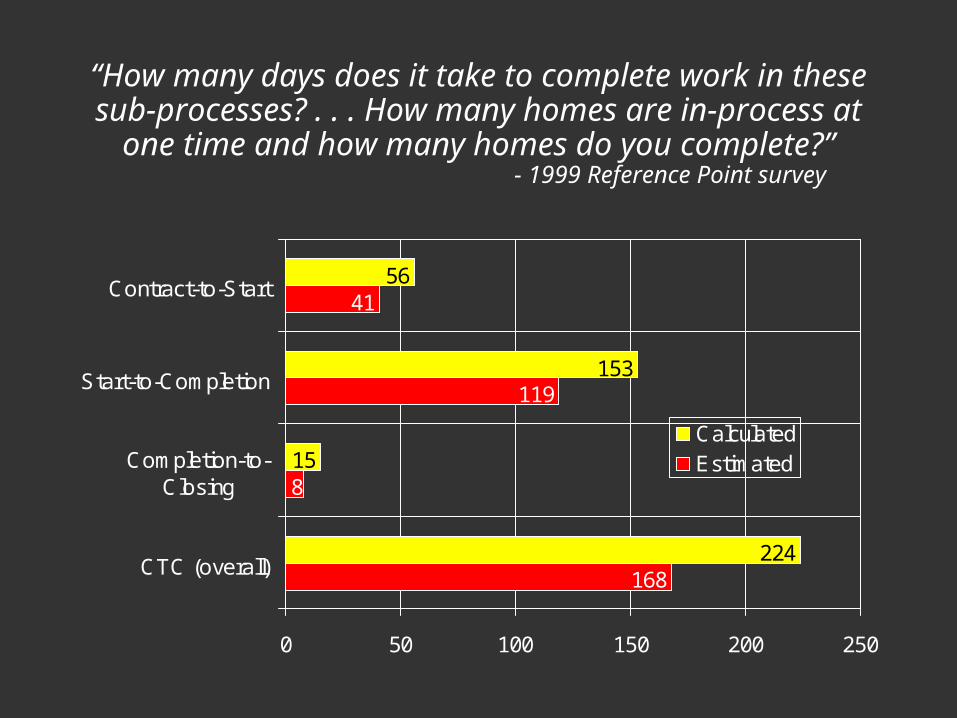
“How many days does it take to complete work in these sub-processes? . . . How many homes are in-process at
one time and how many homes do you complete?”- 1999 Reference Point survey
168
8
119
41
224
15
153
56
0 50 100 150 200 250
CTC (overall)
Completion-to-Closing
Start-to-Completion
Contract-to-Start
CalculatedEstimated
Calculating Cycle Time

Calculating Cycle Time in the Contract-to-Closing Process
(Contract-to-Start)
(90 + 96) ÷ 47 x 30 = 59 days 2
(Start-to-Completion)
(228 + 243) ÷ 47 x 30 = 150 days
2
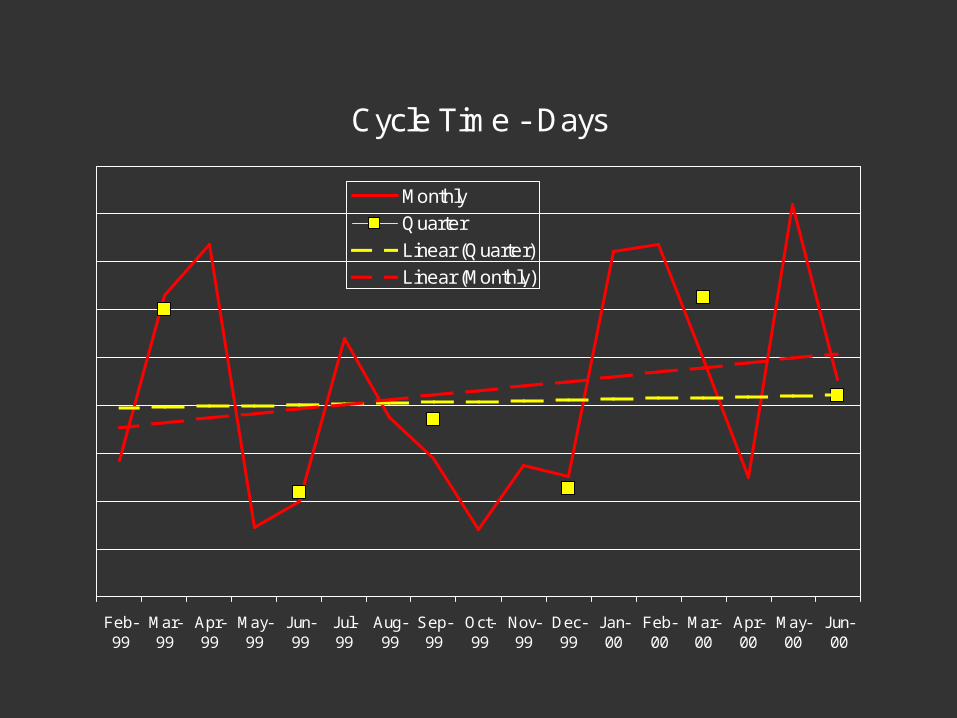
Cycle Time - Days
Feb-99
Mar-99
Apr-99
May-99
Jun-99
Jul-99
Aug-99
Sep-99
Oct-99
Nov-99
Dec-99
Jan-00
Feb-00
Mar-00
Apr-00
May-00
Jun-00
Monthly
Quarter
Linear (Quarter)
Linear (Monthly)

Inventory and Throughput
Feb-99
Mar-99
Apr-99
May-99
Jun-99
Jul-99
Aug-99
Sep-99
Oct-99
Nov-99
Dec-99
Jan-00
Feb-00
Mar-00
Apr-00
May-00
Jun-00
Homes-under-Construction
Closings
Linear (Closings)
Linear (Homes-under-Construction)

Inventory Starts, Sales, and Closings
Feb-99
Mar-99
Apr-99
May-99
Jun-99
Jul-99
Aug-99
Sep-99
Oct-99
Nov-99
Dec-99
Jan-00
Feb-00
Mar-00
Apr-00
May-00
Jun-00
Starts SalesClosings Linear (Sales)
Linear (Starts) Linear (Closings)

Get Horizontal
Processes are the only means by which work is performed and value is created.
The process-centered view is a complete departure from the perspective of most
homebuilders.
Performance improvement starts with the design of your processes.
Change the Way You Work
Eliminate the non-value-added work, free capacity, and make the rest of the work
flow evenly and continuously.
� Focus on the outcomes that meet the buyer’s expectations and eliminate the non-value-added work.
� Create simple processes and populate them with complex tasks.

� Eliminate the stop-and-start, hurry-up-and-wait sequence of work - replace it with a system that produces sales, starts, and closings at a level and continuous rate.
� Stop pushing product through the system - use the productivity gained from even-flow production to reduce dependence on inventory starts to meet production requirements.

� Stop pushing designs into the market - which increases cost and lead time - by only producing the plan designs that buyers order when they order it.
� Move from a vertical functional structure to a horizontal, team-based structure aligned with the flow of work.
� Set specific performance requirements for processes and make the connection with better operating performance.
� Design your processes to meet the specific requirements of a narrowly defined market of buyers.
� Processes don’t perform work - you need to pay just as much attention to the “why” and the “want-to” as you do to the “what” and the “how-to”.

The Improvement Process
The process for improving something requires you to find the answers to three
questions:
What to change?
What to change to?
How to make the change?

“How long does it take you to complete a home? How many days could the CTC process be shortened?”
1999 Reference Point survey
32
43
76
151
170
209
0 50 100 150 200 250
Production
Semi-Production
Custom/Semi-Custom
CTC length
CTC shortened
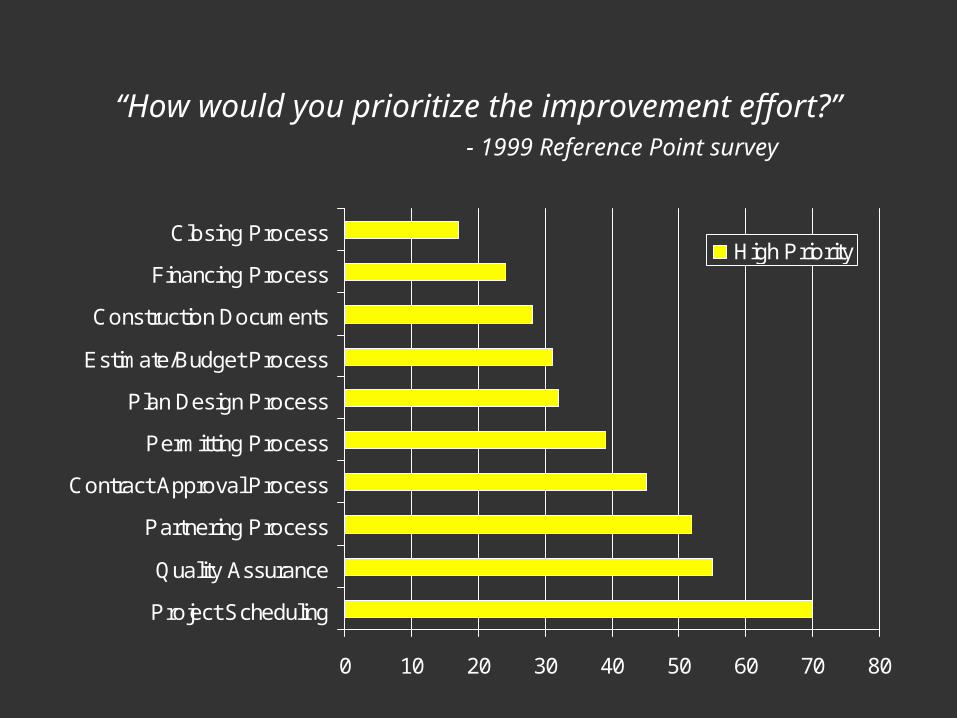
“How would you prioritize the improvement effort?”- 1999 Reference Point survey
0 10 20 30 40 50 60 70 80
Project Scheduling
Quality Assurance
Partnering Process
Contract Approval Process
Permitting Process
Plan Design Process
Estimate/Budget Process
Construction Documents
Financing Process
Closing ProcessHigh Priority

“If you started a project to improve cycle time, how would you allocate resources to the effort?”
- 1999 Reference Point survey
0 5 10 15 20
Project Scheduling
Quality Assurance
Partnering Process
Contract Approval Process
Permitting Process
Plan Design Process
Estimate/Budget Process
Construction Documents
Financing Process
Closing Process
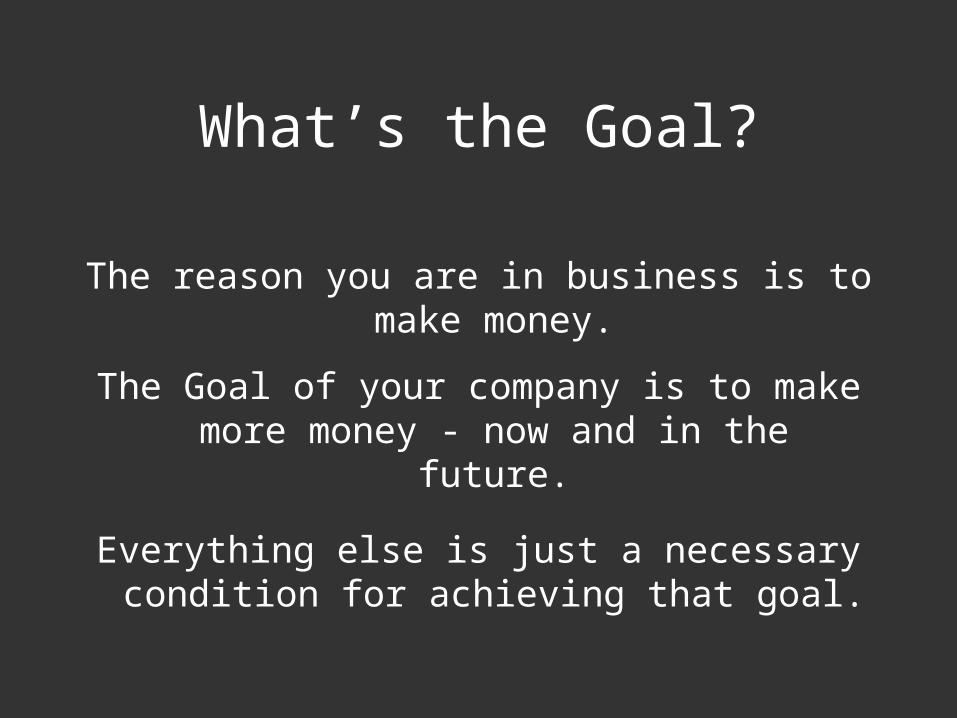
What’s the Goal?
The reason you are in business is to make money.
The Goal of your company is to make more money - now and in the future.
Everything else is just a necessary condition for achieving that goal.

Measuring Progress
How do you measure progress or - in operational terms - what does it mean to
“make more money”?
Increasing Contribution (Throughput)
Reducing Inventory
Leveraging the investment in Fixed (Operating) Expense

Resolving Conflicts
� In order to “make money”, you have to make the best operating decisions regarding Throughput (Contribution), Inventory, and Operating Expense.
� If you are faced with a decision in which two or more of these measures are in conflict - make the decision that has the best impact on Throughput.
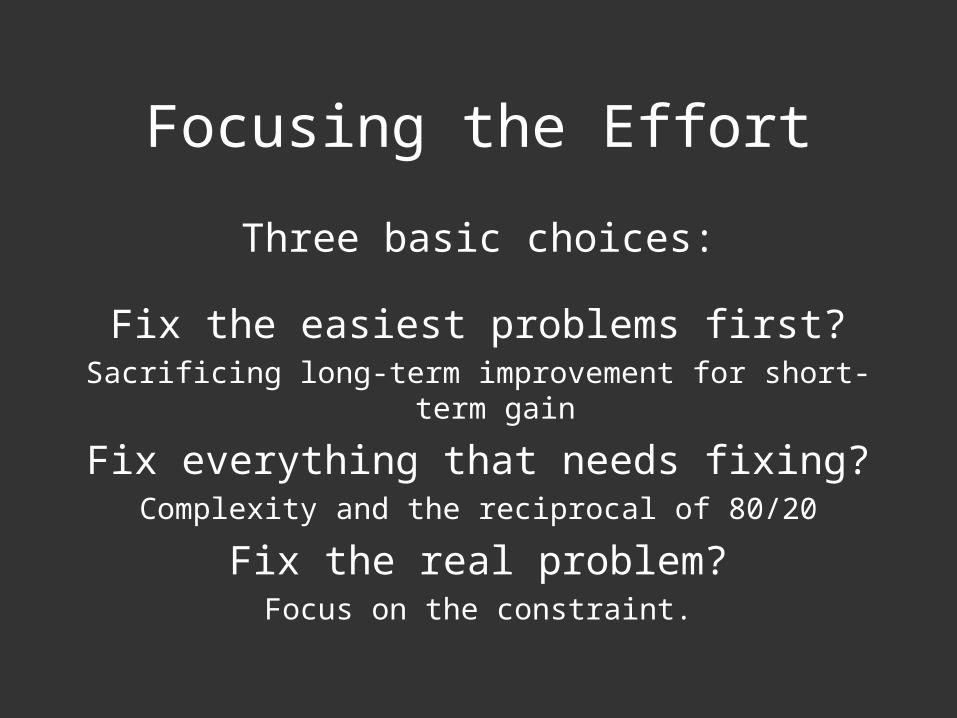
Focusing the Effort
Three basic choices:
Fix the easiest problems first?Sacrificing long-term improvement for short-term gain
Fix everything that needs fixing?Complexity and the reciprocal of 80/20
Fix the real problem?Focus on the constraint.

Systems as Chains

Understanding Constraints
Every homebuilding company has at least one constraint - and probably only one
constraint.
The constraint is usually the company’s core problem - the root cause of most of
the visible symptoms.

You have to know what the constraint is, and where it is located.
Constraints can be logistical, managerial, or behavioral.
Constraints can be external or internal.
Once you understand what the constraint is - and where it is located - you have to
eliminate it or manage it.

Final Thoughts
� Make the Connection.
� Improvement is a process - not a destination.
� Eliminate non-value-added work and make the rest of the work flow.
� Find the weakest link- make it stronger.
� Do more for less.

Questions and Information:
Fletcher Groves is a Vice President with SAI Consulting. He can be reached at (904) 273-9840, or by e-mail