Improving Order Picking Processes through Proper Storage ...
34
This thesis comprises 15 ECTS credits and is a compulsory part in the Bachelor of Science with a Major in Industrial Engineering – International Business Engineering, 180 ECTS credits No. 2016.14.02 Improving Order Picking Processes through Proper Storage Assignment Using results from previous mathematical research to simplify solving real life problems Markus Patoka
Transcript of Improving Order Picking Processes through Proper Storage ...

This thesis comprises 15 ECTS credits and is a compulsory part in the Bachelor of Science
with a Major in Industrial Engineering – International Business Engineering, 180 ECTS credits
No. 2016.14.02
Improving Order Picking Processes through Proper
Storage Assignment Using results from previous mathematical research to
simplify solving real life problems
Markus Patoka

ii
Improving order picking processes through proper storage assignment
Markus Patoka, [email protected]
Bachelor thesis
Subject Category: Technology
University of Borås School of Engineering SE-501 90 BORÅS Telephone +46 033 435 4640
Examiner: Sara Lorén
Supervisor,name: Agnes Andersson Wänström
Supervisor,address: Allégatan 1
501 90 Borås
Client: Ateljé Margaretha AB
Date: 2016-03-27
Keywords: Order picking, replenishment activity, storage assignment, slotting, forecasting

iii
Abstract
The area of order picking has been widely studied but still there is no general approach covering all the potential variables of a unique case. Optimizing the product placement is a useful way to improve order picking through reduced travel distances and goes hand in hand with an appropriate batching strategy and routing policy. The existing methods are of mathematical basis and can be costly to implement and it is therefore necessary to develop a non-mathematical approach that can be used for distribution centers and in this particular case, the warehouse of a mail order company. Literature is reviewed to investigate the current situation of a large Swedish mail order retailer for the development of a unique product assignment strategy, taking into consideration potential variables. It was found out that a lot of trade-offs are being done all the time between travel distances of the SKUs. Also, it was found out that “cart blocking” might be a potential problem when using a turnover-based storage assignment strategy.
Keywords: Order picking, replenishment activity, storage assignment, slotting, forecasting

iv
Contents
1. Introduction ....................................................................................................................... 1
1.1 Purpose ........................................................................................................................ 1
1.2 Problem formulation .................................................................................................... 2
1.3 Limitations .................................................................................................................... 2
1.4 About the company ...................................................................................................... 2
1.5 Disposition .................................................................................................................... 3
2. Theoretical framework ...................................................................................................... 3
2.1 The concept of flow...................................................................................................... 4
2.1.1 Information flow ................................................................................................. 4
2.1.2 The flow of materials .......................................................................................... 5
2.1.3 Storage and handling of materials...................................................................... 5
2.2 ABC analysis and the 80/20 rule .................................................................................. 5
2.3 Order picking ................................................................................................................ 6
2.3.1 Proper slotting and storage assignment............................................................. 7
2.3.2 Routing policies................................................................................................... 9
2.3.3 Studies of order picking .................................................................................... 10
2.3.4 The problem of congestion ............................................................................... 11
2.4 Forecasting ................................................................................................................. 11
3. Methodology ................................................................................................................... 12
3.1 Setting up the case study ........................................................................................... 12
3.2 Reliability and validity ................................................................................................ 13
4. Case company description .............................................................................................. 13
4.1 Storage policies .......................................................................................................... 13
4.2 The order picking process .......................................................................................... 16
4.3 Replenishment process .............................................................................................. 17
5. Analyzing the warehouse ................................................................................................ 18
5.1 Additional storage associated observations affecting OP ......................................... 21
5.2 Summarizing the analysis ........................................................................................... 22
6. Discussion ........................................................................................................................ 22
6.1 The thoughts behind the suggested arrangement .................................................... 24
6.2 Developing a storage assignment model ................................................................... 25
6.3 Potential savings ........................................................................................................ 27
7. Conclusion and further studies ....................................................................................... 28
8. References ....................................................................................................................... 28

1
1. Introduction
Every distribution center (DC) has incoming and outgoing goods. What happens between the walls of the warehouse is an ongoing process with multiple activities and the larger the warehouse is, the more planning of storage and movement of goods is required. According to Tompkins et al. (2010), order picking (OP) is the most critical function among the distribution operations. The operating expenses of OP is estimated to be 55% of a warehouse’s total operating expenses, as visualized in Figure 1.1, making it the highest-priority activity for increasing productivity within the warehouse. It is supposed that an order picker spends most of his time only travelling, thus the time can be reduced through proper routing, batching and storage policies. This paper will focus on product assignment related to OP.
The area of OP has been widely studied, but still there is a lack of studies considering all its potential variables. Mathematical approaches such as, for instance, order oriented slotting (OOS) by Heragu et al. (2007) has been developed but do not consider the product characteristics or the problem of congestion. Several comparisons have been made, by among others Ruben & Jacobs (1999) and Egas & Masel (2010), between various popular product assignment strategies like turnover-based strategies and product group strategies, but still leaves out the product profiles. Peterson & Aase (2004) compared the potential savings depending on how the OP process is designed to help managers with the decision making. The problem of assigning products into optimal locations might however be far more complex and contain a lot more variables than the researchers suggest. Also, the more complex a system is the more money is likely to be invested for a desired storage optimization model. As far as we know, there is no general approach of assigning products at any DC but any DC can be treated as a unique case. With the help of previous studies, non-mathematical slotting approaches are possible to develop by analyzing the current situation of a DC.
Typically, mail order retailer companies have a need of strategic product assignment because usually they do not manufacture. This leads to the fact that the received goods need proper storage locations to maximize the throughput and in general, there are some concepts that makes more sense to consider than others. If we can develop a basic model of things to consider, the model might as well be useful for any mail order company.
1.1 Purpose
The purpose of this report is to show possibilities of cutting costs in a warehouse with the use of proper product assignment. This thesis will create a model through the use of previous research without implementing any mathematical model. The model will then be tested on a DC to show the significance of strategic product assignment.

2
Figure 1.1 – Typical distribution of warehouse operating expenses (Tompkins et al, 2010)
1.2 Problem formulation
When pickers use a set routing and batching policy, it is the product assignment strategy that still can be improved. It is of interest to investigate the current situation in a warehouse that is using a pick and pack system to see how a suitable product assignment model can be built that can help with potential cost savings through quantitative and qualitative decision making. In this particular case, the warehouse of a large Swedish retailer is allowed to be investigated, to find out the current situation and to construct a unique storage strategy for this company.
The research questions as propellant for this thesis are:
How can product assignment be managed in this unique situation to cut costs?
What other factors can help supporting the product assignment?
Can we develop a slotting strategy for this unique case?
1.3 Limitations
The focus of this thesis is on improving the order picking process through strategic storage assignment without changing the current layout design inside the warehouse. The routing and batching policies will be studied because of its relations to product assignment but this paper will not suggest any changes to these. Neither will this paper look upon the opportunities of substituting any tools or equipment used for the picking operations.
1.4 About the company
Ateljé Margaretha (AM) AB is a large Swedish retailer company with its head office and distribution center (DC) located in the town of Borås, southwest Sweden. The company is mainly selling their products through e-commerce and mail order but also has a small store. The number of unique SKUs in the warehouse is estimated to be 8000. In 2014 the company had a turnover of 190 million SEK and a profit of 3 million. Their total assets are accounted
% of annual operating expense
3
to be around 113 million. About 70 people are working within the property, but the number varies due to seasonality.
The company was founded in 1959 by Curt Grozdics who launched the physical store in the city center of Borås selling needlecraft and knitting equipment. In 1989, Curt’s son Alf became the new owner. Throughout the years 1992-2004 the company expanded to Norway, Germany, Finland, Denmark and Austria and between the years 1995-2000, current CEO Mikael Rosendahl entered the position for AM Group for the first time to later return in 2005. The same year the company moved into a larger property in the edge of the town.
In 2007, AM Group acquired clothing firm Åshild Konfektion, making Henrik Falk deputy CEO and brand manager of Åshild. Later the same year, an acquisition of Linea needlecraft, a competitor of AM, was done and all assets and operations of Åshild and Linea were moved under the same roof. Until 2007/08 most sells had been made through mail order but now AM Group introduced the web shops for all three brands. Linea became a firm selling interior products using the old brand name.
As the DC today operates for three brands (or sales channels), distinctions are made inside the warehouse. Most products are grouped together by brand but some products are sold for several. The company has the last years experienced a large growth in volume and this puts pressure on the warehouse workers to plan and execute for the placement of incoming goods due to the space limitation. Currently, there are no guidelines set or tools used for assistance to execute the storage and slotting of products in a more optimal manner, but workers take qualitative decisions based on many years of earlier experience. The most common activity in the warehouse is the picking/packing of customer orders. Because of seasonal changes, the workforce in the warehouse can vary between 20-30 people, and during seasonal peaks it is extra significant that the processes flow efficiently.
1.5 Disposition
In this thesis we have the following content for each chapter:
2. Theoretical framework – The basic concepts are explained for a deeper understanding of the problem. In this section the reader learns about different approaches for solving various types of problems. 3. Methodology – The ideas from section 2 are used to create a strategy that will set the base for a model. The thoughts behind the decisions are explained. 4. Case company description – The findings of the case study are presented. 5. Analysis – The findings are discussed and examples of improvement areas are given. 6. Discussion – The improvement areas are used for the model. 7. Conclusion – The thesis is summarized and important findings are highlighted.
2. Theoretical framework
The literature chosen in this thesis is a mixture of books and scientific reports. Figure 2.1 has been created for this report and gives a holistic view of the concepts related to order picking (OP). In the center of Figure 2.1, the three most significant parts of the OP process creates a

4
wheel that turns to illustrate the ongoing process. Order batching, routing policy and storage assignment policy are all three interacting and this report focuses on the latter part. The wheel is furthermore affected by physical attributes like the warehouse design and equipment used, and information flows like forecasting and computer systems used. Each concept is explained in this theoretical framework and previous research backs up or rejects some of the statements from the books.
Figure 2.1 – Wheel of order picking. Several factors affect the order picking process.
2.1 The concept of flow
It is necessary to understand why flow is important. Creating an efficient flow of materials is by some the science of logistics. To succeed, not only the physical flow is to take into consideration. The information flow is needed in several ways to coordinate the flow of materials and provide data about storage capacity, sales forecasts and information about products, etc. A third type of flow is the monetary flow, but is not used in the plant’s internal activities. (Jonsson, 2008)
2.1.1 Information flow Enterprise resource planning (ERP) and warehouse management system (WMS) are both computer-based systems used to simplify the execution activities within a company or business. It may include various forms of planning for decision making such as forecasting, production planning or inventory management. The idea is also to integrate and link departments’ processes within the organization to keep a common vision and provide with quick access to information. The purpose computerized a system is to save money and a firm should consider the potential economical benefits of an implementation. (Jacobs et al, 2011) A distinction between the two is that ERP is more used as a departmental link to transfer information while WMS mainly focuses on intelligent warehouse optimization. (Jonsson, 2008)

5
Barcode systems are today highly used for quickly transmitting information in a WMS. A barcode is attached to an item for its identification and consists of a set of vertical lines. The lines form different alphanumeric or numeric characters depending on the thicknesses and the gaps between the lines. This information is read with a barcode reader, most likely a laser scanner. The scanners are used by material handlers to, for instance, move items around or register incoming goods. The system can then see the storage location and find valuable data about the product. (Jonsson, 2008)
2.1.2 The flow of materials Bartholdi & Hackman (2008) describe the supply chain as “the sequence of processes through which product moves from its origin towards the customer”. With this said, they furthermore present “The fluid model of material flow” which highlights a smooth flow based on little material handling and low inventory. According to Jonsson (2008) there are three main activities that make up the flow of materials in the logistics system: Transportation, handling and storage of materials. The internal transportation and handling of goods is called materials handling and all companies within the industry uses some type of material handling system (MHS). Next, different activities of a MHS are explained.
2.1.3 Storage and handling of materials A widely used word for a unique item is stock-keeping unit (SKU). The SKUs are of different cubic and used of different frequency. This is important information when designing the storage layout within the warehouse to keep handling costs low. The idea is to easily access the SKUs and at the same time fully utilize the storage area. (Jonsson, 2008) Designing a storage area often requires trade-offs between space utilization and access to the items stored. More of this follows in section 2.3.4.
Commonly used equipment for movement of goods is the forklift truck and the pallet jack. Both are used to move a pallet, which is a standard unit (varying geometry), with the difference that the forklift is electrically driven and can lift up to heights while the pallet jack is used by hand on a single plane. Bartholdi & Hackman (2008) describe three common types of storage:
The pallet rack – Allows for bulky storage or large quantities
The carton flow rack (gravity flow rack) – For high volume picking
Shelving – For lower volumes and slower picking
Furthermore the shelving can be separated into two types; bin-storage shelving and wide-span shelving. Items may vary in how they are shipped and some arrive in different unit cubes. Hence, all products can be stored in separate ways.
2.2 ABC analysis and the 80/20 rule
Prioritizing is important when it comes to material handling and it is for a firm to find a balance between products sold in high volumes or to the larger group of customers and products sold in lower volumes but are needed to attract more customers. In many cases only about 20% of the products account for as much as 80% of the profit contribution.

6
The ABC analysis is a tool used to classify the products to have an overview of what to prioritize. There are several criteria in how to classify the products, for example by profit contribution per product, volume value per item or purchase value per supplier, etc, over a period of time. (Jonsson, 2008)
Flores & Whybark (1987) highlight the need for multiple criteria when making an ABC analysis and mention the consideration of obsolescence, substitutability, lead time, availability and criticality. The latter word, criticality, is a qualitative decision that is taken on by the inventory manager. Results from their study show that good inventory management can be carried out without only focusing on the monetary contribution of each item.
2.3 Order picking
For distribution centers (DC), order picking is the most costly activity due to the travel time that comes along. Travel time is waste since it does not add any value to the customer and a reduction in travel time saves labor hours when retrieving orders. (Bartholdi & Hackman, 2008) A picking order is retrieval information for an order picker. Sometimes the picking order treats replenishment, whereas stored materials (boxes) could be moved downstream to the picking section. Picking orders might as well treat item picking, which is retrieval of SKUs to be carried to the packing area or directly to the shipping area. (Jonsson, 2008)
There are several order picking strategies to choose from when designing the picking area:
Discrete – Single OP assigned for only one picker
Batch – Several orders are composed into a batch assigned for one picker. This can be
divided into pick-and-sort batch picking, where the orders are sorted after they are
picked, and sort-while-pick batch picking, that usually is assisted with a pick cart with
separate compartments.
Zone – Each picker is only allowed to pick in the region that he is assigned. It is not
unusual that the pickers put the SKUs on a conveyor that transports the items to a
sorting area.
Bucket brigade – When the most downstream picker completes a cart he moves
upstream to take over the closest cart from another person. This person in turn
moves upstream to repeat the process.
The batch and zone picking strategies are the most common in today’s DCs. Parikh & Meller (2008) made a comparison between the two in a profitable perspective. Naturally, the former had higher expenses in cost of pickers while the latter had increasing expenses in the case of sorting costs. They stated that sort-while-pick batch picking is more useful when dealing with a low average of daily orders, zone picking is more useful with a high average, and that the numbers are quite equal with a medium average (in their study about 5 750 orders).
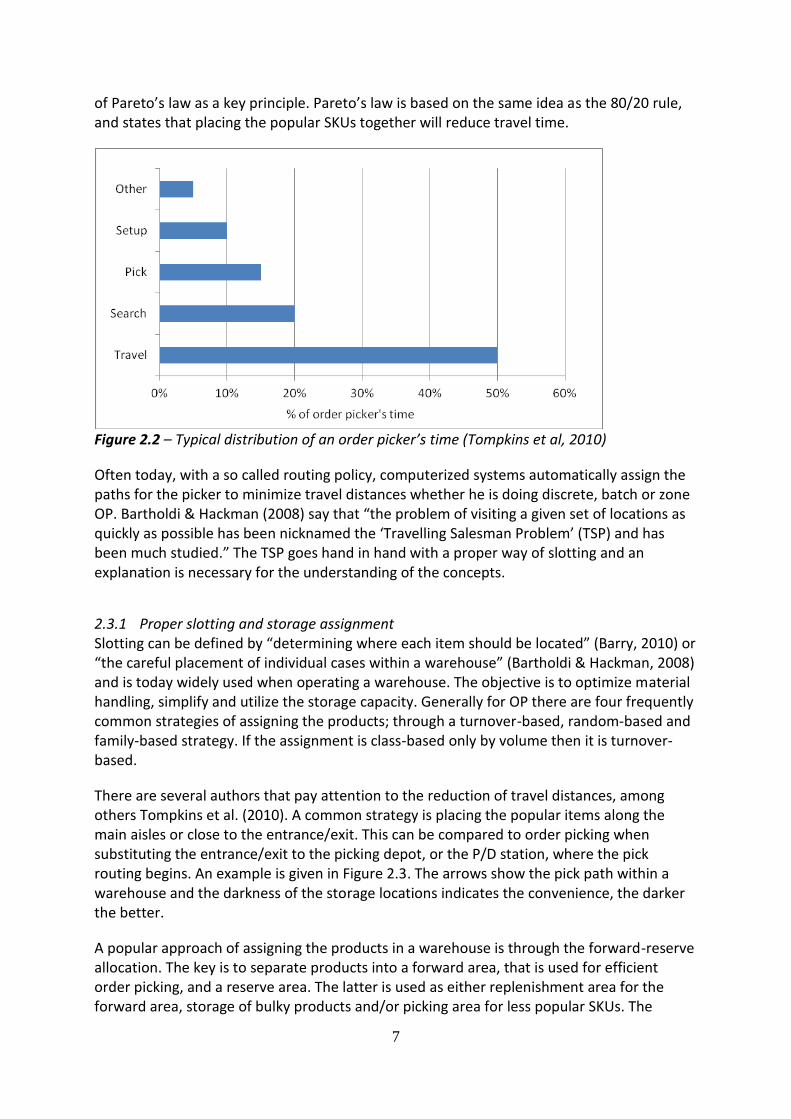
Tompkins et al. (2010) gives the information, found in Figure 2.2 that describes the different activities for an OP. Nearly 50% of the time spent by the OP is on travelling and the significance of slotting becomes obvious to save travel time. He also suggests the application
7
of Pareto’s law as a key principle. Pareto’s law is based on the same idea as the 80/20 rule, and states that placing the popular SKUs together will reduce travel time.
Figure 2.2 – Typical distribution of an order picker’s time (Tompkins et al, 2010)
Often today, with a so called routing policy, computerized systems automatically assign the paths for the picker to minimize travel distances whether he is doing discrete, batch or zone OP. Bartholdi & Hackman (2008) say that “the problem of visiting a given set of locations as quickly as possible has been nicknamed the ‘Travelling Salesman Problem’ (TSP) and has been much studied.” The TSP goes hand in hand with a proper way of slotting and an explanation is necessary for the understanding of the concepts.
2.3.1 Proper slotting and storage assignment Slotting can be defined by “determining where each item should be located” (Barry, 2010) or “the careful placement of individual cases within a warehouse” (Bartholdi & Hackman, 2008) and is today widely used when operating a warehouse. The objective is to optimize material handling, simplify and utilize the storage capacity. Generally for OP there are four frequently common strategies of assigning the products; through a turnover-based, random-based and family-based strategy. If the assignment is class-based only by volume then it is turnover-based.
There are several authors that pay attention to the reduction of travel distances, among others Tompkins et al. (2010). A common strategy is placing the popular items along the main aisles or close to the entrance/exit. This can be compared to order picking when substituting the entrance/exit to the picking depot, or the P/D station, where the pick routing begins. An example is given in Figure 2.3. The arrows show the pick path within a warehouse and the darkness of the storage locations indicates the convenience, the darker the better.
A popular approach of assigning the products in a warehouse is through the forward-reserve allocation. The key is to separate products into a forward area, that is used for efficient order picking, and a reserve area. The latter is used as either replenishment area for the forward area, storage of bulky products and/or picking area for less popular SKUs. The

8
problem is to find a balance between picking efficiency and replenishment activity through trade-offs between the size of the forward area, how many SKUs to be stored and in what quantities. Van den Berg et al. (1998) stated that it could be useful to assign some products to the reserve area even though the space in the forward area allows for more SKUs. A lot of labor time can be saved by giving popular products more space and consequently decrease replenishment activity.
Figure 2.3 – Convenient storage locations (Bartholdi, 2014)
Peterson & Schmenner (1999) claimed that the within-aisle volume-based (turnover-based) storage is the most useful of the several volume-based strategies, which means assigning all popular items into a few aisles and not only close to the P/D station. Later, Peterson & Aase (2004) made an experiment where they compared the selection of different batching, routing and storage policies. They stated that the selection of storage policy was by far most important since it yields most savings in travel time. A random-based strategy is not to prefer because it prolongs the travel distance.
Hansen & Gibson (2008) describe a couple of key factors to consider achieving efficient warehouse slotting. One is profiling, or knowing the data about your products (dimensions, weight, etc) to find out what type of storage medium (pallet, shelf, etc) and handling equipment is needed. For instance, placing bulky storage on a smaller shelf might result in frequent replenishment activity. In many warehouses there is a space limitation. This leads to the fact that the space available should be utilized. It is therefore not necessary to place small SKUs that are picked with low velocity in slots with large cubic.
Product velocity or picking frequency per SKU is a second important factor. Placing high-velocity SKUs in ergonomically friendly areas with ease of accessibility will reduce travel time and unnecessary movements. The travel distances are likely to be reduced when the high-velocity items are placed at the same location. However, concentrating popular SKUs too much adds a risk of congestion and inflexibility.
A third useful factor is the product families described by Bartholdi & Hackman (2008). Some SKUs are related to each other and are by that necessary to place together. For instance, if a large DC handles several sales channels there is no need to spread all associated items

9
through the whole warehouse. In other cases SKUs are of the same characteristics and need the same maintenance, for instance, groceries that need to be kept frozen or items that need special handling because of hazard.
An example of successful slotting occurred when a company called Tandy Brands decided to merge two of their facilities since a study had shown potential savings by eliminating one of them. A lot of products were about to be moved and the company needed a strategy for profiling and slotting. A significant part was that the company realized the need of balancing picking efficiency and replenishment frequency. Replenishment activities increases costs and are an important part to take into account when profiling SKUs. (InboundLogistics, 2010)
2.3.2 Routing policies An order picker starts off by picking up a pick list and a pick cart. The routing usually starts and terminates at the same spot, the P/D station. This is where the order picker empties or leaves his cart when finished and continues by picking up a new pick list. In order to minimize the total distance walked, there are several different routing policies to use. This problem is referred to TSP. (Tompkins et al, 2010)
Tompkins et al. (2010) further divides the order picking into two principal approaches; in-the-aisle OP and end-of-aisle OP. The former can be described as bringing the pick cart along into the aisles like a shopping cart in a grocery store. The latter principal is to leave the cart at the end of the aisle, then enter and pick one or several items to later remove them at the cart. Pick carts have finite capacity but can be designed in several ways. Carts can be designed for discrete OP when only one order is treated at a time while others are designed for batch picking. For instance, some separates the orders with several compartments in a so called sort-while-pick strategy.
Holste (2009) writes about some common routing methods, illustrated in Figure 2.4, that are used for discrete OP. The return, midpoint and largest gap strategies are likely to be used as end-of-aisle OPs while the remaining three are likely to be used as in-the-aisle OPs. Note, if the shelf spacing is small, the harder it is to enter with a bulky cart. A brief explanation of the routing methods follows below.
Transversal strategy – It is also called S-shaped strategy. The picker entirely traverses
an aisle from the front-end or back-end if there is at least one item to pick and enters
the upcoming aisle from the other end.
Return strategy – All the aisles are entered from the same end. This is common when
there is no cross-aisle opening from the other end.
Midpoint strategy – The shelves section is divided into two halves. The only aisles
traversed entirely are the first and the last. The picker uses the same principle as in
the return strategy but only half enters the aisles. A circuit is made around the
shelves section.
Largest gap strategy – Is based on the midpoint strategy but always performs better.
An aisle is however only entered as far as the largest gap and then back to the cross-

10
aisle. The gap is the distance between two SKUs in the same aisle or between the
SKU and the end. This strategy is more complex and harder to program.
Combined strategy – It is a mix between the return and the transversal strategies,
and also requires programming. The program then thinks several steps ahead.
Optimal routing – Is computer-based and calculates all possibilities to find the
optimal solution. As can be seen in Figure 2.4, no combination of the previous
strategies can make the last solution.
Figure 2.4 – Six different routing methods (Holste, 2009)
2.3.3 Studies of order picking Many studies have been performed about optimal order picking and the majority of these concerns discrete OP in rectangular warehouses. Mathematical approaches for solving TSP focus on dedicated storage for each item. Heragu, Mantel & Schuur (2007) developed a new slotting strategy for batch picking called Order Oriented Slotting (OOS). They realized that the most common strategy Cube per Order Index (COI) had some limitations due to the fact that it was only based on turnover assuming that the picker returns to the P/D station after each pick. This make sense if the case is single-item picking. The OOS takes into account multiple items per order/order batching and proposes a grouped SKU assignment to reduce the total travelling time given a routing policy.
Egas & Masel (2010) compared a demand-based method and a clustering method of slotting for single order picking. Their result showed that time could be saved through the clustering method, suggesting that SKUs should be grouped by frequent order compositions. When single orders are treated, the probability of visiting many aisles becomes lower and consequently time is saved in unnecessary movements.
11
2.3.4 The problem of congestion The most common problem that leads to congestion is picker blocking, that usually occurs when the aisle width is too narrow, hence complicating for several workers to bypass each other within an aisle. This is called in-the-aisle blocking. Another type of picker blocking, face blocking, is when a picker is overtaken by another picker or when a picker occupies a certain pick face (same bin shelving section, a column of pallet racks or a bay of flow rack) in a wide aisle and thereby prevents the other picker to retrieve from the same spot. Parikh & Meller (2009) claim that a trade-off has to be done between the cost of space and the cost of labor when deciding the aisle width. Pickers might be blocked even in wide aisles by face blocking, and the amount of idle time increases with the number of workers or the reduction of pick faces.
Gue et al. (2006) stated that the batch picking in narrow aisles in large scale warehouses are not remarkably affected by congestion because the pickers will be scattered throughout the warehouse when the pick density is low. When the pick density is very high pickers spend more time picking instead of travelling and therefore congestion becomes less of a problem.
A potential problem occurs if popular products are grouped together in a turnover-based storage assignment (TSA). Ruben & Jacobs (1999) made a simulation study of different storage assignment strategies for batch picking; turnover-based, random (RSA) and several family-based (FSA). They concluded that the productivity generally decreases with a higher number of workers when using TSA. The productivity stays more even with RSA and FSA but in the case of the former the travel distance is long since all SKUs are stored randomly. The results are also based on different batching strategies and yield numerous answers. However, this study considered a rectangular nine aisle warehouse with pick carts allowing for at most 60 items and a number of workers ranging from 5 to 60, making it relatively small with a large workforce.
2.4 Forecasting
Jonsson (2008) describes the forecast process as a tool to help estimate future demand to back-up decision making. The information flow is important for the balance of supply and demand, and the resources available to adapt to the situation. Furthermore, Jonsson (2008) states that “the size of demand is completely decisive for both the flow of materials and production”. This gives the idea that forecasting may affect product placement as well. The theory strengthens when asking oneself a question for decision making; “How long will stocks last and when must replenishments be ordered?” (Jonsson, 2008) The replenishment activity was described by Hansen & Gibson (2008) as one of the key factors to consider when profiling.
Even Harrison & van Hoek (2011) claim that accurate forecasts of demand are necessary in the measure of high on-shelf availability. However, the logistics people are not the only ones in a company that have use of forecasts but marketing people as well. For this to function, cooperation is needed between the departments to provide a common demand forecast.
Ackerman & La Londe (1980) identified two types of waste that could be caused by poor forecasting. The first is the cost of reserving space when a warehouse worker does not have any instructions of where to place the items and is likely to put it in the first empty slot. The

12
second is “the hoarding of workers that the user thinks he may need when volume increases”.
3. Methodology
Since the purpose of this report is to look over the possibilities of cutting the costs related to OP activities we are interested in looking at the current situation of AM. Several personal interviews were performed with Söderström (2015), warehouse manager of Ateljé Margaretha, to gather the basic general knowledge of the warehouse activities. Data was also obtained directly at place and additional questions were performed through e-mail contact. Besides, the CEO helped out with the basic company facts.
3.1 Setting up the case study
For the ease of explanation, the warehouse will be mapped to get an overview of the movements, areas and storage locations. From the literature study we are interested in investigating a couple of key areas related to OP:
Warehouse layout – Warehouse arrangement, picking zones
Storage policies – Shelving, worker instructions, handling equipment, slotting
Routing policy – OP and replenishment
For data collection we are interested in acquiring information about:
SKU popularity – As a basis for an ABC analysis based on picking frequency
Replenishment activity per SKU
SKU profiles – Cubic, weight, special treatment, box dimensions, etc.
Product families – What products are likely to appear on the same order
When the warehouse is mapped and analyzed an ABC analysis will be performed based on pick frequency per SKU. The products will be divided into appropriate classes and further analyzed. Next, an appropriate sample from the class A group will be taken to find out the following about the SKUs: Storage locations, profiles, replenishment activity and how likely they are to appear on the same order/order set. Since there are about 8000 different SKUs in the warehouse, 1600 SKUs are expected to be class A items. Therefore a sample size of 50 will be set to obtain a relatively accurate outcome to fully determine if the current storage assignment policy can be stated “random”. If random, improvements can definitely be made since random storage is considered the worst scenario (Peterson & Aase, 2004). In addition, no other theory in this thesis aims for a random storage assignment policy. This sample size will furthermore contain SKUs distributed from the most popular to less popular but with more weight and focus on the more popular ones. The storage locations will be marked on the warehouse map and in what quantities the SKUs have been picked. Later, the replenishment activity for each of the SKUs will be found. Next, the SKU characteristics will be marked (for instance; how many items is a picker likely to carry, how big the items are, for what location an item is slotted, and how an SKU is related to other SKUs). An evaluation will be done with respect to the literature study.

13
Depending on the amount of data captured and the reliability of the outcome a review of the class C products might be done, in the case of cost of reserving space.
Suggestions of improving the current scenario will be made and a product assignment strategy will be developed.
3.2 Reliability and validity
In order to make the thesis more useful one has to look upon the aspects of reliability and validity. Reliability can briefly be explained as how consistent the results are. For quantitative research we want to acquire the same or similar results from a population using another sample. In the case of validity the level of generalization is measured of the population (external validity), and if the results are accurately measured and analyzed (internal validity). (Hernon & Schwartz, 2009)
In this method the focus is on first detecting the problem and second on improving the current situation with techniques found in the theoretical framework. The detection of the problem in this case can be considered reliable since we are taking a relatively high sample of 50. In this sample, not only the locations of the SKUs are analyzed but also what type and what properties the SKUs have, to cover several aspects. The strategy of how to solve the problem is, however, in the eyes of the observer and how he interprets the situation. About 15 scientific articles were picked out of interest and relevance in this thesis and there is a certain track to follow depending on the amount of given data. There has also been some background investigation of each author to increase the reliability level.
Part of the purpose of this thesis is to create a valid model for detection and improvement of unique cases. In the case of detection it can be considered valid if enough data is achieved. If the warehouse lacks useful data, our validity goes down. Since every case is supposed to be treated as a unique case in this report, the ideas of improvement will differ from case to case, hence, not making this unique end model valid for other warehouses or studies.
4. Case company description
The warehouse layout map can be found in Figure 4.1. As can be visualized, the space is allocated for separate units within the warehouse. The warehouse area measures over 3000 m2 and has and additional mezzanine storage area of 800 m2 in the northern warehouse. Incoming goods arrive from the shipping area and are handled in the goods reception. AM is using an ERP system and for the tracking of all inventory bar code scanning is used. The workforce varies between 12 and 20 workers for OP and the division between pick and pack is about 50/50. A total of 8062 SKUs were found to be located at the warehouse floor.
4.1 Storage policies
In the goods reception the workers are verifying and sorting the incoming goods and later assigns it for an appropriate storage medium and in some cases a certain pick location. The remaining items of a specific SKU is stored either on pallets or in the shelf sections. In most

14
cases, the worker with the hand scanner is not instructed where to assign any product more than into the correct picking zone. However, by experience the workers know where to find the slots/storage locations that are suitable for a specific box dimension to save space and reduce picking errors. For instance, the worker is not allowed to slot a unique SKU next to a similar one that could be of the same size, have the same color or have a closely related article number. Also, fragile products are not stored on the mezzanine due to the risk of handling damage.
AM has dedicated the storage space into a couple of sections, some only used for picking, others for storage of unit loads/pallets and some used for picking with additional storage on the higher shelves. A forklift truck is used to retrieve pallets or boxes stored above the pallet rack pick sections. Wide-span shelving and pallet racks constitute the major part of the storage. The new SKUs are in most cases directly slotted into the shelves within the boxes that they arrived in but in some cases repacked into AM’s standard boxes. A wide-span shelf section can be of various designs and generally hold between 12 and 30 boxes. An overview of the storage sections/picking zones follows (with the help of Figure 4.1):
C section – It contains all of the C main aisles. It consists of pallet racks with different
altitude, some divided into three levels for picking. Allows for bulky SKUs. This is also
where AM tries to place their high-velocity products of the mainly given sales
channels Å and AM1. Pick carts can pass through all the aisles.
L section – Contains only wide-span shelves located north of main aisle L. The higher
shelves are designed with extra space to allow buffer stock for quick replenishment.
This section is used only for Å. The two last sub-aisles to the west consist entirely
LM section – Contains all wide-span shelves located between main aisles L and M,
and some additional single pallet storage along the main aisles, illustrated in Figure
4.1. Buffer stock is placed in the top shelves of the two closest sections along the
main aisle and the remaining top shelves are used for additional box storage. The
section is mainly meant for Å and AM but has single pallet places for pallet picking
used for any sales channel. The slots in the middle of the shelf section are higher for
the placement of larger boxes.
EDS section – Consists of all the shelving between the aisles E and D, the single
pallets along the southern part of aisle E and the additional sub-aisle west of E. Buffer
stock is used in the top-shelves of the L sales channel and in the shelf sections of Å all
space is filled with last season’s SKUs.
EDN section – Consists of all the pallet racks in the northern part between the aisles E
and D, and east of D. This section contains L products and allows for bulky SKUs.
Flyers are stored in the northeast part. The racks has an additional three levels used
for storage and is retrieved with the forklift truck. Pick carts can pass through all the
aisles.
1 Distiguish between AM referred to the company and the sales channel

15
Figure 4.1 – OP warehouse layout map. The letters C, D, E, L and M indicate the main aisles.
The arrows show the routing policy and the colors red, green and purple show the sales channel
occupying the storage locations. ”Stop” marks the P/D station and ”Start” the setup area.
Pre-picking Area
Shipping
Pallet storage
Cart parking
Returns
Goods
reception &
Replenishment
Tra
sh
Up
Packing area
StartStop
Linea
Ateljé Margaretha
Åshild
Storage Area
Flyer section
Buffer stock
No particular
sales channel
North
warehouse
South
warehouse
C11
L
M
D
E
C13
C15
C17
GR
GR = Gravity racks

16
The area denoted ”Pallet storage” in Figure 4.1 is one single location for the storage of various SKUs on pallets. The remaining shelves with a grey color are storage locations for boxes. The mezzanine storage area contains a mixture of wide-span shelves and pallet places also used for storage. Not seen on the map are the storage policies of specific product families. For instance, some aisles only carry bras, small products or non-clothing products for Å. Also, the allowed height for a pallet load can vary from 0.8 meter to unlimited.
Since AM is a mail order company that exchanges products every season, older products are rescheduled twice a year. These SKUs either stops selling, are moved to the pre-picking area due to lower quantities, or are moved to less ergonomic slots. The latter could be in the bottom- or top-shelves, or deeper into the sub-aisles. In the case of Å, most SKUs are placed in EDS.
4.2 The order picking process
The warehouse manager decides upon how many order that should be printed each day. In the same wave replenishment lists are printed for the SKUs that will need replenishment. The orders are till they are printed stored in the ERP system and automatically composed into batches before printed. The orders are composed in the following way:
1. Physical volume – Some products have larger cubic than others and therefore require
pick carts with larger compartments. Sometimes an order has several small products
with a total volume that exceeds a certain compartment volume and needs a cart
with larger compartments. In the warehouse four different pick carts are used.
a) Single order carts – These hold the largest SKUs that do not fit into any other cart.
b) 12-order carts – Used for bulky SKUs or high-volume orders and holds at least 12
SKUs. It is not uncommon that they sometimes hold between 30 and 80 SKUs.
c) 36-order carts – Used for orders of lower volume. Usually holds between 70 and
180 SKUs.
d) 60-order carts – Used for low-volume orders and hold between 100 and 220 SKUs.
All cart types are of about the same size (0.3 x 2.0 m) and can be moved in both
directions. The compartments are accesses from only one direction. There is no
actual limit of how many SKUs a cart can carry. If a cart is not entirely filled with
orders, lower-volume orders will fill it up. The drop orders will be assigned to the cart
that holds most orders (usually a 60-order cart).
2. Picking zones – More correctly, the orders are sorted to different aisles. If only a few
SKUs are to be picked from one aisle, these are likely to be assigned the same batch,
and consequently the same pick list.
3. Similar orders – The system looks for SKUs that frequently appears together on
separate orders to compose batches. In this way many picks of the same SKUs might
occur on a single pick list to save the amount of pick locations to visit.
The picker starts the picking tour at the P/D station, denoted ”Stop” in Figure 4.1, by picking up a pick list. He then moves on to the cart parking where he chooses an appropriate cart

17
informed from the pick lists. Before the tour starts, the picker fills up the cart with flyers from the flyers sections. There are different flyers depending on sales channel and country to be sold to. For instance, for a popular sales channel in a certain country more flyers are likely to be picked. This might vary between 0 and 8.
The pick lists are printed with one sticker label per SKU that are pasted on the products instructing the picker where to find the SKU. The labels are arranged in a logical order for the picking tour, hence AM has a given routing policy based on the name of the aisles and pick locations. An example: Consider the pick location E45-36B1. It is found along aisle E, within the sub-aisle 45, on shelf section 36, at height level B, and on slot 1 at the shelf. AM is for the most part using an end-of-aisle approach because the aisle width in the shelf sections is not designed for pick carts to enter. The pick carts are moved along the main aisles and in the C and EDN sections. The logical sequence is visualized with the arrows in Figure 4.1. The most common routing method is the midpoint strategy. The picker is also allowed to carry as many items as he is capable of and is allowed to travel however he wants to.
4.3 Replenishment process
The replenishment activities can be divided into three different categories:
Replenishment by pick list – When the pick lists for OP are printed, the replenishment pick lists are printed at the same time. The replenishment of one unit load is a so called “mission”. All unit loads have unique box IDs and are tagged with barcodes. The workers pick the boxes and transport them to the replenishment area with a cart or pallet jack. Here the boxes are opened and sorted on larger carts, one for the south warehouse and the other for the north warehouse. The worker then uses a hand scanner to register the movement of material for each unit load into its pick location. From time to time this is a full time job and the number of missions during one day varies. On average, there are 95 missions per day taken on by one worker in 7.2 hours.
Replenishment by order picker – The slots assigned for buffer stock are used when there is not enough space on a certain pick location. In this case the box is already registered at the pick location and the picker just has to remove the old box to replace it with the new one. When the buffer stock cannot be placed above the pick location, they are placed at the entrance of the north warehouse. In some cases pick errors of SKUs have been made and consequently leave some boxes with less SKUs than what the data system claims. Then the picker has to retrieve a box from the storage area himself and ask a worker with a hand scanner to electronically move it.
Replenishment of flyers – The flyers do not have any article numbers and are not replenished in any set quantities. The flyers are assumed to always be available when needed. When a box of flyers is empty in the flyers section of the setup area, the picker goes for a new box from the EDN section. The daily amount of missions varies, but some days the number can exceed 10 visits at the EDN section. It is notable that the pick locations of the EDN sections are located on average 85 meters away.

18
5. Analyzing the warehouse
The 80/20 rule is well applied in the pick volume of AM and sets a basis for the ABC classification. Table 5.1 shows the classes ranging from A to C and Figure 5.1 illustrates the cumulative number of picks during the time period. The Y-axis indicates total number of picks and in the X-axis all SKUs are arranged from the most to the least picked.
Table 5.1 - ABC classification based on pick volume
Class Amount of SKUs Proportion of SKUs % Total picks Proportion of pick volume %
A 1 612 20 158 402 74.17
B 2 822 35 44 498 20.83
C 3 628 45 10 675 5.00
Figure 5.1 – Cumulative pick volume distribution
As we can read from Table 5.1, only 20% of the SKUs respond to 74.17% of all the picks during the period. That corresponds to 1 612 SKUs/storage locations. As 50 of these are to be chosen for a sample, it is of interest to investigate the items with higher velocity. For the first 10 SKUs every third was chosen, for the next 20 every fifth, and for the last 20 every tenth. Through this we will reach SKUs from the 1st most popular until the 328th most popular. The 328th SKU is scarcely exceeding the 4th percentile (328/8062) and corresponds to over 40% (86 243) of the total pick volume. The storage locations of the sampled SKUs are given in Figure 5.2.
AM currently uses a random-based storage strategy for the greater part. Relatively few SKUs are strategically assigned but most of the time the worker is not instructed where to slot a new item. Figure 5.2 shows that some popular SKUs are correctly placed along the main aisles but a huge part of the SKUs are found everywhere in the warehouse. Table 5.2 provides data of the sample. “Replenishments” indicates the number of missions done during the time period and “Handling type” refers to a qualitative measure based on the idea of Flores and Whybark (1988) as a factor of criticality. This means that a measure is invented to estimate how hard an item is to handle or retrieve. A scale from 1 to 4 is created

19
Pre-picking Area
Shipping
Storage
Cart parking
Returns
Goods
reception &
Replenishment
Tra
sh
Up
Packing area
South
warehouse
North
warehouse
x3
x2
Amount of picks
>1000
101-300
301-1000
Figure 5.2 – Pick locations of a sample of 50 SKUs. The colors indicate the number
of picks during a 8 weeks period.
Number of picks

20
Table 5.2 – Data of the 50 SKUs from the sample
SKU Sales channel(s) Pick section Picks Replenishments Handling type
1 AM, Å C 3 528 5 1
2 AM C 2 435 1 1
3 L C 1 291 4 1
4 AM LM 1 118 2 1
5 Å L 934 4 1
6 Å EDS 627 3 1
7 AM, Å, L LM 579 2 1
8 Å LM 509 3 1
9 L EDS 466 20 1
10 Å EDS 444 2 1
11 Å LM 364 3 1
12 AM L 339 2 1
13 Å L 319 3 1
14 AM LM 303 3 2
15 L C 299 0 1
16 Å, L C 296 17 2
17 Å LM 282 24 3
18 Å, L EDN 275 0 2
19 Å L 268 3 1
20 AM LM 252 15 2
21 AM, Å, L EDS 241 2 1
22 L EDS 234 17 3
23 Å C 231 4 1
24 L C 228 0 2
25 Å LM 221 14 2
26 AM LM 210 0 1
27 Å L 201 4 1
28 Å LM 197 4 1
29 Å L 195 3 1
30 Å C 192 1 3
31 Å C 190 1 1
32 Å L 181 2 1
33 AM LM 175 4 1
34 L EDS 172 1 1
35 Å L 163 1 1
36 L EDS 156 5 1
37 AM LM 150 5 2
38 AM, Å L 147 2 1
39 AM LM 140 7 2
40 Å L 137 1 1
41 Å L 132 2 1
42 Å LM 128 1 1
43 AM LM 126 0 1
44 L EDN 124 0 1
45 Å L 122 3 1
46 AM LM 121 1 2
47 Å LM 118 1 1
48 L EDS 116 1 1
49 Å C 114 0 1
50 Å, L C 112 3 2

21
where 1 is an easy item that could be carried in large batches and 4 is a bulky product that can at most be retrieved one at a time.
It is not too uncommon that certain SKUs are sold in more than one sales channel and consequently appear on more pick lists. Consider an L pick list. The items are expected to be located in the EDN, EDS and C sections but if SKU #7 would appear on the pick list, the route would be somewhat longer since the SKU is stored in the LM section. That is a travel distance about 35 meters longer than the supposed distance and includes at least one stop.
Now consider SKU #17. It is only sold for Å and is correctly placed in the LM section. But this SKU has been replenished 24 times during the time period. More particularly, the location is in a sub-aisle in the southwest end of the warehouse. If we assume that the missions are evenly distributed during the period, the replenishment cart has travelled this entire distance at least 24 times. Additionally, SKU #17 is of handling type 3 and is not located relatively close to the end of the aisle. If several units of this SKU are to be picked, the picker is likely to travel several times within the aisle, since the item is “hard” to carry, and consequently the total travel distance increases.
One last example is SKU #9. It has been replenished 20 times during the time period but is still located on a shelf. If these boxes had been placed on pallets instead, the number of replenishments of this SKU would have been much less, if any at all. One can imagine that the average time of replenishment per SKU is slightly 4.5 minutes (95 SKUs for one worker in a 7.2 hours), making it a total of 1,5 hours that could be saved for only SKU #9 during the time period.
5.1 Additional storage associated observations affecting OP
When investigating the warehouse a couple of further observations where made that impede the OP flow. The first is the balance between OP and replenishment. Sometimes when the number of missions for one day is high, the pickers are affected due to the lack of products in the slots. In this case the picker usually looks for the products among the buffer stock shelves with no result and then moves on to see if the SKUs are available at the replenishment area. Not any of this time spent is value-adding. Even the packers get affected and have to wait to complete the cart. The pick cart then becomes idle. This is however not a problem if orders are printed for several days during the seasonal peaks and the replenishment workers are allowed to work one day ahead.
A second observation is the slotting and storage of certain products. Some SKUs arrive in a large amount of boxes and each one of these is considered a unit load if not slotted to pallet picking. When several boxes are placed in one slot the space utilization could be maximized. But if all remaining stored boxes are treated as single unit loads a problem occurs. When replenishment is needed, the system will only call for the amount of unit loads needed to fulfill the current demand. This leads to frequent replenishments once the original amount is out of stock and the space utilization becomes poor.
The third observation is related to congestion. The picker blocking is currently not a problem for AM, but there is a potential problem with the pick cart. We will now refer to this as “cart blocking”. This problem occurs when several pickers enter the same aisle and all have parked

22
their carts at the end of the aisle. The pickers are not necessarily blocked, but the travel distance increases. When many carts are placed together a sort of “labyrinth” is created. As far as our knowledge no studies were found in this area.
5.2 Summarizing the analysis
Many studies within the area of OP only consider rectangular warehouses with one or two main aisles but in the case study of AM we can see that the situation is far more complex. Summarizing, there are a lot of variables to consider in this case improving the product assignment:
1. The warehouse has a unique shape with about six main aisles from which at most
two are parallel at the time. The aisles are also differently constructed and allow pick
carts to traverse at only certain aisles.
2. It makes sense understanding the batching of orders. If possible, products should be
assigned to minimize the amount of visited sections.
3. There is a set routing policy, but the picker himself can decide the path if thinks it is
necessary to make shortcuts or leave the cart for a longer time to carry more SKUs.
4. The storage policies used have a lot of exceptions. Pallet racks and wide-span
shelving are used but the slot dimensions ranges a lot. The pallets allow different
heights and the wide-span shelves have various designs from section to section.
5. All SKUs have different cubic which means that some SKUs are harder to carry than
others.
6. Traditionally, there is a lot of focus on placing popular products at locations that are
easily and rapidly accessible. But this goes hand in hand with 7.
7. The number of replenishments indicate that a product is either a) popular, or b)
assigned an inconvenient location. Deciding a good location in this case requires
support from forecasts as explained by Jonsson (2008), Hansen & Gibson (2008) and
Harrison & van Hoek (2011).
8. In this case some products are sold for more than one sales channel. This can be
solved through either strategically place the SKU to avoid extra travel distance, or use
several locations for the same SKUs.
9. The impact of congestion and cart blocking.
10. There were no findings of any product families, but this is a variable to consider if
possible.
6. Discussion
Let us assume that the number of locations given for each sales channel is found in Figure 4.1. For the ease of approximation we will not consider any slot dimensions but only the number of pallet places and the number of shelf sections. The data is found in Table 5.1. The number of pallet places is dominated by L and the shelves are dominated by Å. If all sales channels were to be treated as only one single, the ABC classification based on pick volume

23
would be easier when rearranging the products without any restrictions to only assign storage locations at certain pick sections. However, we will assume that the curve found in Figure 5.1 is individually true for all sales channels and use it as a point of reference. For instance, that means that 20% of the class A SKUs of Å requires about 13 pallet places and 54 shelf sections (rounded up).
As Peterson & Aase (2004) claims that the selection of storage policy is most important to save travel time, it is of interest to find out whether to use a turnover-based, class-based or family based storage assignment. For discrete OP Egas & Masel (2010) suggested a clustering method (family-based) and the concept of the OOS presented by Heragu, Mantel & Schuur (2007) suggests a grouped placement but since we do not have any data about the relations between the products neither of these methods is convenient. The closest to family-based
Table 6.1 – How the current picking sections are distributed among the sales channels
Supposed storage Pallet places Shelf sections Notes
Ateljé Margaretha 15 131
Åshild 62 268 The gravity rack has at most 32 slots
Linea 147 97
Flyers 27 4
Additional 39 Also buffer stock
we can get is by seeing for which sales channels products are sold. Since much of the literature in this report considers replenishment activity, it would be interesting to investigate the possibilities of setting up a forward-reserve allocation explained by van den Berg et al. (1998). The problem in the case of AM is that the current space is scarce, if it exists at all. That would require a larger rescheduling process and all of the less popular SKUs would need a rearrangement either to the pre-picking area or into significantly smaller boxes/bins to make more space for the popular SKUs.
The difference between class-based and turnover-based storage is not that distinct. The approach to be preferred will however be class-based storage over a completely within-aisle turnover-based storage. This is mainly because we want to include multiple criteria described by Flores & Whybark (1988) to reduce replenishment activity, as in the case of SKU #9 from Table 5.2. Another decisive factor is the case of congestion. Since the aisles are relatively wide, face blocking is the most likely to occur, but in the studies performed by Ruben & Jacobs (1999) and Parikh & Meller (2009) this is not as much of a concern if the workforce is low and the warehouse is larger. AM has between 6-10 pickers at the same time dispersed throughout a quite large warehouse. Once again, we will highlight the problem of cart blocking and therefore design the picking areas with a mixture of class A and B items to spread out the pick carts. The A products will be assigned the most ergonomically areas, as in the end of the aisles described by Tompkins et al. (2010) and Hansen & Gibson

24
(2008) and the B products deeper into the aisles. This strategy also makes sense because of the amount of SKUs per pick cart. AM has pick carts carrying large amounts of severe SKUs and the probability of picking class B products are therefore high, and since only 5% of the picks are made from 45% of the total SKUs from class C the probability of visiting these aisles will be significantly lower. The effects of this placement will be clearer for the single order carts and the 12-order carts because they hold less SKUs. This approach is also useful if forecasts are available because of the potential waste in not informing a worker where to place a product, explained by Ackerman & La Londe (1980), and can consequently ruin the whole idea with class-based storage.
We will also take a look at the different pick cart types to decide where to locate the products. The carts containing 36 and 60 orders usually carry a lot of items, from which some of these probably are class C products. Therefore we want to place the class C area on a location that makes the ERP system batch pick lists with as many C products as possible on the same tour.
Furthermore, we need to deal with an obvious problem. It makes no sense to have the replenishment pallets of the flyers in the other end of the warehouse since this area is visited several times per day, each visit taking at least (2 x 85 m) / (walking speed) in walking time. If the walking speed is on average 1.5 m/s, each trip takes 113 seconds. Instead we can move the flyers as close as possible to the picking shelves and also use the pallets as flyer picking sections. In this case the replenishment activity takes less time and for some flyers replenishment will not be needed. Of course this is a direct trade-off with OP locations. The idea is that pick carts tend to do a route anyway, which means that there is plenty of space anyway for the reassignment of the SKUs. The complete rearrangement of the picking locations is found in Figure 6.1.
6.1 The thoughts behind the suggested arrangement
The original storage locations for each sales channel are not changed a lot. The shelves and pallets available for each sales channel are all divided into several classes, found in Table 6.1 corresponding to Figure 6.1. The class A products are located close to the replenishment section to favor replenishment. The L sales channel consists of a lot of bulky storage and is therefore not significantly changed. In all cases A products are placed closest to the main-aisles with B product deeper into the aisles. Most aisles will be traversed but the intention is to reduce the visits of the class C aisles. All non-OP storage on top of the shelving sections will be replaced with new slots and space available for buffer stock to reduce the number of visits at the entrance of the north warehouse. Moreover, the pallet places for the flyers are moved close to the setup area. Aisle C13 will not be used for OP. The central area will be used for multichannel products, including the gravity racks.

25
Table 6.1 – New suggestion of pick locations distributed for each class. PP = pallet place, SS = shelf section.
Class Ateljé Margaretha Åshild Linea
PP SS PP SS PP SS
A 10 23 27 51 19 56
B 9 48 24 92 49 30
C 0 35 14 150 85 11
Total 19 106 65 293 153 97
6.2 Developing a storage assignment model
For the development we will use the ideas of Hansen & Gibson (2008), focusing on product velocity, characteristics, and dimensions while avoiding congestion. Additionally, there will be focus on balancing this with replenishment activity as described in the example of Tandy Brands. We will name this Assignment Model of Ateljé Margaretha, found in Figure 6.1, (AMAM) and it uses Figure 6.2 as a reference. Also, AM should map all of its different slot types to maximize the space utilization. The process is to be used when the workers continuously assign SKUs to classes based on multiple criteria.
The steps in Figure 6.1 are based on the ideas from the literature study and are organized in a logic manner to suit this particular company. Every step is to consider before slotting a new, or rescheduling an old product.
Sales channel
Clusters
Forecast
Characteristics
Dimensions Assign product
Assignment Model of Ateljé Margaretha
Old products
New product
Figure 6.1 – AMAM. The model is an iterative process and when products are rescheduled they follow the same pattern.

26
Pre-picking Area
Shipping
Pallet storage
Cart parking
Returns
Goods
reception &
Replenishment
Tra
sh
Up
Packing area
StartStop
Linea
Ateljé Margaretha
Åshild
Storage Area
Flyer section
Buffer stock
Mixed sales
channel
C11
L
M
D
E
C13
C15
C17
GR
A
A
A
B
B
B
C
C
C
Figure 6.2 – Suggested class-based layout

27
Steps of AMAM
1. For which sales channels is this product sold? – SKUs that are sold in more than one
sales channel have to be placed strategically. For example, if L is one of the sales
channels it should definitely be assigned a mixed location in the south warehouse to
avoid extra travel distance.
2. Is this product likely to sell together with any other? – If this SKU is likely to sell
together with another popular SKU, consider an adjacent location.
3. Is there any forecast available for this SKU? – Forecasts will simplify a lot for step 4.
4. Consider popularity, family and handling type – Popular products are likely to be
assigned class A. However, it may be hard to know if a specific SKU will be popular
but some hints may be given from the purchasing department regarding the ordered
amount. If the SKU is bulky but not the most popular, trade-offs have to be done
whether assigning it an A or B location. Some bulky products constitute the majority
of the single or 12-order carts and could therefore be considered class A products.
5. Consider the size of the unit load and slot the product – Another trade-off between
replenishment activity and the cost of reserving space has to be done. A decision of
whether to choose a shelf slot and a pallet will be done and visibility over the various
slot types will help fully utilizing the space available.
Most products are seasonal and it is for another department, such as marketing, to presume the quantities that will be sold the next season or the following. This is something to consider during the reschedule. Furthermore, suggestions of assigning the non-OP unit loads are added. For instance, since L products are located in the EDS section, it may be useful to store the additional unit loads of L west of the picking area.
6.3 Potential savings
It is hard to put an exact number on how much money that could be saved every year, since all decisions are trade-offs. When the cost of one process goes down, another is probable to increase. The costs of OP itself will probably not see a huge reduction in travel time per picker because most of the pick carts carry a lot of SKUs. In the literature review there are unfortunately no findings of studies, were we searched, regarding pick carts holding closer to 100 units, but the probability of visiting more aisles tend to increase the more units a cart carries. The larger impacts of a new storage assignment will mainly be seen for the single and 12-order carts. But if we consider a scenario where the total OP time is cut by as little as 10%, savings up to 320 000 SEK can be made, assuming that having one worker costs 200 SEK per hour, the number of pickers is on average 8 per year and that there are 250 working days per year.
A reduction in replenishment activity will have the largest impact on the savings. Since we are aware of that each mission takes on average 4.5 minutes, the effect of reducing the number of missions per day can easily be estimated. For instance, a decrease of 30 missions per day would save the company 112 500 SEK per year. Additionally, the replenishment process would be more effective since more popular products are placed closer to the

28
replenishment station and more buffer stock is available on the top shelves. Also, the rearrangement of the flyers will reduce the travel time each time flyers are being replenished.
There is no real proof that AMAM or the new layout would reduce costs but based on previous studies potential savings are clearly possible. If the estimated savings above are feasible, a total of 423 500 SEK can be saved through proper product placement. A save of this amount could directly have increased the profit by 14.4% in 2014.
7. Conclusion and further studies
This paper turned previous research and assumptions into practice and performed a case study in a DC of a large Swedish mail order retailer. The current situation of the OP processes was studied and several improvement areas were found. As supposed, there were a lot of variables to consider and there is not yet any research covering all of them. In this report we believed an alternative class-based storage assignment was the most convenient for the reduction of picker travel time and replenishment activity. A storage assignment model was developed called AMAM for the special case of AM. It should also be added that similar methods can be developed for other DCs by investigating the current layout and OP processes to help managers in decision making.
We can from this paper state the following:
Forecasts and advice from other departments, such as marketing and purchasing, will simplify the storage assignment process a lot in terms of future demand and promotions. All decisions regarding product placements are direct trade-offs because placing a product in a more convenient location usually means changing the location of another if the space is scarce. It is therefore hard to estimate any exact costs that can be reduced through proper slotting. Moreover, replenishment activity should always be considered when assigning products to storage locations affecting OP because it is a closely related activity.
A problem that could not be settled in this report was the new concept of cart blocking and its impact on OP should be studied. Various types of pick carts are used in most warehouses and it would be interesting to find out if there are several ways to decrease this type of congestion.
8. References
Ackerman, K. & La Londe, B., 1980. Making warehousing more efficient. Harward Business Review, pp. 94-101.
Barry, C., 2010. Proper Slotting Can Reduce Warehouse Costs. [Online] Available at: http://multichannelmerchant.com/multichannelmerchant.com/opsandfulfillment/news/proper-slotting-can-reduce-warehouse-costs-30082010/#_

29
Bartholdi III, J., 2014. Constructing a “heat map” of the warehouse. [Online] Available at: http://www2.isye.gatech.edu/~jjb/wh/apps/bev/bev.html
Bartholdi III, J. & Hackman, S., 2008. Warehouse & Distribution Science: Release 0.89. u.o.:The Supply Chain and Logistics Institute.
Egas, C. & Mason, D., 2010. Determining warehouse storage location assignment using clustering analysis, Athens: Department of Industrial and Systems Engineering.
Flores, B. & Whybark, D., 1987. Implementing Multiple Criteria ABC Analysis. Journal of Operations Management, Volym 7, pp. 79-85.
Gue, K., Meller, R. & Skufca, J., 2006. The effects of pick density on order picking areas with. IIE Transactions, Volym 38, pp. 859-868.
Hansen, P. & Gibson, K., 2008. Effective Warehouse Slotting. National Provisioner; May 2008, Volym 222, pp. 90-94.
Harrison, A. & van Hoek, R., 2011. Logistics Management and Strategy. 4th red. Harlow: Pearsin Education Limited.
Heragu, S., Mantel, R. & Schuur, P., 2007. Order Oriented Slotting Strategy for Warehouses. Proceedings of the 2007 Industrial Engineering Research Conference, pp. 1260-1265.
Hernon, P., Schwartz, C., 2009. Reliability and validity. Library & Information Science Research, Volym 31, pp. 73-74.
Holste, C., 2009. Logistics News: Designing the Most Effective Order Pick Routing in the DC. [Online] Available at: http://www.scdigest.com/assets/Experts/Holste_09-07-02.php
InboundLogistics, 2010. Warehouse Slotting, Profiling: The Right Place at the Right Time. [Online] Available at: http://www.inboundlogistics.com/cms/article/warehouse-slotting-profiling-the-right-place-at-the-right-time/
Jacobs, R., Berry, W., Whybark, D. & Vollman, T., 2011. Manufacturing Planning and Control for Supply Chain Management. 6th red. New York: McGraw-Hill.
Jonsson, P., 2008. Logistics and Supply Chain Management. Maidenhead: McGraw-Hill Education.
Parikh, P. & Meller, R., 2008. Selecting between batch and zone order picking strategies. Transportation Research Part E, Volym 44, pp. 696-719.
Parikh, P. & Meller, R., 2009. Estimating picker blocking in wide-aisle order picking. IIE Transactions, Volym 41, pp. 385-394.
Petersen, C. & Aase, G., 2004. A comparison of picking, storage, and routing policies in manual order picking. International Journal of Production Economics, Volym 92, pp. 11-19.

30
Petersen, C. & Schmenner, R., 1999. An Evaluation of Routing and Volume-based Storage Policies in an Order Picking Operation. Decision Science , Volym 30, pp. 481-501.
Ruben, R. & Jacobs, R., 1999. Batch Construction Heuristics and Storage Assignment Strategies for Walk/Ride and Pick Systems. Management Science, Volym 45, pp. 575-596.
Söderström, M., 2015. Current situation of the warehouse of AM [Intervju] (15 February 2015).
Tompkins, J., White, J., Bozer, Y. & Tanchoco, J. M., 2010. Facilities Planning. 4th red. New York: John Wiley & Sons, Inc..
van den Berg, J. o.a., 1998. Forward-reserve allocation in a warehouse with unit-load replenishments. European Journal of Operational Research, Volym 111, pp. 98-113.