IMPROVING ONLINE RETAIL MARGINS BY INCREASING SEARCH FRICTIONS · course of a week to either a...
39
IMPROVING ONLINE RETAIL MARGINS BY INCREASING SEARCH FRICTIONS Donald Ngwe Harvard Business School [email protected] Thales Teixeira Harvard Business School [email protected] January 2017
Transcript of IMPROVING ONLINE RETAIL MARGINS BY INCREASING SEARCH FRICTIONS · course of a week to either a...
IMPROVING ONLINE RETAIL MARGINS
BY INCREASING SEARCH FRICTIONS
Donald Ngwe Harvard Business School
Thales Teixeira Harvard Business School
January 2017
2
Abstract
Online retail accounts for a rapidly growing proportion of revenues in many industries. While
online retail broadens firms’ access to consumers through an additional channel, operating
margins are often lower in online stores than in physical stores. There are well-recognized
reasons for this discrepancy: price comparisons are more easily made online, discount coupons
and codes have higher uptake, and sellers often bear the cost of shipping products to buyers. In
addition to these factors, online selling precludes many methods of price discrimination
exercised in offline environments. Most online stores are designed for frictionless shopping,
with few barriers to finding and purchasing discounted products. We propose that deliberately
adding search frictions—obstacles to locating discounted items—can improve online retailers’
margins by allowing consumers to self-select into “paying with money” (low discount) or
“paying with effort” (high discount). In a series of field experiments conducted with an online
fashion and apparel retailer, we show that making it harder for customers to find highly
discounted products reduces the average discount of items purchased while not reducing the
incidence of purchases or the average selling price. Using information from historical
transaction data about each existing customer, we demonstrate that price-sensitive shoppers are
more likely to exert effort in order to locate steeply discounted items. Our results show that
adding search frictions can be used as a self-selecting price discrimination tool to provide high
discounts to price sensitive consumers and reduce the incidence of subsidizing price-insensitive
consumers.
Keywords: e-commerce, online retailing, friction, effort, search costs, price discrimination
3
1 Introduction
Online retail accounts for a rapidly growing proportion of revenues in many industries. As of
the second quarter of 2016, e-commerce accounted for 8.1% of total U.S. retail sales, from less
than 3% in 2006.1 While online retail broadens firms’ access to consumers through an addition
channel, operating margins are often lower in online stores than in physical stores. Amazon,
the largest online retailer in the U.S., has averaged 1.3% in operating margins from 2011 to
2013 while its brick-and-mortar counterparts typically get 6% to 10% (Rigby 2014). Reasons for
this difference are well recognized: price comparisons are easier online, discount coupons and
codes have higher uptake, and sellers often bear the cost of shipping products to buyers.
These factors all relate to convenience, which is intrinsic to online retail. Consumers
shop online for products that are also available in brick-and-mortar stores because it is
generally easier to browse a large selection of goods and fulfill transactions online (Teixeira
and Gupta 2015). Pure online sellers such as Amazon, Wayfair.com, and Overstock.com
continually try to reduce the search, transaction, and delivery costs for shoppers in an attempt
to lure them from offline channels. Amazon is perhaps the best example of an online retailer
that consistently reduces online search frictions by developing and using patented technologies
such as One-Click® purchasing and Prime®. Many other ecommerce players have been
following their footsteps.
This trend is in stark contrast with the practice of brick-and-mortar retailers, who have
long embraced the deliberate use of search frictions to improve in-store revenue performance.
By making discounted or otherwise lower-priced items harder to locate, either by placing the
sale section in the back of the store or in a separate outlet store, physical stores can induce a
1 https://www.census.gov/retail/mrts/www/data/pdf/ec_current.pdf

4
self-selection among consumers who differ in their price sensitivity and willingness to search.
In this paper, we seek to challenge the prevailing assumption that minimizing search
frictions, i.e., facilitating consumer search across a retailer’s entire assortment, is the optimal
strategy for online retailers selling searchable branded goods (Bakos 1997, Brynjolfsson and
Smith 2000). We contend that just as in physical selling contexts, careful incorporation of
search frictions can facilitate price discrimination in online retail.
The existing literature has typically conceived of search costs as the time, effort, and
money required to physically identify and consider additional options prior to making a
purchase decision (Bell, Ho and Tang 1998). In offline retail contexts these often take the form
of travel costs or time spent shopping in measurable intervals. Given the ease and immediacy
of online shopping, it is perhaps unsurprising that equivalent search costs have not been
studied as tools a firm would use to implement price discrimination. We identify and explore
the potency of search costs in online settings: the effort behind clicking an additional link,
viewing an additional page, scrolling through a catalogue of items, or mentally calculating the
percentage discount on a sale item.
Our hypothesis is that under certain conditions, an online seller can improve its gross
margins by increasing the search costs associated with finding and purchasing discounted items
on its website. The first condition is that there is a negative correlation between price sensitivity
and sensitivity to search costs: consumers who care more about getting good deals care less
about exerting effort to locate them. The second condition is that upon encountering these
added search frictions, price insensitive consumers would substitute from highly discounted
items to less discounted items. The third condition is that price sensitive consumers would in
fact exert the extra effort required to find highly discounted items on the website. These
5
conditions relate to both consumer preferences and search costs associated with specific
elements of the online retail environment that are under the firm’s control.
In order to test our hypothesis, we run a series of field experiments with an online
fashion and apparel retailer. This category is particularly appealing for our purpose because it
has moderate frequency and value of purchase. Consumers are broadly aware of price points
for apparel but not completely certain of item prices at any given purchase occasion. And,
luxury brands notwithstanding, item prices are material but not exorbitant to most shoppers.
Lastly, it is common practice for apparel retailers to frequently offer sizeable discounts in order
to acquire and retain customers.
In our first experiment, we randomly assign new visitors to the online store over the
course of a week to either a control group or one of three treatment groups. Product availability
and prices are held constant between all conditions. Each treatment involves increasing search
frictions in some way: (1) removing the direct link to the outlet section, where large discounts
are more abundant; (2) removing the sort by discount option; and (3) removing item-specific
discount markers. We find that in each of these conditions, the average discount of purchased
items is significantly lower than in the control condition without a decrease in conversion.
These results demonstrate the potency of our selected treatments and provide supportive
evidence for our hypothesis.
In a follow-up analysis, we aim to establish the mechanism underlying the results of our
first experiment. We use historical transactions data for existing customers to pre-classify them
according to their price sensitivity. We do so by regressing most recent basket discount on
demographic and past purchase variables, then using the predicted values as a proxy for price
sensitivity. We validate this classification by showing that consumers we identify as price

6
sensitive are much more likely to click on randomly assigned discount-oriented (versus no
discount mentioned) email newsletters.
In our second experiment, we randomly assign all visitors—new and existing
customers—to the online store over the course of two weeks to either a control group or one of
four treatment groups. Again, product availability and prices are held constant across all
conditions. We carry over the treatments from our first experiment and include the
replacement of discount banners with non-discount banners as an additional condition. The
purpose is to identify base the presence of self-selection among the firm’s entire customer,
whereby price sensitive consumers are relatively immune to the added search costs, but price
insensitive consumers are not.
We find that just as in the first experiment, the average discount of purchased items is
lower in the treatment groups than in the control group while conversion rates are not
negatively affected by the addition of search costs. Moreover, these gains are attributed to price
insensitive consumers buying disproportionately more full-priced items in the treatment
groups. These results imply that price insensitive consumers do indeed switch to less
discounted items when highly discounted items are made harder to find. They also show that
the main effects we capture are stable across varying demand conditions, as our second
experiment included new as well as existing customers and was run more than a year after our
first experiment.
The remainder of the paper proceeds as follows. We review the online retail, search
costs, and price discrimination literature in Section 2. We formalize our hypothesis on the role
of search costs in online purchases of discounted goods in Section 3. We provide a description
of our empirical setting in Section 4. In Sections 5 through 8 we explain the experimental
7
setting and provide details on execution. We summarize our results and suggest future
directions for research in Section 9.
2 Review of Related Literature
This paper relates to two strands of literature in marketing and economics. The first examines
the impact of search costs on consumer decision making, particularly as it applies to online
retail settings. The second is on second-degree price discrimination, in which monopolistic
firms determine their product lines such that higher value consumers self-select into higher
priced and higher quality goods. We discuss each literature in turn.
Search Costs in Online Retail
The existing literature on search costs in online settings generally explores the effect of
diminishing information frictions on consumer choice, consumer welfare, and market
structure. Early papers associated decreases in search costs with an increase in competition,
particularly on price (e.g. Bakos 1997). Subsequent work has found that online search may
actually be more costly than originally understood, possibly due to online shoppers having
higher search costs than offline shoppers, and that there may be substantial heterogeneity in
search costs among online shoppers (Brynjolfsson and Smith 2000).
Lynch and Ariely (2000) find conditions under which increased quality transparency
online can mitigate price competition, providing support for their claim that “in a competitive
environment, the strategy of keeping some search costs high is arguably doomed to fail.” Yet
others have shown that some firms have found it profitable to artificially increase search costs
in an attempt to make price comparison more effortful. Ellison and Ellison (2009) show that
firms participating in a marketplace have an incentive to obfuscate the actual price and quality

8
information of goods sold online so as to reduce search-sensitive consumers’ inclination to
exhaustively compare prices across firms.
As examples of obfuscation, Ellison and Ellison (2005) show how online retailers
profitably offer complicated menus of prices, products that seem to be bundled but are not,
hidden prices, complex product descriptions, and other tactics designed “to make the process
of examining an offer sufficiently time-consuming.” They claim that many advances in search
engine technology that presumably were intended to facilitate consumer information gathering
have been subsequently accompanied by firms’ investments in hampering search.
Our work differs from these papers in that rather than examining cross-firm competitive
incentives for firms to hamper search, we focus on potential gains within-firms from price
discrimination through increasing search costs. While prior work has recognized the
importance of heterogeneity in search costs among consumers, none to our knowledge has
studied how this heterogeneity can be exploited by a monopolistic firm in an online context.
Price Discrimination
Varian (1980) formulates a model of price discrimination that allows a firm to extract
surplus from uninformed consumers via high prices and, concurrently, sell to the informed
consumers via low prices using a mixed-strategy pricing equilibrium. More recent models
featuring heterogeneous search also find equilibria in which sellers adopt a mixed strategy
(Ratchford 2009). For example, Stahl (1996) finds a mixed strategy equilibrium that, when
implemented by two retailers, creates a separation in the market such that fully informed
consumers always buy from the lower priced firm while uninformed consumers stop short of
comprehensive search and end up paying more.
Prior research shows that differences in learning, switching costs, and risk perceptions
9
when buying online drive heterogeneity in consumers’ willingness to search (Ratchford 2009).
These differences in consumers’ propensities to search provide opportunities for retailers to
selectively target price promotions or products with different margins to different customers
(Kopalle et al. 2009). The majority of the literature on search costs assumes multiple firms that
have different levels of search costs (Ratchford 2009) and thus separate the market based on
consumer heterogeneity in their willingness to incur in additional search costs. In this paper,
we focus on a single multiproduct firm that exploits this heterogeneity in search costs to
separate the market with the goal of offering different segments different products at different
prices.
We identify ways for a firm to increase profits by concurrently providing high and low
prices, the latter in the form of discounts, to capture both informed and uninformed consumers
using search costs as a segmentation mechanism. As predicted by Ellison and Ellison (2009)
regarding obfuscation, we also expect this approach to increase markups. But contrary to their
result, we expect the firm to not just capture the fraction of customers who are willing to incur
in search costs, but also capture higher profits from the portion of customers not willing to
incur high search costs. In addition, there is no explicit or implicit intention to confuse
customers regarding the true quality or price of any item in the online store. All items and all
prices are readily available to all consumers in the same website.
Ngwe (2016) shows that fashion goods outlet stores use travel costs, by locating far
away from central shopping districts, as a means of inducing consumers to self-select into
buying at outlet stores—incurring high travel costs to get low prices, or buying in centrally
located regular stores—incurring lower travel costs but facing higher prices. This and other
forms of deliberately adding search frictions as a price discrimination tool are familiar and
10
actionable for managers of brick-and-mortar stores. Unfortunately online retailers do not have
the ability to alter travel costs via physical placement of their stores. The question is whether
managers of online stores can add nontraditional, “virtual” search costs to the shopping
process of consumers online in an attempt to achieve the same benefit of price discrimination.
To complicate matters, online store managers often sell both new and clearance items through
the same channel. Moreover, it is unclear that increasing search costs for a multibrand online
retailer of nonexclusive goods can be a promising strategy when consumers can purchase lower
priced alternatives from a competitor just a few clicks away.
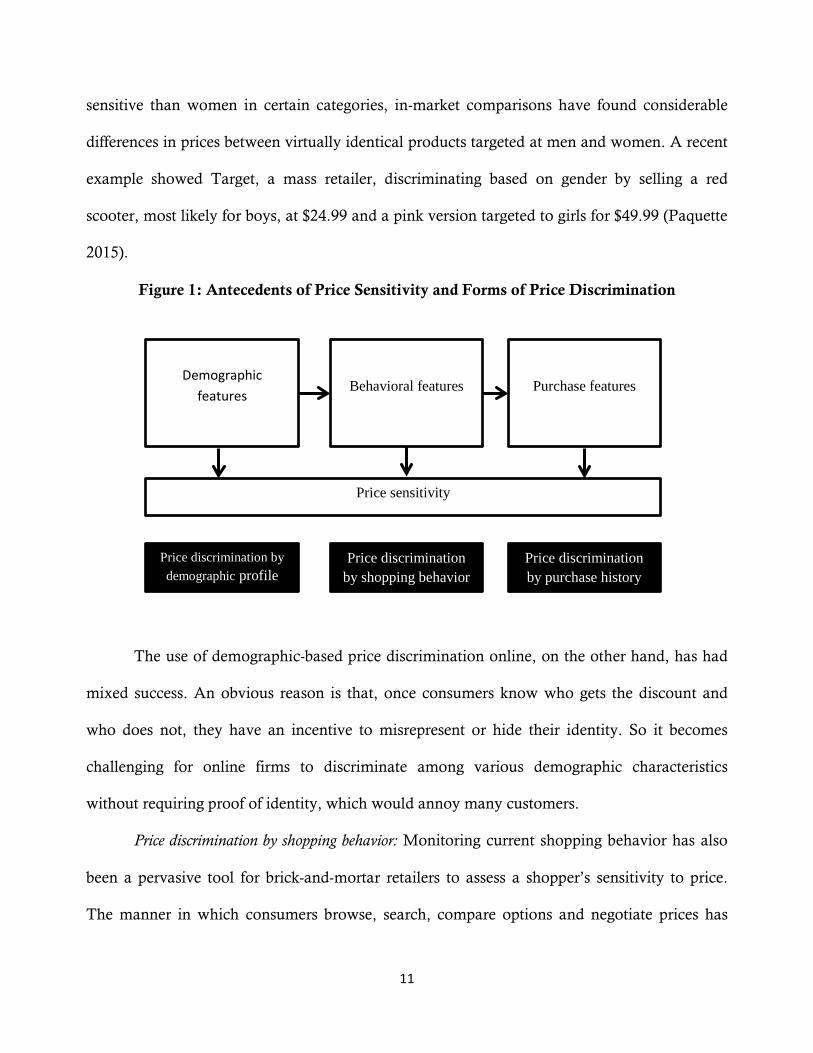
In order to practice price discrimination, firms need to first be able to identify and
separate the high from the low price sensitive customers or prospects. The literature has
broadly defined three sets of features that are associated with price sensitivity: individual-
specific, e.g., demographic features, current behavioral, e.g., shopping features, and past
purchase features. Further, prior literature has shown that demographic features are primitives
to behavioral and purchase features (Kim, Srinivasan and Wilcox 1999). From variations in
each of these features there have been attempts by firms to offer different prices to different
price-sensitive customers.
Price discrimination by demographics: Past research has found a link between demographic
variables such as age, gender, income, and geographic location and a consumer’s price
sensitivity (Kim, Srinivasan and Wilcox 1999). Traditional retailers and other businesses have
used this knowledge to offer different prices to different demographic profiles. Supermarkets
give retirees special discounts, movie theaters give students lower ticket prices, grocery stores
offer discounts depending on location, and educational institutions tend to offer scholarships,
discounts, to low-wage families. And since many firms believe that men are more price
11
sensitive than women in certain categories, in-market comparisons have found considerable
differences in prices between virtually identical products targeted at men and women. A recent
example showed Target, a mass retailer, discriminating based on gender by selling a red
scooter, most likely for boys, at $24.99 and a pink version targeted to girls for $49.99 (Paquette
2015).
Figure 1: Antecedents of Price Sensitivity and Forms of Price Discrimination
The use of demographic-based price discrimination online, on the other hand, has had
mixed success. An obvious reason is that, once consumers know who gets the discount and
who does not, they have an incentive to misrepresent or hide their identity. So it becomes
challenging for online firms to discriminate among various demographic characteristics
without requiring proof of identity, which would annoy many customers.
Price discrimination by shopping behavior: Monitoring current shopping behavior has also
been a pervasive tool for brick-and-mortar retailers to assess a shopper’s sensitivity to price.
The manner in which consumers browse, search, compare options and negotiate prices has
Demographic features
Behavioral features Purchase features
Price sensitivity
Price discrimination by demographic profile
Price discrimination by shopping behavior
Price discrimination by purchase history
12
been widely observed and used among sellers of expensive products that require more
deliberation. Among those are consumer electronics, automobiles and houses.
The use of behavioral variables observed during online shopping has had mixed results.
On one hand, and contrary to demographic variables, online searching, clicking and browsing
patterns are easily observable without requiring self-disclosure by the customer. Hannak et al.
(2014) have shown that among 16 online retailers and travel providers, half showed evidence
of offering different products and/or different prices to online shoppers depending on user
cookies, which store clicks, whether they logged in or not, and whether they used a mobile
phone or desktop to search for products and services. Yet, online, there are some drawbacks of
behavioral-based price discrimination if consumers discover the rules and are able to mimic the
behavior that will get them the lowest price. Amazon discovered this in 2000 when it offered
the same DVD for less to shoppers that did not have a cookie in their browser, arguably aiming
to give new customers to the site a cheaper price (CNN 2005). This incentivized Amazon
customers to either delete their cookies or not sign in to the website in order to get lower prices.
In sum, while behavioral-based price discrimination is arguably more observable than
demographics or personal characteristics, it is also “gameable” as consumers have an incentive
to learn to behave in a manner that will cause them to get lower prices.
Price discrimination by purchase history: The third category of variables that has been
associated with price sensitivity is related to prior purchases. Looking at five grocery
categories, Kim, Srinivasan and Wilcox (1999) found that features of one’s purchase history
such as prior frequency of purchases, amount purchased, loyalty and incidence of lowest item
purchased are strongly associated with individual price sensitivity, much more than
demographic characteristics. Offline grocery and non-food retailers have successfully used this
13
by tracking prior purchases of consumers using loyalty cards (Lal and Bell 2003) and using this
information to selectively target coupons, the prototypical price discrimination method used.
Online, prior purchase-based couponing is also pervasive. It is observable and challenging to be
gameable since it is unlikely that consumers purchase items that are not their best options at
the moment just so they can get future discounts.
There are two main challenges of practicing price discrimination by purchase history
online. First, online retailers that tend to not have frequent or repeat purchases such as auto,
furniture or fashion resellers end up not having good data to reliably estimate new customer’s
price sensitivities. Second, while many industries such as groceries and fast food restaurants
tend to offer discounts based on loyalty, i.e. the more you buy the cheaper it is, a few practice
the opposite. The insurance industry has been shown to typically practice higher, not lower,
prices to loyalty (Hughes 2008). The reasoning is that people who tend to stick with their
insurance companies for many years are averse to the effort and annoyance of shopping
around for better insurance quotes and thus are less price sensitive. Insurance companies take
advantage of this by increasing premiums from year to year for loyal customers, a “loyalty tax”
in charging more than from new customers (Bankrate 2016). In this latter case, of higher prices
to loyalty, consumers have an incentive to switch from company to company. Why most
consumers do not do this is likely related to the high effort of doing so. In these cases, of
infrequent purchases or disincentive to repurchase, price discrimination by past purchases may
have serious adverse effects on firms.
In sum, there are three generalizable categories of variables associated with an
individual’s price sensitivity, based on prior literature. Further, no single variable is perfect for
price discrimination in the sense that there are inherent trade-offs of observability and

14
“gameability.” Notably, some variables are better than others for implementing price
discrimination policies, depending on the product category or industry. Thus, a good model to
estimate price sensitivities should incorporate as many as available of all three types,
demographic, behavioral and past purchase variables. In section 5, we attempt to estimate an
individual-specific price sensitivity model for our context under the constraints of the data
available to the firm. Before that, we elaborate on the research design used in this paper.
3 Overview of Research Design
We employ both field experiments and analyses of historical purchase data in our research
design. All data are provided by an online fashion and apparel retailer in the Philippines. The
online retailer sells branded merchandise as well as items under its private label. The firm
offers the widest selection of men’s and women’s fashion items in the country. Items are listed
on the website under three catalogs: main, sale, and outlet. The main catalog contains all full
priced offerings as well as some lightly discounted items. The sale catalog contains moderately
discounted items, while the outlet catalog contains deeply discounted items, where the precise
cutoffs between “light,” “moderate,” and “deep” varies over time. All products offered by the
firm are first listed in the main catalog, then gradually discounted and listed in the other
catalogs as newer products are introduced.
Our research strategy consists of four parts. The first is an exploratory field experiment
in which new visitors to the online store are randomly exposed to added search frictions. In the
second part, we use a regression model to classify existing consumers according to their price
sensitivity. Third, we validate our classification by means of measuring response rates to
randomly assigned email newsletters. Fourth, we expose both new and returning customers to
15
the online store to added search frictions and measure how the treatment effects differently
impact purchase rates, discounts and margins, depending on a shoppers estimated price
sensitivity. We discuss design and results in the following four sections.
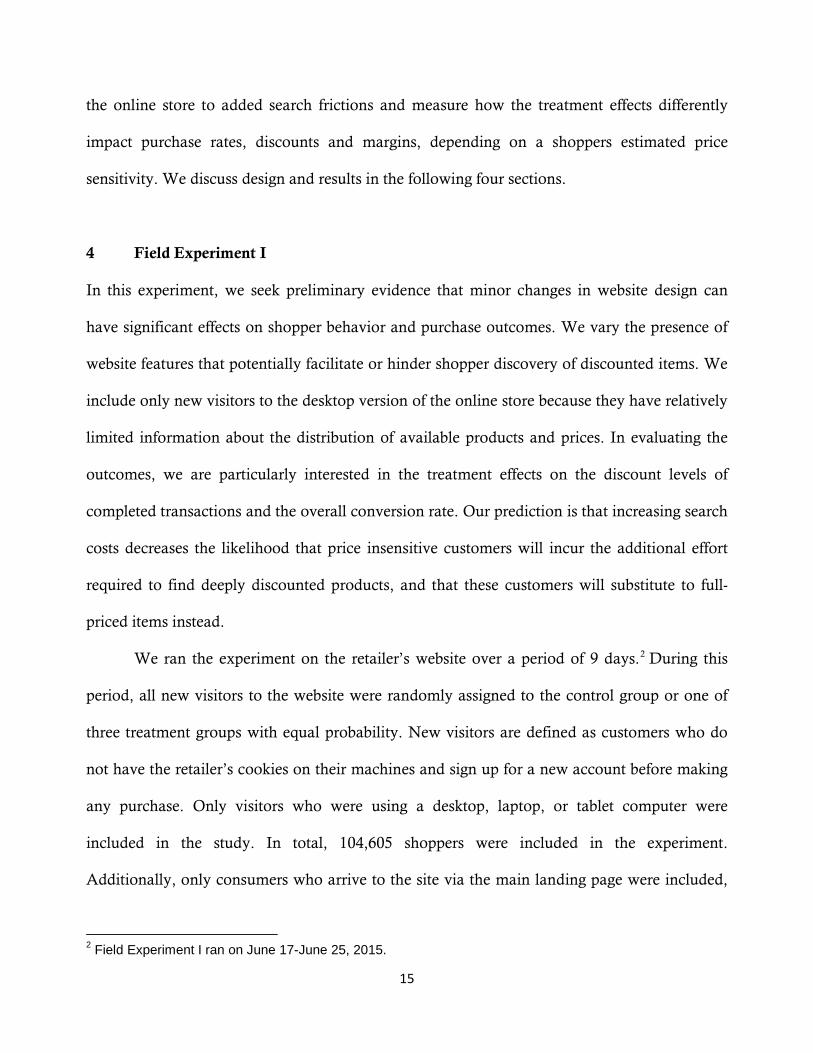
4 Field Experiment I
In this experiment, we seek preliminary evidence that minor changes in website design can
have significant effects on shopper behavior and purchase outcomes. We vary the presence of
website features that potentially facilitate or hinder shopper discovery of discounted items. We
include only new visitors to the desktop version of the online store because they have relatively
limited information about the distribution of available products and prices. In evaluating the
outcomes, we are particularly interested in the treatment effects on the discount levels of
completed transactions and the overall conversion rate. Our prediction is that increasing search
costs decreases the likelihood that price insensitive customers will incur the additional effort
required to find deeply discounted products, and that these customers will substitute to full-
priced items instead.
We ran the experiment on the retailer’s website over a period of 9 days.2 During this
period, all new visitors to the website were randomly assigned to the control group or one of
three treatment groups with equal probability. New visitors are defined as customers who do
not have the retailer’s cookies on their machines and sign up for a new account before making
any purchase. Only visitors who were using a desktop, laptop, or tablet computer were
included in the study. In total, 104,605 shoppers were included in the experiment.
Additionally, only consumers who arrive to the site via the main landing page were included,
2 Field Experiment I ran on June 17-June 25, 2015.
16
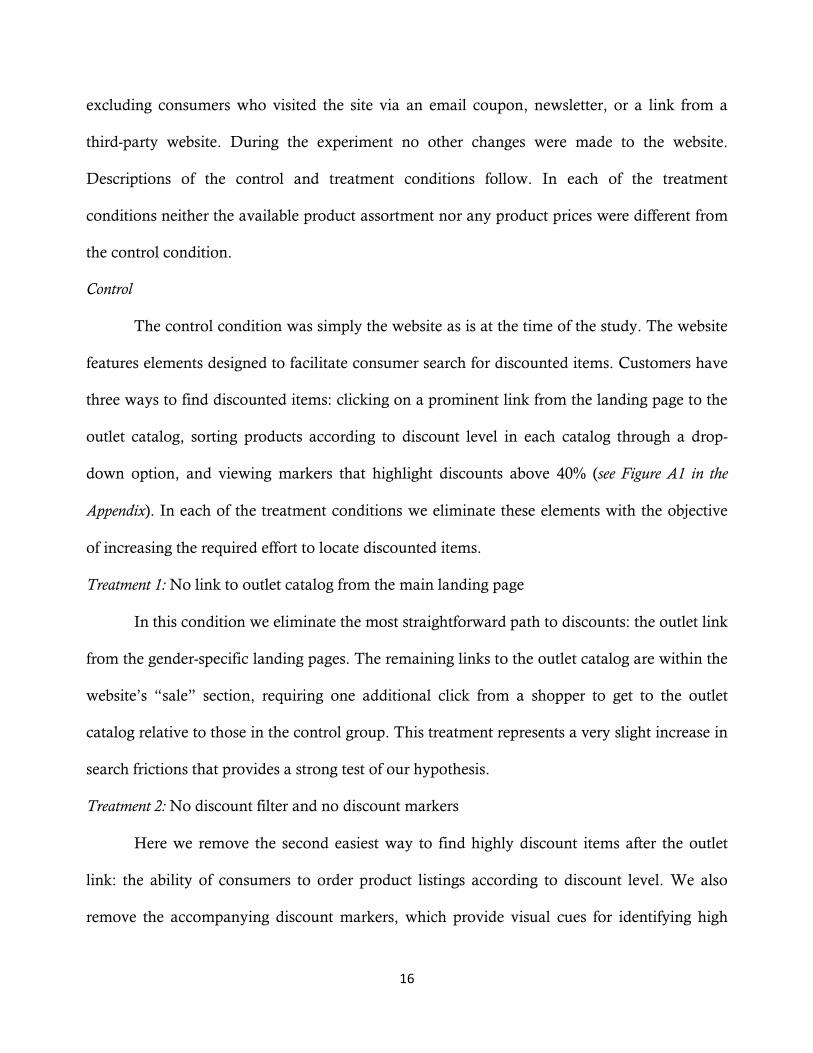
excluding consumers who visited the site via an email coupon, newsletter, or a link from a
third-party website. During the experiment no other changes were made to the website.
Descriptions of the control and treatment conditions follow. In each of the treatment
conditions neither the available product assortment nor any product prices were different from
the control condition.
Control
The control condition was simply the website as is at the time of the study. The website
features elements designed to facilitate consumer search for discounted items. Customers have
three ways to find discounted items: clicking on a prominent link from the landing page to the
outlet catalog, sorting products according to discount level in each catalog through a drop-
down option, and viewing markers that highlight discounts above 40% (see Figure A1 in the
Appendix). In each of the treatment conditions we eliminate these elements with the objective
of increasing the required effort to locate discounted items.
Treatment 1: No link to outlet catalog from the main landing page
In this condition we eliminate the most straightforward path to discounts: the outlet link
from the gender-specific landing pages. The remaining links to the outlet catalog are within the
website’s “sale” section, requiring one additional click from a shopper to get to the outlet
catalog relative to those in the control group. This treatment represents a very slight increase in
search frictions that provides a strong test of our hypothesis.
Treatment 2: No discount filter and no discount markers
Here we remove the second easiest way to find highly discount items after the outlet
link: the ability of consumers to order product listings according to discount level. We also
remove the accompanying discount markers, which provide visual cues for identifying high

17
discounts. These elements are widely used by online retailers to facilitate shopper search and
navigation.
Treatment 3: No outlet link, no discount filter, and no discount markers
In this last treatment we implement the highest increase in search frictions by taking
away all of the website elements removed piecemeal in the first two treatments. This is an
effort to drastically increase the magnitude of search costs required of discount-seeking
shoppers.
Outcome Variables
Our main goal is to discover if hindering consumer search for highly discounted products
causes some consumers to purchase fewer discounted products and substituting them for
regular–priced items so as to result in an improvement in retailer profitability. In evaluating the
effects of each treatment we consider several variables:
• Average discount: average ratio of selling prices to original prices over items bought in each
treatment group. Given that each treatment makes locating discounts more difficult, we
expect percent discounts to be lower in treatment conditions relative to control on average.
• Percent full priced purchases: proportion of purchased items sold without discounting.
Historically, over 50% of purchases on the website are made at full price. An increase in
this rate in our treatment groups would be supportive of our hypothesis, keeping conversion
rate constant.
• Conversion rate: percent of consumers who opt to make a purchase on the website within
the testing period. Because a large proportion of the seller’s assortment becomes more
difficult to view in the treatment conditions, there is a reasonable expectation that the
conversion rate may decline.
18
Results
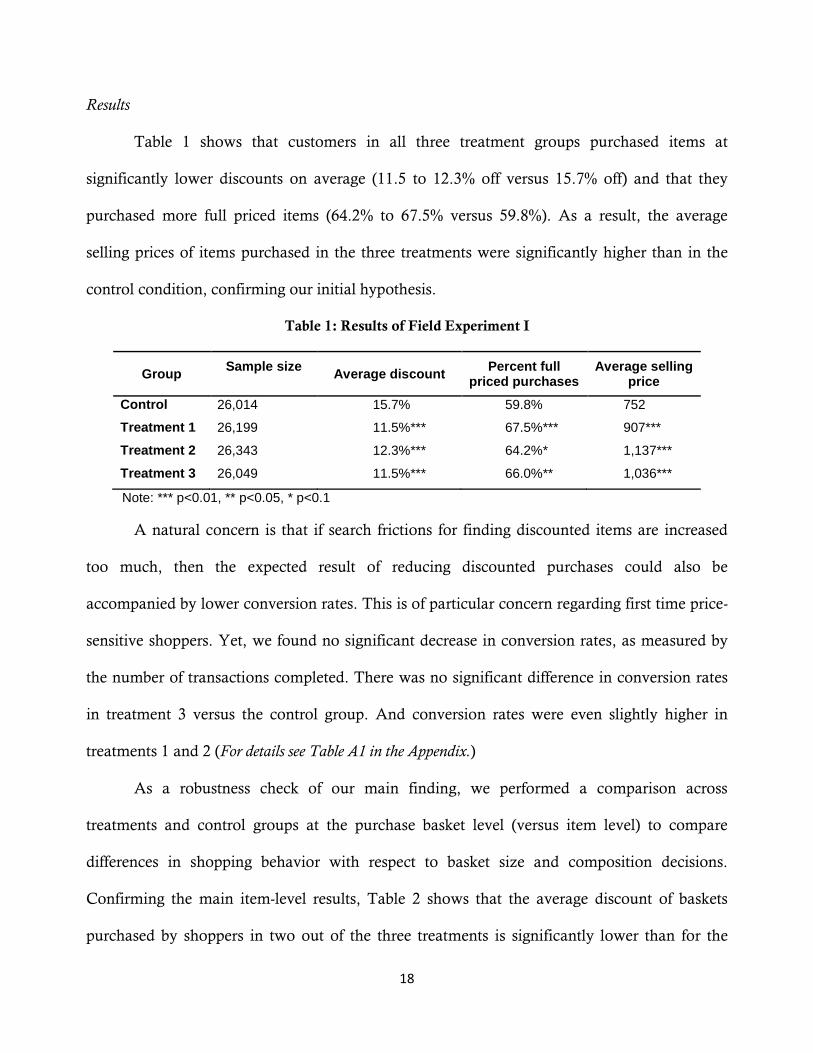
Table 1 shows that customers in all three treatment groups purchased items at
significantly lower discounts on average (11.5 to 12.3% off versus 15.7% off) and that they
purchased more full priced items (64.2% to 67.5% versus 59.8%). As a result, the average
selling prices of items purchased in the three treatments were significantly higher than in the
control condition, confirming our initial hypothesis.
Table 1: Results of Field Experiment I
Group Sample size Average discount Percent full priced purchases
Average selling price
Control 26,014 15.7% 59.8% 752
Treatment 1 26,199 11.5%*** 67.5%*** 907***
Treatment 2 26,343 12.3%*** 64.2%* 1,137***
Treatment 3 26,049 11.5%*** 66.0%** 1,036***
Note: *** p<0.01, ** p<0.05, * p<0.1
A natural concern is that if search frictions for finding discounted items are increased
too much, then the expected result of reducing discounted purchases could also be
accompanied by lower conversion rates. This is of particular concern regarding first time price-
sensitive shoppers. Yet, we found no significant decrease in conversion rates, as measured by
the number of transactions completed. There was no significant difference in conversion rates
in treatment 3 versus the control group. And conversion rates were even slightly higher in
treatments 1 and 2 (For details see Table A1 in the Appendix.)
As a robustness check of our main finding, we performed a comparison across
treatments and control groups at the purchase basket level (versus item level) to compare
differences in shopping behavior with respect to basket size and composition decisions.
Confirming the main item-level results, Table 2 shows that the average discount of baskets
purchased by shoppers in two out of the three treatments is significantly lower than for the
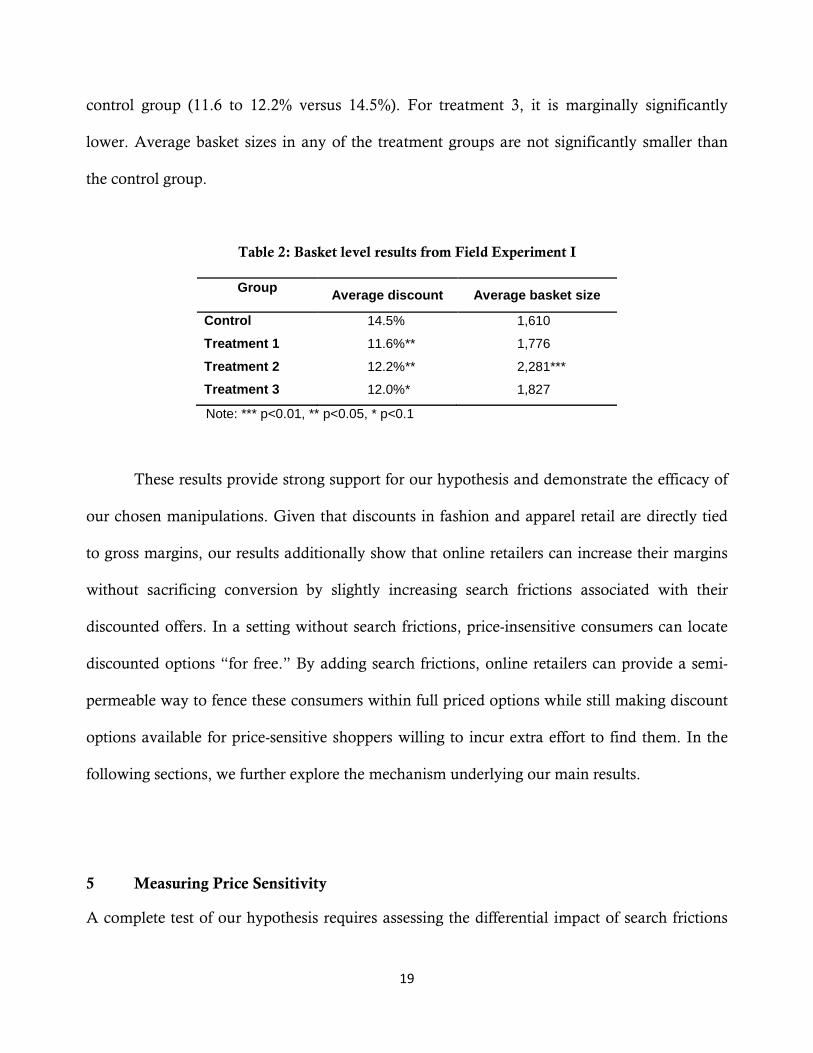
19
control group (11.6 to 12.2% versus 14.5%). For treatment 3, it is marginally significantly
lower. Average basket sizes in any of the treatment groups are not significantly smaller than
the control group.
Table 2: Basket level results from Field Experiment I
Group Average discount Average basket size
Control 14.5% 1,610
Treatment 1 11.6%** 1,776
Treatment 2 12.2%** 2,281***
Treatment 3 12.0%* 1,827
Note: *** p<0.01, ** p<0.05, * p<0.1
These results provide strong support for our hypothesis and demonstrate the efficacy of
our chosen manipulations. Given that discounts in fashion and apparel retail are directly tied
to gross margins, our results additionally show that online retailers can increase their margins
without sacrificing conversion by slightly increasing search frictions associated with their
discounted offers. In a setting without search frictions, price-insensitive consumers can locate
discounted options “for free.” By adding search frictions, online retailers can provide a semi-
permeable way to fence these consumers within full priced options while still making discount
options available for price-sensitive shoppers willing to incur extra effort to find them. In the
following sections, we further explore the mechanism underlying our main results.
5 Measuring Price Sensitivity
A complete test of our hypothesis requires assessing the differential impact of search frictions
20
on price-insensitive versus price-sensitive shoppers. The predicted impact on purchase behavior
should disproportionally affect the former. In this section we develop a parsimonious empirical
model of price sensitivity for shoppers in our setting. This serves two purposes. First, it exploits
a new and unique data set to identify relevant determinants of price sensitivity. Second, it
provides us with a means of pre-classifying consumers according to their predicted price
sensitivity. Later, we use the predicted values of this model as a proxy for a shopper’s price
sensitivity. After estimating the model, we assess its predictive accuracy by comparing the
behavior of pre-classified groups of shoppers in a validation field experiment.
Data
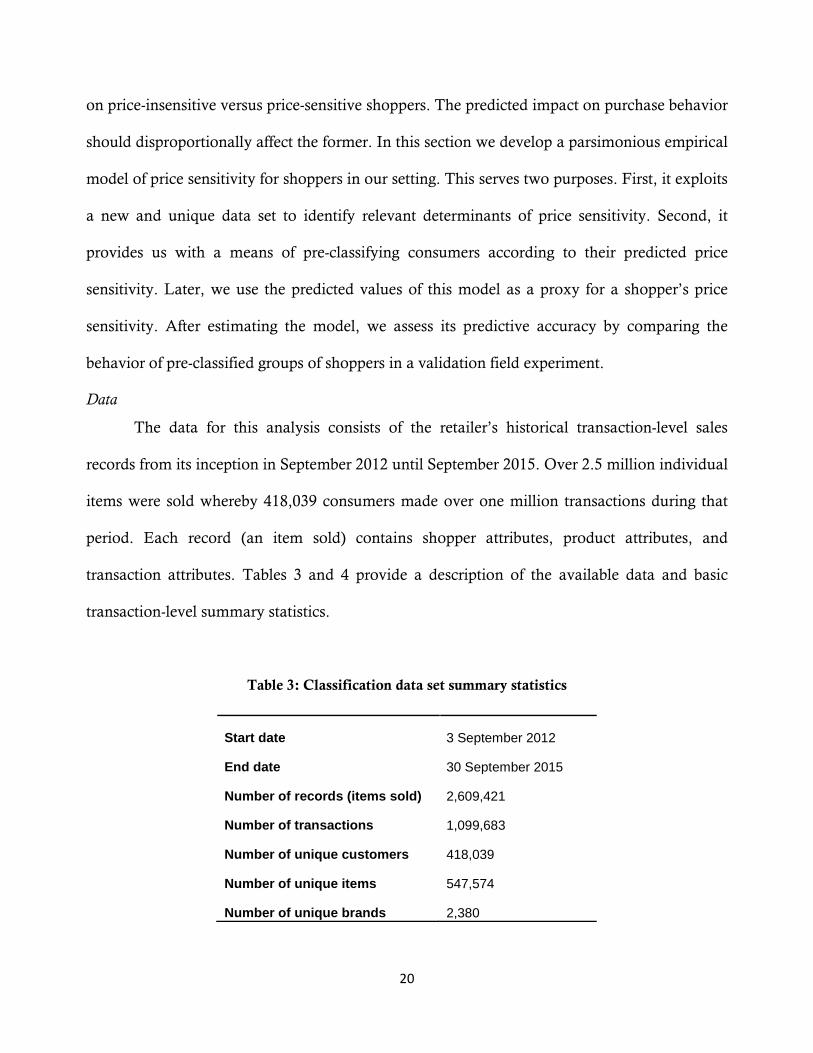
The data for this analysis consists of the retailer’s historical transaction-level sales
records from its inception in September 2012 until September 2015. Over 2.5 million individual
items were sold whereby 418,039 consumers made over one million transactions during that
period. Each record (an item sold) contains shopper attributes, product attributes, and
transaction attributes. Tables 3 and 4 provide a description of the available data and basic
transaction-level summary statistics.
Table 3: Classification data set summary statistics
Start date 3 September 2012
End date 30 September 2015
Number of records (items sold) 2,609,421
Number of transactions 1,099,683
Number of unique customers 418,039
Number of unique items 547,574
Number of unique brands 2,380
21
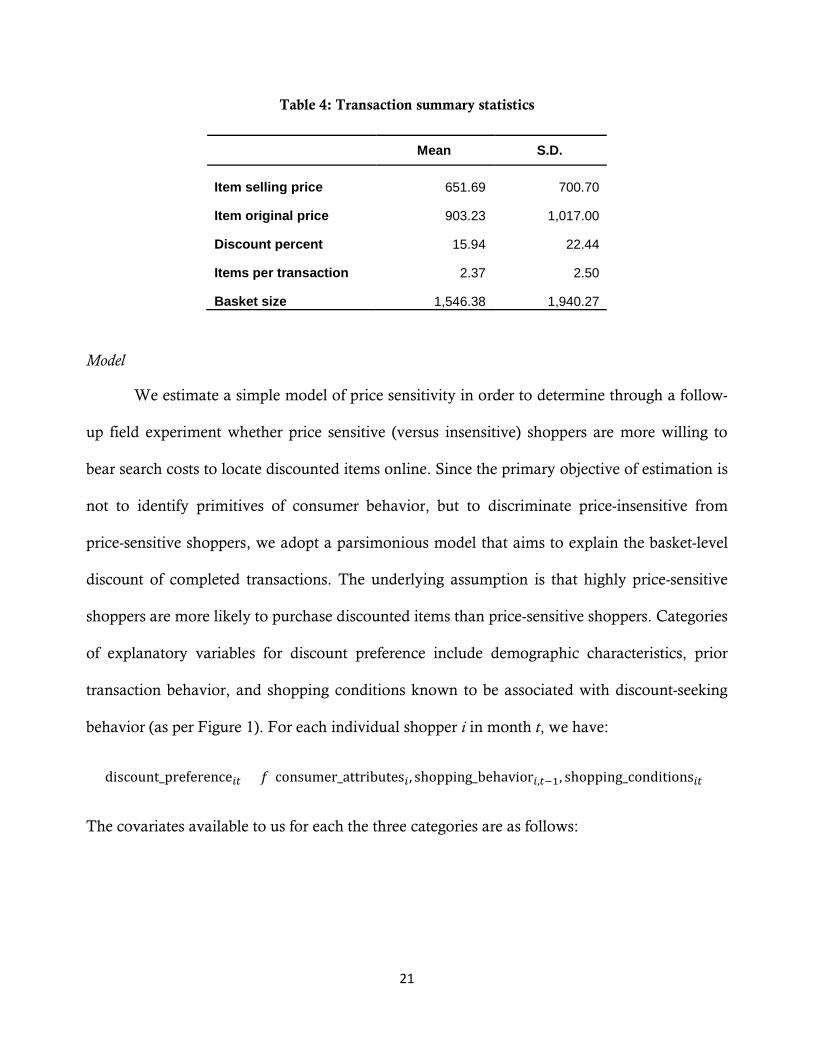
Table 4: Transaction summary statistics
Mean S.D.
Item selling price 651.69 700.70
Item original price 903.23 1,017.00
Discount percent 15.94 22.44
Items per transaction 2.37 2.50
Basket size 1,546.38 1,940.27
Model
We estimate a simple model of price sensitivity in order to determine through a follow-
up field experiment whether price sensitive (versus insensitive) shoppers are more willing to
bear search costs to locate discounted items online. Since the primary objective of estimation is
not to identify primitives of consumer behavior, but to discriminate price-insensitive from
price-sensitive shoppers, we adopt a parsimonious model that aims to explain the basket-level
discount of completed transactions. The underlying assumption is that highly price-sensitive
shoppers are more likely to purchase discounted items than price-sensitive shoppers. Categories
of explanatory variables for discount preference include demographic characteristics, prior
transaction behavior, and shopping conditions known to be associated with discount-seeking
behavior (as per Figure 1). For each individual shopper i in month t, we have:
discount_preference𝑖𝑖 = 𝑓(consumer_attributes𝑖, shopping_behavior𝑖,𝑖−1, shopping_conditions𝑖𝑖)
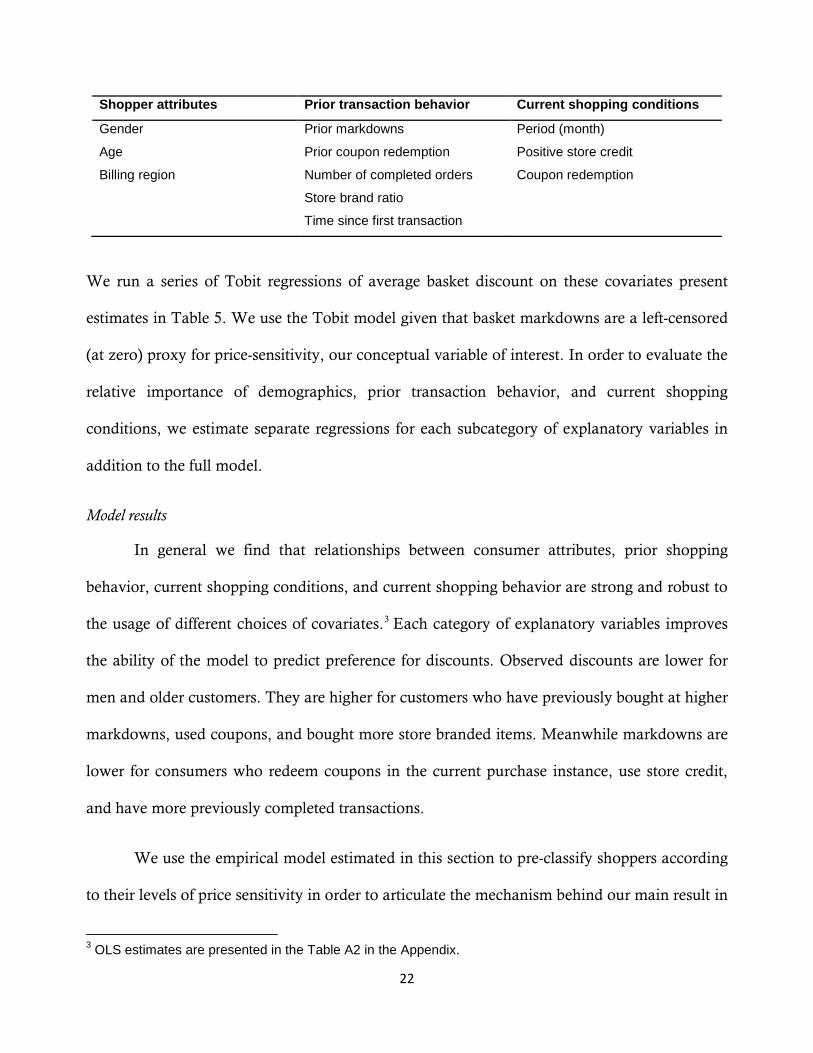
The covariates available to us for each the three categories are as follows:
22
Shopper attributes Prior transaction behavior Current shopping conditions
Gender
Age
Billing region
Prior markdowns
Prior coupon redemption
Number of completed orders
Store brand ratio
Time since first transaction
Period (month)
Positive store credit
Coupon redemption
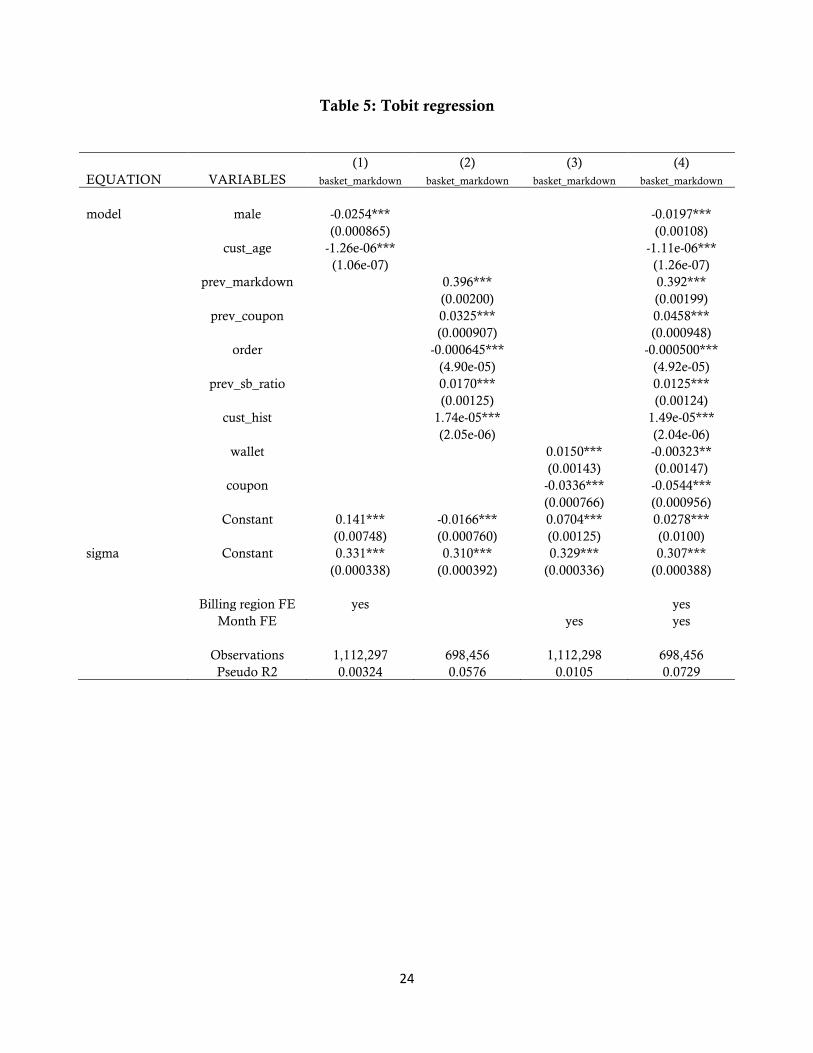
We run a series of Tobit regressions of average basket discount on these covariates present
estimates in Table 5. We use the Tobit model given that basket markdowns are a left-censored
(at zero) proxy for price-sensitivity, our conceptual variable of interest. In order to evaluate the
relative importance of demographics, prior transaction behavior, and current shopping
conditions, we estimate separate regressions for each subcategory of explanatory variables in
addition to the full model.
Model results
In general we find that relationships between consumer attributes, prior shopping
behavior, current shopping conditions, and current shopping behavior are strong and robust to
the usage of different choices of covariates.3 Each category of explanatory variables improves
the ability of the model to predict preference for discounts. Observed discounts are lower for
men and older customers. They are higher for customers who have previously bought at higher
markdowns, used coupons, and bought more store branded items. Meanwhile markdowns are
lower for consumers who redeem coupons in the current purchase instance, use store credit,
and have more previously completed transactions.
We use the empirical model estimated in this section to pre-classify shoppers according
to their levels of price sensitivity in order to articulate the mechanism behind our main result in
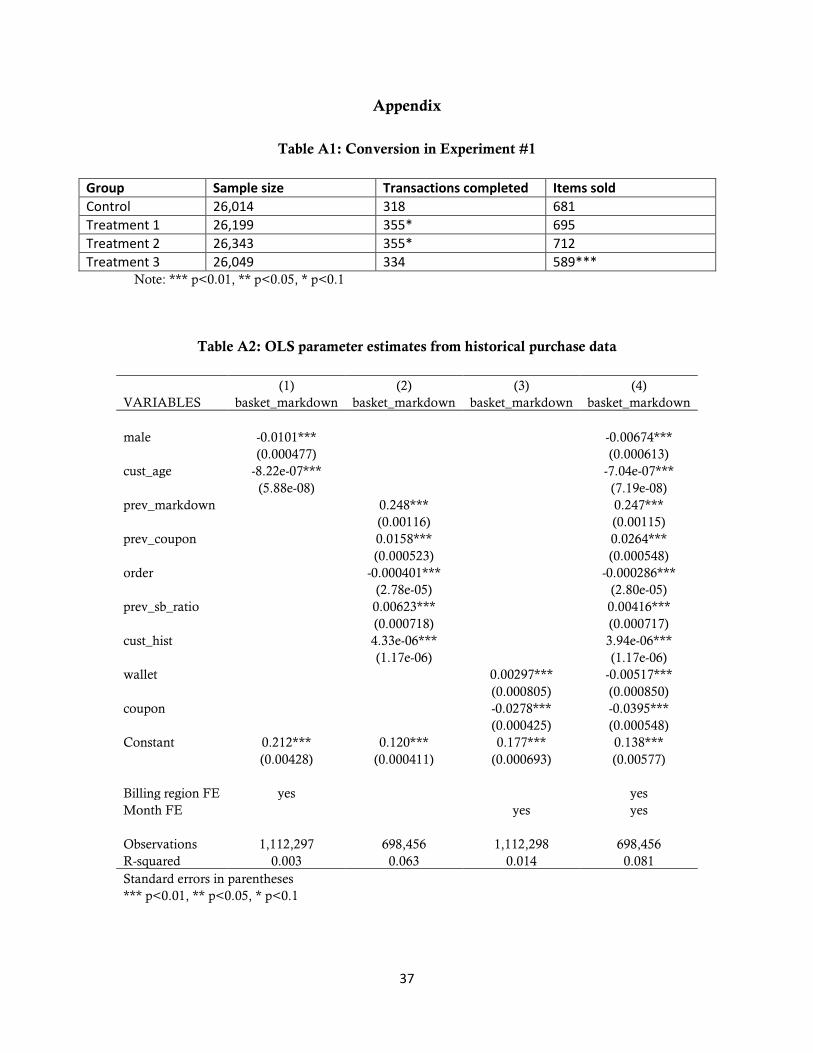
3 OLS estimates are presented in the Table A2 in the Appendix.

23
Field Experiment 1. In effect we use all of the available information on consumers to achieve
this classification, assigning weights to each variable according to its estimated coefficient. We
consider this to be superior to some ad hoc classification, say, by grouping shoppers according
to the average discount in their purchase histories. However, we also recognize the
shortcomings of this approach owing to the aggregation of information, the lack of information
purchase/no purchase decisions, and the changing assortment over time. In order to increase
our confidence in the resulting classification, we seek to establish its external validity. In the
next section, we describe how we validate our classification model by employing email
newsletters in a field experiment.
24
Table 5: Tobit regression
(1) (2) (3) (4) EQUATION VARIABLES basket_markdown basket_markdown basket_markdown basket_markdown
model male -0.0254***
-0.0197***
(0.000865)
(0.00108)
cust_age -1.26e-06***
-1.11e-06***
(1.06e-07)
(1.26e-07)
prev_markdown
0.396***
0.392***
(0.00200)
(0.00199)
prev_coupon
0.0325***
0.0458***
(0.000907)
(0.000948)
order
-0.000645***
-0.000500***
(4.90e-05)
(4.92e-05)
prev_sb_ratio
0.0170***
0.0125***
(0.00125)
(0.00124)
cust_hist
1.74e-05***
1.49e-05***
(2.05e-06)
(2.04e-06)
wallet
0.0150*** -0.00323**
(0.00143) (0.00147)
coupon
-0.0336*** -0.0544***
(0.000766) (0.000956)
Constant 0.141*** -0.0166*** 0.0704*** 0.0278***
(0.00748) (0.000760) (0.00125) (0.0100)
sigma Constant 0.331*** 0.310*** 0.329*** 0.307***
(0.000338) (0.000392) (0.000336) (0.000388)
Billing region FE yes
yes
Month FE
yes yes
Observations 1,112,297 698,456 1,112,298 698,456 Pseudo R2 0.00324 0.0576 0.0105 0.0729
25
6 Validation Experiment
In this section we test the external validity of our empirical model of price sensitivity. We sent
discount and non-discount oriented email newsletters to randomly assigned consumers and test
whether the classification determined by the Tobit model of the previous section is indeed
associated with a higher response rate for discount (versus non-discount) emails for price-
sensitive (versus price-insensitive) shoppers. We establish that consumers predicted by the
model to be price sensitive are more responsive to messages that include a discount element.
Experimental Design
We include the firm’s entire mailing list of 246,688 consumers in this experiment. A
consumer gets on the mailing list by providing his or her email address to the firm through
registering an account, signing up for updates, or requesting a coupon. Consumers were
randomly assigned to two groups, henceforth Group 1 and Group 2. Each group received a
schedule of both discount- and non-discount oriented newsletters as presented in the Table 6.4
The control newsletters sent out on Sunday were non-discount oriented and identical
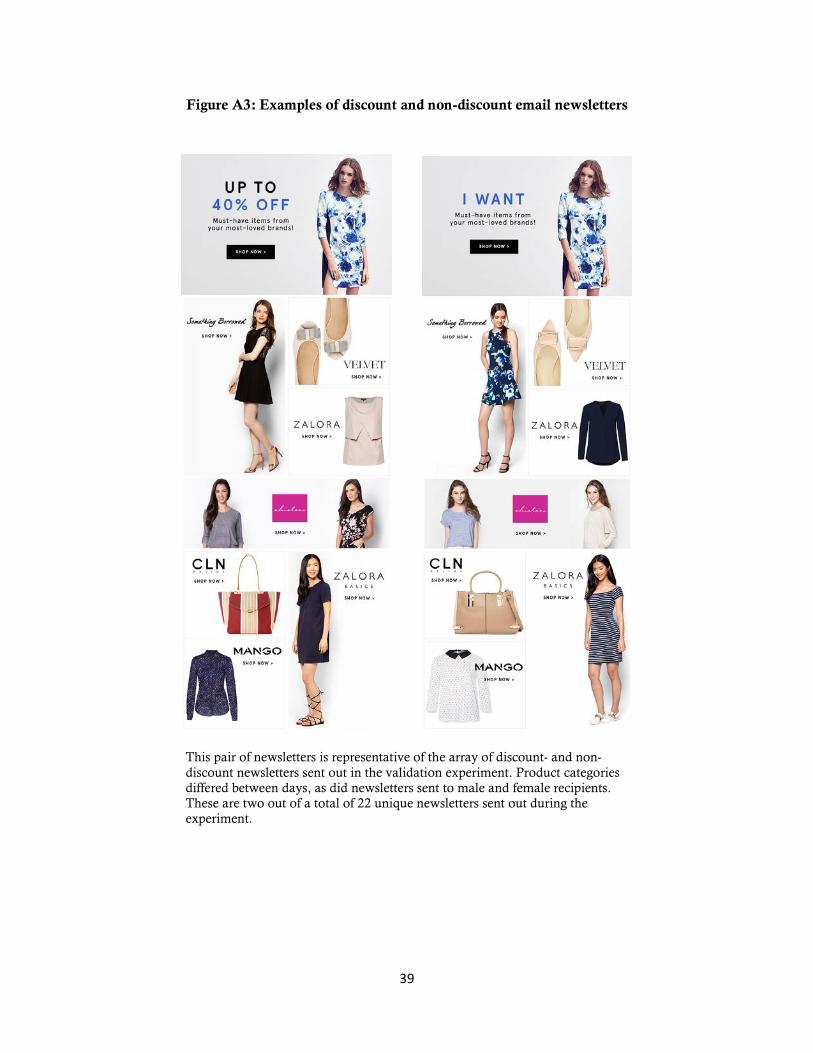
between groups, whereas within each day only the discount versus non-discount messaging
was different between groups (see sample newsletter pair in Figure A3). For each newsletter
sent, we observe whether the email was opened and which link within the email, if any, was
clicked by the recipient. We also observe all transactions on the website, which we can link to
consumers in the experiment via their email addresses.
Product categories featured on the email newsletters varied between days, but were kept
constant between control and treatment groups within days. Care was also taken to keep all
creative elements on the newsletters constant, such that only discount messaging (e.g. “up to
40% off”) and any price information varied in the execution. This variation in messaging was 4 This experiment ran from October 4, 2015 through October 9, 2015.

26
reflected in the subject line. For an example of a discount and full price email used, see Figure
A3 in the Appendix.
Table 6: Schedule of newsletter treatments
Group 1 (50%) Group 2 (50%)
Sunday Control Control
Monday Discount Full price
Tuesday Discount Full price
Wednesday Discount Full price
Thursday Full price Discount
Friday Full price Discount
Customers on the mailing list vary in the frequency with which they opt to receive
newsletters. 62.34% of subscribers receive them every day, 3.32% receive them three times a
week, and 34.35% receive them once a week. The newsletter schedule shown in Table 6 was
designed to gain maximum variation among consumers regardless of their frequency as well as
minimize any day-of-week effects.5
In order to establish the validity of the classification on the Tobit model, we generate
predicted values from the model given each consumer’s purchase history prior to the newsletter
experiment.6 Our model can be seen as indicative of price sensitivity if consumers we predict to
be more (versus less) price sensitive have a higher propensity to open and click on discount-
oriented emails. Since the final experiment will compare average shopping behavior across
5 The original plan included a pair of newsletters for Saturday that followed Friday’s pattern; however due to a server failure the emails were never sent out. 6 Only consumer-specific and purchase history variables (male dummy, customer age, previous markdown, previous coupon dummy, number of previous orders, store brand purchase ratio, time since first purchase) will be included in the prediction. The predicted values themselves will have no direct interpretation, but will be treated as sufficient statistics for price sensitivity/discount preference.
27
groups of consumers, price-sensitive versus insensitive, the classification model only needs to
be accurate at the group level rather than at an individual level.
Table 7: Regressions on newsletter response variables
(1) (2) (3) VARIABLES open click click | open
disc -0.0149* -0.00103 0.0188
(0.00811) (0.00417) (0.0181)
price_sensitivity 0.0402 0.0248 0.0868
(0.0297) (0.0153) (0.0671)
disc*price_sensitivity 0.125*** 0.0505** 0.0728
(0.0420) (0.0216) (0.0933)
Constant 0.207*** 0.0328*** 0.152***
(0.00630) (0.00324) (0.0141)
day dummies yes yes yes
Observations 106,534 106,534 22,043 R-squared 0.002 0.001 0.003
Standard errors in parentheses *** p<0.01, ** p<0.05, * p<0.1
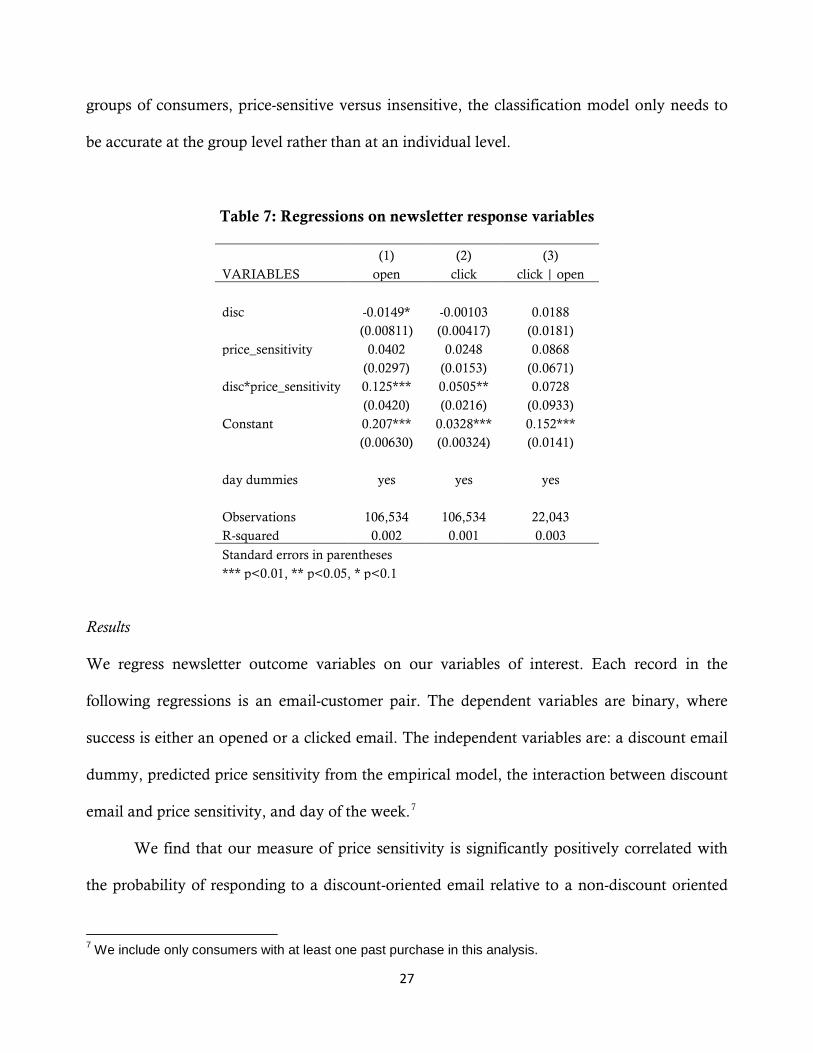
Results
We regress newsletter outcome variables on our variables of interest. Each record in the
following regressions is an email-customer pair. The dependent variables are binary, where
success is either an opened or a clicked email. The independent variables are: a discount email
dummy, predicted price sensitivity from the empirical model, the interaction between discount
email and price sensitivity, and day of the week.7
We find that our measure of price sensitivity is significantly positively correlated with
the probability of responding to a discount-oriented email relative to a non-discount oriented
7 We include only consumers with at least one past purchase in this analysis.
28
email. Table 7 considers the relationship between price sensitivity and three response variables:
(1) whether the email was opened, (2) whether a link in the email was clicked, and (3) whether
a link was clicked conditional on the email being opened. We find that price sensitivity is
positively associated with the first two measures, which had sample sizes almost five times
larger than the third measure.8
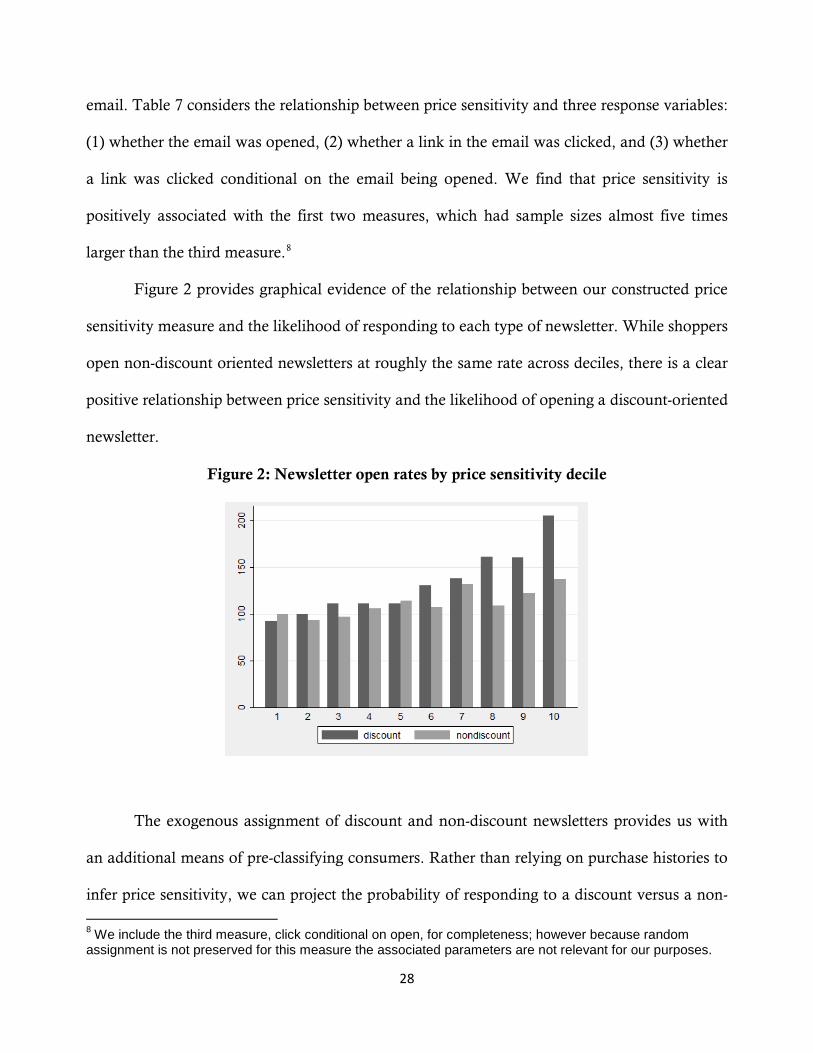
Figure 2 provides graphical evidence of the relationship between our constructed price
sensitivity measure and the likelihood of responding to each type of newsletter. While shoppers
open non-discount oriented newsletters at roughly the same rate across deciles, there is a clear
positive relationship between price sensitivity and the likelihood of opening a discount-oriented
newsletter.
Figure 2: Newsletter open rates by price sensitivity decile
The exogenous assignment of discount and non-discount newsletters provides us with
an additional means of pre-classifying consumers. Rather than relying on purchase histories to
infer price sensitivity, we can project the probability of responding to a discount versus a non-
8 We include the third measure, click conditional on open, for completeness; however because random assignment is not preserved for this measure the associated parameters are not relevant for our purposes.

29
discount newsletter on consumer attributes and thus have a model-based means of predicting
price sensitivity. Now that we have established the validity of our price sensitivity classification
approach, we can proceed to employ it in characterizing how shopping behaviors differ in
online retail environments depending on price sensitivity.
7 Field Experiment II
In our final experiment we investigate how shopper response to added search frictions varies
according to price sensitivity. Analogous to Field Experiment I, we expose consumers to
different versions of the online store, each with an added search friction element. We compare
the outcome versus control on retailer performance measures and make use of our predictive
models from the previous section to characterize the heterogeneity in shopper response.
Experimental Design
We ran this experiment on June 1 to 15, 2016 on the desktop and tablet versions of the
online store. In the succeeding analysis we use data from June 2 to 14 to eliminate the
possibility of contamination from the starting and winding down phases of the
implementation. All consumers were randomly assigned to either the control group or to one
of four treatment groups with equal probability. Whereas in Field Experiment I we included
only new visitors entering through the main landing pages, here we include new as well as
returning consumers regardless of which page they view first. The treatment conditions are as
follows:
Treatment 1: Removal of links from the main pages to outlet and sale sections of the website
Treatment 2: Removal of discount flags
30
Treatment 3: Removal of discount sorting option
Treatment 4: Replacement of discount-oriented banners with non-discount oriented banners
Differently from Experiment 1, we separate removal of discount flags and sorting
options into two different treatments for the sake of completeness. We also add a fourth
treatment, the use of non-discount oriented banners throughout the site, as this communication
approach is the website equivalent of the email treatments employed in the previous validation
experiment.
Results
Before looking at the impact of price sensitivity on shoppers’ propensities to find and
buy discounted items, we conduct the same analysis as in Table 8, which groups all types of
consumers. Further validating the main findings in Experiment I, this time including current
customers as opposed to only new customers, we find that removing discount flags, sorting by
discount and discount-oriented banners (Treatments 2 to 4) decreases both the average
discount of items purchased as well as the incidence of purchasing items on discount. As
before, this is achieved without a decrease in conversion rates. An exception to this, and
counter to findings in Experiment I, is the null effect of the removal of outlet and sales links
from the home page (Treatment 1). It seems that current customers were not as deterred as new
shoppers from finding the high discounts in the outlet portion of the website. This is not all that
surprising as many shoppers likely already knew of the outlet’s existence and just had to incur
in one additional click to find it. In sum, with the exception of this treatment, the addition of
search costs impacts new and current customers qualitatively in a very similar manner.

31
Table 8: Main results
Treatment Group
Number of visitors
Average discount of sold
items Percent of items
bought at full price
Number of orders
(Conversion rate)
Control 68,343 18.25% 49% 1,351 (1.98%)
Treatment 1 No outlet and
sales links 70,058 17.32%* 50% 1,599
(2.28%)***
Treatment 2 No discount
markers 70,025 16.69%*** 52%** 1,605
(2.29%)***
Treatment 3 No discount
sorting 69,859 17.09%** 51%** 1,605
(2.30%)***
Treatment 4 No discount
banners 69,825 16.80%*** 53%*** 1,713
(2.45%)*** * Significantly different from the control, p<0.10 ** Significantly different from the control, p<0.05 *** Significantly different from the control, p<0.01
A more precise test of our predictions is to show an interaction between a shopper’s
price sensitivity and their willingness to incur search costs to find discounted items. Using
repeat customers, while changing the “navigability” of the website is, in our view, a very
stringent test of this prediction. First, customers have memory and we expect them to
remember that heavily discounted items exist on the platform. Second, our manipulations are
quite subtle (i.e., mildly increasing search costs), entailing no changes in selling prices or
product assortment. Third, fashion retail is a category in which shoppers have a fairly good
sense of when prices are high or a bargain and may be more highly motivated to leave the
website if they do not find discounts. Despite these challenges, we still find a moderating role
32
of price sensitivity on the impact of search frictions on the likelihood of buying discounted
items.
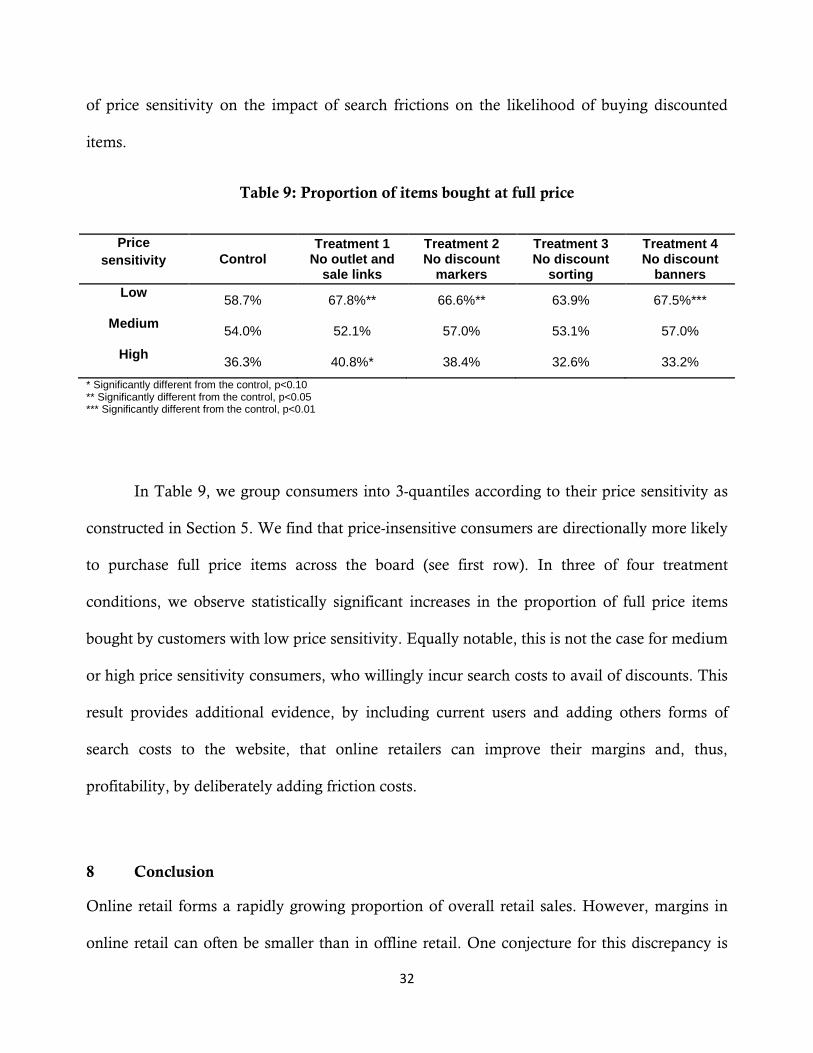
Table 9: Proportion of items bought at full price
Price sensitivity Control
Treatment 1 No outlet and
sale links
Treatment 2 No discount
markers
Treatment 3 No discount
sorting
Treatment 4 No discount
banners Low 58.7% 67.8%** 66.6%** 63.9% 67.5%***
Medium 54.0% 52.1% 57.0% 53.1% 57.0%
High 36.3% 40.8%* 38.4% 32.6% 33.2% * Significantly different from the control, p<0.10 ** Significantly different from the control, p<0.05 *** Significantly different from the control, p<0.01
In Table 9, we group consumers into 3-quantiles according to their price sensitivity as
constructed in Section 5. We find that price-insensitive consumers are directionally more likely
to purchase full price items across the board (see first row). In three of four treatment
conditions, we observe statistically significant increases in the proportion of full price items
bought by customers with low price sensitivity. Equally notable, this is not the case for medium
or high price sensitivity consumers, who willingly incur search costs to avail of discounts. This
result provides additional evidence, by including current users and adding others forms of
search costs to the website, that online retailers can improve their margins and, thus,
profitability, by deliberately adding friction costs.
8 Conclusion
Online retail forms a rapidly growing proportion of overall retail sales. However, margins in
online retail can often be smaller than in offline retail. One conjecture for this discrepancy is
33
that online sellers are less able to price discriminate than offline sellers. In this paper, we
explore how imposing search costs on online shoppers can improve gross margins by serving as
a sorting mechanism among customers.
We find encouraging evidence that minor changes to the design of an online store (i.e.,
frictions) can substantially improve its margins and profitability. By increasing search frictions
in simple ways—removing selected links, narrowing down product sorting options, and
limiting visual markers—online sellers can achieve more full priced sales from price sensitive
shoppers who experience higher search costs. While substantial enough to affect price
insensitive shoppers’ purchasing behavior, these search frictions are minor enough such that
price sensitive shoppers make the extra effort to locate discounted items. As a result, the
average selling price increases as the number of items sold remains stable.
Our results have direct implications for online sellers. Without changes to product
prices or assortment, online sellers can improve their margin performance by implementing
subtle changes to website design. We note that this is an essentially no-cost manipulation with
low data requirements, but one that can deliver large gains in margin. Our insight implies that
by unduly prioritizing ease of search and purchase, online sellers give up gross margins by
giving away discounts to price insensitive consumers.
In adding search frictions, we expected some decrease in conversion: by making high
discounts harder to locate, some price-sensitive consumers may choose not to spend the extra
time and effort on the website and leave. In fact, we find the rather surprising outcome that
conversion rates are not actually lower, and in fact higher in a few of our treatment conditions.
One explanation for this may be brand image effects: by concealing high discounts, new
customers may perceive the seller as being higher quality, thus increasing purchase instance.
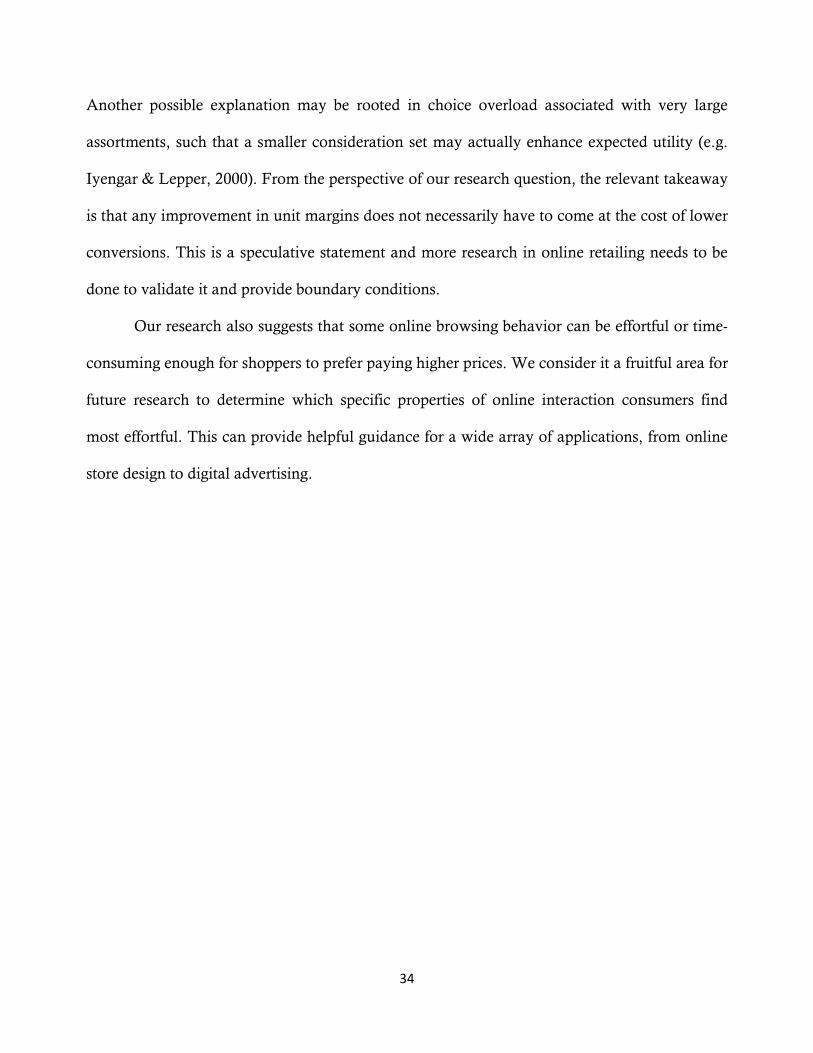
34
Another possible explanation may be rooted in choice overload associated with very large
assortments, such that a smaller consideration set may actually enhance expected utility (e.g.
Iyengar & Lepper, 2000). From the perspective of our research question, the relevant takeaway
is that any improvement in unit margins does not necessarily have to come at the cost of lower
conversions. This is a speculative statement and more research in online retailing needs to be
done to validate it and provide boundary conditions.
Our research also suggests that some online browsing behavior can be effortful or time-
consuming enough for shoppers to prefer paying higher prices. We consider it a fruitful area for
future research to determine which specific properties of online interaction consumers find
most effortful. This can provide helpful guidance for a wide array of applications, from online
store design to digital advertising.

References
Bakos, J.Yannis. 1997. Reducing buyer search costs: Implications for electronic marketplaces.
Management Science, 43(12), pp.1676-1692.
Bankrate. 2016. Insurance ‘loyalty tax’ in the crosshairs. By Jay MacDonald, published January 7,
2016. Accessed on January 7, 2016 at http://www.bankrate.com/financing/insurance/loyalty-tax-in-the-
crosshairs-for-2016
Bell, David R., Teck-Hua Ho, and Christopher S. Tang. 1998. Determining where to shop: Fixed and
variable costs of shopping. Journal of Marketing Research, pp.352-369.
Brynjolfsson, Erik and Smith, Michael D. 2000. Frictionless commerce? A comparison of Internet and
conventional retailers. Management Science, 46(4), pp.563-585.
Eisingerich, A.B. and Kretschmer, T., 2008. In e-commerce, more is more. Harvard Business Review,
86(3), pp.20-21.
Ellison, Glen and Ellison, Sara F., 2005. Lessons about Markets from the Internet. Journal of Economic
Perspectives, pp.139-158.
Ellison, Glen and Ellison, Sara F. 2009. Search, Obfuscation, and Price Elasticities on the Internet.
Econometrica, 77(2), pp.427-452.
Ellison, Glenn and Wolitzky, Alexander. 2012. A search cost model of obfuscation. The RAND Journal
of Economics, 43(3), pp.417-441.
Hannak, Aniko, Gary Soeller, David Lazer, Alan Mislove, and Christo Wilson. 2014. Measuring price
discrimination and steering on e-commerce web sites. In Proceedings of the 2014 Conference on Internet
Measurement Conference, ACM. pp. 305-318
Hughes, Ian. 2008. Customer loyalty in the UK general insurance market. Journal of Direct, Data and
Digital Marketing Practice, 10(1), pp.29-42.
Internet Retailer. 2015. Top 500 Guide, 2015 Ed.
Iyengar Sheena S., Lepper Mark R. (2000), “When Choice Is Demotivating: Can One Desire Too
Much of a Good Thing?” Journal of Personality and Social Psychology, 79 (6), 995–1006.
Kim, Byung-Do, Srinivasan, Kannan and Wilcox, Ronald T. 1999. Identifying price sensitive
consumers: the relative merits of demographic vs. purchase pattern information. Journal of Retailing,
75(2), pp.173-193.
Kopalle, Praveen, Biswas, Dipayan, Chintagunta, Pradeep K., Fan, Jia, Pauwels, Koen, Ratchford,
Brian T. and Sills, James A. 2009. Retailer pricing and competitive effects. Journal of Retailing, 85(1),
pp.56-70.

36
Lal, Rajiv, and David E. Bell. 2003. The impact of frequent shopper programs in grocery retailing."
Quantitative marketing and economics 1.2, pp.179-202.
Lynch Jr, John G. and Ariely, Dan. 2000. Wine online: Search costs affect competition on price,
quality, and distribution. Marketing Science, 19(1), pp.83-103.
Monga, Ashwani and Saini, Ritesh. 2009. Currency of search: How spending time on search is not the
same as spending money. Journal of Retailing, 85(3), pp.245-257.
Ngwe, Donald. 2016.Why Outlet Stores Exist: Averting Cannibalization in Product Line Extensions.
Marketing Science, forthcoming.
Paquette, Danielle. 2015. Why you should always buy the men’s version of almost anything. The
Washington Post. Dec. 22, 2015. Accessed on January 7, 2016 at
https://www.washingtonpost.com/news/wonk/wp/2015/12/22/women-really-do-pay-more-for-razors-
and-almost-everything-else/
Ratchford, Brian T. 2009. Online pricing: review and directions for research. Journal of Interactive
Marketing, 23(1), pp.82-90.
Rigby, D., 2011. The future of shopping. Harvard Business Review, 89(12), pp.65-76.
Stahl, Dale O. 1996. Oligopolistic pricing with heterogeneous consumer search. International Journal of
Industrial Organization, 14(2), pp.243-268.
Teixeira, Thales S., and Sunil Gupta. 2015. Can Retailers Win Back Shoppers Who Browse then Buy
Online? Harvard Business Review 93(9).
Varian, Hal R. 1980. A model of sales. The American Economic Review, pp.651-659.
Wilson, Chris M. 2010. Ordered search and equilibrium obfuscation. International Journal of Industrial
Organization, 28(5), pp.496-506.
Zettelmeyer, Florian. 2000. Expanding to the Internet: Pricing and communications strategies when
firms compete on multiple channels. Journal of Marketing Research, 37(3), pp.292-308.
37
Appendix
Table A1: Conversion in Experiment #1
Group Sample size Transactions completed Items sold Control 26,014 318 681 Treatment 1 26,199 355* 695 Treatment 2 26,343 355* 712 Treatment 3 26,049 334 589***
Note: *** p<0.01, ** p<0.05, * p<0.1
Table A2: OLS parameter estimates from historical purchase data
(1) (2) (3) (4) VARIABLES basket_markdown basket_markdown basket_markdown basket_markdown male -0.0101***
-0.00674***
(0.000477)
(0.000613)
cust_age -8.22e-07***
-7.04e-07***
(5.88e-08)
(7.19e-08)
prev_markdown
0.248***
0.247***
(0.00116)
(0.00115)
prev_coupon
0.0158***
0.0264***
(0.000523)
(0.000548)
order
-0.000401***
-0.000286***
(2.78e-05)
(2.80e-05)
prev_sb_ratio
0.00623***
0.00416***
(0.000718)
(0.000717)
cust_hist
4.33e-06***
3.94e-06***
(1.17e-06)
(1.17e-06)
wallet
0.00297*** -0.00517***
(0.000805) (0.000850)
coupon
-0.0278*** -0.0395***
(0.000425) (0.000548)
Constant 0.212*** 0.120*** 0.177*** 0.138***
(0.00428) (0.000411) (0.000693) (0.00577)
Billing region FE yes
yes Month FE
yes yes
Observations 1,112,297 698,456 1,112,298 698,456 R-squared 0.003 0.063 0.014 0.081 Standard errors in parentheses
*** p<0.01, ** p<0.05, * p<0.1
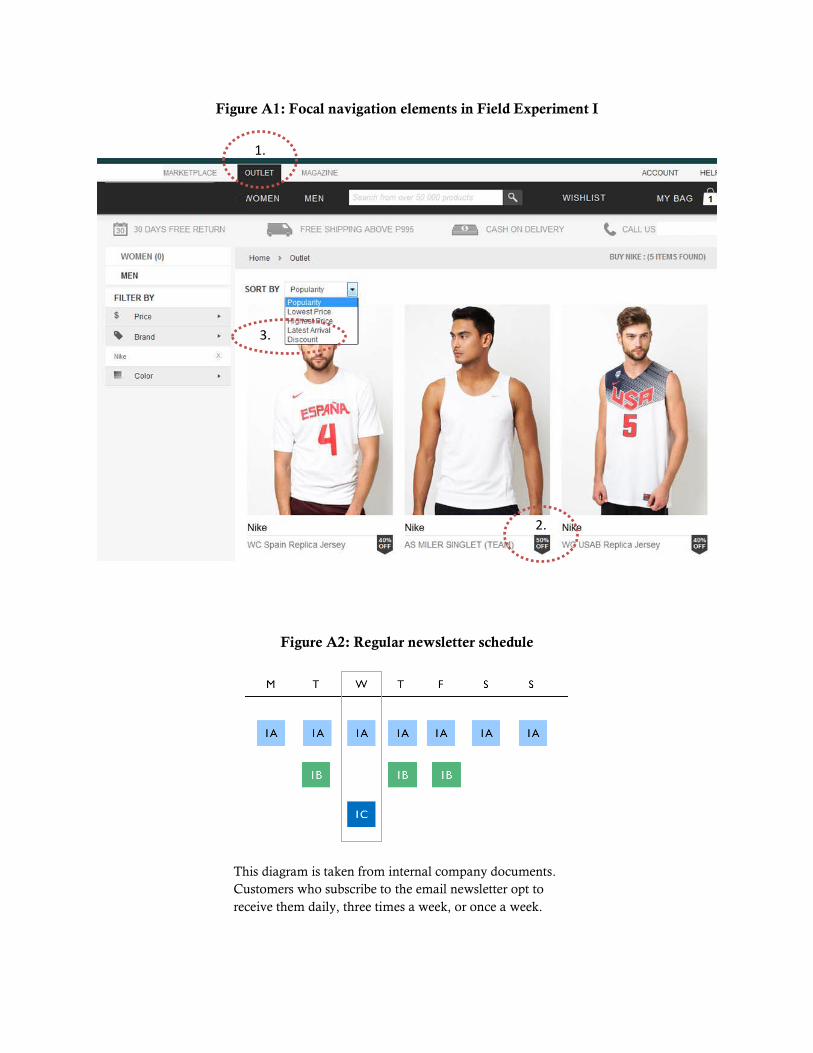
Figure A1: Focal navigation elements in Field Experiment I
Figure A2: Regular newsletter schedule
This diagram is taken from internal company documents. Customers who subscribe to the email newsletter opt to receive them daily, three times a week, or once a week.
1.
2.
3.
39
Figure A3: Examples of discount and non-discount email newsletters
This pair of newsletters is representative of the array of discount- and non-discount newsletters sent out in the validation experiment. Product categories differed between days, as did newsletters sent to male and female recipients. These are two out of a total of 22 unique newsletters sent out during the experiment.