
IMPROVING LEGACY AIRCRAFT SYSTEMS THROUGH … · Improving legacy aircraft systems through...
144
Calhoun: The NPS Institutional Archive Theses and Dissertations Thesis Collection 2014-09 Improving legacy aircraft systems through Condition-Based Maintenance: an H-60 case study Reeder, Joshua A. Monterey, California: Naval Postgraduate School http://hdl.handle.net/10945/43985
-
Upload
doannguyet -
Category
Documents
-
view
216 -
download
0
Transcript of IMPROVING LEGACY AIRCRAFT SYSTEMS THROUGH … · Improving legacy aircraft systems through...

Calhoun: The NPS Institutional Archive
Theses and Dissertations Thesis Collection
2014-09
Improving legacy aircraft systems
through Condition-Based Maintenance:
an H-60 case study
Reeder, Joshua A.
Monterey, California: Naval Postgraduate School
http://hdl.handle.net/10945/43985

NAVAL
POSTGRADUATE
SCHOOL
MONTEREY, CALIFORNIA
THESIS
Approved for public release; distribution is unlimited
IMPROVING LEGACY AIRCRAFT SYSTEMS
THROUGH CONDITION-BASED MAINTENANCE:
AN H-60 CASE STUDY
by
Joshua A. Reeder
September 2014
Thesis Advisor: Gary O. Langford
Second Reader: Richard C. Millar

THIS PAGE INTENTIONALLY LEFT BLANK

i
REPORT DOCUMENTATION PAGE Form Approved OMB No. 0704-0188 Public reporting burden for this collection of information is estimated to average 1 hour per response, including the time for reviewing instruction,
searching existing data sources, gathering and maintaining the data needed, and completing and reviewing the collection of information. Send comments regarding this burden estimate or any other aspect of this collection of information, including suggestions for reducing this burden, to
Washington headquarters Services, Directorate for Information Operations and Reports, 1215 Jefferson Davis Highway, Suite 1204, Arlington, VA
22202-4302, and to the Office of Management and Budget, Paperwork Reduction Project (0704-0188) Washington DC 20503.
1. AGENCY USE ONLY (Leave blank)
2. REPORT DATE September 2014
3. REPORT TYPE AND DATES COVERED Master’s Thesis
4. TITLE AND SUBTITLE
IMPROVING LEGACY AIRCRAFT SYSTEMS THROUGH CONDITION-
BASED MAINTENANCE: AN H-60 CASE STUDY
5. FUNDING NUMBERS
6. AUTHOR(S) Joshua A. Reeder
7. PERFORMING ORGANIZATION NAME(S) AND ADDRESS(ES)
Naval Postgraduate School
Monterey, CA 93943-5000
8. PERFORMING ORGANIZATION
REPORT NUMBER
9. SPONSORING /MONITORING AGENCY NAME(S) AND ADDRESS(ES)
N/A 10. SPONSORING/MONITORING
AGENCY REPORT NUMBER
11. SUPPLEMENTARY NOTES The views expressed in this thesis are those of the author and do not reflect the official policy
or position of the Department of Defense or the U.S. Government. IRB Protocol number ____N/A____.
12a. DISTRIBUTION / AVAILABILITY STATEMENT Approved for public release; distribution is unlimited
12b. DISTRIBUTION CODE
13. ABSTRACT (maximum 200 words)
Condition-Based Maintenance (CBM) has been the focus of Department of Defense efforts to reduce the cost of maintaining
weapons systems for nearly two decades. Through an investigation of the MH-60S helicopter, this paper uses a gap analysis
framework to determine the value of increasing CBM usage.
The Naval Aviation Maintenance Program (NAMP) has used scheduled inspections as the backbone of aviation maintenance since
1959. The most significant of these inspections is the phase cycle, which provides inspection of aircraft components based on flight
hours. This study uses the MH-60S to conduct a capability gap analysis for CBM in naval aviation. Through the use of a JCIDS
Capabilities Based Assessment, the capability gap between the CBM enabling IMD-HUMS and the NAMP phase cycle is
determined. From this gap analysis, Earned Value Management (EVM) tools determine the value of closing the CBM capability
gap between the phase maintenance and IMD-HUMS in terms of cost and safety. Finally, an alternative phase maintenance
structure is proposed for MH-60S maintenance which leverages the CBM capabilities of the IMD-HUMS to reduce total lifecycle
costs.
14. SUBJECT TERMS Naval Aviation, Condition-Based Maintenance (CBM), Gap Analysis, Naval
Aviation Maintenance Program (NAMP), Value Engineering, Earned Value Management, MH-60S,
Phase Maintenance
15. NUMBER OF
PAGES 143
16. PRICE CODE
17. SECURITY
CLASSIFICATION OF
REPORT Unclassified
18. SECURITY
CLASSIFICATION OF THIS
PAGE
Unclassified
19. SECURITY
CLASSIFICATION OF
ABSTRACT
Unclassified
20. LIMITATION OF
ABSTRACT
UU
NSN 7540-01-280-5500 Standard Form 298 (Rev. 2-89)
Prescribed by ANSI Std. 239-18

ii
THIS PAGE INTENTIONALLY LEFT BLANK

iii
Approved for public release; distribution is unlimited
IMPROVING LEGACY AIRCRAFT SYSTEMS THROUGH
CONDITION-BASED MAINTENANCE: AN H-60 CASE STUDY
Joshua A. Reeder
Lieutenant, United States Navy
B.S., United States Naval Academy, 2006
Submitted in partial fulfillment of the
requirements for the degree of
MASTER OF SCIENCE IN SYSTEMS ENGINEERING MANAGEMENT
from the
NAVAL POSTGRADUATE SCHOOL
September 2014
Author: Joshua A. Reeder
Approved by: Gary Langford, PhD.
Thesis Advisor
Richard C. Millar, DSc.
Second Reader
Clifford Whitcomb, PhD.
Chair, Department of Systems Engineering

iv
THIS PAGE INTENTIONALLY LEFT BLANK
v
ABSTRACT
Condition-Based Maintenance (CBM) has been the focus of Department of Defense
efforts to reduce the cost of maintaining weapons systems for nearly two decades.
Through an investigation of the MH-60S helicopter, this paper uses a gap analysis
framework to determine the value of increasing CBM usage.
The Naval Aviation Maintenance Program (NAMP) has used scheduled
inspections as the backbone of aviation maintenance since 1959. The most significant of
these inspections is the phase cycle, which provides inspection of aircraft components
based on flight hours. This study uses the MH-60S to conduct a capability gap analysis
for CBM in naval aviation. Through the use of a JCIDS Capabilities Based Assessment,
the capability gap between the CBM enabling IMD-HUMS and the NAMP phase cycle is
determined. From this gap analysis, Earned Value Management (EVM) tools determine
the value of closing the CBM capability gap between the phase maintenance and IMD-
HUMS in terms of cost and safety. Finally, an alternative phase maintenance structure is
proposed for MH-60S maintenance which leverages the CBM capabilities of the IMD-
HUMS to reduce total lifecycle costs.

vi
THIS PAGE INTENTIONALLY LEFT BLANK

vii
TABLE OF CONTENTS
I. INTRODUCTION........................................................................................................1 A. BACKGROUND ..............................................................................................1 B. SCOPING THE MAINTENANCE COST PROBLEM ...............................2 C. APPROACH, METHOD, AND SCOPE ........................................................6
II. NAVAL AVIATION MAINTENANCE PROGRAM (NAMP) ............................11 A. NAMP OVERVIEW ......................................................................................11
1. NAMP Organization ..........................................................................13 2. Performance Improvement ...............................................................16 3. Maintenance Levels ...........................................................................16
B. NAMP PROCEDURES .................................................................................19
1. Maintenance Department ..................................................................20
2. Aircraft Inspection and Repair Process ...........................................21 a. Scheduled Maintenance ..........................................................21
b. Corrective Maintenance ..........................................................24
III. LITERATURE REVIEW .........................................................................................27
A. GAP ANALYSIS ............................................................................................28 1. Necessity of Gap Analysis ..................................................................28 2. JCIDS Process ....................................................................................32
3. Value Engineering and Earned Value Management ......................33 B. BOUNDARIES ...............................................................................................37
1. Functional Boundaries.......................................................................37 2. Physical Boundaries ...........................................................................38
3. Behavioral Boundaries ......................................................................39 C. CONDITION-BASED MAINTENANCE ....................................................40
1. CBM Literature .................................................................................41 D. IMD/HUMS ....................................................................................................47
1. IMD/HUMS Components ..................................................................47
2. IMD/HUMS Usage .............................................................................52
IV. GAP ANALYSIS ........................................................................................................55
A. STUDY SUBJECTS .......................................................................................56 B. MEASURES AND METRICS ......................................................................58
1. Measure of Effectiveness and Performance ....................................58 a. Maintenance Labor Hours .....................................................59 b. Flight Hours ............................................................................59
c. Availability ...............................................................................60 d. Flight Safety ............................................................................61
2. Metrics ................................................................................................61 3. Value....................................................................................................62
C. CAPABILITIES-BASED ASSESSMENT ...................................................63 1. JCIDS CBA Guide .............................................................................63 2. CBA Concept of Operations .............................................................64

viii
a. Problem....................................................................................64
b. Solution....................................................................................64 c. Goal..........................................................................................65
d. Timeline ...................................................................................65 e. Scope ........................................................................................66 f. Commander’s Intent ...............................................................67 g. Operational Overview .............................................................67 h. Objectives .................................................................................70
i. Roles and Responsibilities ......................................................70
V. RESULTS ...................................................................................................................71 A. DATA COLLECTION METHODS .............................................................71
1. NALCOMIS/OOMA..........................................................................71 2. Sierra/Hotel Advanced Readiness Program ....................................73
3. IMDS Ground Station .......................................................................74
4. Naval Safety Center Web Enabled Safety System ..........................75 B. DATA ANALYSIS BASELINE ....................................................................77
1. IMDS and Non-IMDS Capability .....................................................77 a. Maintenance Labor Hours .....................................................78 b. Flight Hours ............................................................................80
c. Availability ...............................................................................81 2. Maintenance Performance Baseline .................................................82
C. PHASE INSPECTION ALTERNATIVE ....................................................87 1. IMDS Data ..........................................................................................87 2. Alternative Phase Inspections ...........................................................88
D. EARNED VALUE ..........................................................................................91
1. Assumptions and Methods ................................................................91
2. Earned Value Calculations ...............................................................93 3. Flight Safety ........................................................................................96
E. RESIDUAL CAPABILITY GAPS ...............................................................97
VI. CONCLUSIONS ........................................................................................................99 A. STUDY EXTENSIONS ...............................................................................101
B. RECOMMENDATIONS .............................................................................102
APPENDIX A. MAINTENANCE DATA. .........................................................................105
APPENDIX B. IMDS DATA ..............................................................................................111
LIST OF REFERENCES ....................................................................................................117
INITIAL DISTRIBUTION LIST .......................................................................................119

ix
LIST OF FIGURES
Figure 1. Maintenance Department Architecture Example. ............................................21 Figure 2. Value Equation (from Langford and Franck 2009, 16). ..................................36 Figure 3. Worth Equation (from Langford and Franck 2009, 19). ..................................36 Figure 4. Functional Decomposition. ..............................................................................38 Figure 5. MH-60S IMDS Block Diagram (from NAVAIR 2010, 004 00-8). .................48
Figure 6. IMDS Accelerometer Diagram (from NAVAIR 2010, Figure 4A). ................51 Figure 7. IMDS Capability Hypothesis Test ...................................................................78

x
THIS PAGE INTENTIONALLY LEFT BLANK

xi
LIST OF TABLES
Table 1. MH-60S Special Inspections (after NAVAIR 2013). ......................................22 Table 2. Phase Cycles. (after NAVAIR 2013) ...............................................................23 Table 3. Naval Aviation Vision 2020 Strategic Readiness Goals. .................................30 Table 4. Naval Aviation Vision 2020 Strategic Readiness Actions. ..............................30 Table 5. IMDS Accelerometers (after NAVAIR 2010, 004 00-7).................................50
Table 6. IMDS Ground Station Capabilities (from NAVAIR 2010). ............................52 Table 7. Measures and Metrics ......................................................................................58 Table 8. IMDS Samples. ................................................................................................75 Table 9. Phases by Squadron. ........................................................................................77 Table 10. IMDS Effect on Phase Labor Hours ................................................................79
Table 11. FCF Flight Hours t-Test ...................................................................................81
Table 12. Operational Availability (IMDS v. non-IMDS)...............................................82 Table 13. Maintenance Labor Hours Performance Baseline (Part A) .............................83 Table 14. Maintenance Labor Hours Performance Baseline (Part B) ..............................84
Table 15. Flight Hours Performance Baseline (Part A) ...................................................84 Table 16. Flight Hours Performance Baseline (Part B) ...................................................85
Table 17. Availability Performance Baseline ..................................................................86 Table 18. Alternative Phase Inspections. .........................................................................89 Table 19. Value Calculations. ..........................................................................................94
Table 20. Operational Availability (Baseline versus Alternate) ......................................95 Table 21. Total Labor Hours and Flight Hours (Baseline versus Alternate) ...................95

xii
THIS PAGE INTENTIONALLY LEFT BLANK

xiii
LIST OF ACRONYMS AND ABBREVIATIONS
AE Age Exploration
AE Aviation Electrician’s Mate
AO Aviation Ordnance man
AT Aviation Electronics Technician
ATABS Automated Track and Balance Set
BIT Built-In Test
BUNO Bureau Number
CBA Capabilities Based Assessment
CBM Condition-Based Maintenance
CBM+ Condition-Based Maintenance Plus
CMC Commandant of the Marine Corps
CNO Chief of Naval Operations
COMFRC Commander, Fleet Readiness Centers
COMNAVAIRFOR Commander, Naval Air Forces
CONOPS concept of operations
CVW carrier air wing
D-Level depot level
DOD Department of Defense
DON Department of the Navy
DTMU Data Transfer Memory Unit
DTU Data Transfer Unit
EVM Earned Value Management
FCF functional check flight
FRS Fleet Replacement Squadron
GS Ground Station
HAZREP Aviation Hazard Report
HSC Helicopter Sea Combat Squadron
HSCWP Helicopter Sea Combat Wing, Pacific
HUMS Health Management Usage System
I-Level intermediate level
xiv
IMDS Integrated Mechanical Diagnostic System
IVHMS Integrated Vehicle Health Management System
IVHMU Integrated Vehicle Health Management Unit
JCIDS Joint Capabilities Integration and Development System
MAF Maintenance Action Form
MDT Maintenance Down Time
MFD Multifunction Display
MMP Monthly Maintenance Plan
MOP measure of performance
MRC Maintenance Requirement Card
MTBM Mean Time Between Maintenance
NAE Naval Aviation Enterprise
NALCOMIS Naval Aviation Logistics Command Management
Information System
NAMP Naval Aviation Maintenance Program
NAVAIR Naval Air Systems Command
OBS on-board system
OEF Operation Enduring Freedom
OIF Operation Iraqi Freedom
O-Level operational level
OOMA Optimized Organizational Maintenance Activity
PCMCIA Personal Computer Memory Card International Association
PMI Planned Maintenance Interval
RCM Reliability Centered Maintenance
SBM Similarity Based Models
SE support equipment
SHARP Sierra/Hotel Advanced Readiness Program
T/M/S Type/Model/Series
TD technical directive
TM Type Maintenance Code
VGA Value Gap Analysis
VIB-100 Vibration Analysis Manual (ATABS)

xv
VIB-200 Vibration Analysis Manual (IMDS)
WESS Naval Safety Center Web Enabled Safety System

xvi
THIS PAGE INTENTIONALLY LEFT BLANK

xvii
EXECUTIVE SUMMARY
The cost of developing and maintaining weapons systems has become a central focus of
managers within the Department of Defense (DOD) in recent years. Following the
downsizing of the U.S. military after the Cold War and the Global War on Terror, all
communities within the DOD have been forced to find ways to reduce the cost of doing
business. The U.S. Navy has expressed a desire for nearly two decades to streamline the
maintenance process for weapons systems through the use Condition-Based Maintenance
(CBM) to reduce lifecycle costs. Within Naval Aviation, a series of tools, such as the
Goodrich Integrated Mechanical Diagnostic-Health Usage Management System (IMD-
HUMS), have been developed to enable greater CBM capability.
To date, this CBM capability has not been fully implemented, and aviation
maintenance is still based upon inspection cycles. The continued reliance on this
decades-old maintenance program and its use of inspections has created a substantial
capability gap in relation to the desired CBM capability. This study applied a capability
gap analysis to the current Naval Aviation Maintenance Program (NAMP) using the MH-
60S helicopter as its focus. The focus of this study was on the phase inspection process,
which serves as the backbone of the current NAMP. Through the use of a JCIDS
Capabilities Based Assessment (CBA), the CBM capability gap was assessed and an
alternative maintenance process using CBM in the MH-60S was proposed.
The results of the study show that Integrated Mechanical Diagnostic System
(IMDS) is capable of supporting a more robust CBM capability using data currently
collected from aircraft. IMDS was also found to provide no statistically significant
capability in its current usage other than a slight reduction in functional check flight
(FCF) flight hours. The alternative phase model attempted to evolve the current phase
model through the introduction of CBM. The alternative case keeps phase inspections in
place at the same intervals as the current process, but with a greatly reduced number of
component inspections. The inspections removed from the phase process involve engine,
rotor and drive train systems which are currently monitored by IMDS. The comparison

xviii
of the baseline and alternative models revealed a significant value to implementing
greater CBM.
The primary goal of this study was to create a baseline of current maintenance
performance in the MH-60S and use a capability gap analysis to create a CBM
alternative. Using the work of Langford and Franck (2009) on the application of Value
Engineering and Earned Value Management (EVM) to Gap Analysis, the value of closing
the CBM gap within the MH-60S maintenance process was determined. The study used
data collected from a sampling of aircraft from the Helicopter Sea Combat Wing Pacific
(HSCWP) from July 2013 to August 2014.
Using measures of performance related to maintenance labor hours, flight hours,
availability and flight safety, the baseline case was created for maintenance performance.
A series of comparisons was made between aircraft both equipped with the CBM
enabling IMDS system and aircraft without IMDS. These comparisons were used to
determine the value of IMDS as currently used in the fleet. Following the construction of
the baseline case, IMDS ground station data was used to determine the efficacy of IMDS
to implement CBM capabilities. Using this information, an alternative phase inspection
scheme was created that used CBM to replace phase inspections of IMDS monitored
systems. This alternative phase was then compared to the baseline case to determine the
value of closing the CBM capability gap using the work of Langford and Franck (2009).
Finally, flight safety data was used to help determine the possible effects of decreased
human inspection on aircraft mechanical failures.
The study assessed value based on the number of flight hours available per labor
hour during phase inspections. This value increased from 0.35 flight hours per phase
labor hour under the baseline model to an average of 1.07 flight hours per phase labor
hour with the alternative phase model. Additionally, the reduction of post-phase
vibration analysis through only need-based inspections of engine and drive train systems
increased available flight hours by 3.24 percent. This increase was a direct result in the
virtual elimination of post-phase FCFs due to changes in the phase inspection process.

xix
Availability of aircraft due to phase inspection down time increased from an
average of 69 percent to 93.7 percent. This increase was mostly due to the reduced labor
requirement during phase and the virtual elimination of post-phase FCFs. Additionally,
the study found that maintenance labor hours decreased by an average of 1,270 hours per
phase cycle, or about 318 hours per phase inspection under the alternative model.
Finally, the flight safety data revealed that in the period from 2009-2014, 60 percent of
MH-60S aircraft incidents caused by mechanical failure were as a result of human error
in maintenance. The study determined that there was no evidence with the flight safety
data to support any finding that the alternative phase model would compromise safety in
a meaningful way. Furthermore, safety would likely be improved by reducing the human
element of maintenance, which was the primary cause in a majority of reported
mechanical failures.
This study supports the Navy’s desired implementation of CBM into aviation
maintenance processes. A capability gap was identified within the current process, and a
reasonable alternative to current maintenance processes was proposed. This alternative
model provides a significant value to the Navy and should be explored in practice within
the fleet.
LIST OF REFERENCES
Langford, Gary O. and Raymond Franck. 2009. Gap Analysis: Application to Earned
Value Analysis. Monterey, CA: Naval Postgraduate School, Aug. 19

xx
THIS PAGE INTENTIONALLY LEFT BLANK

xxi
ACKNOWLEDGMENTS
This thesis was developed over the course of 15 months, and I would like to thank
several individuals who made the effort possible. Professor Gary Langford was my
project advisor and was an invaluable resource throughout the entire project. His work
past served as the basis for this thesis, and he provided guidance from the time before I
conceived the idea for this thesis until completion. Without his assistance, this thesis
would not have been possible.
I would like to thank Professor Richard Millar, my second reader, who provided a
great deal of guidance through my writing and editing effort.
Many people helped me collect the data necessary to make this project a reality. I
would like to thank Stephen Boyer, the HSC-3 Goodrich IMD-HUMS technical
representative for using his time to teach me the IMDS system. His guidance gave me a
great understanding of how to create a CBM system and was invaluable in creating this
thesis. I would also like to thank the personnel of HSC-3, HSC-8 and HSC-21 for
helping gain access to all of the data systems needed for this project and for your help in
collecting all of my data.
Finally, I would like to thank my wife, Annie, for all of her love and support
during my entire graduate school process. Thank you for reading all of my papers,
listening to me talk about engineering, and helping me through the last two years.

xxii
THIS PAGE INTENTIONALLY LEFT BLANK

1
I. INTRODUCTION
A. BACKGROUND
Since the end of the Cold War, the United States Department of Defense (DOD)
has undergone a significant shift in priorities. Through the two decades since the fall of
the Soviet Empire, the DOD has undergone a massive shift in focus away from the global
conflicts that dominated the last century. After the events of 9–11, the DOD focused on
combating terrorism and smaller scale, regional conflicts, which require a much different
force to achieve success. After more than a decade of warfare, the United States has
become a war-weary nation, and there are major questions about the future composition
of the military. As the recent limited engagements in Libya have shown, air power is
likely to be the key component of U.S. strategy with a lessened focus on ground forces.
With this possible seismic change as the backdrop, the DOD must find ways to continue
to execute its missions with greatly reduced resources. This resource-constrained
environment will put stress related to both budgets and manning on all of the services,
especially the U.S. Navy. The Navy will likely be responsible for developing new
weapons systems while maintaining an active presence around the world.
After more than a decade of war, the DOD faces significant changes to future
manning and force structure. This point was outlined by Secretary of Defense Chuck
Hagel when discussing the Obama Administration’s FY2015 DOD budget proposal
(Simeone 2014). In February 2014, Secretary Hagel detailed a series of “difficult
choices” that must be made for each of the services since the overall defense budget
would shrink by more than $75 billion by 2016, with larger cuts likely to follow
(Simeone 2014). This budget reduction is at the forefront of every decision throughout
the force and Naval Aviation was not exempt from the budgetary declines. As explained
in Defense News in March of 2014, the proposed FY2015 Naval Aviation budget saw
significant cuts for procurement and operations. According to the budget proposal,
procurement budgets would decrease for the year by nearly $5.1 billion and operations
and maintenance funding by $1.7 billion, or nearly 4 percent (Cavas 2014).

2
With the aging of its current fleet, the Navy must find a way to maximize the life
of current systems at a reduced cost while developing new systems that will fight the next
generation of wars. Over the last several years, the Navy has seen a significant reduction
at all levels of the force due to processes such as sequestration and right-sizing. Many
legacy systems still provide needed capabilities but require maintenance and logistics
efforts which have become severely outdated. In this environment, commanders at every
level, from the Pentagon down to the operational ships and squadrons, have been forced
to rethink how resources are managed. This change in direction also begs an important
question: How does the Navy find safe and effective ways to employ current systems at a
reduced cost?
To answer this critical question, an investigation of current processes is necessary
in order to determine the best use of current and future resources. However, a single
study cannot analyze every process throughout the Navy, as it has a diverse set of sea, air,
and land-based systems. Instead, this study was limited, with clearly defined boundaries
and focused on specific processes that can assist individual commanders in improving
their own organization. This study focused on the operational aviation squadron, which
serves as the smallest autonomous unit within the naval aviation enterprise. Research was
confined to helicopter squadrons and the maintenance processes involving the MH-60S
helicopter. This study attempted to determine the suitability of maintenance processes to
operate in current and future resource-restrained environments. To achieve this goal, an
analysis of capabilities was performed, gaps in capabilities were identified, and possible
solutions were explored in order to determine how to best employ the MH-60 in the
immediate future. This study’s results will remain valid for the time period where
calendar-based maintenance serves as the primary method of maintaining naval aircraft.
A shift in maintenance to a Condition-Based Maintenance (CBM) program would go
beyond the scope of this investigation and make its conclusions obsolete.
B. SCOPING THE MAINTENANCE COST PROBLEM
In the face of impending budget cuts, it is important to find ways to reduce costs
without degrading or eliminating the capabilities of current systems. To resolve this issue,

3
it is important to analyze the current operations and maintenance structure of naval
aircraft. Currently, all naval aviation units adhere to a single maintenance structure
known as the Naval Aviation Maintenance Program (NAMP), which standardizes
corrective and preventive maintenance processes fleet-wide. This program is explored to
determine where improvements can be made and what tools are available to implement
these changes.
The NAMP, officially known as the OPNAVINST 4790.2 series, was introduced
in 1959 and was the first attempt to standardize maintenance processes throughout naval
aviation. The NAMP has undergone a series of revisions in the last five decades, with the
most recent release occurring in May 2012 (Commander Naval Air Forces
[COMNAVAIRFOR] 2012). Even though changes have been made to the program, the
overall structure has remained essentially unchanged from the first version released over
five decades ago. The NAMP divides all maintenance efforts into three levels,
operational, intermediate and depot, and assigns specific tasks to each level as
appropriate (COMNAVAIRFOR 2012).
The operational level (O-level) refers to the day-to-day maintenance efforts of the
operational unit that typically serves as the reporting custodian for the aircraft. In simpler
terms, the operational level refers to maintenance performed by the unit, most typically a
squadron or air wing, which operates the aircraft. The intermediate and depot levels refer
to higher levels of maintenance that focus on inspecting and repairing equipment that
cannot be maintained at the operational level. Intermediate and depot levels are also
responsible for conducting maintenance related to improving and extending the service
life of aircraft and support equipment (COMNAVAIRFOR 2012). For the purposes of
this paper, the focus is on the operational level, as this is where a majority of the
maintenance actions are conducted and most of the manpower is concentrated.
The NAMP details seven maintenance functions generally performed at the O-
level: inspections, servicing, handling, on-equipment preventive and corrective
maintenance, incorporation of technical directives, record keeping and Reliability
Centered Maintenance (RCM) implementation (COMNAVAIRFOR 2012). One
important note is the interaction of RCM and Condition-Based Maintenance (CBM).

4
CBM is discussed in length in this study and is the primary enabler of the RCM concept
discussed in the NAMP. For simplicity sake, CBM shall be used throughout this study to
refer to all principle related to both CBM and RCM.
Regardless of the type of maintenance, most O-level preventive maintenance
functions are based on time cycles or the number of flight hours flown. Preventive
maintenance at the O-level is centered on individual aircraft, so each airframe has its own
set of requirements for inspections and maintenance actions. Some actions are scheduled
based on the amount of time since the previous inspection and others on the number of
hours flown or type of flight that was conducted. These inspections and the actions
related to their completion form the backbone of O-level maintenance. Corrective
maintenance actions are driven greatly by the results of these preventive maintenance
inspections and the operational usage of aircraft components. The NAMP and its
requirements will be explored in greater depth in following sections.
Having established the current state of naval aviation and its short and long-term
need to reduce costs, this paper focuses on the ways that maintenance processes can be
improved to save both resources and labor hours. The goal of this research is to find an
effective measure of the usefulness of current processes and identify areas in which these
processes can be improved using a systems engineering framework. To accomplish this
goal, a capability gap analysis was conducted to determine, as Langford et al. (2007)
noted, “the degree to which a current system satisfies a set of requirements.” In Chapters
II-IV, the current state of aviation maintenance is detailed, the use of condition-based
maintenance is described, and gap analysis is defined and conducted for the MH-60S.
The current NAMP, however, does not meet all of the performance goals outlined
above. As is discussed in Chapter II, the current NAMP does meet the needs of the
aviation force in terms of providing required warfighting capabilities. However, the
NAMP does not meet the goals laid out in the Naval Aviation Vision 2020 or DOD and
OPNAV directives with respect to condition-based maintenance. These issues are
explored in depth in Chapter III, as the failure of the NAMP in its current form to meet
CBM goals is a major driver of this research.

5
This study attempts to answer the following four questions directly related to the
continued safe and effective operation of naval aircraft:
1. How can naval aviation commanders improve the aircraft maintenance
process at the organizational level in order to meet increasing operational
requirements in a time of decreasing budgets?
2. What tools are available that can reduce the manpower and equipment
requirements for operational squadrons, how effective are these tools, and
are they being used to the greatest extent possible?
3. To what extent is there a gap between current capabilities and the
requirement to meet the Navy’s stated goal of maximizing the use of CBM
at the organizational level?
4. Are there any possible solutions that may have been overlooked that could
be more effective than the maintenance processes currently in use or
development?
Through answering these questions, a capability gap analysis framework is developed
and applied across Naval Aviation to meet the needs of both the DOD and public
stakeholders.
In order to answer these questions, Chapter II explores the NAMP in-depth, which
an understanding of its components and determine areas where cost-effective changes can
be implemented. In Chapter III, an investigation of relevant literature is conducted, a
theoretical gap analysis framework is explored, and CBM tools and processes are
discussed. Chapter IV presents the capability gap analysis based on the Joint Capabilities
Integration and Development System (JCIDS) Capabilities Based Assessment (CBA) and
the relevant measures of performance and metrics. This capability gap analysis explores
the research questions set forth above and constructs a systematic method for creating a
viable alternative to the current NAMP process. Relevant data is presented, and the
boundaries and scope of the analysis are clearly outlined and detailed. From this data,
comparisons are made between both processes and aircraft, and the results of the analysis
are presented in Chapter V. Finally, the formal conclusions of the study and possible
extensions to future research are presented in Chapter VI.

6
C. APPROACH, METHOD, AND SCOPE
Since the research goals have been established, the next important step is to create
a research approach that applies logical, systematic methods to the subject and construct a
clear scope for the investigation. The first steps are to provide the primary approach for
the research, determine the affected stakeholders, and provide the perspective necessary
to make the research questions relevant to the stakeholders needs. Once this research
approach has been established, the methods and processes can be detailed and the scope
of the investigation can be presented.
The approach to this research is formulated from the perspective of the users of
the MH-60S helicopter. The users constitute the most important set of stakeholders, since
they are the ones most responsible for the daily operation and maintenance of the aircraft.
The users are also the primary stakeholders responsible for the implementation of budget
decisions and will be responsible for installing new processes. That is to say, since the
users conduct most of the daily maintenance and all aircraft operations, they will be the
stakeholders most affected by changes to the process that governs these areas. The users
group, however, should not be taken to mean simply the pilots and aircrew that operate
aircraft in flight. Instead, the users will be defined as the entire operational level
squadron, including maintenance and support personnel that ensure proper aircraft
operations. Since all members of an operational level squadron primarily focus on aircraft
operations, even those acting in an administrative role, it is necessary to consider the
entire squadron as users for this research. Therefore, this paper will frame decisions from
the perspective of the user class. The research attempts to determine the value that users
derive from processes and how this value might be improved through process changes.
With the most important stakeholders identified, the next stage in determining the
best research approach is to establish the value added by this analysis. The principal goal
is obviously to maximize the benefit to stakeholders given the set of constraints that exist.
To accomplish this goal, the following must be established:
How are benefits defined?
What are the constraints?

7
How will benefits and constraints be quantified and measured?
To answer these questions, a capability gap analysis framework was established to
determine the value of process changes. The basis for this gap analysis has been derived
from both the JCIDS Capabilities Based Assessment and the work of Langford and
Franck (2009). Langford and Franck provide a method for determining the earned value
of systems engineering, and the necessary value and worth equations will be derived and
explained in more detail in Chapter III.
Benefits and constraints are closely related, as both are denominated in the same
terms. For instance, the constraints from the stakeholder’s perspective are the number of
maintenance labor hours available and the budget for personnel and materials necessary
for operations. Constraints are related to the operational commitments of individual
squadrons, along with the equipment and physical space available to conduct
maintenance and flight operations. Benefits are therefore measured in terms of the
maximum use of constrained resources. This, in turn, is applied to the capability gap
analysis. Through gap analysis, alternatives are created, the value of alternatives is
determined, and areas where further engineering is required to achieve the necessary
benefits are revealed. As with the research approach, the benefits and constraints of the
stakeholders are explored in more depth in Chapters III-V.
Having established the desired research methods, it is also necessary to explain
why these methods have any importance to the stakeholders, as well as the reasons for
limiting the investigation to a single set of stakeholders. The choice of capability gap
analysis is important due to its lengthy history of use within the DOD on acquisitions
projects, which consequently provides a stable comparison to other studies. Gap analysis
is directly related to the principles outlined in the JCIDS manual (CJCSI 3170.01H) and
the Defense Acquisition Guidebook (DOD 5000 Series) (Langford and Franck 2009). By
using this well-developed and understood framework as the basis for this analysis, the
results and conclusions can be presented in a format that stakeholders throughout DOD
can easily understand. Furthermore, resources are measured and denominated using the
same metrics as the current NAMP processes, so a direct comparison of alternatives can
be made and clear results determined. These comparisons will provide a greater

8
understanding of the results and conclusions throughout the naval aviation community,
even to those with limited systems engineering experience.
The final area that must be determined is the scope of the analysis, meaning what
are the particular activities within the boundaries of the investigation? Although the users
are not the only stakeholders that will be affected by changes to the aviation maintenance
process, their activities define the scope of this investigation. A narrow scope is
necessary because an investigation of the entire aviation maintenance process would be
expected to be extremely dense and offer comparisons that might be quite difficult to
understand.
For instance, the Navy operates jet, rotary and maritime aircraft, which have very
different maintenance requirements and are therefore difficult to compare directly. At the
highest level of abstraction, such comparisons as “to maintain” are confounded by the
lower-level details. Since each type of aircraft has diverse and different components and
structures, the usage of maintenance labor hours should be expected to vary greatly
across the different airframes. Therefore, a single airframe must be selected as the focus
for the study. In this case, helicopters will be studied, specifically the MH-60S
Knighthawk. The MH-60S provides an excellent basis for the study of maintenance
processes, as there are currently multiple variants in service that employ different aircraft
systems using the same NAMP processes. For this reason, data collected can easily be
divided based on installed systems, which simplifies the comparisons that are made.
As stated earlier, this study will also be focusing on maintenance at the
operational level. The operational level is the best place to investigate the maintenance
process since it contains most of the maintenance manpower usage and all flight
operations. Additionally, the operational level has been targeted by the Navy for the
implementation of NAMP alternatives, such as the use of CBM. CBM is a primary focus
of this study, since it serves as the preferred replacement for many processes in the
NAMP (4790.16A 2007). Further, CBM has been the driver of multiple new systems
built to ensure its capability, such as the Integrated Mechanical Diagnostics System
(IMDS) in the MH-60S. Therefore, CBM is explored in great depth and serves as the
primary alternative to the current maintenance process in this study’s comparisons.

9
Finally, the study will restrict its focus to the utilization of manpower and aircraft
within the seven O-level maintenance areas established in Chapter 3 of the current
NAMP (2012). This focus on the O-level allows for a comparison of process utility both
within and between squadrons, with the primary focus being tasks related to phase
inspections. The other areas listed still have significance, but inspections and preventive
and corrective maintenance provide the best means of comparing legacy maintenance
with CBM alternatives.

10
THIS PAGE INTENTIONALLY LEFT BLANK

11
II. NAVAL AVIATION MAINTENANCE PROGRAM (NAMP)
A. NAMP OVERVIEW
The history of naval aviation is littered with stories of both bravery and despair,
as men and women have fought and died in service through the air. After more than a
century of naval aviation, there are still great risks posed to aviators on a daily basis.
However, over the course of the last century, there has been a quantum leap in the safety
and reliability of the naval aviation enterprise. The hallmark of this great advance in
flight safety is the standardization of processes related to both flying and maintaining
aircraft. Following the Second World War, the U.S. Navy made a concerted effort to
reduce the number of aircraft mishaps, especially those causing injury, death or
destruction of aircraft. In order to accomplish this goal, a series of changes was
implemented to the entire naval flight process, which focused on standardization of
processes for aircrew, maintenance and administrative personnel. For the purposes of this
research, the focus will be fixed on the effectiveness of the maintenance processes.
Therefore, a detailed exploration of the current NAMP must be carried out to lay the
groundwork for examination of its efficacy and vulnerabilities in the modern budget
environment.
The NAMP contains an exhaustive description of all aviation maintenance
processes and procedures, outlines the composition of maintenance programs, and
delineates the responsibilities of each level of aviation maintenance. In essence, the
NAMP seeks to govern the efforts of everyone involved with aircraft maintenance and
guarantee that commonality is maintained across all platforms. This commonality helps
to ensure that processes are identical, regardless of the squadron, wing, or depot
performing the maintenance, and that procedures are applied identically regardless of the
platform being maintained. The NAMP has created a level of standardization that allows
maintenance personnel with specific expertise to work on any related system, regardless
of platform. For example, an individual that specializes in engine maintenance may have
spent the first 15 years of his or her career working on jets and jet engines. If a helicopter
squadron requires an experienced engine mechanic, he or she can be reassigned to the

12
helicopter platform and the procedures for work are the same, even though the machine
itself is different.
The NAMP has been very effective in helping lower the Class A mishap rate,
meaning accidents leading to death, serious injury, or serious damage or destruction of
aircraft. This rate has been reduced from 83.3 mishaps per 100,000 flight hours in 1945,
to 51.2 in 1953, to 1.89 in 2003 (Naval Aviation Schools Command [NASC] 2005).
However, the NAMP is not without its detractors, as the basic process has changed very
little since its inception in 1959. The NAMP does not meet the Navy’s current definition
for best maintenance practices that is outlined in the OPNAV 4790.16A, CBM
Instruction (2007). The NAMP itself even sets one of the operational level maintenance
goals as the “age exploration (AE) of aircraft and equipment under RCM”
(COMNAVAIRFOR 2013). The use of the operational level to validate RCM, and in
turn CBM, suggests that CBM is the preferred by the Navy over the current process.
In an era of increasingly complex systems, the Navy’s strict adherence to standard
processes, regardless of their fitness, and flexibility of manning have created parallel
issues for the efficacy of the NAMP. On one hand, standardization helps ensure
interoperability between diverse platforms and makes the entire maintenance process
more streamlined. On the other hand, this standardization has prevented system specific
maintenance processes from being developed. Additionally, it has slowed the progress
toward the use of integrated maintenance and monitoring equipment that could help
reduce costs and labor. Furthermore, although maintainers can move between platforms
under the NAMP, the complexity of modern systems makes this transition very time
consuming. For the author of this study, personal experience as a maintenance branch
division officer has shown that qualified and experienced individuals often take years to
achieve a level of competence on a new platform equal to their previous platform.
To be able to answer the key research questions posed in Chapter I, a systematic
examination of the current NAMP was conducted to form a baseline of maintenance
processes that were used as a benchmark to measure possible alternatives. Since the
NAMP is such an exhaustive resource, the focus of this research was narrowed in scope
to the operational level of maintenance on the MH-60S platform. This scope does not

13
mean that other areas of the NAMP will be ignored, as the process is greatly integrated, It
simply means that the majority of the effort will be focused at the organization level.
1. NAMP Organization
In Chapter I, there were four major research questions posed that seek to
determine how future naval aircraft maintenance should be conducted. The first of these
questions speaks to how operational commanders can improve processes in a time of
increasing operational commitments and decreasing budgets. Finding a solution to this
problem requires an understanding of the NAMP structure and contents.
The current maintenance program, outlined by the NAMP, is used fleet-wide by
all aviation squadrons. The NAMP has provided a level of standardization and
commonality between platforms and communities that has allowed successful flight
operations for nearly six decades. However, as discussed in Chapter I, the military as a
whole is undergoing a reorganization that will require significant budget cuts to all of the
services over the next decade. With the uncertainty of future funding for many programs,
the NAMP might not be the best available option in the future despite its past success in
comparison to its predecessors. Standardization on the level demanded by the NAMP
requires a significant funding effort to ensure compliance with its myriad of regulations.
Therefore, finding ways to lessen the regulatory burdens posed by the NAMP could
provide a great cost savings in the future.
With the impending shift in military funding, the discussion of the NAMP
processes shall be focused on cost savings, as the program is quite expansive. In keeping
with the scope of this study, the focus of this section is the operational level programs
and processes used by MH-60S squadrons. Since the maintenance processes outlined in
the NAMP include additional maintenance at both the depot and intermediate levels,
changes at the operational level affect the frequency and category of these higher level
maintenance functions. Since the operational level includes the majority of the
maintenance effort and cost, it is appropriate to focus on this level along with a
recommendation to extend this study to higher levels in the future. Therefore, the NAMP
can be examined in the appropriate operational context for the purposes of this study.

14
The NAMP is divided into chapters which each contain a single, unified theme.
There are currently a total of 17 individual chapters in the NAMP that detail the
organizations, responsibilities, procedures, and structure of the entire aviation
maintenance program from the CNO-level down to the operational level. For reference
purposes, the NAMP can be found in its entirety on the NAVAIR website,
http://www.navair.navy.mil/logistics/4790. The purpose of the NAMP is outlined in the
following text from the COMNAVAIRFOR, which details the objectives of the program
from the top level:
a. The objective of the NAMP is to achieve and continually improve
aviation material readiness and safety standards established by the
CNO/COMNAVAIRFOR, with coordination from the CMC, with
optimum use of manpower, material, facilities, and funds.
COMNAVAIRFOR aviation material readiness standards include:
(1) Repair of aeronautical equipment and material at that level of
maintenance which ensures optimum economic use of resources.
(2) Protection of weapon systems from corrosive elements through the
prosecution of an active corrosion control program.
(3) Application of a systematic planned maintenance program and the
collection, analysis, and use of data in order to effectively improve
material condition and safety.
b. The Naval Aviation Plan (secret) details logistics actions which will
allow the maximum opportunity to achieve this objective.
c. The methodology for achieving the spirit and intent of the NAMP
objective is labeled “performance improvement.” Performance
improvement is an “all hands” effort which focuses on service and close
support to customers. As a primary prerequisite, the mission must be
clearly understood and communicated to everyone in the organization. It is
essential that all personnel know their job, understand their contribution to
mission accomplishment, and are sensitive to customer requirements. New
or improved cost effective capabilities and processes must be continuously
pursued. Mutually supporting teamwork, constant communication, and
compatible measures are critical elements for success. Performance
improvement must be targeted to accomplish the following broad goals:
(1) Increased readiness.
(2) Improved quality.

15
(3) Improved deployability.
(4) Improved sustainability.
(5) Reduced costs.
(6) Enhanced preparedness for mobilization, deployability, and
contingency operations.
(7) Enhanced supply availability.
(8) Improved morale and retention.
(9) Compliance with environmental laws, rules, and regulations.
(COMNAVAIRFOR 2013, 1-4)
This passage outlines the three system-level requirements of the NAMP: repair of
equipment, control of corrosion, and systematic administrative oversight of the
maintenance process. To meet these requirements, a maintenance program as a whole
must achieve certain material readiness and safety standards as set forth in the Naval
Aviation Plan. Since the Naval Aviation Plan is classified, the specific metrics for
material readiness and safety that are considered successful are not conveyed in this
passage.
On the other hand, any study of NAMP processes that propose alternatives, such
as this one, must create measures of performance and metrics which apply to material
readiness and safety. Performance measures and metrics are discussed broadly in
Chapter IV, but this passage provides guidance for developing the metrics that are used to
measure performance. This passage goes further in saying that NAMP processes, and by
extension possible alternatives, must be focused on constant performance improvement.
The definition and intent of performance improvement is conveyed through the nine
goals listed above. Using these nine goals, measures of performance related to the MH-
60S were created and applied to both current processes and possible alternative to form
the basis for this study. Through the use of performance measures and metrics derived
from the requirements and goals listed in this passage, the efficacy of maintenance
processes and alternatives is determined.
16
2. Performance Improvement
Performance improvement in many ways serves as the focus of the NAMP, but
simply stating a need for improvement provides no means to measure it. Helpfully, the
NAMP does provide seven areas that are used as a basis for comparison of performance.
The seven areas of performance are: productivity, effectiveness, efficiency, quality,
innovation, quality of work life, and budgetability. (COMNAVAIRFOR 2013) Using
these seven areas along with the top-level requirements presented in the previous section,
metrics are focused on the areas considered most important by the NAMP. The
combination of these seven areas and the nine performance improvement goals from the
previous section on NAMP organization form the basis for this study’s metrics and
measures of performance. Therefore, these seven performance improvement areas along
with the nine performance improvement goals are the NAMP’s measures of
effectiveness. These measures of effectiveness and performance along with associated
metrics are discussed in Chapter IV and applied to the baseline and alternative
maintenance models created in Chapter V. Having determined the stakeholders,
requirements, goals, and metrics at the system level, the focus can now shift to the
operational level and squadron specific processes.
3. Maintenance Levels
Chapter 3 of the NAMP provides the basic division of activities between the three
levels of maintenance: depot, intermediate, and operational (COMNAVAIRFOR 2013).
The following section provides a focused mission statement of the division of labor
between the three levels of maintenance:
The NAMP, implemented through COMNAVAIRFOR, supports the CNO
and the CMC readiness and safety objectives and provides for optimum use
of manpower, facilities, material, and funds. The NAMP is founded upon
the three-level maintenance concept and is the authority governing
management of O-level, I-level, and D-level aviation maintenance. It
provides the management tools required for efficient and economical use of
personnel and material resources in performing maintenance. It also
provides the basis for establishing standard organizations, procedures, and
responsibilities for the accomplishment of all maintenance on naval aircraft,
associated material, and equipment. (COMNAVAIRFOR 2013, 3-1)

17
This passage restates the goals provided at the system level and gives a clear
statement of how these goals are translated to processes. To achieve this aim, the NAMP
provides a description of the maintenance concept for each level and the actions that must
be accomplished at that level. For the operational level, or O-level, the following
overview is given:
O-level maintenance is performed by an operating unit on a day-to-day
basis in support of its own operations. The O-level maintenance mission is
to maintain assigned aircraft and aeronautical equipment in a full mission
capable status while continually improving the local maintenance process.
While O-level maintenance may be done by IMA/COMFRC activities, O-
level maintenance is usually accomplished by maintenance personnel
assigned to aircraft reporting custodians.
O-level maintenance functions generally can be grouped under the
categories of:
a. Inspections.
b. Servicing.
c. Handling.
d. On-equipment corrective and preventive maintenance. (This includes
on-equipment repair, removal, and replacement of defective components.)
e. Incorporation of TDs, less SE, within prescribed limitations.
f. Record keeping and reports preparation.
g. AE of aircraft and equipment under RCM (COMNAVAIRFOR 2013, 3-1)
From this passage, the most important stakeholders are clearly the aircraft users at
the operational level. For the purposes of this study, the term “users” will refer to the
operational level aircrew and maintainers. Since ensuring material readiness and safety
are the focus of the NAMP, O-level maintenance must ensure these two areas are met.
Users, in the form of maintenance personnel, ensure the aircraft is in safe operating
condition to meet operational tasking. Users, in the form of aircrew operators, also
execute operational tasking and benefit directly from the safety provided by maintenance
practices. For these reasons, users are the most important stakeholders at the O-level, and
their concerns should always be the most important.

18
Using the NAMP guidance provided in the passage above, the seven functions of
O-level maintenance are:
To Inspect
To Service
To Handle
To perform on-equipment corrective and preventive maintenance
To incorporate TDs within prescribed limits
To keep records and prepare reports
To age explore aircraft and equipment under RCM
Since the users are the most important stakeholders at the O-level, these seven
functions must be performed to meet the stakeholder’s requirements. The stakeholder’s
requirements are not directly provided, but can be derived from the seven functions and
the requirements of the NAMP at the system level. As discussed earlier in this chapter,
the top-level NAMP functions are repair of equipment, control of corrosion, and
systematic administrative oversight of the maintenance process. Translating these
requirements to the operational level, the user’s requirements are “maintain operational
capability,” “document maintenance actions,” and “ensure safe operation of equipment.”
The first requirement, “maintain operational capability,” is met by performing the
functions related to inspection, servicing, handling, maintenance, and TDs. These areas
all detail how a squadron, the principle unit at the operational level, will maintain aircraft
and support equipment in the condition necessary to meet operational tasking. The
second requirement, “document maintenance,” is clearly met by the function “to keep
records and prepare reports.” The final requirement “ensure safe operation of aircraft” is
met by all of the seven functions, since performing these actions enables the safe
operation of aircraft.
The primary short coming of the current maintenance process is shown by the
final function “to age explore aircraft and equipment under RCM.” As discussed in
Chapter I, RCM is the enabled by CBM, which is not currently practiced at the O-level.

19
The purpose of this requirement is to explore the efficacy of CBM at the O-level and
collect data necessary to implement the Navy’s desired CBM capability. Since CBM is
not currently used as a maintenance method at the O-level, this function is not truly met
and a capability gap exists at the O-level. This study seeks to determine the value of
eliminating this CBM capability gap.
Reliability centered maintenance is the basis for CBM, which will be explored in
depth throughout the rest of this thesis. In this case, RCM is presented as the only
seriously considered solution to improve the maintenance process at the O-level. RCM
might be the best alternative, but including a specific solution set within a requirement
introduces an unnecessary bias to process of “performance improvement”. A more
appropriate term in this case would be to “conduct age exploration of aircraft and
equipment under alternative processes” and then outline a series of possible alternatives
that includes RCM. Even though RCM may prove to be the best alternative, the robust
series of performance improvement goals described at the system level should be less
specific to allow selection of the best performance solution.
B. NAMP PROCEDURES
Having established the stakeholders, requirements and functions at the O-level,
the NAMP provides the procedures to be followed to satisfy the users’ requirements. The
primary maintenance procedures are provided in the NAMP Standard Operating
Procedures, or NAMPSOPs. NAMPSOPs are detailed in Chapter 10 of the current
NAMP edition, and are typically program-specific directives which detail the
requirements for each maintenance program. For example, current NAMPSOPs outline
programs such as quality assurance, discrepancy reporting, maintenance training and tool
control. (COMNAVAIRFOR 2013) Each NAMPSOP serves as another level of
decomposition in the aviation maintenance system, detailing the individual programs
which exist at the operational level. From each NAMPSOP, more detailed descriptions of
functions are determined by decomposing these top-level functions. These
decompositions are equivalent to a detailed design effort in systems engineering.
NAMPSOPs have a common architectural structure which is applied to all programs at

20
the operational level. This common architecture provides a structure for all existing
maintenance programs, and serves as a template for the development of new programs
which meet the “performance improvement” goals at the system-level.
1. Maintenance Department
In addition to the NAMPSOP, the architecture of the maintenance department is
established with the NAMP. In this case, architecture refers to all of the operational
processes that occur within a maintenance department to accomplish operational tasking.
This architecture describes the chain of command within each maintenance department
and the derivative work centers. The architecture of standardizes the flow of tasks within
the maintenance department, with each individual work center reporting to a maintenance
control (COMNAVAIRFOR 2013). The work centers are sub-divided into the aircraft
division and avionics/armament divisions (AV/ARM). Each division is then further
divided into branches by aircraft system expertise (COMNAVAIRFOR 2013). For
example, all aviation electronics technicians (AT) are part of the avionics branch, which
combines with the ordinance (AO) and electricians (AE) branches to form the AV/ARM
division (COMNAVAIRFOR 2013). Each division then reports to the maintenance
control, which serves as the manager of all maintenance activities within the unit
(COMNAVAIRFOR 2013). Parallel structures for material and production control also
exist, but these areas fall mostly outside the scope of this analysis and will be discussed
only where necessary and not in detail. Figure 1 shows the architecture of the
maintenance department.

21
Figure 1. Maintenance Department Architecture Example.
2. Aircraft Inspection and Repair Process
The final portion of the NAMP to be explored is the aircraft inspection and repair
procedures. Inspections and repairs are the most labor intensive portion of the NAMP at
the operational level. Inspection and repair serve as the major sources of preventive and
corrective maintenance. This discussion of inspections and repairs is not exhaustive, but
provides a basic overview of both preventive and corrective maintenance activities. These
areas serve as the baseline for the comparison of alternatives to the current NAMP that
will follow in subsequent sections.
a. Scheduled Maintenance
Most of the preventive maintenance mandated by the NAMP is scheduled based
on flight hours, operating hours or calendar days. The goal of each operational squadron
is to minimize the number of concurrent inspections taking place at any time
(COMNAVAIRFOR 2013). For simplicity sake, the focus remains on the two primary
scheduled maintenance regimes covered in this thesis: special inspections and phase
inspections. Special inspections are primarily related to elapsed time, flight hours, or
cycles of events. The specific tasks carried out on each special inspection depend on the
platform being inspected, but the time interval for special inspections are constant across
all airframes (COMNAVAIRFOR 2013). Table 1 includes the MH-60S specific special
inspections and their intervals.
MC Level Division Level Branch Level
Ordnance Branch
Electricians
Branch
AV/ARM Division
Maintenance
Control
Power Plants Branch Paraloft Branch
Avionics Branch
Aircraft Division Line Division
Airframes BranchCorrosion Control
Branch

22
Table 1. MH-60S Special Inspections (after NAVAIR 2013).
7 Day 56 Day 360 Day 546 Day 525 Hour
14 Day 112 Day 364 Day 728 Day 700 Hour
28 Day 180 Day 365 Day 30 Hour 1000 Hour
30 Day 224 Day 448 Day 60 Hour
In addition to these inspections that are based on time intervals, phase inspections
are conducted at regular intervals to inspect all aircraft systems. Currently, the MH-60S
uses a 700-hour phase cycle in four inspections occurring once every 175 flight hours
(Naval Air Systems Command [NAVAIR] 2013). The phases are labeled as A, B, C, and
D, and Table 2 details the specific maintenance performed during each phase inspection.
Under the current NAMP, all scheduled maintenance is divided into more
manageable parts, with all aircraft components inspected once every 1000 flight hours or
728 days (approximately 2 years). The NAMP also provides for deviations from the
established cycles to accommodate continued operations when necessary
(COMNAVAIRFOR 2013). Additionally, maintenance schedules at the operational level
are contained in the monthly maintenance plan (MMP), where each command details its
plan for all scheduled maintenance activities for the next month (COMNAVAIRFOR
2013).

23
Table 2. Phase Cycles. (after NAVAIR 2013)
Phase Hours Assist Hours
All 79.5 91.4
1.3 1
1.3 1
1 1
8.7 7.7
17 17
1.5 1.5
1 1
1.3 1
0.5 0
2.4 2.1
1 0
0.5 0.5
6 10
2.3 0
0.5 0
2.8 2.5
0.6 0.1
2.8 2.3
0.5 0
16.5 32.5
2 3
1 1
1.5 2
0.7 0.5
0.7 0.7
2 2
0.4 0
1 0.5
0.7 0.5
A/C 33.9 29
0.6 0
0.5 0.5
6 6
0.8 0
5 5.5
2.5 2.5
2.6 2.6
1.5 1.5
0.5 0
0.7 0.7
1 1
1.5 0
0.5 0
2 2
7 5.5
0.7 0.7
0.5 0.5
Fuel Cell Ballistic Ring
IGB/TGB Oil Change
Tail Rotor Assembly and Directional Flight Controls
Tail Rotor De-Ice Slipring Bush Block
Data Bus System
Main Rotor Head
Swashplate Assembly
Power Available Spindle Cables
No.1 Engine Load Demand Spindle Control Cables
Engine Pneumatic Starters
Auxiliary Power Unit
IRCM
FLIR
Mission Tape Recorder
Maintenanace
Hydraulic System Sampling
Utility Hydraulic System Sampling
Flight Control Bearings
Access Panels Removal and Inspection
Airframe Inspections (Cabin, Transition Section, Tail Cone, Main Rotor Pylon, Tail Pylon)
Disconnect Coupling
Tail Rotor PCR Bearings
Post Phase Vibration Analysis
Fuel System
Main Rotor Head
Main Module
Main Gear Box Radiator
Engine Output Shaft
Auxiliary Power Unit
Flight Control Cables
Tail Landing Gear Shock Strut
Main Rotor Blades
Rotor Brake
Power Plant System
Air Turbine Starter
Fuel Dump System Operational Check
Flight Controls
Main Transmission Chip Detectors
Windshield and Wipers
Flight Control Cables
Airframe Inspections (Cockpit, Cabin and Tail Cone/Pylon)
Torque Shaft Bearing Supports
Main Landing Gear
Tail Landing Gear
Fire Extinguishing System
Rescue Hoist and Cargo Hook
Stabilator

24
b. Corrective Maintenance
Corrective maintenance frequency is established by the need to correct
discrepancies to aircraft. The basis for the corrective maintenance effort is both the
inspection process and the use of unscheduled maintenance action forms (MAF).
(COMNAVAIRFOR 2013) A MAF is a document that is initiated for each maintenance
action, whether scheduled or unscheduled, and provides the necessary information for the
Phase Hours Assist Hours
B/D 17 10
1.8 1.5
4 2
0.7 0
1.5 1.5
1 1
1 0
1 1
2 0
0.7 0.7
1.3 1.3
1 0
1 1
A
B 4.7 3.7
1 1
1 1
1.7 1.7
0.7 0
0.3 0
C
D 57.5 63.8
1.5 1.5
2 3.4
2 0
2.5 5
3 4.4
1.5 0
1.5 1.5
1 1
10 14.5
4 4
21.5 21.5
3 3
1 1
2 2
1 1
Phase Hours
A 233.8
B 206.3
C 233.8
D 319.2
Maintenanace
Primary Servo Bolts
Environmental Control System
Main Rotor Elastrometric Bearings
Main Rotor Spindle and Hinge
HIRSS
Main Rotor Head Slip Ring
Main Rotor Functional Checks
Main Rotor Dampers
Blade Assembly
Main Rotor Spindle and Hinge/Hub Assembly
Main Gear Box Radiator
Main Rotor Blade Assembly
No.2 Engine Load Demand Spindle Control Cables
Tail Drive Shaft
Tail Rotor Assembly
Pitot Static System
No Additional Inspections
Nose Vibration Absorber
Vibration Absorbers
Tail Landing Gear Structure
Flight Controls
Main Rotor Damper System Drain
Main Rotor Damper System Drain
Main Rotor Blade and Damper Installation
Environmental Control System
Main Landing Gear
Tail Landing Gear Shock Strut
Main Rotor Head Sub Assembly
No Additional Inspections
Flight Control Mixer
Main Rotor Blade and Damper Removal
Main Rotor Blades and Tip Caps
Main Rotor Head
Engine Exhaust
25
maintenance to be performed. For unscheduled maintenance, each MAF details the
condition which triggered the maintenance action, the corrective action taken, and the
person and work center used to correct the discrepancy (COMNAVAIRFOR 2013). Each
MAF contains more than this information, such as job number, system type, etc., but
these details are outside the scope of this analysis. MAFs may be written by either
aircrew or maintenance personnel, and are considered current records for the next 10
flights on each individual aircraft. These MAFs form the record of all maintenance
performed on an aircraft within the last 10 flight cycles, and they are further kept in
historical record for at least 12 months after the maintenance action was performed
(COMNAVAIRFOR 2013). The current system used by most commands to generate
maintenance actions and manage the maintenance effort is Naval Aviation Logistics
Command Management Information System / Optimized Organizations Maintenance
Activity (NALCOMIS/OOMA). NALCOMIS/OOMA is currently in use at every
squadron operating the MH-60S, and the specifics of NALCOMIS/OOMA system are
found in the NAMP, Chapter 13 (COMNAVAIRFOR 2013). For the purposes of this
study, it need only be recognized that NALCOMIS/OOMA is the extant organizational
system, so it will not be explored in depth.
Now that the relevant sections of the NAMP have been summarized, an important
question must be answered with regard to this study. How well does the NAMP perform
today, and what is the value of implementing the performance improvements that are
discussed in the NAMP? The answers to these questions speak to the relevance of this
thesis and will help form the theoretical framework that will be developed in Chapter III.
First and foremost, it must be determined if the NAMP is a useful process that meets the
needs of the Navy. Second, since the NAMP provides its own amendment process, what
most needs to change about the NAMP to ensure success into the future. Finally, since
the NAMP favors RCM at the operational level as the preferred “performance
improvement” solution, do RCM processes provide the best alternatives for the current
processes. These questions are addressed in Chapter III, as they deal directly with the
purpose of this study. In closing, it is important to note that the NAMP currently relies on
the use of labor intensive inspections and repairs to meet the system-level needs of

26
aircraft maintenance. With the new world of constrained budgets and continued global
interaction, this process may require a significant change to remain a valid solution to
stakeholders’ needs.

27
III. LITERATURE REVIEW
With the recent draw down of forces from Iraq and Afghanistan, the DOD has
seen a shift in priorities and now faces many new budget realities. The needs to reduce
both current and future budgets, as well as the requirement to continue the development
of capabilities, have led to a series of studies involving weapon systems and associated
processes. Within this context, a focus has been put on legacy systems, as the long
service life of many systems creates a need to improve performance and reduce life cycle
costs prior to the next generation of weapons entering service.
The Navy in particular has examined this reduction in life cycle costs, as
evidenced by the Naval Aviation Vision 2020. This publication, released in 2005,
describes the future needs of the Naval Aviation Enterprise (NAE) and lays out the vision
of the future aviation force in the year 2020. The NAE is said to be measured by one
simple metric: “aircraft ready for manning at reduced cost” (Taylor et al. 2005). To meet
this metric, the NAE put forth a focus on cost-wise readiness, buying higher quality
components to improve readiness, reducing the time that systems spend in maintenance,
increased reliability and implementing process efficiencies (Taylor et al. 2005). The NAE
focus serves as the statement of need for all aviation systems and provides the metrics
that determine the success of a system.
The aim of this thesis is to determine how well the maintenance process responds
to the need for aircraft designs that are ready for production at a reduced cost. The
objective, therefore, is to determine how well a legacy or developmental system satisfies
this metric in relation to viable alternatives. This chapter develops the viable alternatives
to the current processes that were described in Chapter II. The literature review explores
the results of published studies that are related to the current state of naval aviation and
present the theoretical framework for this study. Through this process of reviewing the
literature, a framework was created that related the need for this analysis, the tools used
to evaluate alternatives, and the ways in which the results were evaluated. This method
creates a clear means for collecting data, evaluating results and interpreting conclusions
that follow in successive sections of the thesis.

28
A. GAP ANALYSIS
1. Necessity of Gap Analysis
When considering the current state of the Naval Aviation Enterprise, it is
important to understand both its present and likely future composition. As discussed in
Chapter I, reductions in future budgets will force a change in the way Naval Aviation
does business. Following the end of the Cold War, there was a large shift in the needs of
the DOD as countering the Soviet Union was no longer the focus of American foreign
policy. The composition of the armed forces changed greatly over the next two decades
away from a European-centric strategy. According to the New York Times, by 2014, the
number of U.S. troops had decreased from 400,000 during the Cold War to a current
force of about 67,000 (Cooper and Erlanger 2014). At the same time, the number of
aircraft had decreased from approximately 800 at the end of the Cold War in the early
1990s to about 172 today (Cooper and Erlanger 2014). The cuts in Europe have left the
Navy with fewer forces, numbering approximately 7,000 sailors and marines with no
aircraft carriers stationed in the Mediterranean (Cooper and Erlanger 2014).
Based on the nature of the geopolitical changes that took place between 1990 and
2014, this shift was to be expected. The shift in forces away from Europe also shows that
plans for weapons systems need to be flexible and adapt to changing realities. Many
weapons systems that form the backbone of the modern U.S. Navy were developed to
fight the Soviet threat, including the H-60 helicopter. Modern weapons systems need to
be able to be modified to engage threats that exist in the present that might not have been
the focus of design decisions in the past.
U.S. combat systems have required great evolution to meet a much different threat
than seen even during the first Gulf War in 1991. The Naval Aviation Vision 2020 points
out the change from the force composition during the first Gulf War to the forces that
fought in Iraq and Afghanistan. Over 93 percent of Navy and Marine sorties in
Operations Iraqi and Enduring Freedom involved the use of precision guided weapons,
which was a significant increase from the first Gulf War (Taylor et al. 2005). Due to this
change to a more precise type of warfare, weapons systems have become more costly to

29
both acquire and maintain. As was discussed in Chapter I, however, there are severe
budget limitations that will constrain the DOD for the foreseeable future. This dichotomy
between the increasing cost of weapons systems and the decreasing resources available
for their production and maintenance is the primary trade space available to military
decision makers.
The NAE has understood for nearly a decade that the cost of acquiring weapons is
too high. This fact is conveyed through the use of “reduce the cost of doing business” as
one of its strategic readiness goals (Taylor et al. 2005). This statement is almost
hopelessly board in dealing with the costs of equipping the military. Costs associated
with manning and acquisition decisions dominate the cost calculations of the military, but
these are not the only areas where cost savings can be achieved.
To reduce the cost of business, the NAE has focused on providing more capability
per dollar in the fleet and increasing the efficiency of processes by both upgrading and
modernizing the fleet (Taylor et al. 2005). The priority to modernize and upgrade the
fleet has an enormous significance, since the entire fleet cannot simply be replaced with
new ships or aircraft. One need look no further than the enormous cost of the F-35 project
to understand that creating completely new aircraft systems is likely cost prohibitive in
the current fiscal environment. The focus then shifts to ways to save costs using the
people and equipment that the Navy already has.
To achieve cost savings, changes can be made in the composition of the force in
terms of people, weapons, and processes. Manning composition, although extremely
important, is outside the boundaries of this study. This thesis will seek to find ways to
reduce manning requirements, but questions related to how to best populate aviation units
are not the focus. Instead, the emphasis will remain on possible cost savings achieved by
altering the processes surrounding legacy systems. Through improving the efficiency of
systems already in place, cost savings can be achieved today that allow for the use of
greater resources for future systems.
With this focus on cost in mind, legacy systems must be modernized in ways that
both save costs and extend the system’s lifecycle. This modernization poses two

30
enormously important questions: how well is Naval Aviation meeting the goal of
increasing efficiency in order to upgrade the fleet? Furthermore, has the Navy
maximized its use of resources today or do areas exist where resources can be conserved
without a negative impact on combat readiness? If the Navy has not used all means
available to increase efficiency without a negative impact on combat readiness, then new
processes and functions must be developed to achieve this greater efficiency.
Table 3. Naval Aviation Vision 2020 Strategic Readiness Goals.
Strategic Goals
Balance Current and Future Readiness
Reduce the Cost of Doing Business
Enhance Agility
Improve Alignment
Attain and Maintain Visibility Across the Enterprise
Table 4. Naval Aviation Vision 2020 Strategic Readiness Actions.
Strategic Actions
Prioritize capabilities, define requirements, and efficiently acquire and prepare relevant and optimally sized Naval Air Forces that satisfy our nation’s warfighting needs
Operate with a common set of linked processes, each having an owner, metrics, and an action plan that drives continuous improvement
Install processes that are repeatable, agile and predictive
Manage performance and financial metrics as the common Enterprise language
Execute a Continuous Improvement Program designed to define, measure, improve and control NAE processes, to include Human Capital, acquisition, training, and materiel readiness
Develop quantifiable outcome metrics to measure our success and cultivate improvements that positively impact current and future naval readiness
Since Naval Aviation seeks to become more efficient, how does the NAE plan to
achieve the goal of “reducing the cost of business as usual?” According to the Naval
Aviation Vision 2020, relevant actions from Table 4 must be taken to meet the NAE’s
combat readiness goals from Table 3 (Taylor et al. 2005). This combination of readiness
goals and actions not only lays out the ways in which the NAE hopes to reduce the cost to
train, equip and operate the fleet, but also provides the philosophical basis for this study.
31
In systems engineering terms, the six actions from Table 4 serve as the top-level
user requirements that the NAE must meet to achieve success in “reducing the cost of
doing business.” The user’s requirements inform the analysis needed to determine how
well each of these areas is satisfied by current processes and to identify shortfalls that
exist. Therefore, a capability gap analysis is used to measure the fleet’s success in
meeting the NAE’s requirements. Since this vision is nearly a decade old, it is also likely
necessary for a reassessment of readiness goals, since the fiscal environment of 2005 was
much different than that of 2014. Since the 2005 goals were meant to shape the force in
2020, they still remain relevant today but their relevance is quickly approaching its end.
Since the NAE has set the requirements for future success, it is important to
understand how these requirements are quantified and success is measured. This
understanding requires that the term success be defined in a way that can be measured
and compared between possible outcomes. Since the NAMP, as discussed in Chapter II,
focuses on creating a system of constant “performance improvement,” any measurement
of success should be able to determine the value of improved performance.
(COMNAVAIRFORINST 2013) However, performance improvement is a vague and
there are myriad ways that improvement can be interpreted. Additionally, many of the
variables related to performance improvement have competing interests, so no
improvement scheme can assure unanimously positive results related to all aspects of any
system. To maintain a narrow focus, the basis for this research is the writings of the NAE
that set priorities for requirements.
As can be seen in Table 3, the five strategic goals are put forth as essential
ingredients for performance improvement across the lifecycle of aircraft development and
sustainment. Furthermore, the series of strategic actions presented in Table 4 provide a
basis for developing metrics to measure success and meet the requirements from Table 3.
Therefore, an appropriate framework must be created that accurately applies the
principles established in Tables 3 and 4. This framework provides the best way to
measure the outcome of any performance improvement regime.

32
2. JCIDS Process
The JCIDS process provides the means for determining what prioritized
capabilities are required by operational forces. The following text from the JCIDS
manual’s section on requirements identification and document generation provides the
justification for gap analysis:
Services, Combatant Commands, and other DOD Components conduct
Capabilities Based Assessments (CBAs) or other studies to assess
capability requirements and associated capability gaps and risks. In the
case of Urgent or Emergent operational needs, the scope of the assessment
may be reduced to an appropriate level to determine the capability
requirements in a timely manner…Capability requirements and capability
gaps identified through CBAs and other studies are traceable to an
organization’s assigned roles and missions, and, to the greatest extent
possible, described in terms of tasks, standards, and conditions in
accordance with references bb and cc…Any capability requirements
which have significant capability gaps typically lead to an ICD which can
then drive development of capability solutions which are materiel, non-
materiel, or a combination of both. Urgent operational needs typically lead
to a JUON or DOD Component UON document. Emergent operational
needs typically lead to a JEON or DOD Component UON document.
(Department of Defense [DOD] 2012, A-1)
For the purpose of this study, the Capabilities Based Assessment is used to
facilitate the capability gap analysis of the MH-60S maintenance process. The specifics
of the CBA are detailed in Chapter IV, with its purpose being to determine the extent of
the capability gap related to CBM in the MH-60S. The JCIDS further explains how the
results of a CBA should be used to drive solutions to close the identified gaps (DOD
2012). Further, the selection of a single airframe, the MH-60S, is justified as the lack of
CBM could constitute a joint emergent operational need (JEON). For this thesis, the
terms capability gap and JEON are defined the same as in the JCIDS manual
(10JAN2012). Capability gap means the inability to execute a specific course of action.
JEON refers to urgent operational needs that are identified by a Combatant Command as
inherently joint and impacting an anticipated or pending contingency operation (DOD
2012).

33
Any MH-60S CBM capability gap is emergent and not urgent since the current
NAMP process is capable of maintaining the aircraft to meet operational needs. On the
contrary, the elevated cost in terms of man power and cost of the extant maintenance
process does constitute a threat to future operations. For this reason, the capability gap
meets the JCIDS standard for an emergent threat. The JCIDS process and its application
to the gap analysis are explored in more detail in Chapter IV.
3. Value Engineering and Earned Value Management
The MH-60S presents a suitable program for the study of performance
improvement. It was produced with a series of variants, generally expressed with many
additions to the airframe since the first release. All of the variants that have been
produced are being operated currently, so comparison of the variants can be made. The
first question is: what should the framework for making comparisons look like? The
second question is: what are the most important comparisons to be made? The answer to
these questions, at least in terms of the MH-60S, lies in the principles of value
engineering and gap analysis, and the work of Langford and Franck (2009).
In their discussion of Earned Value Management (EVM), Langford and Franck
provide that the number one goal of EVM is to “suggest how management can obtain the
best-value solution for the taxpayer’s money.” Furthermore, they define the application
of gap analysis to EVM as such:
If managers perceive a deficiency or a desired goal that differs from that
which the actual work auspicates, there could exist a basis for gap in
intentions versus what has been achieved, and, therefore, a desire to close
that gap. The goal of Gap Analysis with regard to EVM is to maximize the
difference in achieving cost-effectiveness by employing one (or more) of
possible management strategies versus others out of the set of alternatives.
(Langford and Franck 2009, 4)
Since the goal of EVM is to determine the best value for the use of resources and
gap analysis provides a way for managers to close the gap between desired and actual
performance, Langford’s and Franck’s research speaks directly to the problem of how to
measure performance improvement. Expanding upon this point, Langford and Franck
explain that the difference between what a manager has in a project versus what a

34
manager wants in a project constitutes a “Value Gap” (Langford and Franck 2009). This
value gap then is the difference between desired and actual performance in terms of what
is important to the manager (Langford and Franck 2009).
According to the NAE, the factors that are important to a naval aviation manager
are found in Table 3. The chief goal when combining the NAMP and Naval Aviation
Vision 2020 is to improve performance constantly while simultaneously reducing the cost
of doing business. This improvement means that a process change can only be deemed
successful or useful if it provides more capability for less cost, which Langford and
Franck define as management achieving “more for less” (Langford and Franck 2009). For
this reason, the purpose of any change in process must be designed to deliver more
capability for less cost, and all changes should be evaluated on this basis.
Although the evaluation of “more for less” seems like a simple proposition to
apply, it is difficult to easily measure both the cost and capability provided by a change in
process. This difficulty is due to the fact that many costs, such as labor, are not easily
monetized in dollars used for a particular task. The Navy does not pay each of its workers
on an hourly basis, so the cost of using labor is generally fixed for a given time period
when the pool of workers is fixed. Therefore, the best measurement of cost is to calculate
the amount of time that is used to perform certain tasks. If the amount of time, measured
in labor hours, has an aggregate decrease as a result of a new process, then the process
could be said to lower the cost of doing business. This assumption is also true of
replacement parts usage, as any process that lowers the number of parts used can be
considered less costly. In terms of capability, it is difficult to create metrics which can be
estimated and compared to status quo processes. Therefore, capability can be measured in
terms of both safety and aircraft availability, which can be reasonably measured using
existing tools. In terms of the NAE’s vision, an increase in capability can be viewed as
having more aircraft available for use at any given time while having fewer mechanical
issues that compromise flight safety.
With all of these standards in place, the final step is to find a framework for
evaluating process changes that provides managers with the ability to compare new
process ideas to extant processes. Langford and Franck provide such a framework, and it

35
can be tailored to meet the needs of this analysis. In their work on Value Gap Analysis
(VGA), Langford and Franck propose the following application of VGA to manager’s
decisions:
By developing the theory of Value Gap Analysis into a form that can be
applied in a clear and consistent manner for managers, (1) value metrics
can be compared with Earned Value; (2) worth metrics can be applied to a
critical examination of foundation data; (3) risk metrics can be used to
interpret the relevancy of data; (4) an enterprise framework (which
displays worth and risk metrics) can be used to illustrate context at a given
time; and (5) assumptions can be scrutinized definitively. (Langford and
Franck 2009, 11)
Langford and Franck provide a further explanation of the ways that VGA can be
applied to work in the following passage:
We define Value Gaps in terms of the functional requirements, their
performances, and their losses due to those performances. Further, all Value
Gaps can be characterized in terms of capability of human capital. By
reference, EVM was implemented to specifically address measuring gaps
between planned and actual performance. But since not all performance
gaps require a human capital solution set, VGA must be modified. Changes
or enactments of policy, organization, training, materiel, leadership and
education, and facilities are considered candidates to close Value Gaps.
These factors are usually formally evaluated before recommending the start
of a new development effort. The result is that the process of managing
work tasks is functionally decomposed to allow the assessment and
identification of Value Gaps. (Langford and Franck 2009, 13)
This excerpt in many ways provides the theoretical foundation for this study.
Through a tailored process of Value Gap Engineering that focuses on changes to policy,
any program can identify and close the gaps in attained value that exist. Langford and
Franck focus mostly on the ways in which a project can implement these changes early in
the development process to create value during acquisition, but the principles of their
research apply equally well to a program such as the MH-60S that has been in service for
several years. Langford and Franck provide a thorough discussion of value, worth, and
risk and propose equations for both value and worth that can be applied to this analysis
(Langford and Franck 2009). These equations, presented in Figures 2 and 3, provide the

36
basic relationships between the value, worth, and risk measures. Langford and Franck
introduce the idea of quality affecting the value of a process
Figure 2. Value Equation (from Langford and Franck 2009, 16).
Figure 3. Worth Equation (from Langford and Franck 2009, 19).
The value (V) of any function (F(t)) can be measured by the sum of all
performances (P(t)) divided by the investment (I(t)) made in the function over any given
time period (t). The worth of a system, defined by Langford as the value to include any
possible loss incurred as the result of a given performance, is measured in terms of the
product of the value and the possible loss function denoted by quality (Q(t)) (Langford
and Franck 2009). To apply these functions to the NAE example developed in this
chapter, value is the ratio of labor performance to investment, and worth is the
application of this interaction to include the quality either gained or lost in the process.
These two equations provide the general framework for measuring outcomes in terms of
altering processes with the NAE framework that was previously discussed. In Chapters
IV and V, the application of these equations to the MH-60S maintenance program will be
explored in more depth and definite metrics for value and worth will be proposed and
discussed.

37
B. BOUNDARIES
Boundaries refer to the functional, physical, and behavioral limits of the research,
and an understanding of each type of boundary is required as part of the Gap Analysis.
As with any systems engineering analysis, the functional boundaries define the problem
space and allow for the derivation of the physical and behavioral characteristics of the
problem. With the functional boundaries of the study established, the physical boundaries
can be explored to determine what physical components will be analyzed. Finally, the
behaviors of the system and its components can be discussed to determine the limits of
what actions will be analyzed.
1. Functional Boundaries
In functional terms, this study was limited to an analysis of aircraft maintenance
systems under the extant regime and alternative conditional-based maintenance structure.
The NAMP explains the three top-level functional requirements for aviation maintenance
at the O-level. As was discussed in Chapter II, the top-level functions are: “maintain
operational capability”, “document maintenance”, and “improve processes.” As the
discussion in Chapter II suggests, the domain of this research was the operational level
maintenance practices. However, the scope of this effort was narrowed further to the
relevant functions related to scheduled maintenance as part of the NAMP. More
specifically, the Gap Analysis was bounded by the Phase Maintenance and Special
Inspections functions. These maintenance functional areas provided a means to inspect
components and certify the airworthiness of aircraft based on time in days and the
number of hours flown.
Using the three top-level functions, the second level functions related to phase
and special inspection can be derived. From the top-level function “maintain operational
capability”, the second-level functions of “determine system discrepancies”, “correct
system discrepancies”, and “ensure safety” are derived. The other two top-level
functions “document maintenance” and “improve processes” are used to derive the
second-level functions “provide monitoring capability”, “maintain record of maintenance
actions”, and “limit resource usage.” By setting the functional boundary along these lines,

38
the research was then focused on how well any vetted maintenance process accomplishes
these functions. Since data on resource usage is available for both IMDS and non-IMDS
capable aircraft, setting these functional boundaries allowed for a useful comparison of
maintenance processes. Figure 4 shows the decomposition between the top-level second-
level functions.
Figure 4. Functional Decomposition.
2. Physical Boundaries
The physical boundaries of the analysis are limited to the physical systems found
on the MH-60S along with the people and equipment used to conduct maintenance on the
aircraft. Since the purpose of the NAMP is to standardize maintenance across all Navy
aircraft, nearly a limitless number of comparisons can be made. Since each individual
platform, i.e., jets, helicopters, and maritime aircraft, has unique maintenance systems, it
is impossible to make relevant comparisons between platforms. Therefore, a single
platform must be selected, which is in this case a helicopter.
The Navy currently flies a single helicopter model, the H-60, but several different
series variants with a variety of sub-systems and mission sets. For this reason, a single
series, the MH-60S, has been chosen to limit the scope of the research. The MH-60S
provides an excellent platform for study, as multiple variants exist, and all have the
capability to support IMDS. At the same time, IMDS is not installed on all aircraft, so
there is an excellent space to be explored between CBM capabilities and legacy
capabilities. The physical boundary for CBM capability will be the on-board systems as
Provide Monitoring Capability
Maintain Record of Actions
Limit Resource Usage
Determine Discrepencies
Correct Discrepencies
Ensure Safety
Maintain
Operational
Capability
Document
Maintenance Improve Processes

39
well as ground support systems related to IMD-HUMS. The Gap Analysis will assess not
only the gaps between legacy maintenance usage and CBM capability, but also any
capability that is needed for CBM but not provided by IMD-HUMS. That is to say,
determine the actions that IMDS can and cannot replace that are part of the NAMP.
3. Behavioral Boundaries
The behavioral boundaries are defined by the actions performed to conduct
maintenance on the MH-60S based on the functions and physical objects involved with
the maintenance as well as the lack of the required functions or physical objects. These
behaviors will be limited to those conducted by maintenance personnel to perform the
necessary maintenance functions listed above. The scope of behaviors is also bounded by
the actions taken by operators to use the IMD-HUMS system effectively to achieve a
CBM capability. Finally, the behavioral boundaries are defined by the time frame in
which the actions studied take place.
In this case, the relevant maintenance actions took place between July 2013 and
August 2014 within the Helicopter Sea Combat Wing, Pacific (HSCWP). The time frame
is limited to the actions conducted for one year since each squadron is required to
maintain a record of all flights and maintenance actions for 12 months for each aircraft in
their inventory. Three squadrons, one carrier based, one expeditionary, and one fleet
readiness squadron will be analyzed. These squadrons constitute one of each type of
squadron within the HSCWP, with each performing a variety of missions. In total, these
missions constitute all the mission sets performed by the MH-60S and provide an
accurate cross section of maintenance activities. These boundaries clearly define “the
who, what, when, where and how” of the gap analysis and clearly define the scope of the
problem. The boundaries will be explored further as part of the gap analysis in Chapter
IV.

40
C. CONDITION-BASED MAINTENANCE
To understand the possible gains that can be achieved by conducting a gap
analysis and implementing value engineering to Naval Aviation processes, there must be
an examination of both the current process and viable alternatives. The NAMP, which
provides the structure of the current maintenance program, was discussed in length in
Chapter II. However, the Navy has been focused on improving the NAMP for several
years and has looked for a preferred alternative to the current maintenance process based
on time cycles. In many ways, the Navy, as was noted in the discussion of the Naval
Aviation Vision 2020 in the previous section, does not view the current process as
sufficient to meet its future needs. On the other hand, the Navy does present a preferred
alternative in the form of Condition-Based Maintenance.
CBM has been at the forefront of the Navy’s effort to modernize its force for
nearly two decades, and has become the primary maintenance goal for both new and
legacy systems. With the introduction of the OPNAVINST 4790.16 series, the Navy
detailed the scope of CBM activities thusly:
This instruction applies to acquisition, logistics, and maintenance activities
for new and legacy programs. CBM concepts all active and reserve naval
ships, aircraft, and the systems associated with them, as well as the
infrastructure that supports them…
The purpose of the CBM strategy is to perform maintenance only when
there is an objective evidence of need, while ensuring safety, equipment
reliability, equipment availability, and reduction of total ownership cost.
The fundamental goal of CBM is to optimize readiness while reducing
maintenance and manning requirements.” (CNO 2007, 1)
This statement in many ways serves as the mission statement for all maintenance
programs within the Navy. This passage also helps to clearly define the boundaries of any
weapons system and its associated support activities. Since the Navy has a goal for the
future in mind, it seems that any gap analysis should be centered on this chosen path and
assess where gaps exist and the value associated with closing these gaps. These issues,
including the specific applications to the MH-60S and the boundaries of this study will be

41
discussed later in this chapter. However, a better understanding of CBM, its history, and
components is required before an assessment of its efficacy is made.
1. CBM Literature
Since CBM is the preferred structure for maintenance programs Navy wide, it is
important to review studies that have measured its usefulness. CBM is not only used by
the military, but by other manufacturers in the private sector. For example, John Deere
has converted from its legacy “periodic maintenance” effort, which is similar to the
NAMP cycle, to a condition-based maintenance process (Deere 2014). Deere has used
CBM to achieve “a maintenance strategy aimed at extending machine life, increasing
productivity, and lowering your daily operating costs,” which mirrors the goals of the
Navy’s CBM program (Deere 2014). A company simply stating that CBM is better than
time based maintenance does not make the statement true, so an evaluation of current
literature on CBM provides a much better understanding of the efficacy of CBM in
general.
The relevant literature provides two important points of view for CBM: the
structure and goals of DOD CBM programs and the effectiveness of current CBM
programs in meeting these goals. First, the CBM programs were explored to gain a better
understanding of the goals of the DOD and Navy for CBM programs. Following this
investigation of CBM programs, a more thorough investigation of CBM usage to date
within the DOD was examined. Although CBM is not exclusive to the defense industry,
the focus of this study will remain within DOD systems. Although some commercial
programs could be relevant, the difference in performance standards for equipment
between private companies and the DOD makes comparison to the MH-60S more
difficult. Therefore, the focus will remain on DOD CBM programs to maintain a more
narrow scope for this investigation.
Within the DOD, condition-based maintenance is most commonly defined as part
of the CBM+ (CBM Plus) program. CBM+ for maintenance operations is most clearly
outlined in two publications: DODI 4151.22 Condition-Based Maintenance Plus for
Material Maintenance, and the Condition-Based Maintenance Plus DOD Guidebook.

42
DODI 4151.22 contains the policy and implementation guidance for all DOD CBM
programs. This publication provides a higher level view of CBM than the OPNAV and
AIRNAV instructions that have been previously discussed. The DOD policy guidance for
legacy program maintenance is presented, which states that CBM should be “integrated
in current weapon systems, equipment, and materiel sustainment programs where it is
technically feasible and beneficial” (DOD 2012). This statement is particularly relevant
to this study, as Enclosure 2 of the same document states that the decision to implement a
CBM program is based upon “Continuous process improvement initiatives in accordance
with DODD 5010.42” and “Technology Assessments” (DOD 2012). This guidance lends
itself very nicely to assessment using gap analysis within the process improvement
framework established in both the NAMP and Navy CBM policy.
The other important aspect of the 4151.22 is the guidance provided to the
individual services in terms of CBM implementation. In the responsibilities section, each
military department is tasked with both reviewing the effectiveness of CBM programs
and including CBM solutions for new and legacy system maintenance (DOD 2012). This
section serves as the requirement for the Navy to develop its own CBM program and to
make maximum use of CBM where possible. Additionally, CBM is used as the preferred
method for all maintenance activities and the Navy is tasked with finding ways to
increase the usage of CBM wherever possible.
Expanding on the DODI 4151.22 guidance, the Condition-Based Maintenance
Plus DOD Guidebook provides a more in-depth look at CBM programs and directives.
The CBM Guidebook includes an overview of all DOD CBM efforts and establishes the
necessity for changing the ways that maintenance has been done in the past. The most
relevant section in this study is Section 6, Measuring Success (DoD 2008). Measuring
Success provides metrics for both implementation and operation of CBM programs,
including the most relevant ways to track the effectiveness of a CBM program already in
place. More specifically, the following guidance in provided for measuring an operational
CBM program:
One of the key challenges at the DOD and Service level is to gauge and
map how CBM+ is progressing. A common end state is improved
43
maintenance from the maintainer’s perspective as well as the warfighter’s.
CBM+ implementers should track a small number of metrics over the long
term to assess whether CBM+ improvements are enabling a more effective
maintenance process. (DOD 2008, 6-3)
According to the concept outlined in this passage, the MH-60S is nearly a perfect
fit for an analysis of the progress of a CBM program. This fit is due to the fact that IMD-
HUMS has been implemented to facilitate CBM on some, but not all aircraft, and there is
a long time frame of data collected that can be analyzed based on simple metrics. Specific
metrics, such as labor hours or parts usage, can be measured using both a CBM capable
aircraft and a baseline aircraft without CBM. These metrics will be discussed more
extensively in Chapter IV.
These references are not exhaustive in their coverage of CBM programs within
the DOD. For the scope of this thesis, however, the combination of these CBM resources
and the guidance in the JCIDS Manual provides more than enough guidance to create a
useful evaluation of CBM capability. DODI 4151.22 and the DOD CBM+ Guidebook
provide a framework for judging CBM programs that can be applied to the investigation
of the MH-60S. The most important value provided by these CBM directives is a better
understanding of what constitutes a relevant CBM study. A relevant study of CBM
capability is one that applies the systematic application of metrics to determine a
reasonable alternative that includes greater CBM capability. Armed with this information,
each military branch can implement overarching CBM programs and individual weapons
systems can be assessed for compliance with CBM goals.
Condition-based maintenance has been positioned in DOD literature as the most
important part of cost effectiveness maintenance processes in a resources constrained
environment. CBM has been a large part of the DOD’s future vision for nearly two
decades, but CBM has not yet become ubiquitous within maintenance departments
throughout the military. The experience of the MH-60S in particular provides a great
example of disconnect between the status quo and desired CBM end state. This
reluctance to embrace CBM in practice is most likely due to the organizational inertia of
the current NAMP. Everyone involved in naval aviation maintenance has used the
NAMP for the entirety of their career, so conversion to CBM will require a change in

44
culture that has yet to occur. The Navy released its first CBM directive in 1998, but, as
can be seen in the NAMP discussion from Chapter II, the conversion away from time-
based maintenance has yet to occur. For this reason, it is important to look at studies of
the CBM process in use. These studies help provide guidance as to how effective CBM
has been at meeting the resource savings goals that have been promised in DOD
literature. Through the use of study, the value of CBM is determined and culture changes
can be initiated.
Before considering the results of past studies that investigated the effectiveness of
CBM, it is important to note that this study uses a different construction for determining
CBM efficacy than others cited herein. The work of studies conducted by Pandey and van
der Weide, Wegerich, Coats et al., and Bechhoefer and Bernhard focused more on the
engineering of CBM enabling systems. This difference in approach does not mean that
studies similar to this one do not exist, but simply that CBM-enabling systems have been
a greater focus that CBM processes in a large portion of the literature. It is possible to
gain a perspective on the efficacy of CBM systems and data analysis techniques which
have been used in other studies by viewing the maintenance systems as the systems that
they are. From the systems perspective, the detection and report of a condition that
manifests in a maintenance event represents the currency of knowledge about the
aircraft’s well-being. From that systems perspective, the literature can be analyzed and
evaluated for pertinent information that helps characterize the results presented.
This lack of focus on process does not mean that other studies have no value to
this investigation. On the other hand, little guidance is available from other engineering
sources to help shape the design of this study, which relies more heavily on DOD
directives for its construction. There has been significant study on CBM related to
Operations Research which does involve the economics of CBM. These studies do not
directly address the systems engineering aspects of process design, again limiting the
direct relation to this study. Therefore, the approach for this thesis is informed by these
other studies and combines elements of both engineering and operations research into its
construction.

45
The idea that CBM is less costly than maintenance involving inspection cycles is
supported within risk literature in regards to large, complex systems. In one such study by
Pandey and van der Weide (2009), a comparison of preventive maintenance schemes
based on constant monitoring and periodic inspection was made. In their work, Pandey
and van der Weide attempt to construct a discounted cost distribution to apply to systems
that are damaged by shocks or transients that occur at random times. The results revealed
a lower than expected cost and failure rate of large systems which are approximated by a
non-homogenous Poisson process when monitored with continuous inspection rather than
with periodic inspection (Pandey and van der Weide 2009). For the MH-60S example, a
non-homogenous Poisson process is the best approximation of failure rates that occur
independently of the preceding failure (Pandey and van der Weide 2009). The
maintenance data available for the MH-60S shows this principle to be true of component
failure in helicopters. Therefore, the equations presented by Pandey and van der Weide
may be useful in optimizing the MH-60S maintenance process.
In addition to studies on the economics of CBM, the bulk of the research with
close relevance to this investigation is found within engineering literature. These studies
provide validation of CBM tools in practice and optimization of their use, including
examinations of CBM principles and the IMD/HUMS system used on the MH-60S. One
of the most important aspects of a proper CBM regime is how to best implement the
necessary monitoring system. Since the goal of CBM is to reduce costs, a useful
monitoring system must be reliable and as comprehensive as needed.
Studies by both Bechhoefer and Bernhard (2005) and Wegerich (2004) attempted
to determine the proper monitoring system design for military helicopters. Wegerich,
working with data obtained from NAVAIR on H-60 gearboxes, developed the notion of
construction and comparison on similarity-based models (SBM) for improved diagnostics
(Wegerich 2004). Using the SBM models, the normal vibrations of H-60 gearboxes could
be isolated, with only abnormal signals remaining and allowing for the detection and
tracking of subtle faults (Wegerich 2004).
In addition to Wegerich, a similar study on the AH-64 Apache helicopter by Coats
et al. (2011) found that separation of fault signals from normal vibration levels led to

46
improved fault detection rates. The Coats study provides an improved process for
monitoring system development that has led to better fault detection rates in the AH-64
IVHMS-HUMS and similar systems (Coats et al. 2011). Bechhoefer and Bernhard
applied a technique to determine a threshold for fault tolerance to the UH-60L helicopter
that uses the same IMD/HUMS monitoring system as the MH-60S. In this study, the
authors developed a way to create a threshold of vibrations that would minimize false
alarm rates and provide a conservative detection capability for faults (Bechhoefer and
Bernhard 2005). Finally, in conjunction with this work, Gauthier (2006) found that the
introduction of CBM+ into H-60 engine monitoring systems required the minimization of
false alarms to produce cost savings when compared to schedule-based maintenance.
The most important lesson to be learned from these studies lies in the
effectiveness of legacy health monitoring systems, such as IMD/HUMS, to detect faults
before they occur. Well-developed systems exist to provide a robust system fault
monitoring capability in helicopter engine and rotor systems, so it is possible to
implement a CBM process. A CBM process can meet the needs of both the DOD and
Navy CBM programs in terms of safety and reliability, and studies suggest that CBM is
less costly in terms of labor and dollars than schedule-based maintenance (Pandey and
van der Weide 2009). Conversely, much of the NAMP process is driven by the comfort
of users who have achieved success for more than two generations using a standardized,
schedule-based process. The current culture of Navy maintenance departments requires a
more robust study of the tangible results of CBM tools to understand what can be gained
by implementing a more complete CBM process.

47
D. IMD/HUMS
For any CBM program to be successful there is a need to have a robust
monitoring system to gather data and monitor component performance. This monitoring
is needed because inspection must be replaced by another action that ensures the
effectiveness of aircraft systems. Since the purpose of CBM is to eliminate the need for
periodic inspections, any monitoring system must be able to ensure the safe and efficient
operation of components achieved under legacy maintenance systems, such as the NAMP
for example. The MH-60S uses the Integrated Mechanical Diagnostics Health and Usage
System (IMD-HUMS) to monitor components and provide the operator and maintenance
team with data related to component performance. To gain a better understanding of
IMD-HUMS, the Vibration Analysis Manual Integrated Mechanical Diagnostic System
(VIB-200) provides the guidance used by maintenance departments and operators for
IMD-HUMS (NAVAIR 2010). The VIB-200 serves as the primary technical publication
for IMD-HUMS operation and maintenance in the MH-60S.
1. IMD/HUMS Components
The VIB-200 contains robust descriptions of both the IMD-HUMS system
components and operator instructions. Figure 5 provides a basic overview of the system
as presented in the VIB-200, including all of the major system components that are
discussed in this section.

48
Figure 5. MH-60S IMDS Block Diagram (from NAVAIR 2010, 004 00-8).

49
Before beginning the discussion of IMD-HUMS components from Figure 5, it
must be noted that IMDS and IMD-HUMS refer to the same system and are used
interchangeably throughout the VIB-200. IMDS is the MH-60S maintenance
nomenclature for the Goodrich IMD-HUMS system, as it is referred in other publications.
The IMDS is divided into two separate major subsystems, the On-board System
(OBS) and the Ground Station (GS) (NAVAIR 2010). As the name suggests, the OBS
contains all of the systems that monitor the aircraft components and the GS provides data
storage and analysis capabilities. The OBS is subdivided into an Integrated Vehicle
Health Management Unit (IVHMU), Data Transfer Unit (DTU), and Multifunction
Display (MFD) (NAVAIR 2010). The IVHMU serves as the hub for the system,
containing a computer that is responsible for monitoring installed accelerometers,
magnetic pick-ups, tracker signals and aircraft parameters (NAVAIR 2010). The IVHMU
processes all of the data received from the various monitoring components and presents
the information to the operator (pilots) through the IMDS section on the MFD. The
IVHMU also saves all information on removable Personal Computer Memory Card
International Association (PCMCIA) cards through the DTU. These PCMCIA cards are
then able to be inserted into a reader at the GS for aircraft data download and analysis
(NAVAIR 2010). For the sake of brevity, Table 5 and Figure 6 have been included to
provide the OBS sensors and their location on the aircraft. Together, Table 5 and Figure 6
provide a comprehensive description of the systems monitored by IMDS.
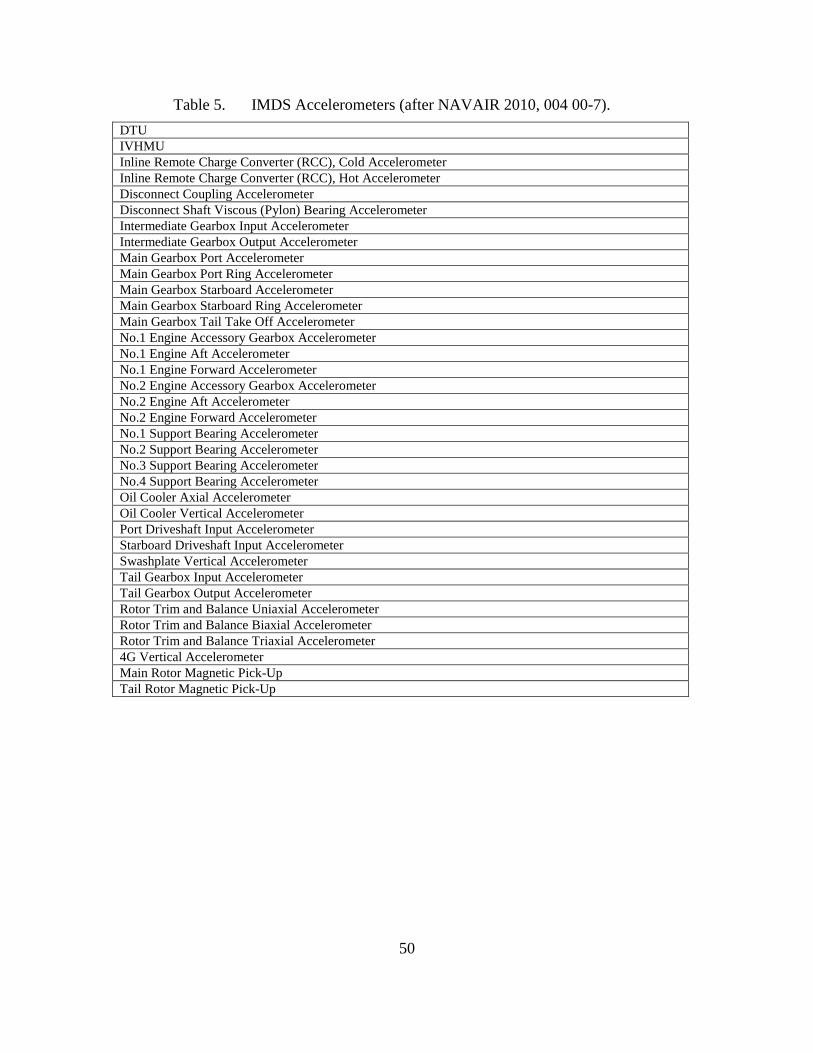
50
Table 5. IMDS Accelerometers (after NAVAIR 2010, 004 00-7).
DTU
IVHMU
Inline Remote Charge Converter (RCC), Cold Accelerometer
Inline Remote Charge Converter (RCC), Hot Accelerometer
Disconnect Coupling Accelerometer
Disconnect Shaft Viscous (Pylon) Bearing Accelerometer
Intermediate Gearbox Input Accelerometer
Intermediate Gearbox Output Accelerometer
Main Gearbox Port Accelerometer
Main Gearbox Port Ring Accelerometer
Main Gearbox Starboard Accelerometer
Main Gearbox Starboard Ring Accelerometer
Main Gearbox Tail Take Off Accelerometer
No.1 Engine Accessory Gearbox Accelerometer
No.1 Engine Aft Accelerometer
No.1 Engine Forward Accelerometer
No.2 Engine Accessory Gearbox Accelerometer
No.2 Engine Aft Accelerometer
No.2 Engine Forward Accelerometer
No.1 Support Bearing Accelerometer
No.2 Support Bearing Accelerometer
No.3 Support Bearing Accelerometer
No.4 Support Bearing Accelerometer
Oil Cooler Axial Accelerometer
Oil Cooler Vertical Accelerometer
Port Driveshaft Input Accelerometer
Starboard Driveshaft Input Accelerometer
Swashplate Vertical Accelerometer
Tail Gearbox Input Accelerometer
Tail Gearbox Output Accelerometer
Rotor Trim and Balance Uniaxial Accelerometer
Rotor Trim and Balance Biaxial Accelerometer
Rotor Trim and Balance Triaxial Accelerometer
4G Vertical Accelerometer
Main Rotor Magnetic Pick-Up
Tail Rotor Magnetic Pick-Up

51
Figure 6. IMDS Accelerometer Diagram (from NAVAIR 2010, Figure 4A).
The information that is collected by IVHMU and stored on PCMCIA cards via the
DTU can then be downloaded at the GS for analysis. The GS is compatible with the
Windows Operating system and provides the ability to collect and store data for analysis
by maintenance personnel on individual aircraft (NAVAIR 2010). Table 6 contains the
ground station capabilities for IMDS. The combination of the OBS and the GS provides
the capability for the MH-60S to implement CBM. As can be seen in Figure 6 and Table
5, IMDS monitors vibrations from the main rotor and tail rotor along with associated
drive shafts. IMDS additionally monitors engine performance and aircraft parameters,
and provides a robust feedback to the operator by using of exceedances displayed through
the MFD (NAVAIR 2010).
The combination of on-board systems allows the maintenance team to constantly
monitor aircraft performance throughout every flight. Monitoring also provides feedback
when a monitored system has exceeded operational limits or the aircraft has exceeded

52
flight parameters. This information is stored in the ground station after each flight and
provides a complete record of aircraft system performance. Using this record,
maintenance efforts can be tailored to the needs of each individual aircraft and
maintenance can be performed as necessary when limits are exceeded. That is to say,
maintenance can be provided based on the condition of the aircraft, which constitutes a
condition-based maintenance system. The usefulness of the IMDS and its limits will be
further addressed as part of the Gap Analysis in Chapter IV.
Table 6. IMDS Ground Station Capabilities (from NAVAIR 2010).
Vibration diagnostic checks Usage Computation and Tracking
Detect and display of exceedances Regime Identification and Tracking
Strip Chart analysis Regime Identification and Processing
Archive mission data Flight Operations Management
Track engine performance Fault/BIT Display
DTMU Initialization and Read Maintenance Management
Operation Exceedance Pilot Debrief Operations
Rotor Track and Balance Engine Performance Trending
Strip Charts of Aircraft Data Display and Trending
2. IMD/HUMS Usage
IMD/HUMS is currently used throughout the HSC community, but to varying
degrees depending on the squadron. As of 2014, there are nine HSC squadrons in the
HSCWP that fly the MH-60S, and each has IMD/HUMS capability. Currently, the IMDS
is not used by any squadron to facilitate CBM. The number of IMDS capable aircraft in
the squadron’s inventory, IMDS is used only to facilitate FCFs, daily maintenance, and
collect data. IMDS usage is described in the MH-60S NATOPS Flight Manual and the
VIB-200, which are the major operator directives that currently exist. Needless to say,
IMDS usage is limited in its current form. Instead, all maintenance is currently
conducted in accordance with NAMP directives and follows the cycles as described in
Chapter II.
As discussed in the Boundaries section of this chapter, there are three distinct
types of HSC squadrons: Expeditionary, CVW, and FRS. Each type of squadron uses

53
IMDS but the number of aircraft capable of employing the system varies by squadron.
For this research, the data has been collected for HSC-3, HSC-8, and HSC-21. Each
squadron uses the IMDS system differently. For instance, HSC-3 is an FRS squadron that
has a total of 18 aircraft that have flown and undergone at least one phase cycle in the last
year. Of these 18 aircraft, only five were equipped with IMDS capability during the time
period of this investigation. At HSC-21, there were 10 aircraft flown, of which only 2
were IMDS capable and none currently attached to the home guard at NAS North Island.
On the other hand, HSC-8 has eight aircraft that met the same criteria for flying and
phases and seven of these aircraft were IMDS capable during the same time period.
Since IMD/HUMS capability is dispersed throughout the fleet unevenly, simply
implementing the system in each aircraft is a major barrier to CBM transition. Aircraft
can be retrofitted to include IMDS, and this is routinely accomplished as part of the
Depot level maintenance process. That is not to say that IMDS is not useful to the fleet in
its current form. Each flight in an IMDS capable aircraft is recorded through the
PCMCIA cards and the data is stored through the ground station. Once stored at the
ground station, the data is stored on a Citrix server and accessible to local maintenance
personnel and the In-Service Support Center at Cherry Point, NC. This data collection
effort is in compliance with the NAMP directives discussed in Chapter 2 for the
collection, storage and use of data to improve processes. At this time, the data collected
has not driven any changes in the structure of H-60 maintenance practices.

54
THIS PAGE INTENTIONALLY LEFT BLANK

55
IV. GAP ANALYSIS
One on the most important aspects of the modern DOD acquisitions environment
is its focus on capabilities. The JCIDS process makes clear that the focus of DOD
acquisitions projects should be to prioritize capabilities and ensure that systems deliver
these capabilities (DOD 2012). Therefore, the gap analysis framework that was
developed in Chapter III focuses on determining the gaps that exist between current
capabilities and desired capabilities. Langford and Franck, as discussed in Chapter III,
devised a scheme for evaluating the value of delivering these capabilities. This work
serves as the theoretical basis for the gap analysis of the MH-60S that is found in this
study.
Previous chapters established the current state of H-60 maintenance, along with
the desired capabilities of both the Navy and the DOD. It is clear that at all levels of the
military that CBM is a desired capability, but there have been varying levels of CBM
implementation to date. The current maintenance cycle for all DON aircraft is outlined in
OPNAV 3110.11U, which details the use of the Planned Maintenance Interval (PMI).
Each Type/Model/Series (T/M/S) aircraft has a specific PMI cycle depending on the
usage of CBM or calendar-based maintenance. An example of a CBM aircraft is the AH-
W/Z helicopter operated by the Marine Corps. The AH-1W/Z “Cobra” uses a CBM
cycle and has its PMI is two 36-month cycles with maintenance cued from condition-
based needs (Department of the Navy [DON] 2013).
Currently in the MH-60S, there is a fixed 36-month PMI cycle where identical
maintenance is conducted on all aircraft due to the lack of CBM capability. Not all MH-
60S aircraft possess IMDS, but aircraft are retrofitted with the IMDS system as part of
depot-level maintenance. This study includes a total of six aircraft that have been
upgraded with the IMDS system during PMI, as review of the aircraft maintenance
records show. Due to the necessity of having aircraft available for operational tasking,
coupled with the cost of the IMDS system, an immediate IMDS upgrade of the entire
fleet is not feasible. For this reason, along with the changing operational and monetary

56
environment discussed in Chapters I and II, it is reasonable to characterize the lack of
CBM capability as an emergent threat to the helicopter community.
A. STUDY SUBJECTS
Perhaps the most pressing question to be answered by any research can be posed
as follows: who are we studying and why is the study needed? The answer becomes self-
evident after reviewing of the current state of affairs in the DOD. Due to the high cost of
acquiring new systems and the reduction in available funding for DOD, it is necessary to
find ways to make legacy systems more cost effective. As for the question, who would
make a good candidate for a study on the use of Conditional Based Maintenance, the
MH-60S was chosen as the platform for study for the following reasons, previously
outlined in the first three chapters of this thesis. First, the aircraft has been designed for
CBM capability but is not maintained using CBM currently. Second, the MH-60S has
multiple variants that use the IMDS and variants that do not. Finally, there is a robust
data collection system in place for naval aviation, and these systems allow for vast data
collection and storage that allow for comparisons to be made within a gap analysis
framework.
Having made the choice of the MH-60S, it is important to understand the
dynamics of the HSC community that flies the aircraft. The HSC community is composed
of three types of squadrons, CVW, Expeditionary, and FRS. CVW is the aircraft carrier
based squadrons that are the descendants of the Helicopter Anti-Submarine (HS)
squadrons that have deployed on aircraft carriers since the Vietnam War. Expeditionary
squadrons are the descendants of the Helicopter Combat Support (HC) squadrons that
have accomplished combat and logistics support since the dawn of naval helicopters.
Finally, the FRS is a shore-based squadron that serves as the initial training for all
aviators new to the MH-60S. The HSC community provides a diverse cross section of
capabilities and mission sets. With the waning of the wars in Iraq and Afghanistan, there
has been a shift in focus for the entire community. The HSC community and the MH-60S
would greatly benefit from any construct that could reduce operating costs, as the intent
of this research was to maximize cost savings.

57
Within the HSC community, three squadrons were chosen for study based on their
composition. All squadrons are a part of the HSC Wing Pacific (HSCWP), so they share
maintenance facilities and operate under common directives. Additionally, each squadron
has varying operational requirements and deployment models, creating a diversity that is
not seen within other helicopter wings. The three squadrons chosen were HSC-3, HSC-8
and HSC-21. All three squadrons are reporting custodians for aircraft and conduct
maintenance at the operational level, so they each fall within the boundaries of this
investigation.
HSC-3 is the Pacific FRS and provides training to fleet replacement pilots and
aircrew prior to their arrival in deploying squadrons. HSC-3 is the largest helicopter
squadron in the U.S. Navy and currently flies the MH-60S, HH-60H, and SH-60F. HSC-
8 is a CVW squadron that has deployed as part of the CVW-9 on-board CVN74. HSC
CVW squadrons deploy as an entire unit and serve the rotary wing needs of the CSG.
HSC-21 is an expeditionary squadron that deploys as smaller detachments as part of an
ESG or with USNS assets. The manning requirements of each squadron are different, as
are the number of aircraft that is assigned to each squadron. For the time period of this
study, HSC-3 had conducted at least one phase inspection on 18 different aircraft, with 10
aircraft for HSC-21 and 8 for HSC-8. Each squadron has aircraft equipped with IMDS to
facilitate Functional Check Flights (FCF) and others that use the older Automated Track
and Balance Set (ATABS) system. ATABS, which is not discussed in great detail in this
paper, performs many of the same maintenance functions as the IMDS, but is not
integrated into the airframe. The ATABS usage is governed by the A1-H60CA-VIB-100,
which contains an extensive description of system operations for operators and
maintainers (NAVAIR, Vibration Analysis Manual Automated Track and Balance Set
2012).

58
B. MEASURES AND METRICS
Having established the subject of the study, it is important to outline the metrics
that will be used. There is a series of metrics and measures of performance that are
relevant to the study. For MH-60S maintenance, there are four measures of performance
(MOP): maintenance labor hours, flight hours, time usage, and flight safety. The
foundation of these four elements is derived from the discussion of NAMP organization
and performance improvement in Chapter II. These four MOPs were used to create a
series of eight metrics that allow for the comparison of the baseline and alternative cases
that are discussed in Chapter V. The metrics and their associated measures are found in
Table 7.
Table 7. Measures and Metrics
Metrics Associated MOP
Operational Availability (AO) System Availability
Percentage of Aircraft Incidents caused by
Mechanical Failure
Flight Safety
Percentage of Mechanical Incidents
monitored by IMDS
Flight Safety
Percentage of Mechanical Incidents caused
by Human Error
Flight Safety
FCF Hours per Flight Hour Flight Hours Usage
FCF Hours per Phase Inspection Flight Hours Usage
Scheduled Maintenance Hours Percentage Maintenance Labor Hours
Unscheduled Maintenance Hour
Percentage
Maintenance Labor Hours
Difference of Expected and Actual Labor
Hours Used per Phase
Maintenance Labor Hours
Average Phase Labor Hours Maintenance Labor Hours
1. Measure of Effectiveness and Performance
The four measures listed in the previous section can be separated into measures of
effectiveness (MOE) and measures of performance (MOP). The definition of
effectiveness shall be that used by Blanchard and Fabrycky (2011), meaning “the ability
of a system to the job for which it was intended.” For this study, the measures of
effectiveness are the ability of maintenance process to meet the NAMP goals discussed in

59
Chapter II, along with the NAE goals from Chapter III. For the sake of brevity, these are
summarized as the ability to provide greater capability to achieve less cost.
The MOPs are related to and derived from these MOEs as a way to measure the
performance of the maintenance system. The definition of MOP used for this study
comes from the DAU Glossary (2011) as “distinctly quantifiable performance features”,
in this case, hours flown, labor hours, availability, and flight safety. Each of these MOPs
is discussed in length in the following sections.
a. Maintenance Labor Hours
Maintenance Labor Hours is an MOP that measures the amount of effort required
to accomplish maintenance tasks. The total number of hours to accomplish the tasks
related to a phase inspection and associated special inspections serves as the
measurement for the amount of resources used for a phase. Labor hours do not include all
of the costs associated with a phase, as parts usage also incurs a cost. The usage of parts,
however, is outside the scope of this study due to the difficulty in cataloguing all of the
parts used to replace defects found during a phase inspection. Therefore, maintenance
costs will be measured in terms of labor hours and flight hours.
Maintenance labor hours are recorded for every maintenance task and coded
based on the type of maintenance being conducted. These codes are part of the
NALCOMIS/OOMA system which is used to keep a complete record of all aircraft by
BUNO, which is equivalent to the aircraft serial number. More discussion of maintenance
job codes and the methodology used to determine the relevant maintenance for this study
is found in Chapter V. The purpose of the maintenance labor hours MOP is to quantify
the total number of labor hours to accomplish each phase and maximize the number of
flight hours achieved per maintenance labor hour.
b. Flight Hours
Flight hours are a desired outcome of any aircraft maintenance effort, as the
purpose of maintenance is to attain and maintain aircraft in a flyable status. Flights that
are related to maintenance activities are called Functional Check Flights (FCF), and these

60
flights are used to accomplish the post-phase vibration analysis required by the MCR-
400. A review of the VIB-100 and VIB-200 reveals that certain maintenance activities
during a phase inspection lead to required flight checks that are accomplished as part of
an FCF. Since an aircraft is cannot be certified “safe for flight” under the NAMP until the
FCF is completed, FCF flight hours do not provide operational capability (4790.2B
2013). Therefore, FCF flight hours are used as a measure of performance for maintenance
actions. The goal of any maintenance effort should be to minimize the number of FCF
flight hours, as this allows for more flight hours to be used for operational tasking. FCF
hours account for about five percent of all flight hours flown within the sample
population used in this study. Flight Hours and FCF usage results are discussed in
Chapter V.
c. Availability
Availability is an important measure of the amount of time an aircraft is able to be
used for operational tasking. For this study, which is focused on the effects of phase
inspections, availability is a MOP determined by the time between phases and the number
of days in phase. The availability MOP is directly related to the operational availability
metric which measures it. The definition of operational availability (AO) for this study is
derived from Blanchard and Fabrycky (2011) as:
In which MTBM equals Mean Time Between Maintenance and MDT equals
Maintenance Down Time.
MTBM is defined as the number of days any aircraft is available for operational
tasking. Therefore, MTBM is the time from the completion of the post-phase FCF until
the time an aircraft is inducted into phase. Further, the phase induction date is considered
the day after the last flight prior to the beginning of the phase inspection, as is the HSC
community practice. This phase induction day occurs at the completion of approximately
175 flight hours, plus any additional hours used prior to phase induction in accordance
with NAMPSOP directives. MDT is defined as the number of days from the day

61
following the last flight prior to phase induction until the completion of the post-phase
FCF. During this period, any aircraft undergoing a phase inspection is not available for
operational tasking, so it is considered unavailable. Operational Availability as a metric is
the percentage of time that an aircraft is available for operational tasking between the
induction of an aircraft into one phase (A, B, C or D) and the next subsequent phase. The
goal of availability as a MOP is to increase time available between phase inspections and
reduce the time spent in a phase inspection.
d. Flight Safety
Flight Safety is the final measure of performance, as maintenance processes are
used to guarantee the functionality of aircraft systems to ensure safe operations. Flight
safety is quantified in the number of aircraft safety incidents over a given period of time.
For this study, aircraft safety incidents are measured as the number of hazard reports
(HAZREP) that occurred the period from January 2009 until August 2014. This number
of incidents does not include flight accidents (mishaps) that caused serious damage to
aircraft or injury to personnel. Navy mishap and HAZREP reports attained through the
Web Enabled Safety System (WESS) are privileged for use by flight crews only, and no
specifics of any incident can be released due to legal concerns. Since compiling data on
mishaps would necessarily include a listing of costs or injury information, these reports
were not included in this study to protect the confidentiality of those involved.
HAZREP data, conversely, simply provides aircrews with information on possible
hazards to aviation. Any information in these reports is provided voluntarily by aviation
squadrons, so data can be used without compromising the privileged nature of the report.
The measure of flight safety based on maintenance is the number of mechanically related
flight hazards. The performance goal of maintenance is to reduce the number of
mechanical hazards and human-caused incidents that compromise flight safety.
2. Metrics
The metrics listed in Table 7 provide the quantitative measure for each MOP with
which the metrics are associated. The maintenance labor hours MOP is maximized by a
reduction in the number of labor hours to complete a phase inspection. Since the phase

62
includes a “look” and “fix” portion, all maintenance actions related to inspecting and
correcting discrepancies are captured as scheduled labor hours. The metrics for the labor
hours MOP are therefore the percentage of scheduled and unscheduled maintenance,
average phase labor hours and the ratio of planned to actual phase hours used. These
metrics determine the relative breakdown of maintenance labor and the efficiency with
which maintenance is conducted. These four metrics are further detailed in Chapter V.
In terms of flight hour usage, the metrics are the ratio of FCF hours to total flight
hours and FCF hours per phase inspection. These metrics articulate the amount of waste
in terms of flight hours needed to achieve operational availability. Additionally, the FCF
hours per phase metric determines the number of flight hours that are lost for operational
tasking as a direct result of each phase inspection. Finally, the metrics associated with
flight safety determine the frequency of mechanical problems not corrected by
maintenance action. These metrics provide an understanding of the relative frequency of
mechanical safety hazards, the effects of human error on flight safety, and the ability of
IMDS to improve flight safety in comparison to non-IMDS capable aircraft.
3. Value
The use of EVM provides a great tool to assist in the gap analysis of the MH-60S,
as it provides an easily traceable value for closing the CBM capability gap. By applying
these metrics to the data collected, the relative cost of maintenance under alternative
scenarios can be determined for each individual aircraft and phase type. Using the
equations provided in Figures 2 and 3, the functional gains and losses due to the
performance of maintenance can be captured.
The greatest value is attained by maximizing performances while minimizing
investments. The investment is the amount of maintenance labor hours used to achieve
the functional performance of operational flight time. Therefore, the performance is
quantified by the total number of operational flight hours achieved and total amount of
availability of operational aircraft. Increasing flight safety, therefore, increases the worth
of performance by minimizing losses due to human error and poor maintenance
outcomes. Using the available metrics provides a way to quantify this value in terms of
63
costs and benefits achieved by closing the capability gaps related to CBM. This value
determination in turn allows decision makers the ability to weigh the cost of increasing
CBM tools against the value that CBM capability provides.
C. CAPABILITIES-BASED ASSESSMENT
1. JCIDS CBA Guide
The JCIDS Capabilities Based Assessment Guide serves as an excellent guide for
determining capability gaps with a program. The CBA Guide outlines the steps that take
place in a formal JCIDS CBA. Even though all of these steps are not conducted as a part
of this study, the CBA Guide does provide the steps necessary to determine if capability
gaps exist. The CBA Guide provides the following guidance for programs such as the
MH-60S.
When performing a CBA relative to an existing capability solution that
may require replacement/recapitalization or evolution to meet future
capability requirements, the CBA is starting from a known baseline and
making excursions to address potential future capability requirements. In
this case the CBA should take no more than 60-90 calendar days to
demonstrate that the replacement/recapitalization/evolution is required.
The alternatives for the solution will be further considered in the AoA or
similar review (DOD 2012, A-B-3).
The MH-60S maintenance system meets this definition very clearly, so the gap
analysis uses this as a guide. Additionally, the gap analysis uses the following passage to
define the necessary steps and as a concept of operations.
A CBA begins by identifying the mission or military problem to be
assessed, the concepts to be examined, the timeframe in which the
problem is being assessed, and the scope of the assessment. A CBA
determines the relevant concepts, CONOPS, and objectives, and lists the
related effects to be achieved. A CBA may also lead to policy
development or support and validation of existing policies
There is no strict format for a CONOPS, but it should describe the
following areas at a minimum:
(a) the problem being addressed
(b) the mission

64
(c) the commander’s intent
(d) an operational overview
(e) the objectives to be achieved
(f) the roles and responsibilities of tasked organizations
(DOD 2012, A-B-1).
2. CBA Concept of Operations
Using the CBA Guide as a basis, the CONOPS for the gap analysis includes the
following actions: problem to be assessed, mission, timeline, scope, commander’s intent,
operational overview, objectives to be achieved, roles and responsibilities of tasked
organizations. These areas provide key functional performances, drivers of maintenance
approach, rationale for maintenance, and an overall characterization of operational
sensitivities. The following sections include the description of each of these areas,
followed by descriptions of the data that was collected and analyzed.
a. Problem
Due to decreases in funding following the wars in Iraq and Afghanistan, how can
the cost of operating legacy systems be reduced? The problem is maintenance on the
MH-60S limits the number of operations that can be flown. Limiting the number of
flights decreases operational effectiveness and jeopardizes the mission. For the MH-60S,
that problem is expressed in terms of a question: what tools exist to achieve cost savings
and what impediments should be expected to implementing cost savings?
b. Solution
The use of condition-based maintenance has been identified by the Navy and
DOD as a likely source of cost savings and a preferred maintenance method. CBM tools
currently exist, such as IMD-HUMS, but have not been used to replace extant
maintenance practices based on inspection cycles. Finally, does IMD-HUMS meet all of
the needs to close the capability gap between a CBM-only maintenance process and the
current maintenance structure?

65
c. Goal
The primary goal of gap analysis is to determine the structures of value to aid
decision-makers. The intent is to maximize value in the tradeoffs of investment versus
functional performance. The problem statement serves to create the perspective from
which to construct a means for evaluating alternatives solutions. For a system such as the
MH-60S, maintenance requires evolution to meet future needs and changes to make the
system relevant to changing missions, uses, and requirements. There must be a baseline
for current performance that establishes the measurement of the gap, from which
alternative solutions are compared.
Therefore, the goal is to create a baseline for comparison, determine possible
alternatives, and then to apply a means of comparing alternatives. Based on the scope and
available data, the baseline of performance is the number of labor hours and flight hours
used to support phase and special inspections in the MH-60S. Alternatives are limited to
systems already in existence, so the only alternative is increased CBM using IMDS for
the MH-60S. Finally, the means for comparing alternatives was carried out through the
constructs of value and worth of capabilities within the set of analyzed solutions using the
equations provided by Langford and Franck.
d. Timeline
The timeline for analysis is based on the available data from the MH-60S
community. Due to community maintenance requirements, all labor usage and flight hour
data is kept for a period of at least 12 months on local servers in each squadron. Flight
data is kept in the Sierra/Hotel Advanced Readiness Program (SHARP) and maintenance
data in the NALCOMIS Optimized Organizational Maintenance Activity (OOMA).
Therefore, the timeline selected was a 13-month period from July 2013 to August 2014
when all flight data and maintenance labor usage is available for the squadrons being
investigated. Outside this timeline, maintenance data is discarded as no longer relevant to
current operations and the available data becomes more sporadic.

66
e. Scope
Within the boundaries established in Chapter III, the scope of the research is
narrowed to specific activities that can be measured and compared. All aircraft
considered for this research are currently part of the HSC Wing Pacific, and were
analyzed by BUNO based on the movement of aircraft within the wing due to operational
requirements. Additionally, all maintenance actions considered were performed by the
reporting custodian for these aircraft, i.e., squadron personnel within the HSCWP.
As part of the NAMP discussed in Chapter III, the scope of maintenance actions
is confined to those related to phase and special inspections. The most common
comparisons to be made are the number of labor hours used for scheduled and corrective
maintenance, with and without CBM. The comparison of these across the entire timeline
discussed in the previous section creates an understanding of the amount of effort
directed to both scheduled and corrective maintenance actions. Within this framework,
the scope is further narrowed to focus on the actions and hours required to complete
phase inspections. Since phase inspections require such extensive maintenance, the result
is the use of both maintenance labor hours and flight hours to return the aircraft to
operational status (NAVAIR 2010). Since Vibration Analysis is required at the
completion of each phase due to the nature of maintenance performed, a functional check
flight is required after each phase. Therefore, the cost of a phase is related not just to the
labor hours used for maintenance but the flight hours for FCF to return the aircraft to
mission capable status.
The scope also extends to the special inspections which often occur in conjunction
with phase inspections. All told, the scope of comparisons includes the number of labor
hours used for corrective and scheduled maintenance, labor hours used for each phase,
flight hours used after each phase for FCF, and the effects on operational availability due
to aircraft time in phase. Additionally, using the IMDS ground station, exceedances of
flight parameters are noted which necessitate inspections on aircraft components
accomplished during phase. Through the use of this IMDS data, it is readily determined
whether phase inspections would be warranted based on the performance of the aircraft.
More specifically, if the aircraft had no parameter exceedances above non-operable light
67
limits, there would be no reason to perform a maintenance phase due to aircraft condition.
The combination of these factors bests measures the NAMP requirements for
“performance improvement” presented in Chapter II.
The final scope parameter is related to safety of flight. Since the phase inspection
cycle inspects all major aircraft systems, there is a genuine concern that CBM could
reduce safety. Through statistics compiled from the Web Enabled Safety System
(WESS), it is possible to determine the likely cause of mechanical defects which result in
mishap or hazard reports. Since the information in these reports in privileged to the H-60
community, it is impossible to release details of any aviation incident. Therefore, through
an anonymous investigation of causes, it is possible to determine if IMDS was installed
on incident aircraft. Then comparisons can be made to non-IMDS capable aircraft.
f. Commander’s Intent
The commander’s intent is established through the directives governing
condition-based maintenance discussed in Chapter III. The common theme in each of
these directives is that CBM is the desired end state for all DOD programs. This theme is
reiterated in both the CNO CBM directive and the Naval Vision 2020. It is unambiguous
that the desired capability is a transition to exclusively condition-based maintenance for
all legacy systems. Since the MH-60S was designed with the IMD-HUMS as a CBM
facilitator, the commander’s intent is to transition to processes that maximize CBM.
g. Operational Overview
Building on the discussion of scope, the operational overview involves the
procedures executed as part of this study. The first step was the selection of operational
squadrons for data collection with the boundaries of the study. To obtain an accurate
cross section of the HSCWP, one of each type (FRS, Expeditionary, CVW) of squadron
was chosen for data analysis. As discussed in Chapter III on IMD-HUMS, these
squadrons had various IMDS capabilities for their aircraft.
After choosing HSC-3, HSC-8, and HSC-21, a baseline was created for phase
requirements in terms of labor and flight hour usage. This work was done using the

68
OOMA system to catalogue the type of phases conducted during the timeframe and the
number of labor hours recorded as a part of each phase. Since OOMA codes individual
work by labor hours and the type of work performed, labor hours can be easily
determined for each aircraft during the phase period. To determine phase dates, the
aircraft is considered to be inducted into the phase after the completion of the last flight
prior to the phase inspection date. Since phases are based on flight hours, this
determination is a common practice within the community and provides a consistent
estimate for the beginning of a phase.
To obtain phase labor hours, an OOMA records query was conducted for all job
codes related to the look and fix portions of each phase (NAVAIR 2013). As noted in the
MRC-400, all phases include a “look” portion to inspect aircraft parts and a “fix” portion
to repair these parts as necessary. The labor hours collected involve all scheduled
maintenance jobs coded for the phase occurring between the phase induction date and
completion date. The phase completion date is kept in the OOMA inspection records,
along with all special inspection dates.
Once the data was collected for all aircraft in the squadron’s inventory, the IMDS
ground station was analyzed. Using the ground station, all IMDS equipped aircraft were
checked for exceedances related to monitored systems. Any consistent exceedance
beyond the non-operable flight limit was considered a facilitator of phase maintenance.
That is to say, if no exceedance was discovered beyond a non-operable flight limit, the
phase is considered not warranted for the purposes of this study.
In terms of flight hours, the total number of flight hours for each aircraft was
collected for each BUNO in the squadron’s inventory. Additionally, the FCF hours
related to each phase were collected. These hours were determined using the SHARP
records for each BUNO and related to the date of the FCF. Since community practice
requires a FCF to be completed prior to operational tasking, the first flights after each
phase completion are FCFs. The VIB-100 and VIB-200 require that post-phase FCF be
performed based on the maintenance that is performed during the phase inspection. FCF
flight hours performed in conjunction with phase inspections include all flight hours from
the phase completion date until the first non-FCF flight. This method of tabulating FCF

69
hours related to phase maintenance is accurate since the FCF completion allows the
aircraft to again execute operational tasking, per community NATOPS directives.
SHARP flight records are coded by flight mission type, so FCFs related to phase are
easily distinguished in the flight record and the FCF flight hours accurately collected.
To measure the effects on operational availability, the flight record was used to
determine the number of calendar days that an aircraft is unavailable for tasking due to
phase maintenance. This calculation was completed for each BUNO starting from the day
following of the last flight prior to the phase completion date until the date of the FCF
completion following the phase. Since this number is reported in days, the aircraft is
considered operationally available the day of the last flight prior to phase and after the
exact time of the FCF completion. This measure provides an accurate measure for the
number of days of operational availability lost directly as a result of phase inspections.
Once all of this data was collected, a series of comparisons was made between the
different aircraft populations. Additionally, the value and worth equations from Chapter
III were applied to the results to determine the value of closing any capability gaps. These
comparisons are discussed, along with the results and conclusions, in Chapters V and VI.
The final operations performed involved the analysis of safety reporting data. This
data was collected from the Naval Safety Center WESS system and involved all MH-60S
aircraft incident (HAZREP) reports from 2009-2014. Since these reports are privileged
(due to the legal implications of aircraft incident information), no specifics from any
report are released as part of this analysis. Using the reports, anonymous statistics were
created for each aircraft incident, based on whether there was a mechanical cause. If a
mechanical cause existed, the aircraft was categorized as IMDS capable or non-IMDS
capable. This comparison allows for the determination of any persistent capability gaps in
IMDS aircraft that will require further engineering. The results of the flight safety review
and comparisons between IMDS and non-IMDS capable aircraft safety records are
reported in Chapter V.

70
h. Objectives
The objectives of the gap analysis are outlined within the CBA Guide. For the
MH-60S, one objective is to create an accurate baseline for usage of labor hours and
flight hours as a result of conducting a phase. Another objective is to determine the value
created by IMDS capability, both under current usage and with the desired CBM
capability. For aircraft equipped with IMDS, the objective is to determine if routine
operations necessitate phase maintenance as a result of exceeding operational limits. The
final objective is related to the ability of IMDS to monitor aircraft safety. Through the use
of aircraft incident data, any remaining capability gaps related to the monitoring
capability of IMDS are determined and recommended for further engineering. Together,
these objectives combine to provide the value of closing the CBM capability gap and
identify any residual capability gaps that exist.
i. Roles and Responsibilities
The roles and responsibilities are in many ways external to this study, but relate to
the use of its results. Since this study is not a JCIDS product, the roles and
responsibilities are filled nearly exclusively by the author. On the other hand, the results
could lead to a more formal JCIDS capabilities investigation, which would greatly benefit
the HSCWP. The HSCWP serves as the entity responsible for meeting operational
tasking using the MH-60S.
As the administrative commander for HSC CVW squadrons and the operational
commander for FRS and Expeditionary squadrons, the HSCWP has the responsibility to
maximize use of the results of this study. Since the HCSWP has a non-deployable FRS
squadron, HSC-3, which is part of this study, many of the recommendations can be
applied in a more controlled environment. The conclusions and extensions of this study
are discussed in Chapter VI, and the future roles and responsibilities will be conferred in
greater detail.

71
V. RESULTS
Having discussed the parameters of this study in Chapters I-IV, the results are
presented and analyzed. This chapter begins with a description the data collection
methods that were used. From this data, a baseline of phase maintenance was created for
comparison and detailed in this chapter. Next, an alternative for the current phase
maintenance processes is proposed and compared to the baseline case. Finally, a
discussion of value concludes this chapter, including a consideration of the capability
gaps that are closed by the alternative phase process and remaining gaps in CBM
capability not addressed by IMDS.
A. DATA COLLECTION METHODS
Data collection was done using the available maintenance data from HSC-3,
HSC-8 and HSC-21 for the period from 1 July 2013 until 1 August 2014. These
squadrons were described in detail in Chapter IV, and each squadron operates under
common maintenance practices within the HSCWP. The major sources of data included
both the NALCOMIS/OOMA system, used to report maintenance actions, and the IMDS
ground station, which collects IMDS rotor and vibration data. The IMDS ground station
includes the mechanical diagnostics tools (MDAT), which provides mechanical data for
accelerometer locations throughout the aircraft described in Table 5. Additionally, the use
of the Naval Safety Center WESS program is described as the source of flight safety data.
The information in this section is a supplement to the Concept of Operations section
found in Chapter IV and provides a greater level of detail for the data collection methods
from each data source.
1. NALCOMIS/OOMA
NALCOMIS/OOMA is the software database that is used to catalogue all
maintenance jobs within HSC squadrons. NALCOMIS/OOMA was discussed in Chapter
II of this study and the program is outlined in Chapter 13 of the NAMP (2013). Since all
of the squadrons involved in this study are operational level maintenance activities, the
Optimized Organizational Maintenance Activity (OOMA) was the interface used to

72
access maintenance information. OOMA maintains all maintenance, logistics, and flight
records for aircraft that are currently in an individual squadron’s inventory
(COMNAVAIRFORINST 2013). For the purpose of compiling historical maintenance
work, all maintenance labor actions, i.e., jobs completed, are required to be stored in
OOMA for at least 12 months (COMNAVAIRFORINST 2013). Additionally, this
historical data may be available up to five years and catalogued by BUNO
(COMNAVAIRFORINST 2013). The use of BUNOs means that when an aircraft is
transferred to another squadron, the accepting squadron will have a complete record of
aircraft maintenance and logistics information for at least 12 months.
The availability of OOMA data for each squadron in the aircraft sample allows
for the collection of maintenance usage data. The data collected from OOMA for this
study was focused on maintenance labor hours by BUNO for aircraft within HSC-3,
HSC-8 and HSC-21. Not all aircraft in these squadrons were part of the study. Since the
focus is the effects of phase maintenance, only aircraft that had undergone a phase within
the period from July 2013 to August 2014 were considered. For example, HSC-3 had
several aircraft which were in O-level preservation and did not fly enough during the
study period to warrant a phase inspection. These aircraft, therefore, were excluded from
the sample.
Additionally, aircraft that were on a detachment away from the home station
during the time data was compiled were also excluded. Since these aircraft are not
located with the “home guard” portion of the squadron, the data is not available through
local OOMA database. The combination of this fact along with the fact that most OOMA
data is only available for 12-15 months made collection of data for these aircraft during
the study period unreliable. Therefore, the data from these deployed aircraft was also
excluded.
Using the OOMA records from each squadron, the dates of phases within the
study time period were catalogued. The phase window was considered the time from the
end of the last flight prior to phase induction until the date of the phase completion. Since
OOMA catalogues all maintenance labor hours by type maintenance (TM) code, actions

73
are logged by the applicable code during both the “look” and “fix” phases
(COMNAVAIRFORINST 2013).
“Look” and “fix” mean that any inspection carried out and the actions to correct
discrepancies found during said inspection are included as scheduled maintenance under
the applicable code. The codes that were considered applicable to each phase were coded
as: “Phase Inspection”, “Special Engine Inspection”, “Hourly Special Aircraft
Inspections”, “Cycle or Event Special Aircraft Inspection”, and “Daily, Turnaround,
Special Inspections and Preservation or Depreservation Actions”
(COMNAVAIRFORINST 2013). Using the ad hoc query feature in OOMA for the
specified TM codes and phase dates, maintenance labor hours were collected for each
phase inspection on each aircraft in the study sample. One caveat to note is the inclusion
of special inspections does increase the number of inspection actions if conducted in
conjunction with a phase. To include this in the total for each BUNO, all 364, 546 and
728 day inspections that occurred during the phase window were taken into account as
part of the expected labor hour calculations. Expected and actual labor hours are covered
in more detail later in this chapter.
In addition to phase labor hours, OOMA was also used to compile total
maintenance labor hours, along with scheduled and unscheduled labor hours. To acquire
the data for the “scheduled maintenance percentage” metric, the total number of labor
hours and the number of unscheduled labor hours were collected for each aircraft. These
labor hours were collected for the entire time period and provide an understanding of the
complete workload for each individual aircraft. All labor hours were compiled by BUNO
and used to populate metrics and for statistical analysis purposes discussed later in this
chapter.
2. Sierra/Hotel Advanced Readiness Program
The Sierra/Hotel Advanced Readiness Program (SHARP) was used to collect all
flight hour data for each of the aircraft in the study. OOMA also maintains flight data
records, but HSC community standards specify that flights are logged in SHARP and the
data is then transferred to OOMA electronically. This transfer ensures that all flight data
74
used for operations and maintenance purposes is identical. SHARP was chosen for flight
record information due to the ease of use over the OOMA flight record data.
SHARP data was used to calculate flight hours, FCF hours, and availability
measures of each BUNO. SHARP is maintained as a local depository of flight hour data
in each squadron, and flight hour records are maintained by BUNO for all flights for an
in-determinate period. For this reason, all squadrons in the study had data on flight hour
available for at least two years, providing more complete records. On the other hand, only
flights that took place when the specific BUNO was in the squadron’s inventory are
maintained in the log, which is not transferred along with the aircraft. For this reason, the
flight hour histories of each BUNO were tracked through multiple SHARP databases to
form a complete record.
Using the SHARP records, a complete flight history for each BUNO was
constructed from the end of the phase inspection previous to the timeline of this study
through 1 August 2014. This date range allowed for the calculation of MTBM and MDT
for availability purposes, along with the collection of FCF flight hour and total flight hour
data. This information was used to calculate the “Operational Availability”, “FCF Hours
Per Flight Hours” and “FCF Hours Per Phase Inspection” metrics from Table 7.
3. IMDS Ground Station
IMDS ground station data was used to determine trends in component
performance that would warrant further inspection. IMDS ground station includes both
the ground station (GS) and MDAT databases. The GS was used to collect data on rotor
track and balance performance between phases, and MDAT used to collect mechanical
diagnostic data on various parts of the aircraft. All IMDS data was collected by BUNO
for each IMDS capable aircraft in the sample. Since the purpose of IMDS data is to
support the diagnosis of failures before they take place, the relevant time period for each
BUNO is limited. Data was collected from the time of post-phase FCF completion until
the last flight prior to phase induction for each BUNO. This period represents the time
when an aircraft is certified safe-for-flight and trends in performance would warrant
further maintenance. Since the current phase process includes the removal and
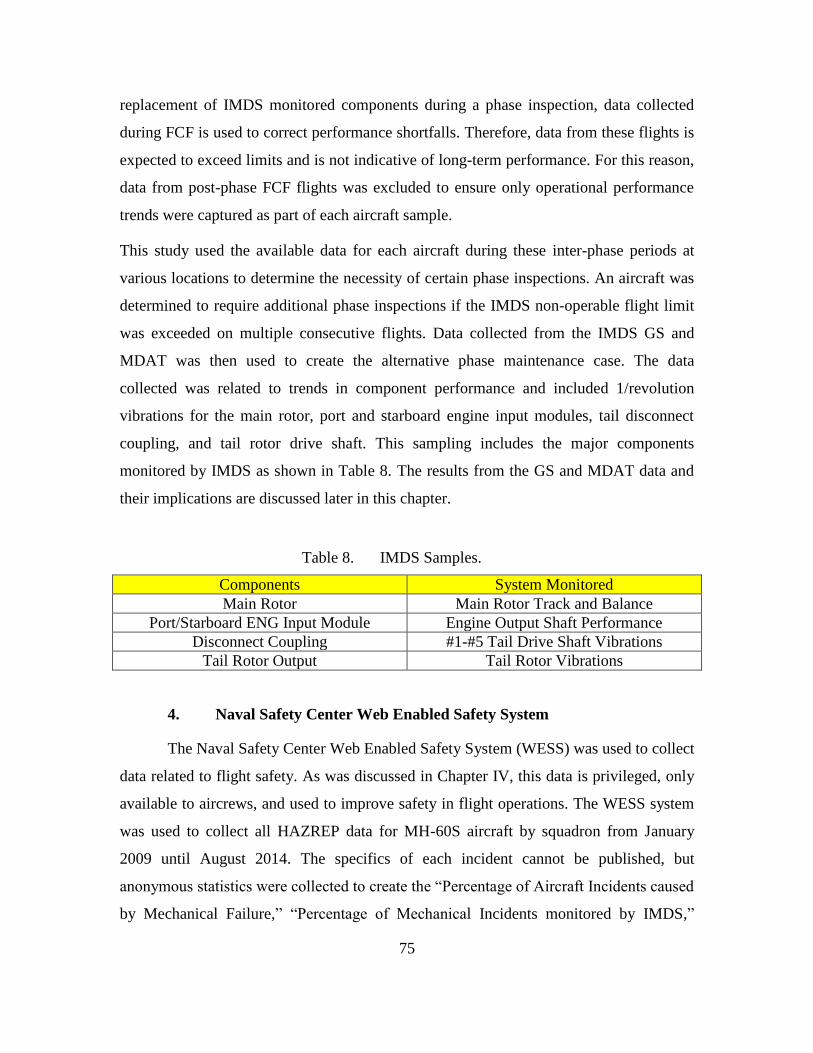
75
replacement of IMDS monitored components during a phase inspection, data collected
during FCF is used to correct performance shortfalls. Therefore, data from these flights is
expected to exceed limits and is not indicative of long-term performance. For this reason,
data from post-phase FCF flights was excluded to ensure only operational performance
trends were captured as part of each aircraft sample.
This study used the available data for each aircraft during these inter-phase periods at
various locations to determine the necessity of certain phase inspections. An aircraft was
determined to require additional phase inspections if the IMDS non-operable flight limit
was exceeded on multiple consecutive flights. Data collected from the IMDS GS and
MDAT was then used to create the alternative phase maintenance case. The data
collected was related to trends in component performance and included 1/revolution
vibrations for the main rotor, port and starboard engine input modules, tail disconnect
coupling, and tail rotor drive shaft. This sampling includes the major components
monitored by IMDS as shown in Table 8. The results from the GS and MDAT data and
their implications are discussed later in this chapter.
Table 8. IMDS Samples.
Components System Monitored
Main Rotor Main Rotor Track and Balance
Port/Starboard ENG Input Module Engine Output Shaft Performance
Disconnect Coupling #1-#5 Tail Drive Shaft Vibrations
Tail Rotor Output Tail Rotor Vibrations
4. Naval Safety Center Web Enabled Safety System
The Naval Safety Center Web Enabled Safety System (WESS) was used to collect
data related to flight safety. As was discussed in Chapter IV, this data is privileged, only
available to aircrews, and used to improve safety in flight operations. The WESS system
was used to collect all HAZREP data for MH-60S aircraft by squadron from January
2009 until August 2014. The specifics of each incident cannot be published, but
anonymous statistics were collected to create the “Percentage of Aircraft Incidents caused
by Mechanical Failure,” “Percentage of Mechanical Incidents monitored by IMDS,”

76
“Percentage of Mechanical Incidents caused by Human Error.” Combined, these metrics
reveal the number of safety issues related to mechanical problems and the amount that
these are driven by human errors. This data helps provide context to the safety of
eliminating certain phase inspections. Flight Safety will be discussed as part of the
alternative phase inspection later in this chapter.

77
B. DATA ANALYSIS BASELINE
Using the techniques outlined in the CBA from Chapter IV and the data collection
methods from this chapter, a baseline for MH-60S maintenance performance was created.
This baseline used the measures of performance and metrics outlined in Chapter IV to
describe the current state of the MH-60S maintenance program. Since some aircraft
possess IMDS capability and other do not; the baseline assessment must also include
analysis of the current value of IMDS. That is to say, does IMDS capability provide any
value by itself with implementing CBM? The first task is to determine the current effects
of IMDS on the NAMP maintenance process, followed by a construction of a baseline
using these effects. The results show that IMDS capability has a minimal positive effect
on the current maintenance program. Therefore, a single baseline case was developed for
all MH-60S aircraft, regardless of installed IMDS capability.
1. IMDS and Non-IMDS Capability
Since the purpose of this study is to determine the value of implementing a CBM
capability into the MH-60S maintenance process, the extant value of CBM tools provides
insight that enlightens the utility of CBM capabilities. The aircraft considered for this
study includes a sample of 29 aircraft and 73 total phases. These phases are broken into
A, B, C, and D by squadron with the data found in Table 9.
Table 9. Phases by Squadron.
Phase Type HSC-3 HSC-8 HSC-21 Total by
Phase
A 13 5 3 21
B 8 6 3 17
C 9 4 3 16
D 11 5 4 20
Total By
Squadron
41 20 13 73
From this sample, there were 12 IMDS capable aircraft and 17 non-IMDS capable
aircraft. It is impossible to compare IMDS capability’s effect on phases within any
squadron other than HSC-3. This conundrum arises because HSC-8 completed only four

78
phases on two aircraft that were non-IMDS capable and HSC-21 had no IMDS capable
aircraft in its sample. For this reason, the effects of IMDS capability will only consider
the entire sample population. This situation is less than ideal, due to differences in
squadron efficiency and labor hour reporting that are evident in comparisons of phase
types. Consequently, the lack of IMDS and non-IMDS aircraft within any given squadron
would lead to an introduction of bias due to small sample size if these comparisons were
made.
To determine if IMDS capability had any positive value, it is necessary to
compare the results of IMDS and non-IMDs aircraft in terms of operational availability,
post-phase FCF hours and phase labor hours. Since two samples were compared, a t-test
assuming equal variances was used with an alpha of 0.05. In all cases, the null hypothesis
shall be considered that IMDS capability leads to no difference in mean metric value. The
alternative hypothesis is that IMDS capability produces a difference in the mean value of
each metric. This relationship is presented in Figure 7.
Figure 7. IMDS Capability Hypothesis Test
H0: µIMDS = µNON-IMDS
H1: µIMDS ≠ µNON-IMDS
α = 0.05
a. Maintenance Labor Hours
The first case to be compared is the difference between maintenance labor hour
usage with IMDS capability installed or not-installed. Many special inspections are
included as part of the phase and these actions are not distinguishable from the labor hour
calculations due to the TM codes that are used. Therefore, the most relevant comparison
of IMDS efficacy is the mean difference between expected hours for phase completion
and actual hours for phase completion. To find this difference, the sum of phase hours to
perform the phase inspection in the MRC-400 and any specials (364, 546, 728 days from
the MRC-350) conducted during the phase window is used as the expected value of phase
inspection hours. The difference between this value and the actual labor hours recorded

79
for each phase is then subjected to the hypothesis test described in Figure 7. The results
of these hypothesis tests are found in Table 10.
Table 10. IMDS Effect on Phase Labor Hours
Phase A
IMDS Non-IMDS
Mean 164.4 186.3
Variance 153864.88 19531.04
Observations
P-value (two tail) 0.859
Phase B
IMDS Non-IMDS
Mean 64.4 202.6
Variance 10426.64 24271.83
Observations 8 9
P-value (two tail) 0.049989
Phase C
IMDS Non-IMDS
Mean 148.41 48.63
Variance 19470.96 19697.7
Observations 5 11
P-value (two tail) 0.2079
Phase D
IMDS Non-IMDS
Mean 437.24 464.28
Variance 143300.7 134914.9
Observations 8 12
P-value (two tail) 0.875
Phase ALL PHASES
IMDS Non-IMDS
Mean 207.83 231.0
Variance 103626.2 73026.0
Observations 30 44
P-value (two tail) 0.738
As can be seen in Table 10, there is only one case in which the null hypothesis
should be rejected. The “B” Phase shows a statistically significant difference in
maintenance labor hour usage between IMDS and non-IMDS aircraft. The results also
reveal that the mean of the “C” phase is about 100 labor hours less for non-IMDS
aircraft, but this value is not quite significant at the 95 percent confidence level. An
80
analysis of all data revealed that IMDS does not provide a significant improvement in
actual labor hours used in comparison to expected labor hours used at the 95 percent
confidence level.
b. Flight Hours
Since the period between MH-60S phase inspections is limited to 175 flight hours
by the MRC-400, then value could be achieved by reducing the number of FCF flight
hours associated with a phase. Since FCF flight hours are not available for operational
tasking, IMDS capability would provide a benefit by reducing the number of post-phase
FCF flight hours. Each phase includes different system inspections and repairs, so the
comparison of FCF flight hours must be divided by phase type. IMDS capability provides
value if “FCF Hours per Phase Inspection” is less than non-IMDS aircraft at the 95
confidence level. The results of the FCF flight hour comparisons are found in Table 11.
As is evident from Table 11, there is a statistically significant difference between
IMDS and non-IMDS capable aircraft in terms of FCF hours per phase inspection. For
the “B” phase there is a statistically significant difference at the 95 percent confidence
level between IMDS and non-IMDS capable aircraft. For the “A” phase, there is a
significant difference at the 90 percent confidence interval to reject the null hypothesis,
but not the 95 percent confidence level. This fact, combined with the p-value for the “D”
phase below 0.25, suggests that FCF efficiency is improved by IMDS. Even though all
measures do not meet the 95 percent confidence level, there is still strong evidence to
suggest that at least some difference in mean metric values exists. If totaled, the mean
expected FCF hours per phase cycle would be 18.3 flight hours for IMDS versus 26.5
hours for non-IMDS capable aircraft. This number is not statistically significant for each
phase, but it suggests a non-trivial difference, saving about 1.1 percent of total flight
hours per 700 hour phase cycle.

81
Table 11. FCF Flight Hours t-Test
Phase A
IMDS Non-IMDS
Mean 3.47 5.88
Variance 1.295 14.91
Observations 9 11
P-value (two tail) 0.0878
Phase B
IMDS Non-IMDS
Mean 3.24 7.38
Variance 2.396 9.296
Observations 8 8
P-value (two tail) 0.00413
Phase C
IMDS Non-IMDS
Mean 6.14 6.05
Variance 3.173 8.464
Observations 5 11
P-value (two tail) 0.947
Phase D
IMDS Non-IMDS
Mean 5.46 7.18
Variance 6.26 10.012
Observations 8 12
P-value (two tail) 0.214
c. Availability
Availability is measured in terms of the number of days that an aircraft is
available or unavailable or operational tasking. In terms of IMDS capability, this measure
can be assessed by analyzing the entire sample populations of IMDS and non-IMDS
aircraft. The metric “Operational Availability” is used to assess the MOP related to
availability. Since operational availability is determined by the time between phases and
the amount of time an aircraft is in phase, the type of phase is not important to this
measure. The lack of distinction by phase is due to the fact that expected labor hours, i.e.,
those found in the MRC-400 for each phase, have minimal differences. Additionally, the
number of days between phases is not impacted by the type of phase that preceded this
time period. Therefore, IMDS and non-IMDS operational availability are assessed
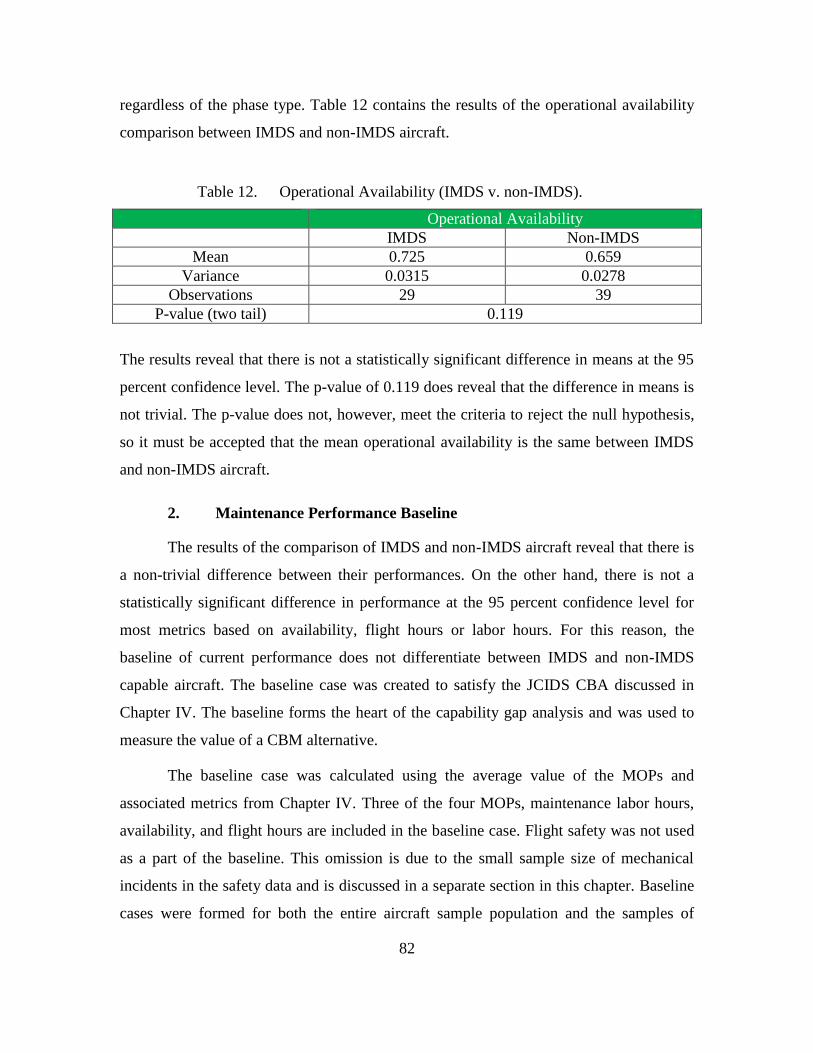
82
regardless of the phase type. Table 12 contains the results of the operational availability
comparison between IMDS and non-IMDS aircraft.
Table 12. Operational Availability (IMDS v. non-IMDS).
Operational Availability
IMDS Non-IMDS
Mean 0.725 0.659
Variance 0.0315 0.0278
Observations 29 39
P-value (two tail) 0.119
The results reveal that there is not a statistically significant difference in means at the 95
percent confidence level. The p-value of 0.119 does reveal that the difference in means is
not trivial. The p-value does not, however, meet the criteria to reject the null hypothesis,
so it must be accepted that the mean operational availability is the same between IMDS
and non-IMDS aircraft.
2. Maintenance Performance Baseline
The results of the comparison of IMDS and non-IMDS aircraft reveal that there is
a non-trivial difference between their performances. On the other hand, there is not a
statistically significant difference in performance at the 95 percent confidence level for
most metrics based on availability, flight hours or labor hours. For this reason, the
baseline of current performance does not differentiate between IMDS and non-IMDS
capable aircraft. The baseline case was created to satisfy the JCIDS CBA discussed in
Chapter IV. The baseline forms the heart of the capability gap analysis and was used to
measure the value of a CBM alternative.
The baseline case was calculated using the average value of the MOPs and
associated metrics from Chapter IV. Three of the four MOPs, maintenance labor hours,
availability, and flight hours are included in the baseline case. Flight safety was not used
as a part of the baseline. This omission is due to the small sample size of mechanical
incidents in the safety data and is discussed in a separate section in this chapter. Baseline
cases were formed for both the entire aircraft sample population and the samples of

83
individual squadrons. These sampling decisions were due to the differing composition of
the aircraft variants in each squadron and the different efficiency achieved by the
associated maintenance departments. Tables 13-17 contain the performance baseline in
terms of maintenance labor usage, flight hour usage, and availability under the current
NAMP process.
Table 13. Maintenance Labor Hours Performance Baseline (Part A)
Phase Type
Actual Phase Labor Hours
Expected Phase Labor
Hours
Actual-Expected Labor Hour Difference
Percent Over Expected Labor
HSC-3 A AVG 419.2 243.9 175.3 73.17
HSC-3 B AVG 362.5 208.4 154.1 74.40
HSC-3 C AVG 402.9 246.1 156.8 62.02
HSC-3 D AVG 911.1 330.8 580.3 171.36
HSC-3 AVG Phase 536.6 260.8 275.8 105.75
HSC-3 Total Cycle 2095.8 1029.2 1066.5 103.63
HSC-8 A AVG 471.4 251.9 219.5 48.27
HSC-8 B AVG 296.9 223.7 73.2 24.10
HSC-8 C AVG 186.7 239.5 -52.8 -16.10
HSC-8 D AVG 554.8 355.3 199.5 64.93
HSC-8 AVG Phase 382.4 267.8 114.6 33.05
HSC-8 Total Cycle 1509.8 1070.3 439.5 41.06
HSC-21 A AVG 438.0 233.8 204.2 87.35
HSC-21 B AVG 465.2 212.0 253.2 121.83
HSC-21 C AVG 230.0 233.8 -3.8 -1.64
HSC-21 D AVG 709.1 319.2 389.9 122.13
HSC-21 AVG Phase 479.7 255.0 224.6 88.08
HSC-21 Total Cycle 1842.2 998.8 843.5 84.45
A AVG 420.4 243.5 176.9 69.27
B AVG 352.2 214.6 137.6 65.02
C AVG 323.3 245.2 78.1 30.56
D AVG 786.3 332.8 453.5 134.91
All AVG Phase 482.6 261.4 221.3 77.66
All Total Cycle 1882.2 1036.2 846.0 81.65

84
Table 14. Maintenance Labor Hours Performance Baseline (Part B)
Scheduled Labor Hours
Unscheduled Labor Hours
Total Labor Hours
Scheduled Labor Percentage
HSC-3 Total 76559.7 38172.9 114732.6
HSC-3 Average 5104.0 2544.9 7648.8 66.73%
HSC-8 Total 28821.1 17443.8 46264.9
HSC-8 Average 3202.3 1938.2 5140.5 62.30%
HSC-21 Total 22284.7 15269.6 37554.3
HSC-21 Average 4456.94 3053.92 7510.86 59.34%
All Total 363403.4 191640.0 555043.5
All Average 4402.3 2444.4 6846.6 64.30%
Table 15. Flight Hours Performance Baseline (Part A)
Total FCF Hours
Total Flight Hours
FCF/Flight Hours
HSC-3 Total 374.4 7231.1
HSC-3 Average 25.0 482.1 5.18%
HSC-8 Total 117.7 2584.4
HSC-8 Average 13.1 287.2 4.55%
HSC-21 Total 130.8 1960.2
HSC-21 Average 26.16 392.04 6.67%
All Total 1780.1 33751.8
All Average 21.5 406.1 5.29%

85
Table 16. Flight Hours Performance Baseline (Part B)
Phase Type Phase FCF
Hours Percentage of
Flight Hours Lost
HSC-3 A AVG 4.8 2.75
HSC-3 B AVG 6.9 3.92
HSC-3 C AVG 6.1 3.46
HSC-3 D AVG 6.2 3.52
HSC-3 AVG Phase 5.9 3.31
HSC-3 Total Cycle 23.9 3.41
HSC-8 A AVG 2.8 1.57
HSC-8 B AVG 3.5 2.02
HSC-8 C AVG 7.5 4.27
HSC-8 D AVG 7.8 4.44
HSC-8 AVG Phase 4.9 2.78
HSC-8 Total Cycle 21.5 3.08
HSC-21 A AVG 7.8 4.46
HSC-21 B AVG 5.4 3.09
HSC-21 C AVG 4.0 2.30
HSC-21 D AVG 7.1 4.07
HSC-21 AVG Phase 6.2 3.56
HSC-21 Total Cycle 24.4 3.48
A AVG 4.8 2.74
B AVG 5.3 3.03
C AVG 6.1 3.47
D AVG 6.5 3.71
All AVG Phase 5.7 3.24
All Total Cycle 22.7 3.24

86
Table 17. Availability Performance Baseline
Squadron MTBM (Days)
MDT (Days) Ao
HSC-3 63 42 0.602
HSC-8 123 48 0.721
HSC-21 84 24 0.775
All Squadrons 89 40 0.690
The collection of information in Tables 13-17 provides the baseline case for each
individual squadron and the entire sample population in terms of the relevant MOPs. This
data presents the current state of phase maintenance as applied to the HSC community
operating the MH-60S. From this data, all of the metrics from Table 7 are applied to the
data collected from each squadron. Additionally, an average of inter-squadron
performance is presented. This information was used as the basis for comparison with the
alternative phase construction presented later in this chapter.
From this data, one observes that each squadron achieves different levels of
efficiency in terms of labor hours, flight hours and availability. In terms of labor hours,
the squadrons using more non-IMDS aircraft tend to require more labor. An analysis of
the relevant BUNOs reveals that aircraft in HSC-21 and HSC-3 are generally older
(lower BUNO), which is the likely cause of the higher labor hour totals. HSC-8, which
has mostly IMDS aircraft, has a lower average FCF hour total than the other squadrons,
which is expected given the comparisons of IMDS and non-IMDS aircraft made in the
previous section. Finally, HSC-3 has the lowest operational availability, but this seems to
be a result of shorter MTBM than other squadrons. HSC-21 achieves the best Ao, mostly
due to the fact that MDT is about half that of other squadrons. All data collected as part
of this study is contained in Appendix A.

87
C. PHASE INSPECTION ALTERNATIVE
With the baseline data established, it is necessary to create an alternative case for
comparison to complete the capability gap analysis. To determine the alternative case, the
IMDS ground station data was used to determine the necessity of all actions that take
place during a phase inspection. Once the IMDS data was reviewed, an alternative phase
structure was proposed. Using this phase structure proposal, metrics from the baseline
case that were related to labor hours and flight hours were applied to make a reasonable
estimation of the effort to complete phases under the alternative case. Next, availability
due to phase maintenance was determined using the results of the labor hour estimates.
Finally, the flight safety record was reviewed and results applied to determine the
possible safety implications of using the alternative case.
1. IMDS Data
A review of the IMDS ground station data was conducted to determine the ability
of IMDS to identify system faults and determine the need to inspect systems monitored
by IMDS. As discussed earlier in the IMDS Ground Station section, IMDS data was
compiled from several components throughout the aircraft. This data can be found in
Appendix B, listed by BUNO number and component. The following components were
chosen for review, as they provide an accurate cross-section of all IMDS monitored
systems: main rotor, tail rotor, disconnect coupling (tail drive shafts), and input modules
(engine output shafts).
As discussed in the IMD-HUMS section of Chapter III, any time an aircraft is
operated with IMDS, events are automatically recorded and stored in the DTU. This
information is then passed to GS through the PCMCIA cards and catalogued for trend
analysis. Using this trend data, it is possible to view the performance between phase
inspections to determine the performance of aircraft components and predict possible
failures. Trend data was available for all IMDS aircraft during the timeframe of this
study, although some specific data points were not available. For each aircraft, all MDAT
data (excluding main rotor) was analyzed to determine the highest recorded value, mean,
standard deviation, and trend.

88
Main Rotor data was located in the ground station, with the average value
between phases and maximum reading for an individual flight recorded. All data was
compared to the non-operable flight limit for the component and RPM from the VIB-200
(NAVAIR 2010). These limits represent a reasonable threshold for maintenance action as
by definition, they are below the level where early deterioration of the component will
occur (NAVAIR 2010). These limits can be found in Appendix B as part the monitored
systems data record. An aircraft component was determined to require all phase
inspections related to that component if there was a consistent exceedance of the non-
operable flight limit. A consistent exceedance is defined as a recorded limit exceedance
on multiple consecutive days or an increasing trend approaching the limit over a longer
time span.
Only aircraft from HSC-3 and HSC-8 were IMDS capable, and the results showed
very few trends exceeding the applicable limits. For HSC-3, five aircraft were analyzed
over the course of 14 phase inspections, totaling 74 components. Within this group, a
total of nine systems exceeded the non-operable flight limit at any time. Of this smaller
group, only one exceedance was consistently observed and would require additional
inspection during phase. HSC-8 had data available for a total of six aircraft, 14 phases,
and 82 components. From this group, eight systems exceeded the limits at any time, with
only four systems meeting the criteria for additional inspection.
The small number of systems requiring further inspection and the lack of any
aircraft requiring inspection of multiple monitored systems concurrently greatly reduced
the need for inspection of IMDS monitored systems. For this reason, the alternative case
recommends the elimination of phase inspections on IMDS monitored components
without clear need in the data trend record. The alternative case eliminates these
inspections from the phase cycle and implements a much greater CBM capability.
2. Alternative Phase Inspections
After reviewing the IMDS ground station data, it is clear that IMDS provides the
ability to implement CBM under its current usage. This CBM implementation does not
mean that all parts of the phase inspections can be eliminated, as the phases still contains

89
necessary inspections and servicing that IMDS is not currently capable of replacing. For
the alternative case, all inspections related to IMDS monitored systems were removed,
leaving behind a residual inspection to be conducted on non-monitored systems. This
alternative phase should still occur at 175 flight hour intervals, but should include only
the inspections found in Table 18. The alternative Phase found in Table 18 includes all
inspections to be conducted on each phase, with the ability to include additional
inspections as IMDS trends require.
Table 18. Alternative Phase Inspections.
Phase Hours Assist Hours
All 35.8 32
1.3 1
1.3 1
8.7 7.7
17 17
1 1
0.5 0
0.5 0.5
0.5 0
0.6 0.1
0.7 0.5
0.7 0.7
2 2
1 0.5
AC 17.4 16.5
0.6 0
6 6
0.8 0
5 5.5
2.5 2.5
2 2
0.5 0.5
BD 2.7 1
0.7 0
1 0
1 1
A
B 0.7
0.7 0
C
D 5 3.5
1.5 0
1.5 1.5
1 1
1 1
Phase Hours
A 105.4
B 72.2
C 101.7
D 80
Main Rotor Damper System Drain
Environmental Control System
Main Landing Gear
Tail Landing Gear Shock Strut
No Additional Inspections
Main Gear Box Radiator
Pitot Static System
No Additional Inspections
Environmental Control System
Data Bus System
Tail Landing Gear Structure
IGB/TGB Oil Change
Torque Shaft Bearing Supports
Main Landing Gear
Tail Landing Gear
FLIR
Windshield and Wipers
Airframe Inspections (Cockpit, Cabin and Tail Cone/Pylon)
Fire Extinguishing System
Rescue Hoist and Cargo Hook
Stabilator
Auxiliary Power Unit
Fuel System
Main Gear Box Radiator
Access Panels Removal and Inspection
Airframe Inspections (Cabin, Transition Section, Tail Cone, Main Rotor Pylon, Tail Pylon)
Tail Landing Gear Shock Strut
Rotor Brake
Maintenanace
Hydraulic System Sampling
Utility Hydraulic System Sampling

90
The total expected labor hours for each phase can be seen in Table 18, and there is
a significant reduction in inspection hours from Table 2. Additionally, the elimination of
inspections on IMDS monitored components eliminates the need for post-phase vibration
analysis. The current post-phase vibration analysis is mandated by the VIB-100 and VIB-
200 after the completion of certain maintenance actions. These actions requiring vibration
analysis have been eliminated from the phase inspection, therefore no vibration analysis,
or FCF, is required. Post phase FCF would only be required due to a 30-day no-fly
period, the chances of which would be greatly reduced under this alternative maintenance
scheme. The following section on Earned Value presents a detailed comparison of the
baseline and alternative phase schemes.

91
D. EARNED VALUE
As Langford and Franck noted, the goal of EVM is to “suggest how management
can obtain the best-value solution for the taxpayer’s money” (Langford and Franck 2009,
4). Through the course of the gap analysis, a clear CBM capability gap was identified in
the MH-60S. This gap was related to the failure of the maintenance process to maximize
the use of CBM tools. As was discussed as part of the CBA baseline, IMDS provides
minimal capability in its current usage. In order to maximize the value of IMDS, a new
maintenance process must be implemented. An alternative process was conceived using
the IMDS ground station data to tailor the current phase process and reduce cost is terms
of labor and flight hours. The question remains, however, what is the value of
implementing the alternative phase model? To answer this question, the work of
Langford and Franck, discussed in Chapter III, was applied to the baseline and alternative
cases to find the value of closing the CBM capability gap.
1. Assumptions and Methods
The data found in Tables 13-17 provides a great deal of insight into the
assumptions that can be made about maintenance labor usage. Since the baseline phase
model includes a “look” and “fix” phase, actual labor hour usage varies greatly for each
phase. Since no phase takes the exact amount of time listed in Table 2, it is unreasonable
to assume that alternative case labor hours should be taken at face value. The expected
hours must be adjusted to reflect the reality of maintenance, and the metric “Actual-
Expected Labor Hours Difference” from Table 13 provides the basis for such an
adjustment. Using the average of this metric for each phase type, by squadron, a realistic
adjustment of expected phase labor hours can be made.
Adjusting the alternative case using the “Actual-Expected Labor Hours
Difference” metric allows maintenance actions that correct discrepancies found during a
phase to be captured. Even though there is not an exact linear relationship between phase
labor hours and each inspection, this method provides an accurate measure from the
available data. It is impossible to predict without monitoring capability which systems

92
will require repair during a phase, so an estimate must be made for the repairs that will
take place.
Other assumptions that are made concern the MDT and FCF flight hour usage
under the alternate model. Since maintenance requiring FCF is eliminated from the phase
inspections, post-phase FCF hours are assumed to be eliminated. Review of the IMDS
ground station data substantiates this assumption, as only five systems out of 156
warranted additional inspection during the study timeframe. Since adjustments are made
to these IMDS monitored systems during FCF, these figures would likely rise under a
CBM alternative. Conversely, no aircraft required multiple additional inspections, so any
inspections that lead to FCF in the future are likely to be greatly reduced in number. FCF
hours would not be eliminated, but the variable nature of the FCF under the alternate
model along with the greatly reduced frequency implies that FCFs should be omitted
from these calculations.
MDT must be adjusted as well as FCF hours based on the labor requirements
under the alternate model. For this study, labor hours available for phase were 30 per day
for all calculations of MDT. The 30 labor hours figure is similar to the efficiency
achieved in conjunction with phases with the collected data lasting less than 21 days,
which the alternative model is very likely to achieve. In addition MDT was calculated
from the completion of the last flight prior to phase induction until phase completion,
excluding post-phase FCF. This change is justified for the same reasons as the
elimination of post-phase FCF calculations. All aircraft were considered ready for
operational tasking on the date of the completion of all projected phase labor hours under
the alternate model.
These assumptions were applied to each squadron to determine the value of
conversion to CBM between the baseline and alternate models. The final assumption was
that all aircraft will be IMDS equipped in the alternate case. This assumption is necessary
because IMDS allows CBM capability. If IMDS is not installed, there can be no CBM
capability, and thus no difference from the baseline case.

93
2. Earned Value Calculations
Applying the earned value calculations from Langford and Franck from Chapter
III, it is possible to determine the value of closing the CBM capability gap. The equation
from Figure 2 is:
The value of the function F(t) is the value of closing the capability gap. I(t) represents
investment, labor hours in this case, used to produce performance in functional terms.
The functional performance in this case is flight hours, which is fixed at 175 per phase
less the number of post-phase FCF hours. Therefore, the value of closing the gap is the
difference in operational flight hours per maintenance labor hour between the baseline
and alternative models.
Table 19 presents the value calculations for the baseline and alternate models. The
calculations in Table 19 reveal that under the baseline case, the value of each phase
maintenance labor hour is between 0.185 and 0.897 flight hours, with an average of 0.351
across all squadrons and phases. In the alternative case, the value of one phase
maintenance labor hour is between 0.806 and 2.051 flight hours, with an average of 1.097
flight hours per labor hour for all phases across all squadrons.
Langford and Franck also propose the use of quality to determine the worth in gap
analysis. This equation is included in Figure 3, and provides that differences in quality
can lead to differences in the worth of a capability to a squadron. Safety would be the
best measure of quality available, as fewer operational system failures would lead to an
increase in the quality of performance. Due to the fact that CBM is not currently used on
the MH-60S, there is no data available that provides the rate of component failures under
a CBM regime. For this reason, the safety of flight data is much more useful as an
indicator of component quality and not maintenance process quality, except in the cases
of human maintenance error. Put another way, there is not any data on safety under a

94
CBM regime, so any alternative scenario that attempts to capture the quality of safety is
conjecture at best.
Table 19. Value Calculations.
The comparison of value under the baseline and alternative case provides that
there is a significant value to closing the CBM capability gap. It is also important to
investigate the savings for each squadron in absolute terms. Tables 20 and 21 provide the
total savings in terms of labor hours, flight hours, and availability under the alternate
model in comparison to the baseline model.
HSC-3 A AVG 419.2 170.2 0.406 182.5 175.0 0.959
HSC-3 B AVG 362.5 168.1 0.464 125.9 175.0 1.390
HSC-3 C AVG 402.9 168.9 0.419 164.8 175.0 1.062
HSC-3 D AVG 911.1 168.8 0.185 217.1 175.0 0.806
HSC-3 AVG Phase 536.6 169.1 0.315 172.6 175.0 1.014
HSC-3 Total Cycle 2095.8 676.1 0.323 690.3 700.0 1.014
HSC-8 A AVG 471.4 172.3 0.365 156.3 175.0 1.120
HSC-8 B AVG 296.9 171.5 0.578 89.6 175.0 1.953
HSC-8 C AVG 186.7 167.5 0.897 85.3 175.0 2.051
HSC-8 D AVG 554.8 167.2 0.301 131.9 175.0 1.326
HSC-8 AVG Phase 382.4 170.1 0.445 119.5 175.0 1.464
HSC-8 Total Cycle 1509.8 678.5 0.449 506.8 700.0 1.381
HSC-21 A AVG 438.0 167.2 0.382 197.5 175.0 0.886
HSC-21 B AVG 465.2 169.6 0.365 160.2 175.0 1.093
HSC-21 C AVG 230.0 171.0 0.743 100.0 175.0 1.749
HSC-21 D AVG 709.1 167.9 0.237 177.7 175.0 0.985
HSC-21 AVG Phase 479.7 168.8 0.352 168.9 175.0 1.036
HSC-21 Total Cycle 1842.2 675.6 0.367 662.7 700.0 1.056
A AVG 420.4 170.2 0.405 178.4 175.0 0.981
B AVG 352.2 169.7 0.482 119.1 175.0 1.469
C AVG 323.3 168.9 0.522 132.8 175.0 1.318
D AVG 786.3 168.5 0.214 187.9 175.0 0.931
All AVG Phase 482.6 169.3 0.351 159.6 175.0 1.097
All Total Cycle 1882.2 677.3 0.360 652.7 700.0 1.073
Baseline
Value
Alternate
Operational Hours
Alternate
Value
Alternate Phase
Labor HoursPhase Type
Baseline Phase
Labor Hours
Baseline
Operational Hours

95
Table 20. Operational Availability (Baseline versus Alternate)
Squadron MTBM Baseline
MDT Alternate
MDT Baseline
Ao Alternate
Ao
HSC-3 63 42 6 0.602 0.914
HSC-8 123 48 4 0.721 0.968
HSC-21 84 24 6 0.775 0.933
All Squadrons 89 40 6 0.690 0.937
Table 21. Total Labor Hours and Flight Hours (Baseline versus Alternate)
Phase Type Alternate
Labor Hours
Baseline Labor Hours
Total Phases
Total Difference
(Labor Hours) Alternate FCF Hours Saved
HSC-3 A 176.1 419.2 13 3160.7 57.8
HSC-3 B 125.9 362.5 8 1892.5 54.9
HSC-3 C 164.8 402.9 9 2143.3 54.5
HSC-3 D 217.1 911.1 11 7634.4 67.7
HSC-3 Total 683.9 2095.8 41 14830.9 234.9
HSC-8 A 150.8 471.4 5 1602.9 14.7
HSC-8 B 89.6 296.9 6 1243.7 19.2
HSC-8 C 85.3 186.7 4 405.5 30.6
HSC-8 D 131.9 554.8 5 2114.4 33.7
HSC-8 Total 457.7 1509.8 20 5366.5 98.2
HSC-21 A 190.5 438.0 3 742.5 23.4
HSC-21 B 160.2 465.2 3 915.0 10.8
HSC-21 C 100.0 230.0 3 389.8 12.1
HSC-21 D 177.7 709.1 4 2125.4 28.5
HSC-21 Total 628.4 1842.2 13 4172.7 74.8
All A 172.1 420.4 20 4965.4 95.9
All B 119.1 352.2 16 3729.0 84.9
All C 132.8 323.3 16 3048.8 97.2
All D 187.9 786.3 20 11966.8 129.9
All Total 612.0 1882.2 72 23710.0 407.9

96
3. Flight Safety
Analysis of the flight safety data reveals very little in terms of a comparison
between the baseline and alternative models for aircraft maintenance presented in this
study. The sample of HAZREP statistics available since 2009 includes a total of 487
flight incidents in the MH-60S. Of these 487 incidents, only 40 had a direct mechanical
cause, which in this case means failure of a system or component monitored by IMDS.
These 40 incidents included only 16 aircraft that had IMDS installed, so the sample of
IMDS monitored incidents is very small. By comparison, only 40 percent of all aircraft
reporting a mechanical failure had IMDS to 60 percent without IMDS, but IMDS is
typically installed on newer aircraft. One statistic of note is that 25 of the 40 mechanical
incidents were related to human maintenance error. This means that about 62.5 percent of
all MH-60S HAZREPs are caused by a failure of maintenance personnel.
The three metrics discussed in relation to flight safety are: ratio of mechanical
failure to total incidents, percentage of mechanical failure with IMDS installed, and
percentage of incidents involving human error. Since the mechanical failure ratio is 8.2
percent of all incidents over five years, aircraft components have a very low failure rate.
Additionally, since the human failure rate of this subset of incidents in 62.5 percent, only
15 incidents in four years are related to mechanical failure alone. This statistic suggests
that there is no significant increase in risk to aircraft of converting to CBM, due to the
low failure rate of components.
IMDS in conjunction with CBM replaces inspections and provides a constant
monitoring capability. This monitoring capability coupled with the lower rate of
mechanical failures on IMDS aircraft than non-IMDS aircraft suggests that safety would
not be compromised in any meaningful way by converting to a CBM process.
Conversely, the lower number of inspections might actually increase safety by reducing
the largest cause of mechanical failures, human maintenance error.

97
E. RESIDUAL CAPABILITY GAPS
In Chapter I, there were four major research questions that were posed. Questions
3 and 4 are directly related to the presence of a residual capability gap. Those questions
are:
To what extent is there a gap between current capabilities and the
requirement to meet the Navy’s stated goal of maximizing the use of CBM
at the organizational level?
Are there any possible solutions that may have been overlooked that could
be more effective than the maintenance processes currently in use or
development?
The former question above seeks to determine how much the gap analysis succeeded in
closing the CBM capability gap. If IMDS is used to the maximum extent possible, the
answer to this question is yes, CBM has been maximized in the MH-60S. On the other
hand, the answer to the second question is yes, there are solutions that have been
overlooked. By the nature of the NAMP discussed in Chapter II, there is no serious
consideration of a NAMP alternative besides CBM. For this reason, CBM tools are the
only ones currently available for consideration in constructing alternatives. On the other
hand, CBM is by no means perfect and there is a large space to explore involving
alternatives to the NAMP that fall outside of the CBM structure.
The structure of the alternate phase model reveals CBM cannot replace all of the
inspections that are conducted during a phase using IMDS in its current state. This does
not necessarily represent a gap in capability that has a value to close. Review of the
residual phase inspections under the alternate model shows that many of the inspections
likely should not be replaced with CBM. For example, a CBM capability to monitor
hydraulic system fluid is not likely worth the expense when sampling is effective and less
expensive. It must also be recognized that a non-CBM alternative, such as development
of new aircraft systems which require less servicing could also close this residual gap. In
the MH-60S, for example, a fly-by-wire control capability could lessen the need for
complex hydraulic systems. In turn, this would reduce the need for many of the current
maintenance inspections without the use of CBM.

98
One on the primary ways to further increase the value of CBM would be to lessen
the frequency of some inspections common to all phases. For instance, 67.8 hours of
inspection are common to all phases even under the alternate model. Inspections of
components such as the stabilator or landing gear could be lessened in frequency without
an event-based need. That is to say, without exceeding landing limits or a stabilator
malfunction, these systems are unlikely to require inspection every 175 flight hours.
Additionally, the shortened phases could be combined into larger inspections at greater
intervals to further reduce the frequency of inspection and maintenance down time.
The greatest capability gap that stills exists after CBM implementation is a gap
identified under the current maintenance process, i.e., the lack of catastrophic failure
prediction. There is currently no system on the MH-60S that monitors the physical
condition of components. Mishap data, although not revealed in this study, does include
incidents of catastrophic component failure with little or no warning to operators. These
incidents of physical component failure have not been predicted by IMDS or detected
through the inspection process.
The MH-60S tail rotor is especially vulnerable to physical stresses, and a
capability of monitoring the physical condition of tail rotor components would improve
safety but is outside the realm of CBM. Engine power output is also not monitored by
IMDS on a consistent basis. Currently, power checks are completed prior to flight
comparing torque and turbine gas temperature to track engine performance. These health
indicator tests from the NATOPS flight manual are conducted at a single fixed power
setting which is often well below the operating parameters used in flight. Development of
more robust engine monitoring could provide a greater CBM capability for diagnosing
impending engine failures.
These ideas and other future extensions should be considered, but are outside the
scope of this study. In the end, the capability to maintain aircraft available for operational
tasking is met by the current NAMP process and CBM alternative. In terms of meeting the
functional requirements of “to maintain,” CBM provides a more valuable capability than
the current NAMP. Further, there is no residual CBM capability gap under the alternative
case per se, but there are areas for even greater CBM usage not presented in this study.

99
VI. CONCLUSIONS
Analysis of the results from Chapter V reveals that there is a definite value to
implementing CBM in the MH-60S. Statistical analysis of aircraft performance with
IMDS installed to aircraft without IMDS installed revealed that MOPs were equal at the
95 percent confidence level. As the maintenance program of the MH-60S is currently
structured, all aircraft are maintained under the same process regardless of IMDS
capability. There is a small, statistically significant benefit to the current use of IMDS in
the MH-60S. This benefit is based mostly on the efficiency achieved while conducting
the post-phase vibration analysis and FCFs.
The results of this study revealed that in order to achieve a much greater benefit
from the use of the IMDS system, it is necessary to implement a more robust CBM
regime. The most significant part of any CBM program would be to minimize the amount
of phase maintenance inspections on IMDS monitored components in the MH-60S. To
determine the structure of an alternative CBM process, a capability gap analysis was used
in accordance with the JCIDS Capabilities Based Assessment Guide in Chapter IV. This
capability gap analysis was then used to determine the value earned by implementing a
CBM alternative to the extant NAMP process.
The final results of the gap analysis determined that a CBM capability gap does
exist between the Navy’s desired aircraft maintenance process and the extant NAMP
process. Through the use of data collected at the operational level from the MH-60S, the
value of closing this gap was determined for a sample of aircraft within the HSCWP. Use
of IMDS ground station data validated the ability of IMDS to monitor components and
determine when additional maintenance actions were required for these components. This
IMDS ability enabled the elimination of most phase inspections unless a specific
component need was identified by IMDS.
Through using data collected from a sampling of MH-60S aircraft within the
HSCWP, a baseline of current maintenance process performance was created. This
baseline assessed measures of maintenance performance related to labor hours, flight

100
hours, availability and safety. The alternative maintenance case developed in Chapter V
built upon the idea that the maximum benefit is attained by a re-engineering of the phase
maintenance process. The alternative case was based on the elimination of inspections to
IMDS monitored components and systems without an identified need. Current phase
inspections of IMDS monitored components were determined to be needed only when a
consistent exceedance of non-operable flight limits was identified. IMDS provides a
robust ability to monitor and track trends in component and system performance, and this
ability makes the alternative case feasible. This baseline was then compared to the
alternative case to determine the differences in maintenance performance between the
two models. In terms availability, flight hour usage and maintenance labor hour usage,
the alternative case performed significantly better than the baseline case.
Using the data collected from operations over 13 months within the HSCWP, the
value of the baseline and alternative cases were compared. Value was assessed based on a
comparison of flight hours created per labor hour used to facilitate phase inspections. The
result of this comparison was an average increase from 0.36 flight hours produced per
labor hour under the baseline case to 1.073 flight hours produced under the alternative
case. Additionally, implementation of the alternative case would result in a decrease in
usage by 23,710 labor hours per year for the entire sample population. Flight hours
available for operational tasking would increase by up to 3.24 percent, for a total of 382
flight hours across the entire sample population. On an average per-aircraft basis, each
aircraft would attain an additional 5.7 flight hours for operational tasking per 175 flight
hour phase cycle. The increase in flight hours is a direct result of the decrease in the need
for post-phase vibration analysis and FCF due to changes in phase inspections.
Operational availability as a result of phase maintenance would increase from
0.69 to 0.937 on average for the entire sample population. In terms of availability, this
change means that aircraft would be available for operational tasking on 93.7 percent of
all days instead of 69 percent as a result of current phase inspections. Other factors affect
the achieved operational availability, but the main cause of MH-60S unavailability is
phase maintenance.

101
Finally, a review of the available flight safety data revealed that there was no
greater risk to equipment by replacing inspection with IMDS monitoring. The flight
safety data suggests that the majority of mechanical failures in the MH-60S were caused
by human error in the maintenance process. Additionally, the relatively low number of
mechanical failures in the MH-60S suggests that component quality does not require the
level of inspection for which the NAMP phase maintenance process was designed.
A. STUDY EXTENSIONS
This study was conceived to determine the gap in capability to perform CBM at
the operational maintenance level and the value attained by closing that gap. As the
results show, this study succeeded in identifying that gap and proposing a solution to
achieve value in the process. This study was limited to three helicopter squadrons that
currently fly the MH-60S, all within the same administrative aviation wing on the West
Coast. The HSCWP has 10 squadrons in its current configuration, so one logical
extension would be to perform this study on all aircraft within the HSCWP. By
expanding this study’s methods to include all squadrons, a much more robust
understanding of the value of CBM and IMDS could be attained. Due to the operational
commitments of the squadrons in the HSCWP, this level of depth was impossible for this
study using the most current data. Therefore, any extension of this study to include all of
the HSCWP would require the storage of more than 12 months of maintenance data for
all squadrons. Increasing the timeline would provide a more robust data set and longer-
term histories of maintenance performance for individual aircraft and squadrons as a
whole.
This study created a CBM alternative that was based on an evolution of the
current NAMP phase process. As part of this study, the phase process was changed very
little. Instead, the components of phase inspections were altered to reduce maintenance
work-load and increase CBM. Furthermore, this study focused only on phase inspections
and made no effort to alter the myriad of other conditional and special inspections
required by the NAMP. A reasonable extension of this study would be to apply the same
methods that were applied to phase inspections to special and conditional inspections.
102
Increasing the scope of this study would provide others areas within the NAMP where
value could be attained by increasing CBM.
The final logical extension of this study would include a comparison of the
NAMP process to the other service’s maintenance processes. The H-60 provides an ideal
platform for this extension, as the aircraft is flown by the Army, Navy, Air Force and
Coast Guard. Comparison of these various processes would provide a robust series of
alternatives to consider the efficacy of CBM. Moreover, the study of multiple current
alternatives could provide the ability to create a hybrid process which utilizes the best
practices of extant processes in conjunction with CBM. Through the large number of
alternatives available in this comparison, a much better process could be developed.
B. RECOMMENDATIONS
As a result of the findings of this study, there are two primary recommendations
that would improve the efficiency of Naval Aviation maintenance. These changes include
the installation of IMDS on all MH-60S aircraft and a conversion to a CBM process to
replace many current NAMP processes. The first recommendation is to increase the
usage of IMDS in all MH-60S aircraft. Currently, the IMDS is not installed in all MH-
60S, as is evidenced by the aircraft sample used in this study. It is clear that value does
exist by converting to a CBM process, and that the Navy desires to attain this value. The
IMDS is currently the only system in service that is capable of facilitating CBM in the
MH-60S. Therefore, a great amount of value could be achieved by increasing the
prevalence of IMDS in the MH-60S.
The second recommendation is to increase the use of CBM in place of the current
NAMP maintenance processes. The value that is provided by IMDS, as this study clearly
shows, can only be achieved by a conversion to a CBM process. CBM provides the
ability to greatly minimize maintenance effort based on aircraft need. The current NAMP
process has served the Navy well, but was definitively not designed with modern aircraft
systems in mind. The use of inspections as the basis for maintaining aircraft has provided
an excellent maintenance capability. On the other hand, modern systems which can
constantly monitor performance provide a much more robust and accurate measure of

103
component performance than a periodic human inspection. Since these inspections are
based on human measurement, the inspections are subject to human error. As the safety
record indicates, if an aircraft system or component experiences a mechanical failure, it is
most likely due to human error in the maintenance process.
The major question left unresolved by this study is what a CBM process would
actually entail. The alternative CBM proposed by this study simply alters the current
phase process to make more use of IMDS tools. In many ways, this alternative process is
just a step in the evolution of CBM within the Navy. It is important to take that first step,
but the alternative proposed in this study should not be taken as a final solution to CBM
implementation. Much like the NAMP recognizes, process improvement is constant, and
CBM will greatly evolve once the first steps in the direction of CBM are taken.
There is a vast improvement in system monitoring and diagnostic capability
provided by IMDS over human inspections. Human inspection still does provide a great
capability to augment automatic monitoring and would continue to do so under a CBM
process. The accumulation of evidence, however, definitively shows that systematic
monitoring and diagnostics, such as that provided by IMDS, greatly improves both
performance and safety. A failure to recognize this fact or a reluctance to alter processes
that are “good enough” will continue to cause waste and stress the limited resources of
the DOD.
Installing IMDS on all MH-60S aircraft and converting to CBM will not come
without costs. There will be a dollar cost associated with the installation and maintenance
of the IMDS system. These monetary costs do seem as if they would be more than offset
by the savings provided by a CBM process, but most cost related to IMDS would be
incurred as part of the installation process.
Other costs associated with the change in culture at the operational level will be
less monetary. Since the NAMP has been in place for over 50 years, all current Navy
maintenance personnel are familiar and comfortable with the process. This trust in the
NAMP processes will be difficult to overcome and will require great effort. Any new
maintenance process must be allowed to experience the set-backs that will undoubtedly

104
occur. This emotional and economic investment is inevitable to increase the benefits of
altering the maintenance process for future generation of aircraft. The current way of
doing business in naval aviation has in many ways reached the breaking point, and the
current fiscal reality does not support the continued use of expensive, outdated practices.
The conversion of the MH-60S to CBM will allow maintenance departments to gain
comfort in a new model on a familiar airframe. This comfort level will make the
transition much smoother for future generations and greatly improve the war fighting
capability of the U.S. Navy.

105
APPENDIX A. MAINTENANCE DATA.
Appendix A contains data related to maintenance labor hours, flight hours and
availability. Labor hour data was attained from the OOMA records of each squadron,
and flight hour data from SHARP databases. Flight Safety data is privileged and
therefore not published expect as anonymous statistical data in this study.
HSC-3
Aircraft BUNO IMDS FCF Complete Phase Start Phase End TBM Phase Type Phase Labor Hours Phase FCF Hours Days Unavailable Special Type Special Date
01 165756 N 5/16/2013 C 364 5/11/2014
10/10/2013 7/16/2013 9/20/2013 39 D 1200.7 6.8 86 546 9/19/2013
2/13/2014 1/25/2014 2/7/2014 107 A 424.8 1.5 19 728 4/25/2014
5/30/2014 5/2/2014 5/14/2014 78 B 283.1 9.6 28
396 1908.6 17.9 133
07 166323 Y 5/11/2012 B 364 3/19/2014
8/10/2012 C 546 3/5/2014
12/11/2012 D 728 9/13/2012
7/18/2014 6/20/2014 6/30/2014 N/A A 261.1 4.3 28
08 166313 Y 6/13/2013 A 364 2/8/2014
10/23/2013 8/28/2013 9/23/2013 44 B 197.7 6.6 56 546 2/5/2014
2/12/2014 1/22/2014 2/5/2014 91 C 618.9 3.9 21 728 3/10/2013
5/29/2014 4/23/2014 5/19/2014 70 D 890.1 3.5 36
396 1706.7 14 113
09 166317 Y 10/30/2013 10/1/2013 10/11/2013 57 A 509.9 2.3 29 364 1/9/2014
1/28/2014 1/17/2014 1/24/2014 79 B 230.8 3 11 546 6/1/2014
4/2/2014 3/10/2014 3/20/2014 41 C 419.6 7.7 23 728 3/13/2014
6/14/2014 5/10/2014 6/2/2014 38 D 455.1 4.8 35
256 1615.4 17.8 98
11 166344 Y 12/9/2011 B 364 7/10/2013
5/2/2012 C 546 5/13/2013
5/10/2014 8/8/2013 4/2/2014 36 D 807.7 9 272 728 7/6/2013
7/29/2014 7/1/2014 7/10/2014 52 A 194.2 4.6 28
396 1001.9 13.6 300
12 166335 Y 9/5/2013 6/20/2013 8/13/2013 78 A 647.4 5.3 77 364 6/25/2014
12/4/2013 11/14/2013 11/25/2013 70 B 285.1 2.3 20 546 6/19/2014
Key 3/11/2014 2/21/2014 3/4/2014 79 C 445 5.6 18 728 11/20/2013
Non-IMDS No Data IMDS 7/22/2014 4/8/2014 6/21/2014 28 D 1669.6 5.8 105
Other Inspection 365 3047.1 19 220

106
Aircraft BUNO IMDS FCF Complete Phase Start Phase End TBM Phase Type Phase Labor Hours Phase FCF Hours Days Unavailable Special Type Special Date
14 166350 N 9/13/2012 B 364 6/2/2014
3/5/2013 C 546 5/8/2014
6/14/2013 D 728 12/1/2012
6/16/2014 8/5/2013 5/29/2014 35 A 461.9 7.5 311
15 166365 N 4/30/2013 B 364 12/17/2013
8/20/2013 7/13/2013 7/31/2013 65 C 545.7 7 38 546 4/26/2013
1/9/2014 10/26/2013 11/22/2013 67 D 775.6 11.1 75 728 10/20/2013
PMI 2/15/2014 2/26/2014 37 A 394.2 N/A N/A
217 1715.5 18.1 113
16 166343 N 2/8/2012 B 364 10/18/2013
6/11/2012 C 546 4/16/2014
10/16/2012 D 728 8/13/2013
5/9/2014 4/1/2014 4/17/2014 N/A A 653.6 6.1 38
17 166369 N 11/18/2013 10/18/2013 11/13/2013 58 D 667.6 2.9 31 364 2/11/2014
2/6/2014 1/24/2014 2/3/2014 67 A 368.3 6.3 13 546 7/30/2013
5/9/2014 4/4/2014 4/29/2014 57 B 397 6.1 35 728 1/29/2014
7/28/2014 6/28/2014 7/9/2014 50 C 222.5 7.7 30
286 1655.4 23 109
20 165754 N 6/3/2011 B 364 3/21/2014
11/10/2011 C 546 3/6/2014
4/15/2014 3/12/2014 3/26/2014 PMI D 981.1 7.5 33 728 4/26/2014
7/10/2014 6/12/2014 6/23/2014 58 A 443.9 1.5 28
142 1425 9 61
23 166306 N 10/25/2013 9/28/2013 10/16/2013 57 A 276.1 10.7 27 364 8/11/2013
2/1/2014 12/12/2013 1/2/2014 48 B 577.9 10.2 51 546 1/23/2014
4/22/2014 3/18/2014 3/28/2014 45 C 246.2 8.8 35 728 8/10/2012
6/30/2014 5/31/2014 6/16/2014 39 D 564.7 5.9 30
275 1664.9 35.6 143
24 166370 N 11/23/2013 9/26/2013 10/31/2013 48 D 1343.5 3.2 58 364 5/21/2014
3/5/2014 1/30/2014 2/12/2014 68 A 383 4.7 34 546 10/30/2013
5/14/2014 4/14/2014 5/5/2014 40 B 405 4.5 30 728 2/7/2014
8/4/2014 7/12/2014 7/17/2014 59 C 232.7 4.1 23
312 2364.2 16.5 145
28 165747 N 9/6/2012 A 364 1/29/2014
3/12/2013 B 546 1/7/2014
2/24/2014 8/1/2013 1/9/2014 83 C 515.4 7.2 207 728 11/14/2012
7/8/2014 5/21/2014 6/10/2014 86 D 666.7 7.2 48
396 1182.1 14.4 255
30 166293 N 1/23/2013 D 364 6/3/2014
9/18/2013 8/25/2013 9/16/2013 199 A 431.8 3 24 546 9/16/2013
Key 1/18/2014 12/6/2013 12/13/2013 79 B 523.2 12.6 43 728 3/31/2014
Non-IMDS No Data IMDS 5/9/2014 4/4/2014 4/23/2014 78 C 380.3 2.5 35
Other Inspection 396 1335.3 18.1 102
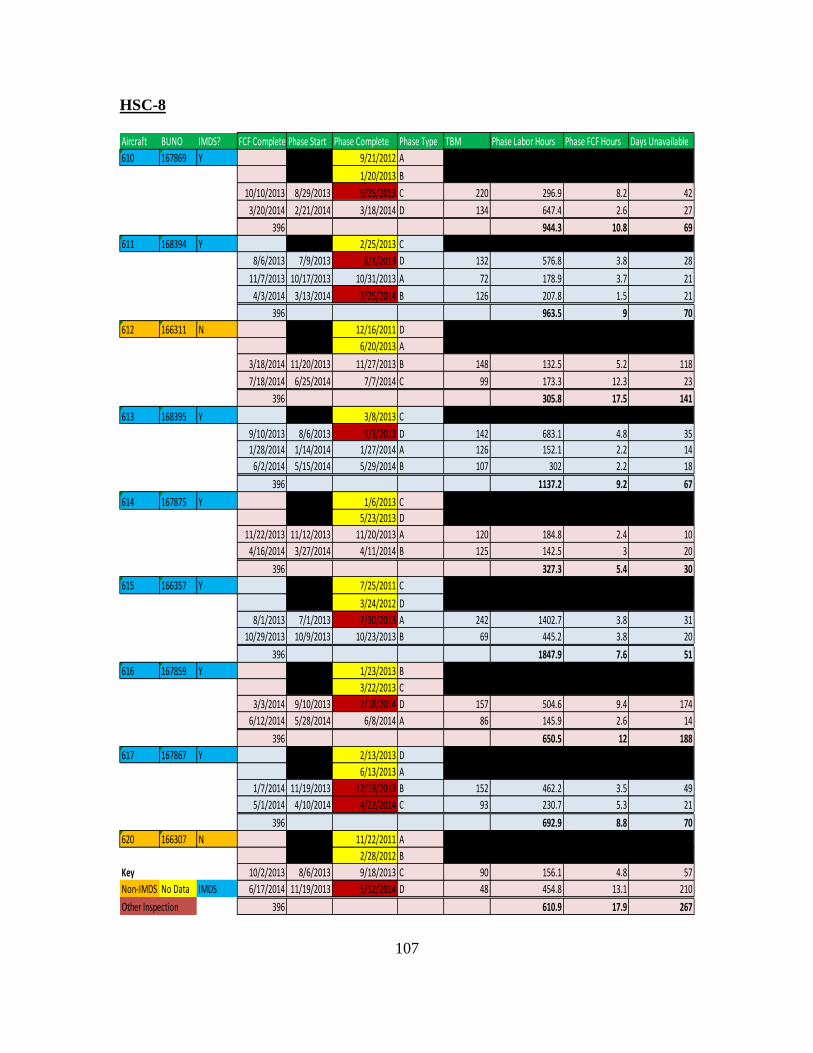
107
HSC-8
Aircraft BUNO IMDS? FCF Complete Phase Start Phase Complete Phase Type TBM Phase Labor Hours Phase FCF Hours Days Unavailable
610 167869 Y 9/21/2012 A
1/20/2013 B
10/10/2013 8/29/2013 9/25/2013 C 220 296.9 8.2 42
3/20/2014 2/21/2014 3/18/2014 D 134 647.4 2.6 27
396 944.3 10.8 69
611 168394 Y 2/25/2013 C
8/6/2013 7/9/2013 8/1/2013 D 132 576.8 3.8 28
11/7/2013 10/17/2013 10/31/2013 A 72 178.9 3.7 21
4/3/2014 3/13/2014 3/25/2014 B 126 207.8 1.5 21
396 963.5 9 70
612 166311 N 12/16/2011 D
6/20/2013 A
3/18/2014 11/20/2013 11/27/2013 B 148 132.5 5.2 118
7/18/2014 6/25/2014 7/7/2014 C 99 173.3 12.3 23
396 305.8 17.5 141
613 168395 Y 3/8/2013 C
9/10/2013 8/6/2013 9/3/2013 D 142 683.1 4.8 35
1/28/2014 1/14/2014 1/27/2014 A 126 152.1 2.2 14
6/2/2014 5/15/2014 5/29/2014 B 107 302 2.2 18
396 1137.2 9.2 67
614 167875 Y 1/6/2013 C
5/23/2013 D
11/22/2013 11/12/2013 11/20/2013 A 120 184.8 2.4 10
4/16/2014 3/27/2014 4/11/2014 B 125 142.5 3 20
396 327.3 5.4 30
615 166357 Y 7/25/2011 C
3/24/2012 D
8/1/2013 7/1/2013 7/30/2013 A 242 1402.7 3.8 31
10/29/2013 10/9/2013 10/23/2013 B 69 445.2 3.8 20
396 1847.9 7.6 51
616 167859 Y 1/23/2013 B
3/22/2013 C
3/3/2014 9/10/2013 2/18/2014 D 157 504.6 9.4 174
6/12/2014 5/28/2014 6/8/2014 A 86 145.9 2.6 14
396 650.5 12 188
617 167867 Y 2/13/2013 D
6/13/2013 A
1/7/2014 11/19/2013 12/19/2013 B 152 462.2 3.5 49
5/1/2014 4/10/2014 4/22/2014 C 93 230.7 5.3 21
396 692.9 8.8 70
620 166307 N 11/22/2011 A
2/28/2012 B
Key 10/2/2013 8/6/2013 9/18/2013 C 90 156.1 4.8 57
Non-IMDS No Data IMDS 6/17/2014 11/19/2013 5/12/2014 D 48 454.8 13.1 210
Other Inspection 396 610.9 17.9 267

108
HSC-21
Aircraft BUNO IMDS FCF Complete Phase Start Phase Complete Phase Type TBM Phase Labor Hours Phase FCF Hours Days Unavailable Special Type Special Date
76 166332 N 3/27/2013 B 364 12/19/2013
7/8/2013 6/10/2013 6/24/2013 C 67 398.6 3.9 28 546 11/1/2012
10/7/2013 9/8/2013 9/24/2013 D 62 410.9 9.3 29 728 10/30/2012
1/24/2014 12/15/2013 12/20/2013 A 69 373.4 14.3 41
396 1182.9 27.5 98
62 166348 N 1/10/2012 A 364 5/27/2014
5/9/2012 B 546 5/28/2014
12/26/2012 C 728 12/11/2012
7/25/2013 6/11/2013 7/15/2013 D 134 1305.8 9.8 44
396 1305.8 9.8 44
71 166362 N 10/7/2013 9/30/2013 10/5/2013 A 84 220.4 5.1 7 364 11/15/2013
11/25/2013 11/11/2013 11/17/2013 B 35 297.8 6.5 14 546 6/6/2013
3/1/2014 2/21/2014 2/28/2014 C 88 132.2 2.9 8 728 8/29/2013
7/10/2014 6/16/2014 7/2/2014 D 107 957.5 4.6 24
283 1607.9 19.1 53
70/75 166315 N 2/26/2013 A 364 7/9/2014
2/20/2014 1/29/2014 2/11/2014 B 117 543.9 4.3 22 546 2/13/2014
5/15/2014 5/6/2014 5/13/2014 C 75 159.1 5.3 9 728 2/19/2014
7/31/2014 7/10/2014 7/23/2014 D 56 162 4.8 21
396 865 14.4 52
74 166319 N 12/20/2011 C 364 1/31/2014
4/17/2013 D 546 12/3/2013
Key 12/13/2013 10/31/2013 11/26/2013 A 78 720.3 4 44 728 10/29/2012
Non-IMDS No Data IMDS PMI 4/7/2014 4/13/2014 B 115 553.8 N/A N/A
Other Inspection 396 1274.1 4 44
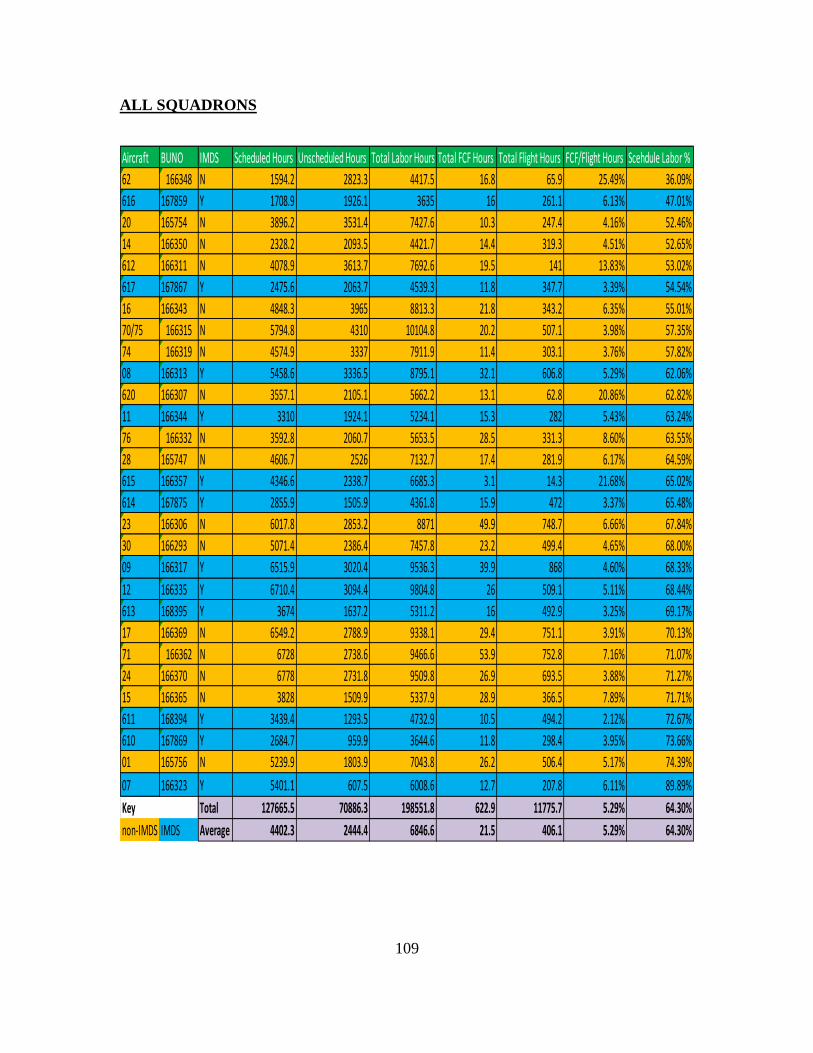
109
ALL SQUADRONS
Aircraft BUNO IMDS Scheduled Hours Unscheduled Hours Total Labor Hours Total FCF Hours Total Flight Hours FCF/Flight Hours Scehdule Labor %
62 166348 N 1594.2 2823.3 4417.5 16.8 65.9 25.49% 36.09%
616 167859 Y 1708.9 1926.1 3635 16 261.1 6.13% 47.01%
20 165754 N 3896.2 3531.4 7427.6 10.3 247.4 4.16% 52.46%
14 166350 N 2328.2 2093.5 4421.7 14.4 319.3 4.51% 52.65%
612 166311 N 4078.9 3613.7 7692.6 19.5 141 13.83% 53.02%
617 167867 Y 2475.6 2063.7 4539.3 11.8 347.7 3.39% 54.54%
16 166343 N 4848.3 3965 8813.3 21.8 343.2 6.35% 55.01%
70/75 166315 N 5794.8 4310 10104.8 20.2 507.1 3.98% 57.35%
74 166319 N 4574.9 3337 7911.9 11.4 303.1 3.76% 57.82%
08 166313 Y 5458.6 3336.5 8795.1 32.1 606.8 5.29% 62.06%
620 166307 N 3557.1 2105.1 5662.2 13.1 62.8 20.86% 62.82%
11 166344 Y 3310 1924.1 5234.1 15.3 282 5.43% 63.24%
76 166332 N 3592.8 2060.7 5653.5 28.5 331.3 8.60% 63.55%
28 165747 N 4606.7 2526 7132.7 17.4 281.9 6.17% 64.59%
615 166357 Y 4346.6 2338.7 6685.3 3.1 14.3 21.68% 65.02%
614 167875 Y 2855.9 1505.9 4361.8 15.9 472 3.37% 65.48%
23 166306 N 6017.8 2853.2 8871 49.9 748.7 6.66% 67.84%
30 166293 N 5071.4 2386.4 7457.8 23.2 499.4 4.65% 68.00%
09 166317 Y 6515.9 3020.4 9536.3 39.9 868 4.60% 68.33%
12 166335 Y 6710.4 3094.4 9804.8 26 509.1 5.11% 68.44%
613 168395 Y 3674 1637.2 5311.2 16 492.9 3.25% 69.17%
17 166369 N 6549.2 2788.9 9338.1 29.4 751.1 3.91% 70.13%
71 166362 N 6728 2738.6 9466.6 53.9 752.8 7.16% 71.07%
24 166370 N 6778 2731.8 9509.8 26.9 693.5 3.88% 71.27%
15 166365 N 3828 1509.9 5337.9 28.9 366.5 7.89% 71.71%
611 168394 Y 3439.4 1293.5 4732.9 10.5 494.2 2.12% 72.67%
610 167869 Y 2684.7 959.9 3644.6 11.8 298.4 3.95% 73.66%
01 165756 N 5239.9 1803.9 7043.8 26.2 506.4 5.17% 74.39%
07 166323 Y 5401.1 607.5 6008.6 12.7 207.8 6.11% 89.89%
Key Total 127665.5 70886.3 198551.8 622.9 11775.7 5.29% 64.30%
non-IMDS IMDS Average 4402.3 2444.4 6846.6 21.5 406.1 5.29% 64.30%

110
THIS PAGE INTENTIONALLY LEFT BLANK

111
APPENDIX B. IMDS DATA
Appendix B contains all IMDS Ground Station Data recorded from HSC-3 and
HSC-8. Main Rotor balance data was collected from the ground station in each squadron
and tail rotor, input shaft, and disconnect coupling data were collected from IMDS
MDAT databases. BUNOs 166323, 166313, 166317, 166344, and 166335 were part of
the HSC-3 inventory and BUNOs 167869, 168394, 168395, 167875, 166357, 167859,
and 167867 were part of the HSC-8 inventory. All exceedances of non-operable flight
limits appear in red, and trends requiring additional inspection also appear in red.
HSC-3
BUNO/System RPM Phase Start Date End Date High Value Mean STD DEV Limit Trend / Consistent Exceedance
166323
Main Rotor 1/per vert 258 A 6/20/2014 0.207 0.101 0.35 None
Main Rotor 1/per roll 258 0.284 0.209 0.3 None
Tail Rotor 1/per 1189 1.026 0.1091 0.1128 0.55 No, Several Spikes above .45 on 4/24 and 4/28
STBD ENG Input Shaft 20900 0.2 0.0728 0.0272 1 None
PORT ENG Input Shaft 20900 0.636 0.2475 0.1477 1 No, Spike from .2 to .5 range after 6/20
Diconnect Coupling 4114 0.17 0.0811 0.0315 0.86 None
166313
Main Rotor 1/per vert 258 A 6/13/2013 8/28/2013 0.35 N/A
Main Rotor 1/per roll 258 0.3 N/A
Tail Rotor 1/per 1189 0.449 0.1302 0.0507 0.55 No, Spike from .1 to .4 range on 8/20
STBD ENG Input Shaft 20900 0.0893 0.0454 0.01 1 No Trend
PORT ENG Input Shaft 20900 0.252 0.1206 0.0291 1 No Trend
Diconnect Coupling 4114 0.197 0.0699 0.0355 0.86 No Trend
Main Rotor 1/per vert 258 B 10/23/2013 1/22/2014 0.111 0.038 0.35 None, Data not available for entire period
Main Rotor 1/per roll 258 0.225 0.133 0.3 None, Data not available for entire period
Tail Rotor 1/per 1189 0.534 0.0969 0.0574 0.55 Spikes to .5 on 10/29 and .4 on 11/18
STBD ENG Input Shaft 20900 0.192 0.0765 0.0364 1 None
PORT ENG Input Shaft 20900 0.304 0.1502 0.0553 1 None, 0.12 trend up to 0.24 on 1/1/14
Diconnect Coupling 4114 0.19 0.0751 0.0351 0.86 None, Stable at .04 or .10
Main Rotor 1/per vert 258 C 2/12/2014 4/23/2014 0.241 0.074 0.35 None
Main Rotor 1/per roll 258 0.139 0.026 0.3 None
Tail Rotor 1/per 1189 0.165 0.081 0.0235 0.55 None
STBD ENG Input Shaft 20900 0.212 0.0661 0.0529 1 None
PORT ENG Input Shaft 20900 0.376 0.2212 0.0427 1 None
Diconnect Coupling 4114 0.174 0.0813 0.0284 0.86 None
Main Rotor 1/per vert 258 D 5/29/2014 0.231 0.168 0.35 None
Main Rotor 1/per roll 258 0.154 0.074 0.3 None
Tail Rotor 1/per 1189 0.27 0.1271 0.0249 0.55 None
STBD ENG Input Shaft 20900 0.914 0.0901 0.0784 1 No, Spike to .7 on 7/29
PORT ENG Input Shaft 20900 1.961 0.0322 0.0155 1 No, Spike to 1.4 on 7/29
Diconnect Coupling 4114 0.197 0.0758 0.0325 0.86 None

112
BUNO/System RPM Phase Start Date End Date High Value Mean STD DEV Limit Trend / Consistent Exceedance
166317
Main Rotor 1/per vert 258 A 10/1/2013 0.35 N/A
Main Rotor 1/per roll 258 0.3 N/A
Tail Rotor 1/per 1189 0.779 0.1944 0.0897 0.55 No, Spike on 9/18 to 0.7
STBD ENG Input Shaft 20900 0.963 0.1025 0.1237 1 None after adjustment
PORT ENG Input Shaft 20900 0.0695 0.0246 0.0128 1 None
Diconnect Coupling 4114 0.822 0.3505 0.1599 0.86 No, Clear Trend up, 0.2 to 0.7 then down to 0.4
Main Rotor 1/per vert 258 B 10/30/2013 1/17/2014 0.183 0.163 0.35 None, Data not available for entire period
Main Rotor 1/per roll 258 0.159 0.076 0.3 None, Data not available for entire period
Tail Rotor 1/per 1189 1.086 0.1316 0.089 0.55 No, Spikes on 11/1 and 12/18
STBD ENG Input Shaft 20900 0.32 0.1053 0.0538 1 None
PORT ENG Input Shaft 20900 0.633 0.4203 0.0814 1 None
Diconnect Coupling 4114 1.03 0.5301 0.1433 0.86 No, Consistently in 0.5-0.7 Range
Main Rotor 1/per vert 258 C 1/28/2014 3/10/2014 0.272 0.168 0.35 N
Main Rotor 1/per roll 258 0.166 0.065 0.3 N
Tail Rotor 1/per 1189 0.371 0.1088 0.0761 0.55 No, Trend Up from 0.05 to 0.25
STBD ENG Input Shaft 20900 0.322 0.0966 0.0566 1 None
PORT ENG Input Shaft 20900 0.429 0.1254 0.0945 1 No, Trend 0.3 drops to 0.06 on 2/10
Diconnect Coupling 4114 1.027 0.4398 0.167 0.86 No, High Early Trend 0.7 decreasig to 0.3
Main Rotor 1/per vert 258 D 4/2/2014 5/10/2014 0.183 0.094 0.35 None
Main Rotor 1/per roll 258 0.157 0.041 0.3 None
Tail Rotor 1/per 1189 0.517 0.2914 0.1427 0.55 No, Jump from 0.05 to 0.4 on 4/14 onward
STBD ENG Input Shaft 20900 0.809 0.5115 0.0798 1 None
PORT ENG Input Shaft 20900 0.22 0.0904 0.0199 1 None
Diconnect Coupling 4114 0.656 0.4612 0.0737 0.86 None
166344
Main Rotor 1/per vert 258 D 3/19/2014 0.35 N/A
Main Rotor 1/per roll 258 0.3 N/A
Tail Rotor 1/per 1189 1.018 0.351 0.2323 0.55 Yes, Steady Climb from .15 to 1.0
STBD ENG Input Shaft 20900 0.8 0.2383 0.0676 1 None
PORT ENG Input Shaft 20900 2.072 0.1392 0.2093 1 No, Spike associated with FCF on first runs
Diconnect Coupling 4114 0.308 0.1361 0.0599 0.86 None
Main Rotor 1/per vert 258 A 5/10/2014 7/1/2014 0.28 0.09 0.35 None
Main Rotor 1/per roll 258 0.17 0.088 0.3 None
Tail Rotor 1/per 1189 0.5 0.2779 0.0792 0.55 None, Spike on 4/24-4/27 to 0.45
STBD ENG Input Shaft 20900 0.16 0.0842 0.0211 1 None
PORT ENG Input Shaft 20900 0.23 0.1368 0.0249 1 None
Diconnect Coupling 4114 0.341 0.1318 0.0578 0.86 None

113
BUNO/System RPM Phase Start Date End Date High Value Mean STD DEV Limit Trend / Consistent Exceedance
166335
Main Rotor 1/per vert 258 A 7/22/2013 0.35 N/A
Main Rotor 1/per roll 258 0.3 N/A
Tail Rotor 1/per 1189 0.442 0.285 0.0378 0.55 None
STBD ENG Input Shaft 20900 0.418 0.3427 0.0835 1 None
PORT ENG Input Shaft 20900 1.851 0.1919 0.1396 1 None, Spike to 1.8 on 4/7 then back to 0.2
Diconnect Coupling 4114 0.352 0.1811 0.0622 0.86 None
Main Rotor 1/per vert 258 B 9/5/2013 11/14/2013 0.35 N/A
Main Rotor 1/per roll 258 0.3 N/A
Tail Rotor 1/per 1189 0.415 0.2706 0.0381 0.55 None
STBD ENG Input Shaft 20900 0.594 0.3115 0.0471 1 None
PORT ENG Input Shaft 20900 0.338 0.1851 0.0705 1 None
Diconnect Coupling 4114 0.297 0.1736 0.048 0.86 None, Declining through period
Main Rotor 1/per vert 258 C 12/4/2013 2/21/2014 0.287 0.203 0.35 None
Main Rotor 1/per roll 258 0.292 0.183 0.3 None
Tail Rotor 1/per 1189 0.269 0.0897 0.0436 0.55 No, Jump from .1 to .15 on 2/14
STBD ENG Input Shaft 20900 0.547 0.2726 0.0513 1 None
PORT ENG Input Shaft 20900 0.338 0.166 0.0635 1 None
Diconnect Coupling 4114 0.348 0.1865 0.058 0.86 None
Main Rotor 1/per vert 258 D 3/11/2014 4/8/2014 0.278 0.055 0.35 None
Main Rotor 1/per roll 258 0.159 0.041 0.3 None
Tail Rotor 1/per 1189 0.193 0.0907 0.0335 0.55 None
STBD ENG Input Shaft 20900 0.572 0.2743 0.0514 1 None
PORT ENG Input Shaft 20900 0.355 0.1739 0.0661 1 None
Diconnect Coupling 4114 0.352 0.1865 0.0872 0.86 None

114
HSC-8
Aircraft System RPM Phase Start Date End Date High Value Mean STD DEV Limit Trend / Consistent Exceedance
167869
Main Rotor 1/per vert 258 C 1/20/2013 8/29/2013 0.303 0.179 0.35 None
Main Rotor 1/per roll 258 0.192 0.106 0.3 None
Tail Rotor 1/per 1189 0.433 0.3499 0.0444 0.55 None
STBD ENG Input Shaft 20900 0.899 0.7507 0.0721 1 No, Trend up from .64 to .82
PORT ENG Input Shaft 20900 0.26 0.1501 0.0413 1 None
Diconnect Coupling 4114 0.148 0.0746 0.0308 0.86 None
Main Rotor 1/per vert 258 D 10/10/2013 2/21/2014 0.329 0.19 0.35 None
Main Rotor 1/per roll 258 0.224 0.097 0.3 None
Tail Rotor 1/per 1189 0.372 0.1563 0.0478 0.55 No, Spike to .28 between 2-7/2-10-14
STBD ENG Input Shaft 20900 0.567 0.354 0.0807 1 No, Trend up .3 to .5
PORT ENG Input Shaft 20900 0.361 0.2049 0.0403 1 None
Diconnect Coupling 4114 0.184 0.0884 0.0297 0.86 None, trend up to .125 after 2-10-14
168394
Main Rotor 1/per vert 258 D 2/25/2013 7/9/2013 0.13 0.09 0.35 None
Main Rotor 1/per roll 258 0.11 0.083 0.3 None
Tail Rotor 1/per 1189 0.47 0.2048 0.1291 0.55 None
STBD ENG Input Shaft 20900 0.46 0.2425 0.0441 1 None
PORT ENG Input Shaft 20900 0.54 0.338 0.0428 1 None
Diconnect Coupling 4114 0.22 0.0887 0.0476 0.86 None
Main Rotor 1/per vert 258 A 8/6/2013 10/17/2013 0.238 0.092 0.35 None
Main Rotor 1/per roll 258 0.178 0.053 0.3 No, 1 HVR exceedance
Tail Rotor 1/per 1189 0.078 0.013 0.0085 0.55 None
STBD ENG Input Shaft 20900 0.351 0.1981 0.0378 1 None
PORT ENG Input Shaft 20900 0.528 0.288 0.0576 1 None
Diconnect Coupling 4114 0.192 0.0814 0.0368 0.86 None
Main Rotor 1/per vert 258 B 11/7/2013 3/13/2014 0.161 0.142 0.35 None
Main Rotor 1/per roll 258 0.054 0.052 0.3 None
Tail Rotor 1/per 1189 0.471 0.0744 0.0654 0.45 No, Spike to .2 and .3 from 11-20/11-26
STBD ENG Input Shaft 20900 0.44 0.2233 0.0572 1 No Trend
ENG Output Shaft 20900 0.508 0.3054 0.0696 1 No Trend
Diconnect Coupling 4114 0.217 0.0718 0.0453 0.4 No Trend
168395
Main Rotor 1/per vert 258 D 3/8/2013 8/6/2013 0.35 N/A
Main Rotor 1/per roll 258 0.3 N/A
Tail Rotor 1/per 1189 0.181 0.0812 0.0351 0.45 None
STBD ENG Input Shaft 20900 0.242 0.1033 0.0315 1 None
PORT ENG Input Shaft 20900 0.54 0.3854 0.0526 1 None
Diconnect Coupling 4114 0.101 0.0409 0.0203 0.4 None
Main Rotor 1/per vert 258 A 9/10/2013 1/14/2014 0.257 0.049 0.35 None
Main Rotor 1/per roll 258 0.273 0.173 0.3 None
Tail Rotor 1/per 1189 0.176 0.052 0.0336 0.55 None
STBD ENG Input Shaft 20900 0.289 0.0936 0.0323 1 None
PORT ENG Input Shaft 20900 2.847 0.3696 0.1792 1 Yes: Spike to 2.8 on 9-25/9-29
Diconnect Coupling 4114 0.116 0.0385 0.0212 0.86 None
Main Rotor 1/per vert 258 B 1/28/2014 5/15/2014 0.19 0.072 0.35 None
Main Rotor 1/per roll 258 0.247 0.183 0.3 None
Tail Rotor 1/per 1189 0.731 0.2537 0.1739 0.55 Yes: Large Data Range, many over .45 from 4-2/4-6
STBD ENG Input Shaft 20900 0.251 0.0988 0.0331 1 None
PORT ENG Input Shaft 20900 0.519 0.3872 0.0537 1 None
Diconnect Coupling 4114 0.0996 0.0329 0.0176 0.86 None

115
Aircraft System RPM Phase Start Date End Date High Value Mean STD DEV Limit Trend / Consistent Exceedance
167875
Main Rotor 1/per vert 258 A 5/23/2013 11/12/2013 0.437 0.177 0.35 None
Main Rotor 1/per roll 258 0.23 0.1 0.3 None
Tail Rotor 1/per 1189 0.248 0.1656 0.0424 0.55 No, Slow Climb from .12 to .2
STBD ENG Input Shaft 20900 0.0598 0.0153 0.0075 1 None
PORT ENG Input Shaft 20900 0.534 0.3219 0.0492 1 None
Diconnect Coupling 4114 0.302 0.1018 0.0563 0.86 No, Some Higher Peaks, Flucuating Trend
Main Rotor 1/per vert 258 B 11/22/2013 3/27/2014 0.762 0.222 0.35 Yes: 3/18-3/26 (4 Flights)
Main Rotor 1/per roll 258 0.499 0.145 0.3 Yes: 3/18-3/26 (4 Flights)
Tail Rotor 1/per 1189 0.197 0.0748 0.0253 0.55 No, Trend Down from .15 to .08
STBD ENG Input Shaft 20900 0.251 0.1206 0.0497 1 None
PORT ENG Input Shaft 20900 0.439 0.3531 0.04 1 None
Diconnect Coupling 4114 0.208 0.0942 0.0448 0.86 None
166357
Main Rotor 1/per vert 258 A 3/24/2012 7/1/2013 0.35 N/A
Main Rotor 1/per roll 258 0.3 N/A
Tail Rotor 1/per 1189 0.55 N/A
20900 1 N/A
ENG Output Shaft 20900 1 N/A
Diconnect Coupling 4114 0.86 N/A
Main Rotor 1/per vert 258 B 8/1/2013 10/9/2013 0.1 0.039 0.35 None
Main Rotor 1/per roll 258 0.172 0.154 0.3 None
Tail Rotor 1/per 1189 0.55 N/A
STBD ENG Input Shaft 20900 1 N/A
PORT ENG Input Shaft 20900 1 N/A
Diconnect Coupling 4114 0.86 N/A

116
Aircraft System RPM Phase Start Date End Date High Value Mean STD DEV Limit Trend / Consistent Exceedance
167859
Main Rotor 1/per vert 258 D 3/22/2013 9/10/2013 0.293 0.168 0.35 None
Main Rotor 1/per roll 258 0.251 0.128 0.3 None
Tail Rotor 1/per 1189 0.869 0.6653 0.0956 0.55 Yes, Trend High, Adjusted Down to 0.5 Range on 9/6
STBD ENG Input Shaft 20900 0.516 0.3437 0.0508 1 None
PORT ENG Input Shaft 20900 0.521 0.28 0.0953 1 None
Diconnect Coupling 4114 0.294 0.106 0.0636 0.86 No, Down from 0.2
Main Rotor 1/per vert 258 A 3/3/2014 5/28/2014 0.271 0.159 0.35 None
Main Rotor 1/per roll 258 0.205 0.052 0.3 None
Tail Rotor 1/per 1189 0.205 0.0871 0.0271 0.55 None
STBD ENG Input Shaft 20900 0.889 0.478 0.0703 1 None
PORT ENG Input Shaft 20900 0.47 0.1473 0.035 1 None
Diconnect Coupling 4114 0.251 0.0723 0.0393 0.86 None
167867
Main Rotor 1/per vert 258 B 6/13/2013 11/19/2013 0.372 0.106 0.35 None, 2x single exceedance in July and September
Main Rotor 1/per roll 258 0.24 0.107 0.3 None
Tail Rotor 1/per 1189 0.368 0.1484 0.0633 0.55 None
STBD ENG Input Shaft 20900 0.555 0.2988 0.1096 1 None
PORT ENG Input Shaft 20900 0.195 0.1065 0.0251 1 None
Diconnect Coupling 4114 0.18 0.094 0.045 0.86 None
Main Rotor 1/per vert 258 C 1/7/2014 4/10/2014 0.401 0.188 0.35 No, single exceedance
Main Rotor 1/per roll 258 0.238 0.041 0.3 None
Tail Rotor Vibes 1189 0.699 0.1327 0.0503 0.55 No, Single recording above 0.3
STBD ENG Input Shaft 20900 0.549 0.3192 0.1236 1 None
PORT ENG Input Shaft 20900 0.187 0.096 0.0295 1 None
Diconnect Coupling 4114 0.244 0.1002 0.0489 0.86 None

117
LIST OF REFERENCES
Bechhoefer, Eric and Andreas Bernhard. 2005. “Experience in Setting Thresholds for
Mechanical Diagnostics in the UH-60L Fleet Demonstration,” 2005 IEEE
Aerospace Conference, 3438–3444. Big Sky, MT: IEEE.
Blanchard, Benjamin S. and Wolter J. Fabrycky. 2011. Systems Engineering and
Analysis. 5th ed. Upper Saddle River, NJ: Pearson.
Coats, David, Mohammed A. Hassan, Nicholas Goodman, Vytautas Blechertas; Yong-
June Shin, and Abdel Bayoumi. 2011. “Design of Advanced Time-Frequency
Mutual Information.” 2011 IEEE Aerospace Conference.1-8, 5-12. Big Sky, MT:
IEEE.
Commander, Naval Air Forces. 2013. Naval Aviation Maintenance Program
(COMNAVAIRFORINST 4790.2B, CH-1). San Diego, CA: Commander, Naval
Air Forces, June 28.
Cooper, Helene, and Steven Erlanger. 2014. “Military Cuts Render NATO Less
Formidable as Deterrent to Russia.” New York Times, March 26.
Department of Defense. 2008. Condition-Based Maintenance Plus DOD Guidebook.
Washington, DC: Department of Defense, May.
Department of Defense. 2012. Condition-Based Maintenance Plus for Material
Maintenance (DODI 4151.22). Washington, DC: Department of Defense, Oct. 16.
Department of Defense. 2012. Joint Capabilities Integration and Development System
(CJCSI 3170.01H). Washington, DC: Chairman, Joint Chiefs of Staff, Jan. 10.
Department of the Navy. 1998. Condition-Based Maintenance (CBM) Policy
(OPNAVINST 4790.16). Washington, DC: Office of the Chief of Naval
Operations, May 6.
Department of the Navy. 2007. Condition-Based Maintenance (CBM) Policy
(OPNAVINST 4790.16A). Washington, DC: Chief of Naval Operations, Dec. 7.
Department of the Navy. 2013. Policies and Peacetime Planning Factors Governing the
Use of Naval Aircraft. (OPNAV INSTRUCTION 3110.11U) Washington, DC:
Depatment of the Navy. May 29.
Gauthier, Stephen. 2006. Decision Analysis to Support Condition-based Maintenance
Plus. Master’s thesis, Naval Postgraduate School.

118
John Deere. 2014. Condition Based Maintenance.
http://www.deere.com/wps/dcom/en_US/services_and_support/product_support/c
ondition_based_maintenance/condition_based_maintenance.page.
Langford, Gary O. and Raymond Franck. 2009. Gap Analysis: Application to Earned
Value Analysis. Monterey, CA: Naval Postgraduate School, Aug. 19.
Langford, Gary, Raymond Franck, Tom Huynh, and Ira Lewis. 2007. Gap Analysis:
Rethinking the Conceptual Foundations. Acquisition Research Sponsored Report,
Monterey, CA: Naval Postgraduate School, .Dec. 14.
Naval Air Systems Command. 2010. Vibration Analysis Manual Integrated Mechanical
Diagnostic System (A1-H60RS-VIB200). Patuxent River, MD: Commander,
Naval Air Systems Command, July 1.
Naval Air Systems Command. 2012. Maintenance Requirement Card (A1-H60SA-MRC-
350, CH-1). Patuxent River, MD: Commander, Naval Air Systems Command,
Jan.1.
Naval Air Systems Command. 2012. NATOPS Flight Manual, Navy Model H-60S
Helicopter (A1-H60SA-NFM-000). Patuxent River, MD: Commander, Naval Air
Systems Command, Sept. 1.
Naval Air Systems Command. 2012. Vibration Analysis Manual Automated Track and
Balance Set (A1-H60CA-VIB100). Patuxent River, MD: Commander, Naval Air
Systems Command, April 1.
Naval Air Systems Command. 2013. Maintenance Requirement Card (A1-H60CA-MRC-
400). Patuxent River, MD: Commander, Naval Air Systems Command, May 1.
Naval Aviation Schools Command. 2005. “The History of the Naval Aviation Safety
School.” Accessed May 1, 2014.
http://www.netc.navy.mil/nascweb/sas/home_history_of_aso.htm
Pandey, M.D. and J.A.M. van der Weide. 2009. “Condition Based Maintenance of
Engineering Systems.” In Reliability, Risk and Safety, Vol. 3, by Radim Bri, and
Sebastián Martorell. Edited by C. Guedes Soares, 535-542. London: CRC Press.
Taylor, Malcolm, Gary Leaman, Robert Ghisolfi, Eric Badertscher, and Andrew Bahjat.
2005. Naval Aviation Vision 2020. San Diego, CA: Commander, Naval Air
Forces, Jan. 1.
Wegerich, Stephan. 2004. “Similarity Based Modeling of Time Synchronous Averaged.”
2004 IEEE Aerospace Conference. 3654-3662. Big Sky, MT: IEEE.

119
INITIAL DISTRIBUTION LIST
1. Defense Technical Information Center
Ft. Belvoir, Virginia
2. Dudley Knox Library
Naval Postgraduate School
Monterey, California