Improving ice productivity and performance for an activated carbon ...
20
Improving ice productivity and performance for an activated carbon/methanol solar adsorption ice-maker Naef A.A. Qasem, Maged A.I. El-Shaarawi ⇑ Mechanical Engineering Department, King Fahd University of Petroleum & Minerals (KFUPM), Dhahran 31261, Saudi Arabia Received 23 June 2013; received in revised form 27 September 2013; accepted 15 October 2013 Available online 14 November 2013 Communicated by: Associate Editor Ruzhu Wang Abstract The paper addresses the factors that can improve the performance of an activated carbon/methanol intermittent solar adsorption ice marker. It optimizes the ice maker under Dhahran climate with the MATLAB program to improve the performance and to increase the ice production per day per square meter of the solar collector. The optimizing results show that 14.1 kg of activated carbon NORIT RX3-Extra per m 2 of solar collector, double glazing cover, thin stainless steel absorber tubes with selective coating, suitable monthly collector tilt angle and suitable time for starting the cycle improve the performance. Moreover, the system can produce from 5 kg up to 13 kg of ice per day per m 2 of collector area with improved solar coefficients of performance (SCOP) of 0.12 and 0.24 in the hot and the cold days, respectively. The optimized solar refrigerator is of benefit to further application and producing ice in grid-off rural zones. Ó 2013 Elsevier Ltd. All rights reserved. Keywords: Solar energy; Adsorption; Refrigeration; Modeling; Intermittent; Activated carbon/methanol 1. Introduction Cooling systems have being become one of the impor- tant needed parts of our live. Most refrigeration systems are driven by electric energy. The electricity, that most of refrigeration systems depend on, is not covering all human living areas. For now, there are numerous places in grid off in rural zones. So people living in such areas need to store vaccine in their local clinics and to preserve their food. Accordingly, solar adsorption refrigeration technology has attracted some researchers since last decade because it is clean, cheap and simple for use in air conditioning, ice making, food preservation and vaccine storage. These devices rely on porous solid materials that can adsorb or desorb the vapor of refrigerant at certain conditions. An intermittent adsorptive solar ice-maker consists of adsorbent bed placed inside a solar collector for desorption the refrigerant from the sorbent material during solar time and adsorption the refrigerant that comes from the refrig- erator at the night, in which the evaporator can be cold and some ice may be produced. The adsorption refrigeration systems depend critically on the working pairs. The com- mon working pairs were investigated and compared by Cri- toph (1988), San and Lin (2008) and Wang et al. (2009). Askalany et al. (2012) also revised several refrigerants that work with carbon adsorbent. Adsorption refrigeration materials are carefully reviewed by Alghoul et al. (2007). The study showed the important properties of the adsor- bent and adsorbate pairs used in the adsorption refrigera- tion systems and also determined the pair and materials which are suitable when solar energy is used as the main energy source. Activated carbon, zeolite, and silica gel are the essential common materials used as adsorbents whereas water, ammonia and methanol are the most important adsorbates. 0038-092X/$ - see front matter Ó 2013 Elsevier Ltd. All rights reserved. http://dx.doi.org/10.1016/j.solener.2013.10.018 ⇑ Corresponding author. Tel.: +966 505623917; fax: +966 38602949. E-mail address: [email protected] (M.A.I. El-Shaarawi). www.elsevier.com/locate/solener Available online at www.sciencedirect.com ScienceDirect Solar Energy 98 (2013) 523–542
Transcript of Improving ice productivity and performance for an activated carbon ...
Improving ice productivity and performance for an activatedcarbon/methanol solar adsorption ice-maker
Naef A.A. Qasem, Maged A.I. El-Shaarawi ⇑
Mechanical Engineering Department, King Fahd University of Petroleum & Minerals (KFUPM), Dhahran 31261, Saudi Arabia
Received 23 June 2013; received in revised form 27 September 2013; accepted 15 October 2013Available online 14 November 2013
Communicated by: Associate Editor Ruzhu Wang
Abstract
The paper addresses the factors that can improve the performance of an activated carbon/methanol intermittent solar adsorption icemarker. It optimizes the ice maker under Dhahran climate with the MATLAB program to improve the performance and to increase theice production per day per square meter of the solar collector. The optimizing results show that 14.1 kg of activated carbon NORITRX3-Extra per m2 of solar collector, double glazing cover, thin stainless steel absorber tubes with selective coating, suitable monthlycollector tilt angle and suitable time for starting the cycle improve the performance. Moreover, the system can produce from 5 kg upto 13 kg of ice per day per m2 of collector area with improved solar coefficients of performance (SCOP) of 0.12 and 0.24 in the hotand the cold days, respectively. The optimized solar refrigerator is of benefit to further application and producing ice in grid-off ruralzones.! 2013 Elsevier Ltd. All rights reserved.
Keywords: Solar energy; Adsorption; Refrigeration; Modeling; Intermittent; Activated carbon/methanol
1. Introduction
Cooling systems have being become one of the impor-tant needed parts of our live. Most refrigeration systemsare driven by electric energy. The electricity, that most ofrefrigeration systems depend on, is not covering all humanliving areas. For now, there are numerous places in grid offin rural zones. So people living in such areas need to storevaccine in their local clinics and to preserve their food.Accordingly, solar adsorption refrigeration technologyhas attracted some researchers since last decade becauseit is clean, cheap and simple for use in air conditioning,ice making, food preservation and vaccine storage. Thesedevices rely on porous solid materials that can adsorb ordesorb the vapor of refrigerant at certain conditions. Anintermittent adsorptive solar ice-maker consists of
adsorbent bed placed inside a solar collector for desorptionthe refrigerant from the sorbent material during solar timeand adsorption the refrigerant that comes from the refrig-erator at the night, in which the evaporator can be cold andsome ice may be produced. The adsorption refrigerationsystems depend critically on the working pairs. The com-mon working pairs were investigated and compared by Cri-toph (1988), San and Lin (2008) and Wang et al. (2009).Askalany et al. (2012) also revised several refrigerants thatwork with carbon adsorbent. Adsorption refrigerationmaterials are carefully reviewed by Alghoul et al. (2007).The study showed the important properties of the adsor-bent and adsorbate pairs used in the adsorption refrigera-tion systems and also determined the pair and materialswhich are suitable when solar energy is used as the mainenergy source. Activated carbon, zeolite, and silica gelare the essential common materials used as adsorbentswhereas water, ammonia and methanol are the mostimportant adsorbates.
0038-092X/$ - see front matter ! 2013 Elsevier Ltd. All rights reserved.http://dx.doi.org/10.1016/j.solener.2013.10.018
⇑ Corresponding author. Tel.: +966 505623917; fax: +966 38602949.E-mail address: [email protected] (M.A.I. El-Shaarawi).
www.elsevier.com/locate/solener
Available online at www.sciencedirect.com
ScienceDirect
Solar Energy 98 (2013) 523–542
According to working pair comparisons, for low-gradetemperature sources as solar energy using flat collectors,the appropriate pairs for cooling purposes are activated car-bon/methanol and zeolite/water, Alghoul et al. (2007). How-ever the zeolite/water pair is not utilized for freezing. So thesuitable pair that can be used to produce ice powered by solarradiation is activated carbon/methanol. Activated carbon isa substance of crystalline form having large internal porestructures with surfaces greater than 500 m2 g!1. The wordactivation basically means creating pores in a nonporousmaterial such as: coal, lignite, wood, nut shells and synthetic
polymers by means of chemical reactions, Askalany et al.(2012). There are many forms of activated carbon such pow-ders, granulated, molecular sieves and carbon fibers, Srivast-ava and Eames (1998). The issue that appears with usingactivated carbon/methanol is the decomposition of metha-nol greater than 150 "C Eric (1998) and also greater than120 "C if the copper tubes are used as absorbers, Alghoulet al. (2007). The decomposition of methanol is higher byuse aluminum alloy material as absorbers (Eric, 1998).
Vasta et al. (2008) simulated an activated carbon/meth-anol adsorptive ice-maker system by use a flat plate solar
Nomenclature
A area (m2)Acollector collector area (m2)COP coefficient of performanceCp specific heat at constant pressure (J kg!1 K!1)D Dubinin–Astakhov constant (K!1)D1 diameter of inner pass tube (m)D2 internal diameter of absorber tube (m)D3 external diameter of absorber tube (m)Do surface diffusion coefficient (m2 s!1)Ea activation energy of surface diffusion (J mol!1)ESCOP effective solar coefficient of performanceh specific enthalpy (J kg!1)h heat transfer coefficient (W m!2 K!1)H heat of desorption or adsorption per unit mass
of methanol (J kg!1)IT incident solar radiation (W m!2)k thermal conductivity (W m!1 K!1)L latent heat (J kg!1)Lc collector length (m)Lt adsorber tubes length (m)M, m mass (kg)mm methanol uptake (kg)n Dubinin–Astakhov constantNg number of glass coverntube number of absorber tubesP system pressure (Pa)Q heat amount (J)R gas constant (J mole!1 K!1)r radius (m)R1 radius of inner pass tube (m)R2 internal radius of absorber tube (m)R3 external radius of absorber tube (m)rp average radius of adsorbent particles (m)SCOP solar coefficient of performanceSCP specific cooling power (W kg!1)T temperature ("C or K)t time (s)/thickness (m)U overall heat transfer coefficient (W m!2 K!1)Vw wind velocity (m s!1)Wc collector width (m)
x concentration ratio of adsorbate inside adsor-bent (kg kg!1)
xo maximum limit of mass adsorbed (kg kg!1)
Greek symbolsD difference/changes transmittancea absorptivitye emissivityr Stefan Boltzmann constant (W m!2 K!4)b collector tilt angle (degree)q density (kg m!3)
Subscripts1, 2, 3, 4 processes terminal locationsac activated carbona adsorption (at end cycle)amb ambientb backcon condenserd desorption (at end generation)e evaporatoreq equivalentg generation/glassi insulationice iceis collector side insulationL collector overallm methanolmax maximummin minimumpw external wall of the adsorber tubes sidesa starting adsorptionsat saturatedsd starting desorptionsol solidificationt topw waterwm water tank metal
524 N.A.A. Qasem, M.A.I. El-Shaarawi / Solar Energy 98 (2013) 523–542
collector of 1.5 m2 that contained 13 concentric tubesfilled with 37 kg of activated carbon and about 10.5 kgof methanol for simulation according to Messina, Italy,climatic conditions (38"120N, average useful solar radia-tion was about 520 W m!2 for June and about250 W m!2 for December). For the most part of the year(from April to October), a daily ice production of 5 kgcould be produced. This amount decreased to 4 kg in Feb-ruary and March. The coldest months in the year (Janu-ary, November and December) had the amount of 2.0–3.5 kg. The net solar coefficient of performance (SCOP)had a minimum value of 0.045 in July, but the maximumone was about 0.11 in January, with an annual mean of0.07. Zhao et al. (2008) used activated carbon/methanolto introduce a mechanical and experimental freeze proofsolar adsorption cooling tube. The collector was con-structed as outer tube, center tube and vacuum tube weremade of hard borosilicate glass. The maximum tempera-ture generated by the system was about 110 "C whereasthe evaporator temperature reached !4 "C below zero.The device achieved 87–99 kJ of cooling capacity and aSCOP of 0.11. Hassan et al. (2011) via a theoretical simu-lation of a solar adsorption refrigerator assumed the effec-tive thermal conductivity of the adsorbent bed and thesystem pressure as variable parameters. The resultsshowed that the change in the effective thermal conductiv-ity of reactor is very small (between 0.5 and 0.528 W m!1 -K!1) and the system pressure during adsorption anddesorption processes was almost constant. The maximumsolar coefficient of performance reached was 0.2 underCanada’s climate on 30th June, 2009.
The experimental study for a solar adsorptive ice-makerby Leite et al. (2007) used methanol charcoal pair (21 kg ofactivated carbon and 6 kg of methanol). The collector bedwas made of 9 multi tubular with an opaque black absor-ber surface and transparent insulation material (TIM) attop and bottom covers to minimize heat losses duringdesorption process under climate conditions of Brazil.Three cycles had been examined with different conditions:first condition was a clear sky, second one with partiallycloudy sky, and finally under entirely cloudy sky. The studyshowed many features that had significant effects on theperformance as degree of cloudy sky during the night.The maximum generating temperatures were 100.1, 87.3and 92.7 "C enabled to produce 6.05, 2.10 and 0 kg of iceper square meter of the collector for the three cycles ofclear sky, partially cloudy and overcast nights, respectively.Leite compared his study with TIM cover and using waterfor condensation with Medini et al. (1991) who used a sin-gle glazing cover and selective surface for absorber thatproduced 5 kg of ice per m2 with SCOP equaled 0.15.The TIM technique reduces the top heat loss coefficientfrom 5 W m!2 K!1 to 1.34 W m!2 K!1.
The analysis of the cooling and adsorption processes wasinvestigated by Ogueke and Anyanwu (2009). The studyshowed that low condenser pressure increases the adsorptionprocess while the evaporator pressure should be high to
increase the adsorption process. They found also the optimumvalue of initial concentration of methanol was 0.21 kg kg!1 toobtain the best adsorbing of adsorbate (the maximum concen-tration was about 0.29 kg kg!1). The produced ice increasedfrom 0 kg per kg of adsorbent to about 0.4 kg.
Li and Wang (2003) studied theoretically and experi-mentally heat and mass transfer in an adsorbent bed fora flat plate solar adsorption ice-maker. Ten kg of methanoland 42 kg of activated carbon were used in a rectangularadsorbent bed of 1.5 m2 solar collector. The experimentalanalysis was done by constructing a device in lab and sim-ulating the solar radiation by means of quartz lamps. Theinvestigation showed that the numerical results from thetheoretical study were in agreement with the experimentalresults at SCOP of 0.125 and 0.132 and amounts of pro-duced ice were 8 and 7.8 kg for 30.24 and 29 MJ of incidentsolar radiation, respectively.
Chekirou et al. (2007) studied theoretically the heat andmass transfer in tubular adsorbent filled with activated car-bon AC-35 saturated with methanol. They showed thatSCOP was 0.13, 0.172 and 0.184 and the cooling effectwas 168.192, 213.661 and 229.286 kJ kg!1 (AC) for singleglazing, double glazing and TIM system, respectively. Onthe other hand, the experimental work of Critoph andTamainot-Telto (1997) showed that the double glazingcover enhanced the performance more than TIM and singleglazing covers. SCOP was 0.061, 0065 and 0.071 for singlecover, TIM and double cover systems, respectively.
Li et al. (2002) built a 1.5 m2 flat plate solar adsorptionice maker using activated carbon/methanol pair. Theresults showed that about 4–5 kg of ice are produced byreceiving about 14–16 MJ of radiation energy from quartzlamps that heated about 0.75 m2 of solar collector while 7–10 kg of ice are produced by 28–30 MJ of radiation energyon 1.5 m2 of the solar collector. Wang et al. (2000) used awater solar collector for heating an activated carbon/meth-anol adsorbent bed in a hybrid system to produce about10 kg of ice per day per 2-m2 of solar collector. The maxi-mum SCOP obtained from the experimental work wasabout 0.144.
This study aims to increase the amount of produced iceand SCOP by investigating the main configuration param-eters of the adsorption flat plate solar collector.
2. System and processes description
There is a single adsorbent bed in the intermittent solaradsorption cooling cycle. The adsorption system consists ofthree main parts: solar collector with adsorbent bed whereactivated carbon is placed, condenser and evaporator asshow in Fig. 1a. The operating cycle of the system has fourprocesses as shown in the Clapeyron diagram in Fig. 1b.The heating process (1–2) and the desorbing process (2–3) represent half the cycle while the cooling (3–4) andadsorption (4–1) processes represent the other half. Duringthe heating period, the adsorbent bed receives heat fromsolar energy that raises the temperature of the pair of
N.A.A. Qasem, M.A.I. El-Shaarawi / Solar Energy 98 (2013) 523–542 525
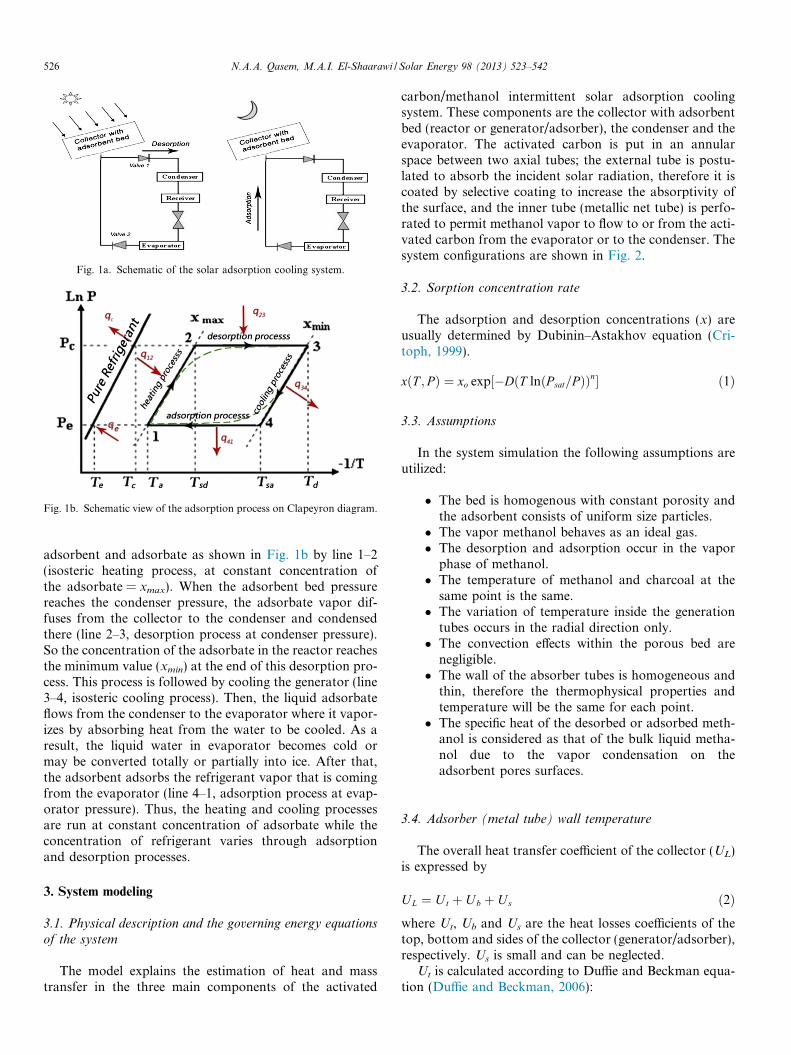
adsorbent and adsorbate as shown in Fig. 1b by line 1–2(isosteric heating process, at constant concentration ofthe adsorbate = xmax). When the adsorbent bed pressurereaches the condenser pressure, the adsorbate vapor dif-fuses from the collector to the condenser and condensedthere (line 2–3, desorption process at condenser pressure).So the concentration of the adsorbate in the reactor reachesthe minimum value (xmin) at the end of this desorption pro-cess. This process is followed by cooling the generator (line3–4, isosteric cooling process). Then, the liquid adsorbateflows from the condenser to the evaporator where it vapor-izes by absorbing heat from the water to be cooled. As aresult, the liquid water in evaporator becomes cold ormay be converted totally or partially into ice. After that,the adsorbent adsorbs the refrigerant vapor that is comingfrom the evaporator (line 4–1, adsorption process at evap-orator pressure). Thus, the heating and cooling processesare run at constant concentration of adsorbate while theconcentration of refrigerant varies through adsorptionand desorption processes.
3. System modeling
3.1. Physical description and the governing energy equationsof the system
The model explains the estimation of heat and masstransfer in the three main components of the activated
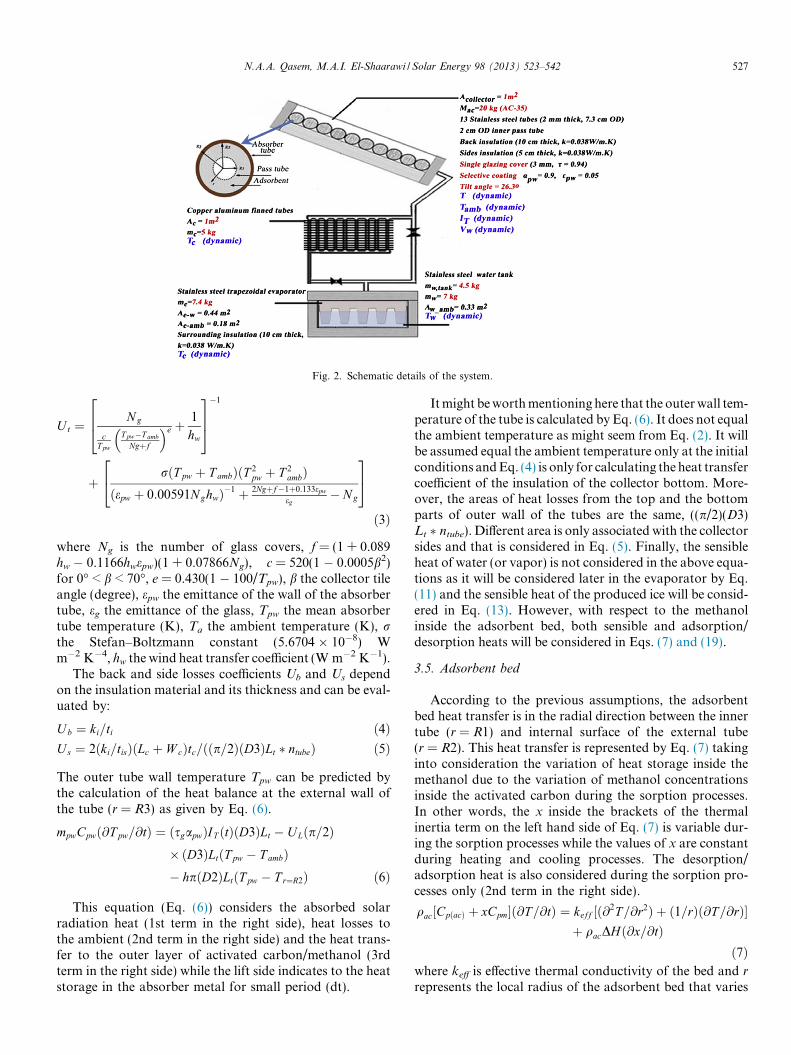
carbon/methanol intermittent solar adsorption coolingsystem. These components are the collector with adsorbentbed (reactor or generator/adsorber), the condenser and theevaporator. The activated carbon is put in an annularspace between two axial tubes; the external tube is postu-lated to absorb the incident solar radiation, therefore it iscoated by selective coating to increase the absorptivity ofthe surface, and the inner tube (metallic net tube) is perfo-rated to permit methanol vapor to flow to or from the acti-vated carbon from the evaporator or to the condenser. Thesystem configurations are shown in Fig. 2.
3.2. Sorption concentration rate
The adsorption and desorption concentrations (x) areusually determined by Dubinin–Astakhov equation (Cri-toph, 1999).
xðT ; PÞ ¼ xo exp½!DðT lnðP sat=PÞÞn& ð1Þ
3.3. Assumptions
In the system simulation the following assumptions areutilized:
' The bed is homogenous with constant porosity andthe adsorbent consists of uniform size particles.
' The vapor methanol behaves as an ideal gas.' The desorption and adsorption occur in the vapor
phase of methanol.' The temperature of methanol and charcoal at the
same point is the same.' The variation of temperature inside the generation
tubes occurs in the radial direction only.' The convection effects within the porous bed are
negligible.' The wall of the absorber tubes is homogeneous and
thin, therefore the thermophysical properties andtemperature will be the same for each point.
' The specific heat of the desorbed or adsorbed meth-anol is considered as that of the bulk liquid metha-nol due to the vapor condensation on theadsorbent pores surfaces.
3.4. Adsorber (metal tube) wall temperature
The overall heat transfer coefficient of the collector (UL)is expressed by
UL ¼ U t þ U b þ Us ð2Þ
where Ut, Ub and Us are the heat losses coefficients of thetop, bottom and sides of the collector (generator/adsorber),respectively. Us is small and can be neglected.
Ut is calculated according to Duffie and Beckman equa-tion (Duffie and Beckman, 2006):
Fig. 1a. Schematic of the solar adsorption cooling system.
Fig. 1b. Schematic view of the adsorption process on Clapeyron diagram.
526 N.A.A. Qasem, M.A.I. El-Shaarawi / Solar Energy 98 (2013) 523–542
U t ¼N g
cT pw
T pw!T ambNgþf
! "e þ1
hw
2
64
3
75
!1
þrðT pw þ T ambÞðT 2
pw þ T 2ambÞ
ðepw þ 0:00591NghwÞ!1 þ 2Ngþf!1þ0:133epw
eg! N g
2
4
3
5
ð3Þ
where Ng is the number of glass covers, f = (1 + 0.089hw ! 0.1166hwepw)(1 + 0.07866Ng), c = 520(1 ! 0.0005b2)for 0" < b < 70", e = 0.430(1 ! 100/Tpw), b the collector tileangle (degree), epw the emittance of the wall of the absorbertube, eg the emittance of the glass, Tpw the mean absorbertube temperature (K), Ta the ambient temperature (K), rthe Stefan–Boltzmann constant (5.6704 ) 10!8) Wm!2 K!4, hw the wind heat transfer coefficient (W m!2 K!1).
The back and side losses coefficients Ub and Us dependon the insulation material and its thickness and can be eval-uated by:
U b ¼ ki=ti ð4ÞU s ¼ 2ðki=tisÞðLc þ W cÞtc=ððp=2ÞðD3ÞLt * ntubeÞ ð5Þ
The outer tube wall temperature Tpw can be predicted bythe calculation of the heat balance at the external wall ofthe tube (r = R3) as given by Eq. (6).
mpwCpwð@T pw=@tÞ ¼ ðsgapwÞIT ðtÞðD3ÞLt ! ULðp=2Þ) ðD3ÞLtðT pw ! T ambÞ! hpðD2ÞLtðT pw ! T r¼R2Þ ð6Þ
This equation (Eq. (6)) considers the absorbed solarradiation heat (1st term in the right side), heat losses tothe ambient (2nd term in the right side) and the heat trans-fer to the outer layer of activated carbon/methanol (3rdterm in the right side) while the lift side indicates to the heatstorage in the absorber metal for small period (dt).
It might be worth mentioning here that the outer wall tem-perature of the tube is calculated by Eq. (6). It does not equalthe ambient temperature as might seem from Eq. (2). It willbe assumed equal the ambient temperature only at the initialconditions and Eq. (4) is only for calculating the heat transfercoefficient of the insulation of the collector bottom. More-over, the areas of heat losses from the top and the bottomparts of outer wall of the tubes are the same, ((p/2)(D3)Lt * ntube). Different area is only associated with the collectorsides and that is considered in Eq. (5). Finally, the sensibleheat of water (or vapor) is not considered in the above equa-tions as it will be considered later in the evaporator by Eq.(11) and the sensible heat of the produced ice will be consid-ered in Eq. (13). However, with respect to the methanolinside the adsorbent bed, both sensible and adsorption/desorption heats will be considered in Eqs. (7) and (19).
3.5. Adsorbent bed
According to the previous assumptions, the adsorbentbed heat transfer is in the radial direction between the innertube (r = R1) and internal surface of the external tube(r = R2). This heat transfer is represented by Eq. (7) takinginto consideration the variation of heat storage inside themethanol due to the variation of methanol concentrationsinside the activated carbon during the sorption processes.In other words, the x inside the brackets of the thermalinertia term on the left hand side of Eq. (7) is variable dur-ing the sorption processes while the values of x are constantduring heating and cooling processes. The desorption/adsorption heat is also considered during the sorption pro-cesses only (2nd term in the right side).
qac½CpðacÞ þ xCpm&ð@T =@tÞ ¼ keff ½ð@2T =@r2Þ þ ð1=rÞð@T=@rÞ&þ qacDHð@x=@tÞ
ð7Þwhere keff is effective thermal conductivity of the bed and rrepresents the local radius of the adsorbent bed that varies
Fig. 2. Schematic details of the system.
N.A.A. Qasem, M.A.I. El-Shaarawi / Solar Energy 98 (2013) 523–542 527
between the radius of the inner tube R1 and that of theinternal surface of the outer absorber tube R2.
The kinetics of sorption ð@x=@tÞ is assumed to be gov-erned by a linear driving force (LDF).
@x=@t ¼ ½ð15Do=ðrpÞ2Þexpð!Ea=RT Þ&ðxeq ! xÞ ð8Þ
where xeq is the equilibrium concentration at the correspond-ing pressure and temperature that is calculated by Dubinin-Astakhov equation Eq. (1) and x represents the actual con-centration. For activated carbon/methanol pair, the para-metric reference values of Eq. (8) were estimated by Passoset al. (1989).
3.6. Condenser and evaporator
The application of the first law of thermodynamics onthe condenser and the evaporator gives the following twoequations, respectively:
MconCpðconÞð@T con=@tÞ ¼ !LconMacð@x=@tÞ ! hconAconðT con ! T ambÞð9Þ
½MeCpe þ ðMm ! xMacÞCpm&ð@T e=@tÞ¼ he!wAe!wðT w ! T eÞ þ Ue!ambAe!ambðT amb ! T eÞ! LeMacð@x=@tÞ ð10Þ
The ice should be produced if Tw reaches below zero.The following equations are used to calculate the freezingwater temperature and ice mass Mice as well:
when Tw > 0 "C, no ice produced and the energy balanceequation is:MeCpwð@T w=@tÞ ¼ he!wAe!wðT e ! T wÞ
þ Ue!ambAw!ambðT amb ! T wÞ ð11Þ
when Tw = 0 "C:
Lsolð›Mice=›tÞ ¼ he!w;iceAe!wðTe ! TwÞþUw!ambAw!ambðTamb ! TwÞ ð12Þ
when Tw < 0 "C:
MwCpðiceÞð@T w=@tÞ ¼ he-iceAe-wðT e ! T wÞþ Uice-ambAw-ambðT amb ! T wÞ ð13Þ
where he-w is the heat transfer coefficient between evapora-tor and water; it is replaced by he-w,ice and he-ice during andafter forming ice respectively, Ue-amb the heat transfer coef-ficient between the evaporator and the atmosphere, Uw-amb
the heat transfer coefficient between the water and theatmosphere and Uice-amb the heat transfer coefficient be-tween the ice and the atmosphere.
3.7. Initial and boundary conditions
The variation of the climate conditions plays a basic rolefor the operation of any solar adsorption refrigeration sys-tem. Changes in climate conditions such as changes in theatmospheric temperature and solar insolation from hour tothe next hour and from day to the next day can affect on
the system performance. Such dynamic changes are takeninto consideration in the present investigation and the ini-tial conditions of the system for a new day are updatedfrom the end of the previous day conditions.
The accompanying initial and boundary conditions canbe given by:
For t = 0, T = Tpw = Tiw = Tamb (at starting time of thefirst day), x = xmax, P = Pe at the starting desorption;Tc = Tamb.
In fact at the start and during the desorption process, Tc
should be a few degree higher than the ambient tempera-ture so that the heat can be transferred from the refrigerantin the condenser to the cooling ambient.
At the starting adsorption; Mice = 0 kg.The boundary conditions utilized in solving Eq. (7) are
as follows:
ð@T=@rÞr¼R1 ¼ 0 ð14Þ! keff ð@T =@rÞ ¼ hðT pw ! T r¼R2Þ ð15Þ
3.8. Performance evaluation and the pertinent equations forsystem
The performance of the refrigeration system alone isdescribed by the coefficient of performance of its cycle(COP) without including the solar collector performance.On the other hand, both the solar coefficient of perfor-mance (SCOP) and the effective solar coefficient of perfor-mance (ESCOP) take the solar collector field performanceinto consideration. The overall solar coefficient of perfor-mance (SCOP) considers the total diurnal incident solarenergy as the input. The effective solar coefficient of perfor-mance (ESCOP) takes into consideration only the thermalsolar energy gained by the solar collector during the heat-ing and desorption periods.
COP ¼ Qe=Qg ð16Þ
SCOP ¼ Qe
Z t¼sunset
t¼sunriseAcIT ðtÞdt
#ð17Þ
ESCOP ¼ Qe
Z t¼end of generation process
t¼sunriseAcIT ðtÞdt
#ð18Þ
where Qg can be estimated from sensible and desorption heatof adsorbent bed during heating and desorption processes.
Qg ¼Z T sd
T a
MacCpðacÞ þMacxmaxCmðmÞ$ %
dT
þZ T d
T a
MmetalCmetalð ÞdT pwþZ T d
T sd
MacCpðacÞ þMacxCpðmÞ$ %
dT
þZ T d
T sd
MacDHdx ð19Þ
The evaporation heat (Qe) is obtained by
Qe ¼ LeMacDx ð20Þ
where
Dx ¼ xmax ! xmin ð21Þ
528 N.A.A. Qasem, M.A.I. El-Shaarawi / Solar Energy 98 (2013) 523–542

where IT(t) is the incident solar radiation energy rate perunit collector area t is the time and Ac is the collector area.Qe and Qg are the cooling effect and the collector genera-tion heat, respectively. The specific cooling power SCP(W kg!1) is also used in evaluating the performance onlywhen chilled water is produced. It is defined as the ratio be-tween the rate of refrigeration for all cycle time per unitmass of adsorbent (activated carbon):
SCP ¼ Qe=Mactc ð22Þ
where Mac is the mass of activated carbon (kg) and tc is thewhole cycle time.
4. Results and discussion
4.1. Validation the results
Under Dhahran climate conditions on 10–11 May 2011,the system is simulated to compare its performance resultswith the corresponding experimental investigation resultsof Medini et al. (1991) in Tunisia, as given in Table 1. Acti-vated carbon (AC-35) has been used in the two cases. Thepresent results are obtained for a system consisting of0.8 m2 single glass cover collector (with 10 stainless steeltubes, 1.93 cm adsorbent thickness and 8 cm outer adsor-ber diameter), air condenser (copper aluminum finnedtubes: Ac = 1 m2) and stainless steel trapezoidal evaporator(7.5 kg) as well as stainless steel water tank (4.2 kg). Table 1presents the important results of the two cases to be com-pared such as solar coefficient of performance (SCOP),amount of methanol desorbed and condensed (mm(d)),amount of produced ice (Mice), maximum desorption tem-perature (Td), minimum adsorption temperature (Ta), min-imum evaporator temperature (Te), maximum condensertemperature during desorption process (Tc), average atmo-spheric temperature during all cycle time (Tamb) and totalincident solar radiation on the collector (IT). The adsorbentbed parameter values such as temperature are consideredthe average temperature of the all radial points of theadsorbent bed from the outer surface (internal surface ofouter tube) to the inner surface of the bed (the external sur-face of the inner tube) while the system pressure can bemeasured between the collector and the condenser duringdesorption time and between the collector and the evapora-tor at adsorption process. Amount of methanol desorbedcould be estimated from graded vessel put below the con-denser to collect condensed amount of methanol beforepassing to the evaporator. The values of the experimentalinvestigation by Hassan et al. (2011) presented in Table 1
are the maximum and minimum values at terminals of pro-cesses. So, the dynamic parameters are needed for the sim-ulation. What we did is choosing the day when themaximum and minimum values of parameters in Dhahranare close to those of Medini’s investigation for the sake ofcomparison only. However, the simulation includes theactual hourly change in the values of the parameters.Another reason is that some minor parameters as windspeed was not mentioned in Medini’s paper.
At the same incident solar radiation (IT), collector area(Ac) and amount of activated carbon (Mac) as the experi-mental prototype study, the first simulation (present (a),Table 1) shows Td is higher than that of Medini prototypeby about 23 "C because the 35 "C of the ambient tempera-ture in Dhahran is much higher than the 16 "C of Tunisiaat the same time of the year. Consequently, the smaller dif-ference between the absorber and the ambient temperaturesdecreases heat losses from the collector. Secondly, the lar-ger condenser temperature (Tc(max) = 42.5 "C) delays thedesorption process. For the same reasons, the methanoldesorbed amount (mm(d)) is less (2.06 kg instead of2.5 kg). Some of this condensed amount cannot beadsorbed during the night due to the large adsorption tem-perature (Ta = 34 "C) which impacts negatively on the sys-tem performance (as Mice = 1 kg and SCOP = 0.1). For thesame IT, Tamb and Tc as the experimental values, in thepresent simulation results (present (b), Table 1) showsexcellent agreement with the experimental performanceresults (as SCOP, Mice and mm(d)) and approximately sim-ilar parameters (as Te, Td and Ta) were obtained. Accord-ingly, the modeling code is validated.
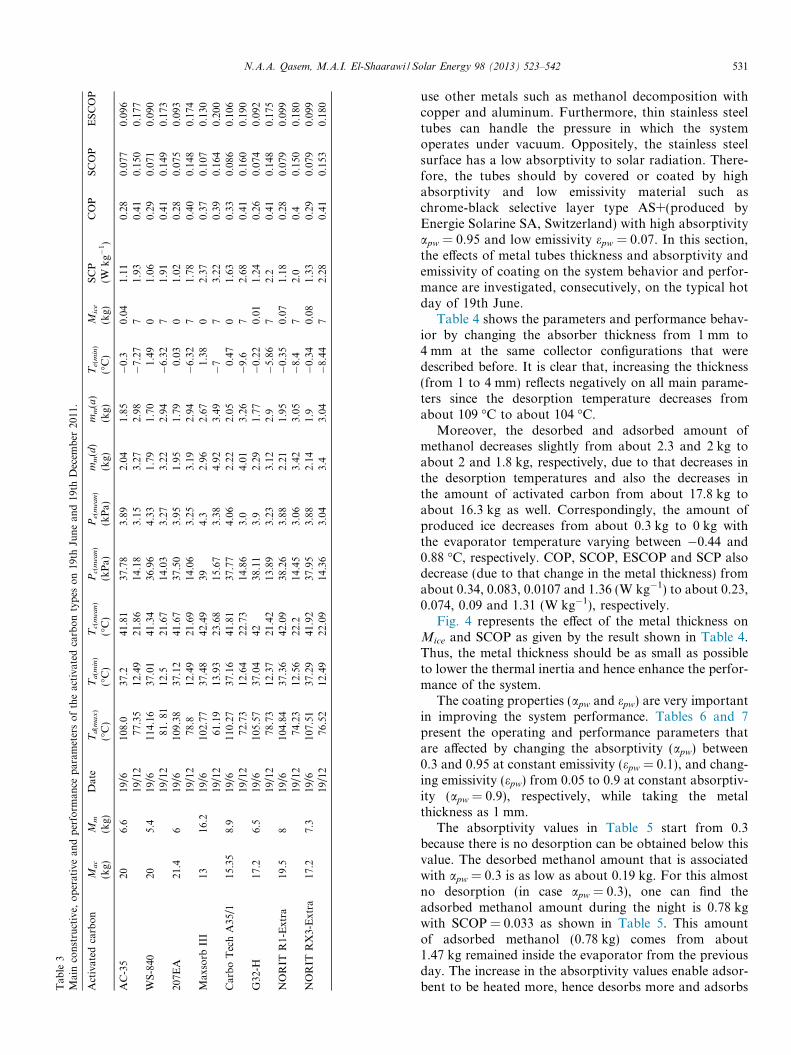
4.2. Activated carbon type
Dubinin–Astakhov equation (Eq. (1)) shows that thesorption ability of an activated carbon depends on somephysical parameters as: limited adsorption capacity (xo),Dubinin–Astakhov constants (D and n) and other operativeparameters as T and P. Among many types of activated car-bon produced by some global companies, the best knowneight types of activated carbon are selected in this investiga-tion. Some of them were successfully examined with metha-nol as AC-35 by Medini et al. (1991), Anyanwu and Ezekwe(2003), Leite et al. (2004, 2007), and WS-480 and 207EA byZhao et al. (2012a,b). The thermal and sorption characteris-tics of some others were recently examined experimentally(as xo, D, n, density (q), specific heat capacity (C)) with onlysome limited thermodynamic analysis as: Maxsorb III by El-Sharkawy et al. (2009); Carbo Tech A35/1, G32-H, NORIT
Table 1Comparsion between present simulation results with Medini et al. (1991) experimental results.
Study Td ("C) Ta ("C) Tc(max) ("C) Te(min) ("C) Tamb(mean) ("C) IT (MJ) Ac (m2) Mac (kg) mm(d) (kg) Mice (kg) SCOP
Medini (1991), Tunisia 90 13 30 !2 16 20 0.8 15 2.5 4.2 0.15Present (a), Dhahran 113.5 34 42.5 !1 35 20 0.8 15 2.06 1 0.10Present (b) 91 15 30 !1.7 16 20 0.8 15 2.6 4.5 0.153
N.A.A. Qasem, M.A.I. El-Shaarawi / Solar Energy 98 (2013) 523–542 529
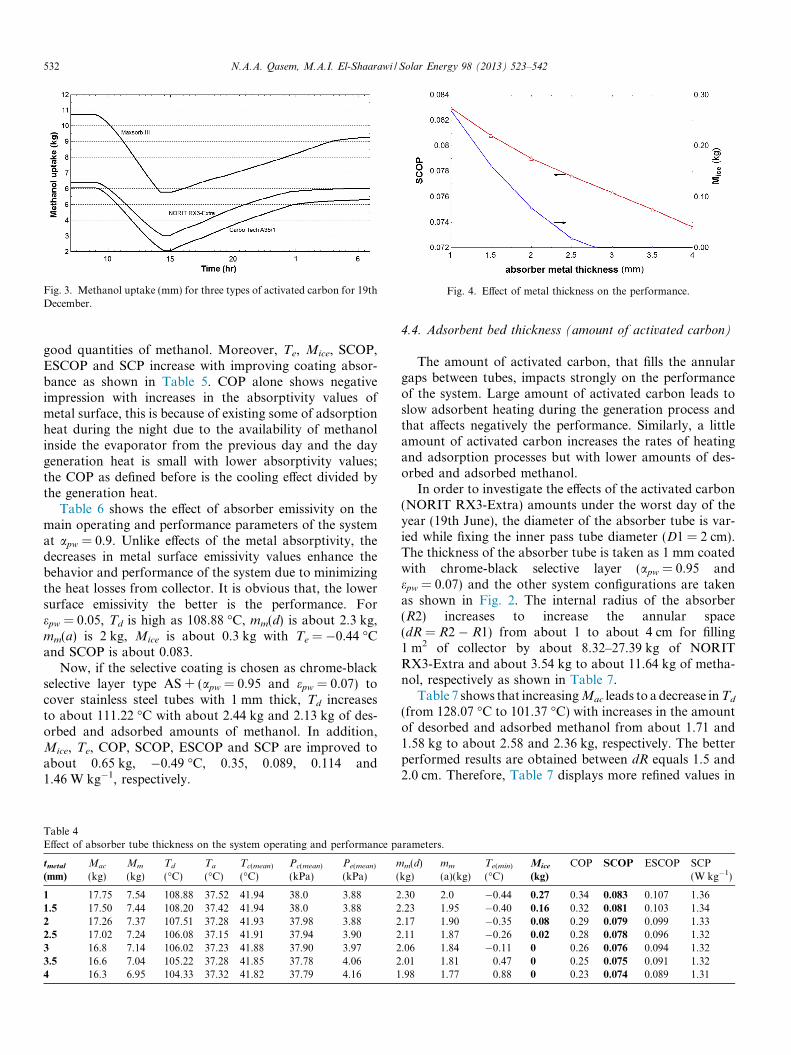
R1-Extra and NORIT RX3-Extra by Henninger et al.(2012). Therefore, this is the first time to model MaxsorbIII, Carbo Tech A35/1, G32-H, NORIT R1-Extra andNORIT RX3-Extra with methanol under actual climate con-ditions. Table 2 shows the main properties of these activatedcarbon types. These eight types are examined in this sectionunder Dhahran actual conditions on the worst and best daysof 19th June and 19th December, respectively, to determinethe best type that can be selected as the adsorbent for theadsorption ice-maker.
For the same collector configuration as shown in Fig. 2with constant volume inside the annular space between thetubes (V = 0.0465 m3), the performance for different acti-vated carbon types is investigated as shown in Table 3.The main constructive and operative parameters of the sys-tem are as: amount of activated carbon that fills the annu-lar space (Mac), the corresponding amount of methanol foreach type (Mm), maximum desorption temperature (Td),minimum adsorption temperature (Ta), mean condensertemperature (Tc), mean condenser pressure (Pc), processor minimum evaporator pressure if solidification processis not obtained (Pe), amount of desorbed methanol duringthe desorption process (mm(d)) and amount of adsorbedmethanol during adsorption process (mm(a)). On the otherhand, the evaporator temperature (Te) and amount of iceproduced (Mice) with the performance coefficients (COP,SCOP, ESCOP, SCP) are considered as the performanceparameters of the system.
Table 3 shows the overall maximum amount of acti-vated carbon is 21.4 kg for 207EA and the overall mini-mum amount of methanol (5.4 kg) for W-840 whereasMaxsorb III has the overall minimum amount of activatedcarbon with the overall maximum amount of methanol as13 kg and 16.2 kg, respectively. Because of this large capac-ity of Maxsorb III for methanol and lower mass of adsor-bent, Maxsorb III has the overall lowest maximumdesorption temperatures as: 102.77 "C and 61.19 "C forthe hot and the cold days, respectively, and it also hasthe best desorbed and adsorbed methanol amounts duringboth the hot and the cold days as shown in Table 3. Other-wise, the overall highest maximum desorption tempera-tures in the hot and the cold days are 114.16 "C and78.8 "C, respectively, and are obtained by WS-840 thathas the overall lowest methanol capacity. The other operat-ing parameters (as Ta, Tc, Pe, Pc) have values close to eachother for all the activated carbon types.
For the hot day, Te does not go below 0 "C for WS-840,207EA, Maxsorb III and Carbo Tech A35/1 types while theother types can produce a little amount of ice with someadvantages for NORIT RX3-Extra, NORIT R1-Extraand AC-35, respectively.
The cold days show good conditions that enable alltypes to solidify all amount of water (7 kg). However,the evaporator temperatures show the best performancefor Carbo Tech A35/1 type with Te = !9.6 "C followedby NORIT RX3-Extra and NORIT R1-Extra types withTe = !8.44 "C and Te = !8.4 "C, respectively. MaxsorbIII has the best COP, SCOP, ESCOP and SCP followedby Carbo Tech A35/1 and then NORIT RX3-Extra.However, the cooling effect that goes to water is lowerfor Maxsorb III. To illustrate that, as we know, the cool-ing effect is divided into components: the main componentgoes to cool the water, a second component of this heat islost to atmosphere and other components cool theevaporator and water tank metals as well as the methanolinside the evaporator. For example, according to weatherconditions, the amount of methanol inside Maxsorb III inthe morning of 19th December is 10.7 kg out of 16.2 kg asshown in Fig. 3. That means there is about 5.5 kg ofmethanol remained inside the evaporator from previousday and then that increases to about 10.4 kg afterdesorption process; the increases in such amount decreasethe amount of cooling heat that cools and freezes thewater. Consequently, the coefficients of performanceappear higher while the amount of produced ice is lower(as the hot day) or the evaporator temperature is higherif the produced ice amounts are the same (as the coldday). On the other hand, about 2.5 and 0.9 kg ofmethanol remained in the evaporator from previous dayfor Carbo Tech A35/1 and NORIT RX3-Extra,respectively.
The conclusion is that the best type that can be used forcold days is Carbo Tech A35/1 followed by NORIT RX3-Extra while NORIT RX3-Extra and NORIT R1-Extrahave the best performance in hot days. Thus, the optimumperformance results that can be obtained during all yeardays is by use of NORIT RX3-Extra.
4.3. Absorber plate and absorber coating
The suitable material for the tubes of the absorber isstainless steel due to the issues that can be caused by
Table 2Characteristics of activated carbon types.
Activated carbon xo (kg kg!1) D (K!1) n q (kg m!3) C (kJ kg!1 K!1)
AC-35 0.33 5.02 * 10!7 2.15 430 0.92WS-840 0.269 9.08 * 10!6 1.781 420 0.93207EA 0.28 8.45 * 10!7 2.08 460 0.92Maxsorb III 1.24 4.022 * 10!6 2.0 281 0.93Carbo Tech A35/1 0.58 1.37 * 10!5 1.76 330 0.95G32-H 0.38 1.94 * 10!8 2.59 370 0.95NORIT R1-Extra 0.41 2.19 * 10!7 2.27 420 0.95NORIT RX3-Extra 0.425 9.6 * 10!7 2.06 370 0.95
530 N.A.A. Qasem, M.A.I. El-Shaarawi / Solar Energy 98 (2013) 523–542
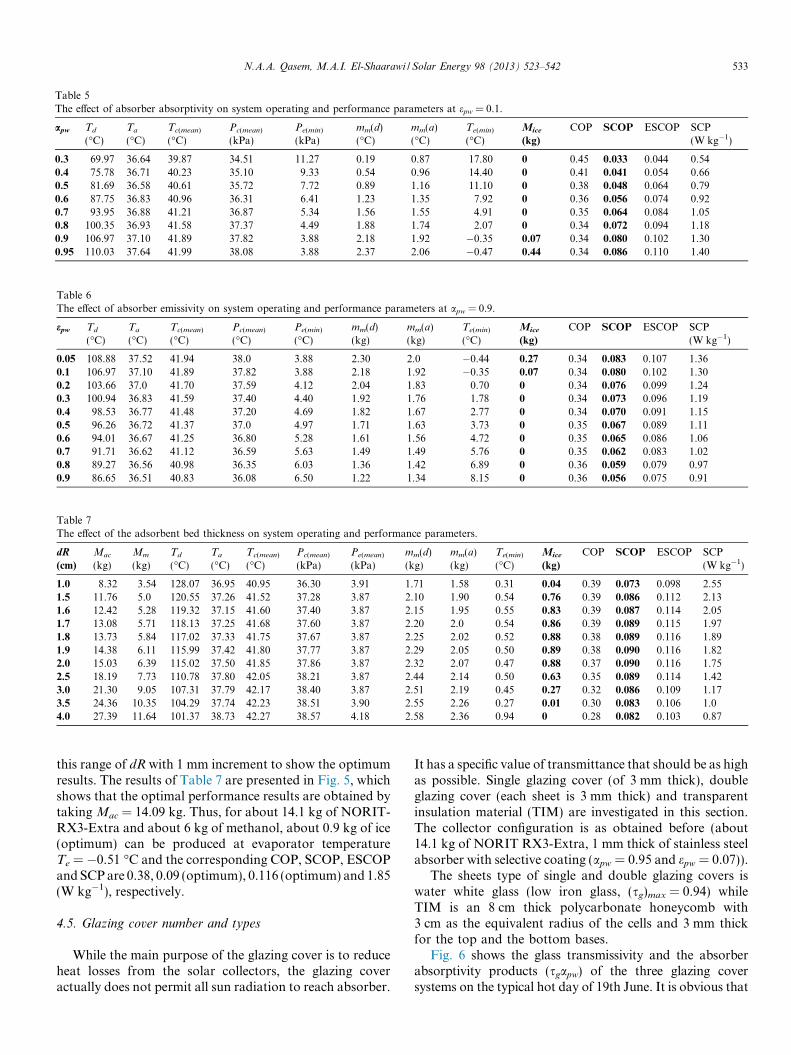
use other metals such as methanol decomposition withcopper and aluminum. Furthermore, thin stainless steeltubes can handle the pressure in which the systemoperates under vacuum. Oppositely, the stainless steelsurface has a low absorptivity to solar radiation. There-fore, the tubes should by covered or coated by highabsorptivity and low emissivity material such aschrome-black selective layer type AS+(produced byEnergie Solarine SA, Switzerland) with high absorptivityapw = 0.95 and low emissivity epw = 0.07. In this section,the effects of metal tubes thickness and absorptivity andemissivity of coating on the system behavior and perfor-mance are investigated, consecutively, on the typical hotday of 19th June.
Table 4 shows the parameters and performance behav-ior by changing the absorber thickness from 1 mm to4 mm at the same collector configurations that weredescribed before. It is clear that, increasing the thickness(from 1 to 4 mm) reflects negatively on all main parame-ters since the desorption temperature decreases fromabout 109 "C to about 104 "C.
Moreover, the desorbed and adsorbed amount ofmethanol decreases slightly from about 2.3 and 2 kg toabout 2 and 1.8 kg, respectively, due to that decreases inthe desorption temperatures and also the decreases inthe amount of activated carbon from about 17.8 kg toabout 16.3 kg as well. Correspondingly, the amount ofproduced ice decreases from about 0.3 kg to 0 kg withthe evaporator temperature varying between !0.44 and0.88 "C, respectively. COP, SCOP, ESCOP and SCP alsodecrease (due to that change in the metal thickness) fromabout 0.34, 0.083, 0.0107 and 1.36 (W kg!1) to about 0.23,0.074, 0.09 and 1.31 (W kg!1), respectively.
Fig. 4 represents the effect of the metal thickness onMice and SCOP as given by the result shown in Table 4.Thus, the metal thickness should be as small as possibleto lower the thermal inertia and hence enhance the perfor-mance of the system.
The coating properties (apw and epw) are very importantin improving the system performance. Tables 6 and 7present the operating and performance parameters thatare affected by changing the absorptivity (apw) between0.3 and 0.95 at constant emissivity (epw = 0.1), and chang-ing emissivity (epw) from 0.05 to 0.9 at constant absorptiv-ity (apw = 0.9), respectively, while taking the metalthickness as 1 mm.
The absorptivity values in Table 5 start from 0.3because there is no desorption can be obtained below thisvalue. The desorbed methanol amount that is associatedwith apw = 0.3 is as low as about 0.19 kg. For this almostno desorption (in case apw = 0.3), one can find theadsorbed methanol amount during the night is 0.78 kgwith SCOP = 0.033 as shown in Table 5. This amountof adsorbed methanol (0.78 kg) comes from about1.47 kg remained inside the evaporator from the previousday. The increase in the absorptivity values enable adsor-bent to be heated more, hence desorbs more and adsorbsT
able
3M
ain
con
stru
ctiv
e,o
per
ativ
ean
dp
erfo
rman
cep
aram
eter
so
fth
eac
tiva
ted
carb
on
typ
eso
n19
thJu
ne
and
19th
Dec
emb
er20
11.
Act
ivat
edca
rbo
nM
ac
(kg)
Mm
(kg)
Dat
eT
d(m
ax
)
("C
)T
a(m
in)
("C
)T
c(m
ean)
("C
)P
c(m
ean
)
(kP
a)P
e(m
ean)
(kP
a)m
m(d
)(k
g)m
m(a
)(k
g)T
e(m
in)
("C
)M
ice
(kg)
SC
P(W
kg!
1)
CO
PS
CO
PE
SC
OP
AC
-35
206.
619
/610
8.0
37.2
41.8
137
.78
3.89
2.04
1.85
!0.
30.
041.
110.
280.
077
0.09
619
/12
77.3
512
.49
21.8
614
.18
3.15
3.27
2.98
!7.
277
1.93
0.41
0.15
00.
177
WS
-840
205.
419
/611
4.16
37.0
141
.34
36.9
64.
331.
791.
701.
490
1.06
0.29
0.07
10.
090
19/1
281
.81
12.5
21.6
714
.03
3.27
3.22
2.94
!6.
327
1.91
0.41
0.14
90.
173
207E
A21
.46
19/6
109.
3837
.12
41.6
737
.50
3.95
1.95
1.79
0.03
01.
020.
280.
075
0.09
319
/12
78.8
12.4
921
.69
14.0
63.
253.
192.
94!
6.32
71.
780.
400.
148
0.17
4M
axso
rbII
I13
16.2
19/6
102.
7737
.48
42.4
939
4.3
2.96
2.67
1.38
02.
370.
370.
107
0.13
019
/12
61.1
913
.93
23.6
815
.67
3.38
4.92
3.49
!7
73.
220.
390.
164
0.20
0C
arb
oT
ech
A35
/115
.35
8.9
19/6
110.
2737
.16
41.8
137
.77
4.06
2.22
2.05
0.47
01.
630.
330.
086
0.10
619
/12
72.7
312
.64
22.7
314
.86
3.0
4.01
3.26
!9.
67
2.68
0.41
0.16
00.
190
G32
-H17
.26.
519
/610
5.57
37.0
442
38.1
13.
92.
291.
77!
0.22
0.01
1.24
0.26
0.07
40.
092
19/1
278
.73
12.3
721
.42
13.8
93.
233.
122.
9!
5.86
72.
20.
410.
148
0.17
5N
OR
ITR
1-E
xtra
19.5
819
/610
4.84
37.3
642
.09
38.2
63.
882.
211.
95!
0.35
0.07
1.18
0.28
0.07
90.
099
19/1
274
.23
12.5
622
.214
.45
3.06
3.42
3.05
!8.
47
2.0
0.4
0.15
00.
180
NO
RIT
RX
3-E
xtra
17.2
7.3
19/6
107.
5137
.29
41.9
237
.95
3.88
2.14
1.9
!0.
340.
081.
330.
290.
079
0.09
919
/12
76.5
212
.49
22.0
914
.36
3.04
3.4
3.04
!8.
447
2.28
0.41
0.15
30.
180
N.A.A. Qasem, M.A.I. El-Shaarawi / Solar Energy 98 (2013) 523–542 531
good quantities of methanol. Moreover, Te, Mice, SCOP,ESCOP and SCP increase with improving coating absor-bance as shown in Table 5. COP alone shows negativeimpression with increases in the absorptivity values ofmetal surface, this is because of existing some of adsorptionheat during the night due to the availability of methanolinside the evaporator from the previous day and the daygeneration heat is small with lower absorptivity values;the COP as defined before is the cooling effect divided bythe generation heat.
Table 6 shows the effect of absorber emissivity on themain operating and performance parameters of the systemat apw = 0.9. Unlike effects of the metal absorptivity, thedecreases in metal surface emissivity values enhance thebehavior and performance of the system due to minimizingthe heat losses from collector. It is obvious that, the lowersurface emissivity the better is the performance. Forepw = 0.05, Td is high as 108.88 "C, mm(d) is about 2.3 kg,mm(a) is 2 kg, Mice is about 0.3 kg with Te = !0.44 "Cand SCOP is about 0.083.
Now, if the selective coating is chosen as chrome-blackselective layer type AS + (apw = 0.95 and epw = 0.07) tocover stainless steel tubes with 1 mm thick, Td increasesto about 111.22 "C with about 2.44 kg and 2.13 kg of des-orbed and adsorbed amounts of methanol. In addition,Mice, Te, COP, SCOP, ESCOP and SCP are improved toabout 0.65 kg, !0.49 "C, 0.35, 0.089, 0.114 and1.46 W kg!1, respectively.
4.4. Adsorbent bed thickness (amount of activated carbon)
The amount of activated carbon, that fills the annulargaps between tubes, impacts strongly on the performanceof the system. Large amount of activated carbon leads toslow adsorbent heating during the generation process andthat affects negatively the performance. Similarly, a littleamount of activated carbon increases the rates of heatingand adsorption processes but with lower amounts of des-orbed and adsorbed methanol.
In order to investigate the effects of the activated carbon(NORIT RX3-Extra) amounts under the worst day of theyear (19th June), the diameter of the absorber tube is var-ied while fixing the inner pass tube diameter (D1 = 2 cm).The thickness of the absorber tube is taken as 1 mm coatedwith chrome-black selective layer (apw = 0.95 andepw = 0.07) and the other system configurations are takenas shown in Fig. 2. The internal radius of the absorber(R2) increases to increase the annular space(dR = R2 ! R1) from about 1 to about 4 cm for filling1 m2 of collector by about 8.32–27.39 kg of NORITRX3-Extra and about 3.54 kg to about 11.64 kg of metha-nol, respectively as shown in Table 7.
Table 7 shows that increasing Mac leads to a decrease in Td
(from 128.07 "C to 101.37 "C) with increases in the amountof desorbed and adsorbed methanol from about 1.71 and1.58 kg to about 2.58 and 2.36 kg, respectively. The betterperformed results are obtained between dR equals 1.5 and2.0 cm. Therefore, Table 7 displays more refined values in
Fig. 3. Methanol uptake (mm) for three types of activated carbon for 19thDecember.
Table 4Effect of absorber tube thickness on the system operating and performance parameters.
tmetal
(mm)Mac
(kg)Mm
(kg)Td
("C)Ta
("C)Tc(mean)
("C)Pc(mean)
(kPa)Pe(mean)
(kPa)mm(d)(kg)
mm
(a)(kg)Te(min)
("C)Mice
(kg)COP SCOP ESCOP SCP
(W kg!1)
1 17.75 7.54 108.88 37.52 41.94 38.0 3.88 2.30 2.0 !0.44 0.27 0.34 0.083 0.107 1.361.5 17.50 7.44 108.20 37.42 41.94 38.0 3.88 2.23 1.95 !0.40 0.16 0.32 0.081 0.103 1.342 17.26 7.37 107.51 37.28 41.93 37.98 3.88 2.17 1.90 !0.35 0.08 0.29 0.079 0.099 1.332.5 17.02 7.24 106.08 37.15 41.91 37.94 3.90 2.11 1.87 !0.26 0.02 0.28 0.078 0.096 1.323 16.8 7.14 106.02 37.23 41.88 37.90 3.97 2.06 1.84 !0.11 0 0.26 0.076 0.094 1.323.5 16.6 7.04 105.22 37.28 41.85 37.78 4.06 2.01 1.81 0.47 0 0.25 0.075 0.091 1.324 16.3 6.95 104.33 37.32 41.82 37.79 4.16 1.98 1.77 0.88 0 0.23 0.074 0.089 1.31
Fig. 4. Effect of metal thickness on the performance.
532 N.A.A. Qasem, M.A.I. El-Shaarawi / Solar Energy 98 (2013) 523–542
this range of dR with 1 mm increment to show the optimumresults. The results of Table 7 are presented in Fig. 5, whichshows that the optimal performance results are obtained bytaking Mac = 14.09 kg. Thus, for about 14.1 kg of NORIT-RX3-Extra and about 6 kg of methanol, about 0.9 kg of ice(optimum) can be produced at evaporator temperatureTe = !0.51 "C and the corresponding COP, SCOP, ESCOPand SCP are 0.38, 0.09 (optimum), 0.116 (optimum) and 1.85(W kg!1), respectively.
4.5. Glazing cover number and types
While the main purpose of the glazing cover is to reduceheat losses from the solar collectors, the glazing coveractually does not permit all sun radiation to reach absorber.
It has a specific value of transmittance that should be as highas possible. Single glazing cover (of 3 mm thick), doubleglazing cover (each sheet is 3 mm thick) and transparentinsulation material (TIM) are investigated in this section.The collector configuration is as obtained before (about14.1 kg of NORIT RX3-Extra, 1 mm thick of stainless steelabsorber with selective coating (apw = 0.95 and epw = 0.07)).
The sheets type of single and double glazing covers iswater white glass (low iron glass, (sg)max = 0.94) whileTIM is an 8 cm thick polycarbonate honeycomb with3 cm as the equivalent radius of the cells and 3 mm thickfor the top and the bottom bases.
Fig. 6 shows the glass transmissivity and the absorberabsorptivity products (sgapw) of the three glazing coversystems on the typical hot day of 19th June. It is obvious that
Table 5The effect of absorber absorptivity on system operating and performance parameters at epw = 0.1.
apw Td
("C)Ta
("C)Tc(mean)
("C)Pc(mean)
(kPa)Pe(min)
(kPa)mm(d)("C)
mm(a)("C)
Te(min)
("C)Mice
(kg)COP SCOP ESCOP SCP
(W kg!1)
0.3 69.97 36.64 39.87 34.51 11.27 0.19 0.87 17.80 0 0.45 0.033 0.044 0.540.4 75.78 36.71 40.23 35.10 9.33 0.54 0.96 14.40 0 0.41 0.041 0.054 0.660.5 81.69 36.58 40.61 35.72 7.72 0.89 1.16 11.10 0 0.38 0.048 0.064 0.790.6 87.75 36.83 40.96 36.31 6.41 1.23 1.35 7.92 0 0.36 0.056 0.074 0.920.7 93.95 36.88 41.21 36.87 5.34 1.56 1.55 4.91 0 0.35 0.064 0.084 1.050.8 100.35 36.93 41.58 37.37 4.49 1.88 1.74 2.07 0 0.34 0.072 0.094 1.180.9 106.97 37.10 41.89 37.82 3.88 2.18 1.92 !0.35 0.07 0.34 0.080 0.102 1.300.95 110.03 37.64 41.99 38.08 3.88 2.37 2.06 !0.47 0.44 0.34 0.086 0.110 1.40
Table 6The effect of absorber emissivity on system operating and performance parameters at apw = 0.9.
epw Td
("C)Ta
("C)Tc(mean)
("C)Pc(mean)
("C)Pe(min)
("C)mm(d)(kg)
mm(a)(kg)
Te(min)
("C)Mice
(kg)COP SCOP ESCOP SCP
(W kg!1)
0.05 108.88 37.52 41.94 38.0 3.88 2.30 2.0 !0.44 0.27 0.34 0.083 0.107 1.360.1 106.97 37.10 41.89 37.82 3.88 2.18 1.92 !0.35 0.07 0.34 0.080 0.102 1.300.2 103.66 37.0 41.70 37.59 4.12 2.04 1.83 0.70 0 0.34 0.076 0.099 1.240.3 100.94 36.83 41.59 37.40 4.40 1.92 1.76 1.78 0 0.34 0.073 0.096 1.190.4 98.53 36.77 41.48 37.20 4.69 1.82 1.67 2.77 0 0.34 0.070 0.091 1.150.5 96.26 36.72 41.37 37.0 4.97 1.71 1.63 3.73 0 0.35 0.067 0.089 1.110.6 94.01 36.67 41.25 36.80 5.28 1.61 1.56 4.72 0 0.35 0.065 0.086 1.060.7 91.71 36.62 41.12 36.59 5.63 1.49 1.49 5.76 0 0.35 0.062 0.083 1.020.8 89.27 36.56 40.98 36.35 6.03 1.36 1.42 6.89 0 0.36 0.059 0.079 0.970.9 86.65 36.51 40.83 36.08 6.50 1.22 1.34 8.15 0 0.36 0.056 0.075 0.91
Table 7The effect of the adsorbent bed thickness on system operating and performance parameters.
dR(cm)
Mac
(kg)Mm
(kg)Td
("C)Ta
("C)Tc(mean)
("C)Pc(mean)
(kPa)Pe(mean)
(kPa)mm(d)(kg)
mm(a)(kg)
Te(min)
("C)Mice
(kg)COP SCOP ESCOP SCP
(W kg!1)
1.0 8.32 3.54 128.07 36.95 40.95 36.30 3.91 1.71 1.58 0.31 0.04 0.39 0.073 0.098 2.551.5 11.76 5.0 120.55 37.26 41.52 37.28 3.87 2.10 1.90 0.54 0.76 0.39 0.086 0.112 2.131.6 12.42 5.28 119.32 37.15 41.60 37.40 3.87 2.15 1.95 0.55 0.83 0.39 0.087 0.114 2.051.7 13.08 5.71 118.13 37.25 41.68 37.60 3.87 2.20 2.0 0.54 0.86 0.39 0.089 0.115 1.971.8 13.73 5.84 117.02 37.33 41.75 37.67 3.87 2.25 2.02 0.52 0.88 0.38 0.089 0.116 1.891.9 14.38 6.11 115.99 37.42 41.80 37.77 3.87 2.29 2.05 0.50 0.89 0.38 0.090 0.116 1.822.0 15.03 6.39 115.02 37.50 41.85 37.86 3.87 2.32 2.07 0.47 0.88 0.37 0.090 0.116 1.752.5 18.19 7.73 110.78 37.80 42.05 38.21 3.87 2.44 2.14 0.50 0.63 0.35 0.089 0.114 1.423.0 21.30 9.05 107.31 37.79 42.17 38.40 3.87 2.51 2.19 0.45 0.27 0.32 0.086 0.109 1.173.5 24.36 10.35 104.29 37.74 42.23 38.51 3.90 2.55 2.26 0.27 0.01 0.30 0.083 0.106 1.04.0 27.39 11.64 101.37 38.73 42.27 38.57 4.18 2.58 2.36 0.94 0 0.28 0.082 0.103 0.87
N.A.A. Qasem, M.A.I. El-Shaarawi / Solar Energy 98 (2013) 523–542 533

the single cover system has the higher value ((sgapw)-
max = 0.86) and the second high value is for double glazing sys-tem ((sgapw)max = 0.786) while the TIM has the lowest value((sgapw)max = 0.646). Correspondingly, TIM system absorbsa less radiation whereas the single cover system canabsorb the best amount of solar radiation. However, theadvantage of TIM is ability to minimize the heat losses.TIM has the lowest values of collector heat loss coefficient(UL = 1.7–2.6 W m!2 K!1) compared to the singlecover (UL = 2.8–4.6 W m!2 K!1) and the double cover
(UL = 1.8–3.75 W m!2 K!1) glazing systems during heatingand desorption processes (generation time), as shown inFig. 7.
For these reasonable values of (sgapw) and UL, the maxi-mum temperature of adsorbent (127. 91 "C) can be obtainedby double glazing cover system while TIM and single glaz-ing cover systems have closed Td values such as 118.84and 116.41 "C, respectively, as shown in Fig. 8 and Table 8.For these generation temperatures, the desorbed methanol ishigher by double glazing system (mm(d) = 2.76 kg) whereasmm(d) for single cover and TIM systems are 2.27 and2.15 kg, respectively, as shown in Fig 9 and Table 8. Fur-thermore, adsorbed methanol amount mm(a) values indicatesome advantages for the double gazing system (2.52 kg) fol-lowed by TIM (2.13 kg) and then the single cover system(2.04 kg), respectively. The corresponding amounts of theproduced ice are about 2.41, 2.01 and 0.88 kg for the doubleglazing system, TIM and single glazing system, respectively,as shown in Fig. 9 and Table 8.
Table 8 shows the main operating and performanceparameters, the main parameters values confirm that thedouble glazing system is the best type followed by TIMand then single glazing system with SCOP equals 0.112,0.094 and 0.089, respectively.
Fig. 5. The effect of the activated carbon NORIT RX3-Exta amount(Mac) on the performance.
Fig. 6. Transmissivity absorptivity product (sgapw) of the three glazingcover systems.
Fig. 7. Overall collector heat loss coefficient (UL) during heat generationtime of the three glazing cover systems.
Table 8Effect of glazing cover systems on operating and performance parameters.
Parameters Single cover Double cover TIM cover
Td ("C) 116.41 127.91 118.84Ta ("C) 37.6 37.65 37.11Tc(mean) ("C) 41.78 42.12 42.07Te(min) ("C) !0.51 !1.16 !0.98Pc(mean) (kPa) 37.7 38.33 38.2Pe(mean) (kPa) 3.87 3.79 3.82mm(d) (kg) 2.27 2.76 2.15mm(a) (kg) 2.04 2.52 2.13Mice (kg) 0.88 2.41 2.01COP 0.38 0.40 0.41SCOP 0.089 0.112 0.094ESCOP 0.116 0.136 0.120SCP (W kg!1) 1.85 2.31 1.93
Fig. 8. Adsorbent (T) and evaporator (Te) temperatures of the threeglazing cover systems.
534 N.A.A. Qasem, M.A.I. El-Shaarawi / Solar Energy 98 (2013) 523–542
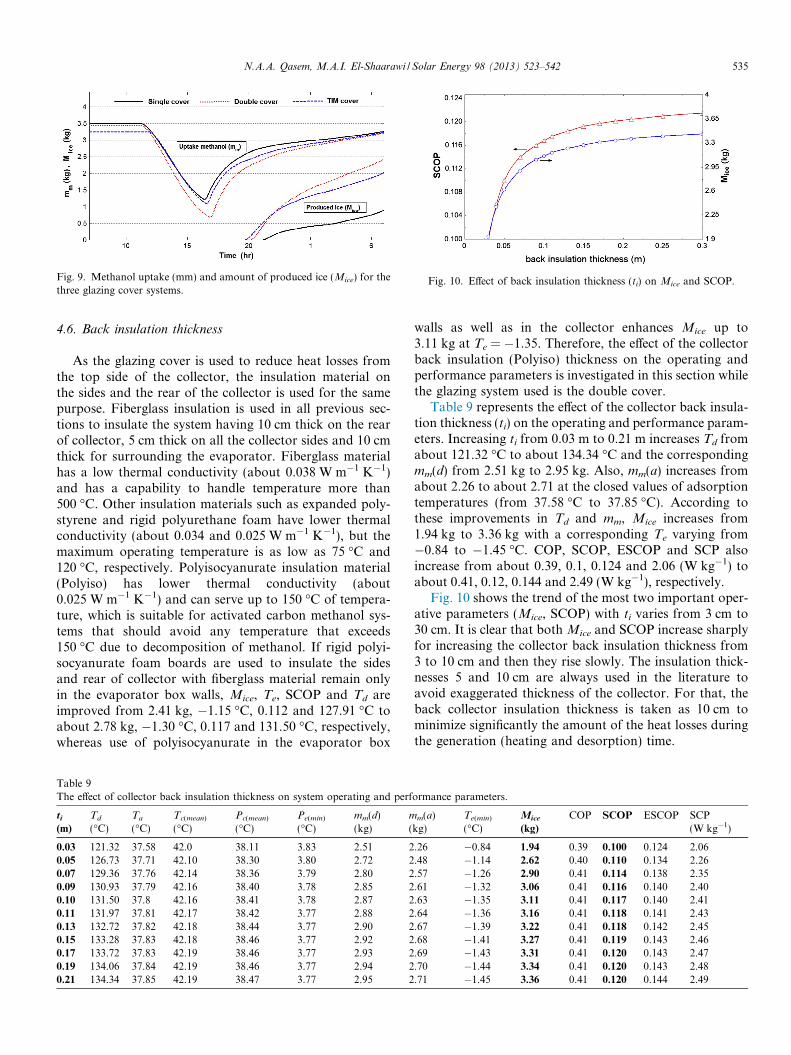
4.6. Back insulation thickness
As the glazing cover is used to reduce heat losses fromthe top side of the collector, the insulation material onthe sides and the rear of the collector is used for the samepurpose. Fiberglass insulation is used in all previous sec-tions to insulate the system having 10 cm thick on the rearof collector, 5 cm thick on all the collector sides and 10 cmthick for surrounding the evaporator. Fiberglass materialhas a low thermal conductivity (about 0.038 W m!1 K!1)and has a capability to handle temperature more than500 "C. Other insulation materials such as expanded poly-styrene and rigid polyurethane foam have lower thermalconductivity (about 0.034 and 0.025 W m!1 K!1), but themaximum operating temperature is as low as 75 "C and120 "C, respectively. Polyisocyanurate insulation material(Polyiso) has lower thermal conductivity (about0.025 W m!1 K!1) and can serve up to 150 "C of tempera-ture, which is suitable for activated carbon methanol sys-tems that should avoid any temperature that exceeds150 "C due to decomposition of methanol. If rigid polyi-socyanurate foam boards are used to insulate the sidesand rear of collector with fiberglass material remain onlyin the evaporator box walls, Mice, Te, SCOP and Td areimproved from 2.41 kg, !1.15 "C, 0.112 and 127.91 "C toabout 2.78 kg, !1.30 "C, 0.117 and 131.50 "C, respectively,whereas use of polyisocyanurate in the evaporator box
walls as well as in the collector enhances Mice up to3.11 kg at Te = !1.35. Therefore, the effect of the collectorback insulation (Polyiso) thickness on the operating andperformance parameters is investigated in this section whilethe glazing system used is the double cover.
Table 9 represents the effect of the collector back insula-tion thickness (ti) on the operating and performance param-eters. Increasing ti from 0.03 m to 0.21 m increases Td fromabout 121.32 "C to about 134.34 "C and the correspondingmm(d) from 2.51 kg to 2.95 kg. Also, mm(a) increases fromabout 2.26 to about 2.71 at the closed values of adsorptiontemperatures (from 37.58 "C to 37.85 "C). According tothese improvements in Td and mm, Mice increases from1.94 kg to 3.36 kg with a corresponding Te varying from!0.84 to !1.45 "C. COP, SCOP, ESCOP and SCP alsoincrease from about 0.39, 0.1, 0.124 and 2.06 (W kg!1) toabout 0.41, 0.12, 0.144 and 2.49 (W kg!1), respectively.
Fig. 10 shows the trend of the most two important oper-ative parameters (Mice, SCOP) with ti varies from 3 cm to30 cm. It is clear that both Mice and SCOP increase sharplyfor increasing the collector back insulation thickness from3 to 10 cm and then they rise slowly. The insulation thick-nesses 5 and 10 cm are always used in the literature toavoid exaggerated thickness of the collector. For that, theback collector insulation thickness is taken as 10 cm tominimize significantly the amount of the heat losses duringthe generation (heating and desorption) time.
Fig. 9. Methanol uptake (mm) and amount of produced ice (Mice) for thethree glazing cover systems.
Table 9The effect of collector back insulation thickness on system operating and performance parameters.
ti
(m)Td
("C)Ta
("C)Tc(mean)
("C)Pc(mean)
("C)Pe(min)
("C)mm(d)(kg)
mm(a)(kg)
Te(min)
("C)Mice
(kg)COP SCOP ESCOP SCP
(W kg!1)
0.03 121.32 37.58 42.0 38.11 3.83 2.51 2.26 !0.84 1.94 0.39 0.100 0.124 2.060.05 126.73 37.71 42.10 38.30 3.80 2.72 2.48 !1.14 2.62 0.40 0.110 0.134 2.260.07 129.36 37.76 42.14 38.36 3.79 2.80 2.57 !1.26 2.90 0.41 0.114 0.138 2.350.09 130.93 37.79 42.16 38.40 3.78 2.85 2.61 !1.32 3.06 0.41 0.116 0.140 2.400.10 131.50 37.8 42.16 38.41 3.78 2.87 2.63 !1.35 3.11 0.41 0.117 0.140 2.410.11 131.97 37.81 42.17 38.42 3.77 2.88 2.64 !1.36 3.16 0.41 0.118 0.141 2.430.13 132.72 37.82 42.18 38.44 3.77 2.90 2.67 !1.39 3.22 0.41 0.118 0.142 2.450.15 133.28 37.83 42.18 38.46 3.77 2.92 2.68 !1.41 3.27 0.41 0.119 0.143 2.460.17 133.72 37.83 42.19 38.46 3.77 2.93 2.69 !1.43 3.31 0.41 0.120 0.143 2.470.19 134.06 37.84 42.19 38.46 3.77 2.94 2.70 !1.44 3.34 0.41 0.120 0.143 2.480.21 134.34 37.85 42.19 38.47 3.77 2.95 2.71 !1.45 3.36 0.41 0.120 0.144 2.49
Fig. 10. Effect of back insulation thickness (ti) on Mice and SCOP.
N.A.A. Qasem, M.A.I. El-Shaarawi / Solar Energy 98 (2013) 523–542 535
4.7. Other improvements
In the previous sections, the solar collector tilt angle (b)is assumed constant at the same value of Dhahran latitude(about 26.3"). This tilt angle is suitable to absorb maximuminsolation all year days if the collector is fixed withoutmoving during all days because of the heavy weight ofthe collector (about 55 kg without frame). However, it is
more suitable to tilt the collector at least one time everymonth according to the tilt angle values that are proposedin Table 10 to minimize the solar incident angle below 6" atnoon (incident solar radiation will be almost perpendicularon the collector) for all months days.
The typical hot day on 19th June is selected to comparethe effect of the tilt angle of the collector (at 26.3" and 3.4")on the received solar radiation and the corresponding var-iation in IT, Td, Te, P, Mice and mm as shown in Figs. 11–13.
Fig. 11 shows that for collector tilt equals of 26.3" and3.4", respectively, the maximum incident solar radiationrises from about 915.3 W m!2 to about 979.1 W m!2 andthe total received radiation during a day from about25.13 MJ m!2 to about 27.98 MJ m!2. For this incrementin the solar radiation that is caused by the suitable averagemonthly tilt angle (of 3.4" for June), the desorption temper-ature increases to about 143.94 "C instead of 131.5 "C (inthe case of Tilt = 26.3"). Te also decreases from !1.45 "Cto !1.67 "C, as shown in Fig. 12and 1st and 2nd columnsof Table 11.
Fig. 13 shows the effect of collector tilt angle on mm, Pand Mice. Due to increasing the adsorbent temperature asshown in Fig. 12, the amounts of desorbed and adsorbedmethanol increase from about 2.87 kg and 2.63 kg to about3.1 and 2.9 kg as shown in Fig. 13 and Table 11. Therefore,the corresponding amount of produced ice increases fromabout 3.11 kg to about 3.96 kg at mean evaporator pres-sure equals 3.78 and 3.74 kPa for the collector tilts of26.3" and 3.4", respectively. COP, SCOP, ESCOP almostremain at the same values due to the increase in both thereceived heat and cooling effect while SCP increases byabout 10% as shown in 1st and 2nd columns of Table 11.
The sunset in Dhahran during the hot months such asApril, May, June, July and August is between 5 and 6 AM
Table 10Average monthly collector tilt angle for Dhahran.
Month 1 2 3 4 5 6 7 8 9 10 11 12
Tilt angle 47.4 39.5 28.9 17.1 7.7 3.4 5.3 13.0 24.3 36.1 45.4 49.4
Fig. 11. Effect of collector tilt angle on incident solar radiation oncollector on 19th June.
Fig. 12. Effect of collector tilt angle on adsorbent (T) and evaporator (Te)temperatures on 19th June.
Fig. 13. Effect of collector tilt angle on methanol uptake (Td), pressure (P)and amount of produced ice (Mice) on 19th June.
Table 11Effect of collector tilt angle and time offset on operating and performanceparameters.
Parameters Tilt = 26.3" Tilt = 3.4" Tilt = 3.4" with time offset
Td ("C) 131.5 143.94 143.4Ta ("C) 37.8 38.01 37.3Tc(mean) ("C) 42.16 42.02 42.05Te(min) ("C) !1.35 !1.67 !1.68Pc(mean) (kPa) 38.41 38.17 38.2Pe(mean) (kPa) 3.78 3.74 3.74mm(d) (kg) 2.87 3.1 3.17mm(a) (kg) 2.63 2.89 2.97Mice (kg) 3.11 3.96 4.25COP 0.41 0.41 0.42SCOP 0.117 0.116 0.119ESCOP 0.140 0.139 0.143SCP (W kg!1) 2.41 2.66 2.74
536 N.A.A. Qasem, M.A.I. El-Shaarawi / Solar Energy 98 (2013) 523–542

(solar time) and there is no actual heating during this periodas shown in Fig. 14 on the typical hot day (19th June). Thus,it is suitable to start the cycle at 6 AM (solar time) on the hotdays and leaving the time between sunrise and 6 AM as extratime for adsorption process to the pervious cycle to improvethe amount of produced ice and other performance parame-ters as shown in Fig. 15 and 3rd column in Table 11. In winterdays the heating starts at the sunrise time (usually after 6
AM) due to the increase in solar zenith angle, so there is noneed to shifting starting time.
Figs. 14 and 15 and Table 11 show that these are no sig-nificant changes in the operative parameters due to thistime offset. However the amount of ice produced increasesfrom 3.96 to 4.24 kg and SCOP is 0.119 instead of 0.116 (incase of no time offset).
The next section concerns with these improvements (col-lector tilt angle and starting time offset) and all the previousimprovements to show the enhanced behavior and the per-formance of the system.
4.8. Actual system behavior after the previous improving onthe main collector parameters under Dhahran climateconditions
After all the previous suggested improvements, the systemis simulated during ten consecutive days for both summerand winter to show its actual behavior and performance.The proposed collector (1 m2) consists of 17 stainless steeltubes (1 mm thick, about 59.3 mm outer diameter and 1 mlong) with 2 cm outer diameter of inner perforated pass steeltubes to handle the optimum mass of about 14.1 kg ofNORIR RX3-Extra; the corresponding methanol is about6 kg. The tubes are covered by chrome-black selective layer(apw = 0.95 and epw = 0.07); the double glazing system isselected. Rigid polyisocyanurate foam insulation is used onthe sides (5 cm thick) and back (10 cm thick) of the collectoras well as on the box that surrounds the evaporator (10 cmthick). The other system components data are shown inFig. 16. The solar collector tilt angles are taken correspond-ing to those values shown in Table 10; the offset starting oper-ating time is taken into consideration.
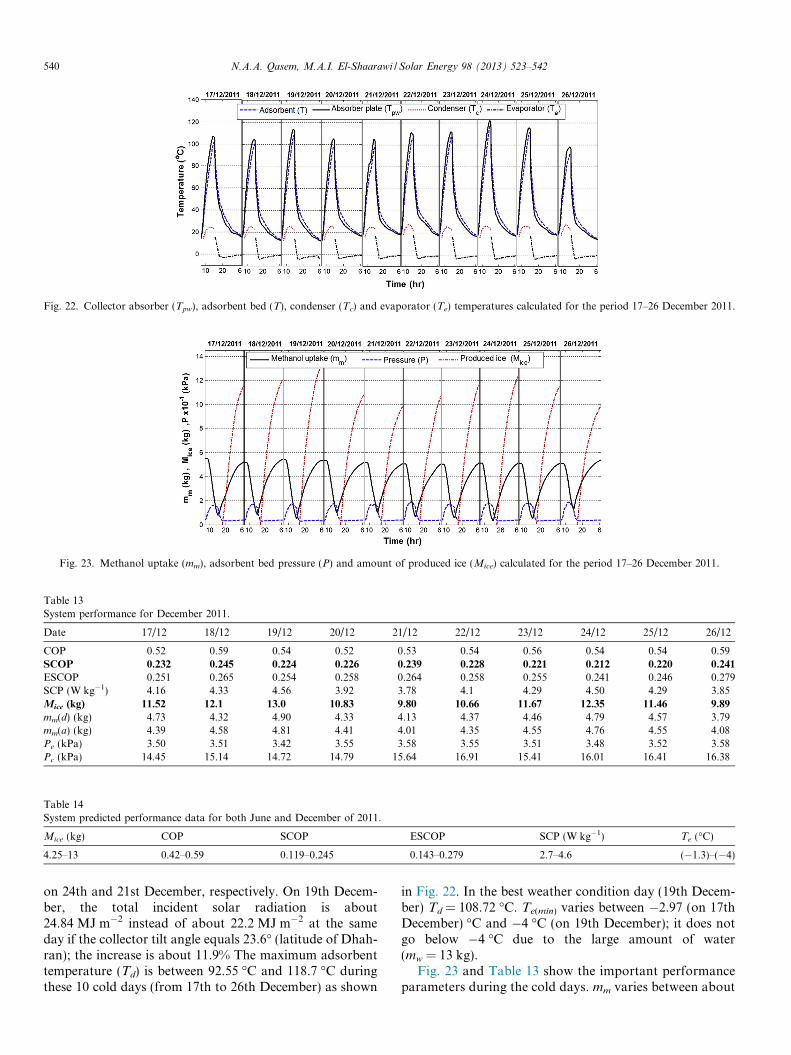
The system behavior and performance are estimatedunder Dhahran hot climate conditions during 10 consecu-tive days (from 14th to 23th of June 2011), as shown inFigs. 17–19 and Table. 12.
Fig. 14. Effect of time offset on adsorbent (T) and evaporator (Te)temperatures at Tilt = 3.4" on 19th June.
Fig. 15. Effect of time offset on methanol uptake (mm), pressure (P) andproduced ice (Mice) at Tilt = 3.4" on 19th June.
Fig. 16. System configuration details after the improvements.
N.A.A. Qasem, M.A.I. El-Shaarawi / Solar Energy 98 (2013) 523–542 537
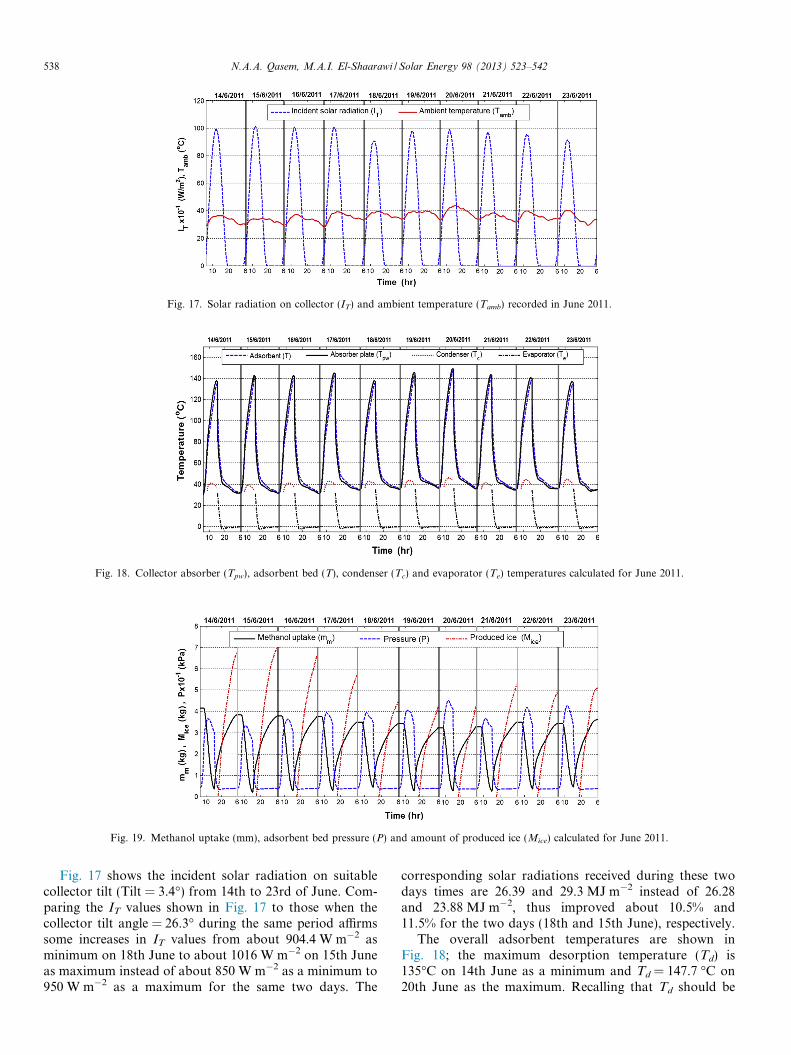
Fig. 17 shows the incident solar radiation on suitablecollector tilt (Tilt = 3.4") from 14th to 23rd of June. Com-paring the IT values shown in Fig. 17 to those when thecollector tilt angle = 26.3" during the same period affirmssome increases in IT values from about 904.4 W m!2 asminimum on 18th June to about 1016 W m!2 on 15th Juneas maximum instead of about 850 W m!2 as a minimum to950 W m!2 as a maximum for the same two days. The
corresponding solar radiations received during these twodays times are 26.39 and 29.3 MJ m!2 instead of 26.28and 23.88 MJ m!2, thus improved about 10.5% and11.5% for the two days (18th and 15th June), respectively.
The overall adsorbent temperatures are shown inFig. 18; the maximum desorption temperature (Td) is135"C on 14th June as a minimum and Td = 147.7 "C on20th June as the maximum. Recalling that Td should be
Fig. 17. Solar radiation on collector (IT) and ambient temperature (Tamb) recorded in June 2011.
Fig. 18. Collector absorber (Tpw), adsorbent bed (T), condenser (Tc) and evaporator (Te) temperatures calculated for June 2011.
Fig. 19. Methanol uptake (mm), adsorbent bed pressure (P) and amount of produced ice (Mice) calculated for June 2011.
538 N.A.A. Qasem, M.A.I. El-Shaarawi / Solar Energy 98 (2013) 523–542
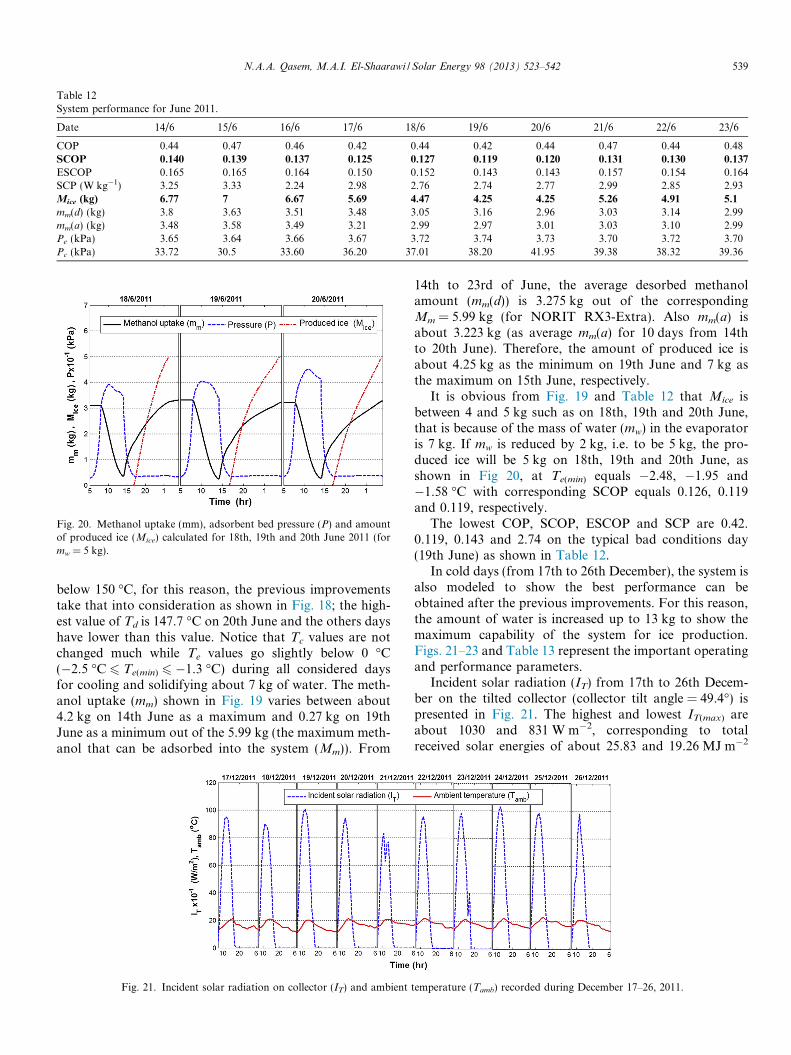
below 150 "C, for this reason, the previous improvementstake that into consideration as shown in Fig. 18; the high-est value of Td is 147.7 "C on 20th June and the others dayshave lower than this value. Notice that Tc values are notchanged much while Te values go slightly below 0 "C(!2.5 "C 6 Te(min) 6 !1.3 "C) during all considered daysfor cooling and solidifying about 7 kg of water. The meth-anol uptake (mm) shown in Fig. 19 varies between about4.2 kg on 14th June as a maximum and 0.27 kg on 19thJune as a minimum out of the 5.99 kg (the maximum meth-anol that can be adsorbed into the system (Mm)). From
14th to 23rd of June, the average desorbed methanolamount (mm(d)) is 3.275 kg out of the correspondingMm = 5.99 kg (for NORIT RX3-Extra). Also mm(a) isabout 3.223 kg (as average mm(a) for 10 days from 14thto 20th June). Therefore, the amount of produced ice isabout 4.25 kg as the minimum on 19th June and 7 kg asthe maximum on 15th June, respectively.
It is obvious from Fig. 19 and Table 12 that Mice isbetween 4 and 5 kg such as on 18th, 19th and 20th June,that is because of the mass of water (mw) in the evaporatoris 7 kg. If mw is reduced by 2 kg, i.e. to be 5 kg, the pro-duced ice will be 5 kg on 18th, 19th and 20th June, asshown in Fig 20, at Te(min) equals !2.48, !1.95 and!1.58 "C with corresponding SCOP equals 0.126, 0.119and 0.119, respectively.
The lowest COP, SCOP, ESCOP and SCP are 0.42.0.119, 0.143 and 2.74 on the typical bad conditions day(19th June) as shown in Table 12.
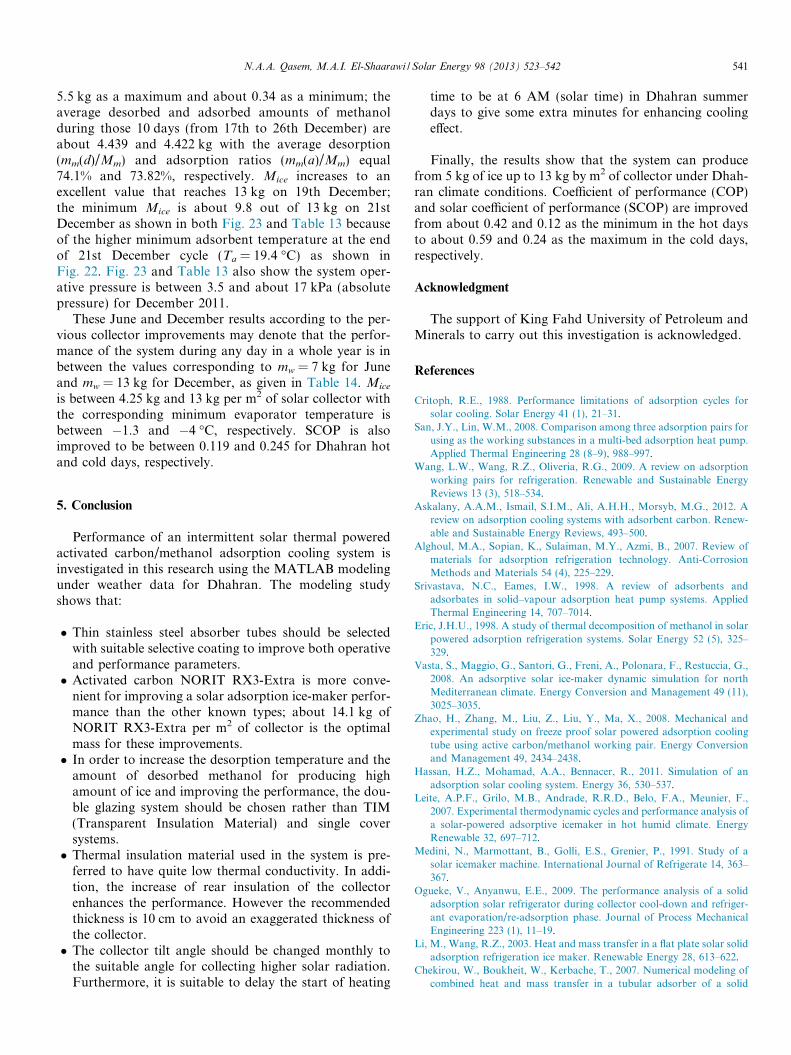
In cold days (from 17th to 26th December), the system isalso modeled to show the best performance can beobtained after the previous improvements. For this reason,the amount of water is increased up to 13 kg to show themaximum capability of the system for ice production.Figs. 21–23 and Table 13 represent the important operatingand performance parameters.
Incident solar radiation (IT) from 17th to 26th Decem-ber on the tilted collector (collector tilt angle = 49.4") ispresented in Fig. 21. The highest and lowest IT(max) areabout 1030 and 831 W m!2, corresponding to totalreceived solar energies of about 25.83 and 19.26 MJ m!2
Table 12System performance for June 2011.
Date 14/6 15/6 16/6 17/6 18/6 19/6 20/6 21/6 22/6 23/6
COP 0.44 0.47 0.46 0.42 0.44 0.42 0.44 0.47 0.44 0.48SCOP 0.140 0.139 0.137 0.125 0.127 0.119 0.120 0.131 0.130 0.137ESCOP 0.165 0.165 0.164 0.150 0.152 0.143 0.143 0.157 0.154 0.164SCP (W kg!1) 3.25 3.33 2.24 2.98 2.76 2.74 2.77 2.99 2.85 2.93Mice (kg) 6.77 7 6.67 5.69 4.47 4.25 4.25 5.26 4.91 5.1mm(d) (kg) 3.8 3.63 3.51 3.48 3.05 3.16 2.96 3.03 3.14 2.99mm(a) (kg) 3.48 3.58 3.49 3.21 2.99 2.97 3.01 3.03 3.10 2.99Pe (kPa) 3.65 3.64 3.66 3.67 3.72 3.74 3.73 3.70 3.72 3.70Pc (kPa) 33.72 30.5 33.60 36.20 37.01 38.20 41.95 39.38 38.32 39.36
Fig. 20. Methanol uptake (mm), adsorbent bed pressure (P) and amountof produced ice (Mice) calculated for 18th, 19th and 20th June 2011 (formw = 5 kg).
Fig. 21. Incident solar radiation on collector (IT) and ambient temperature (Tamb) recorded during December 17–26, 2011.
N.A.A. Qasem, M.A.I. El-Shaarawi / Solar Energy 98 (2013) 523–542 539
on 24th and 21st December, respectively. On 19th Decem-ber, the total incident solar radiation is about24.84 MJ m!2 instead of about 22.2 MJ m!2 at the sameday if the collector tilt angle equals 23.6" (latitude of Dhah-ran); the increase is about 11.9% The maximum adsorbenttemperature (Td) is between 92.55 "C and 118.7 "C duringthese 10 cold days (from 17th to 26th December) as shown
in Fig. 22. In the best weather condition day (19th Decem-ber) Td = 108.72 "C. Te(min) varies between !2.97 (on 17thDecember) "C and !4 "C (on 19th December); it does notgo below !4 "C due to the large amount of water(mw = 13 kg).
Fig. 23 and Table 13 show the important performanceparameters during the cold days. mm varies between about
Fig. 22. Collector absorber (Tpw), adsorbent bed (T), condenser (Tc) and evaporator (Te) temperatures calculated for the period 17–26 December 2011.
Fig. 23. Methanol uptake (mm), adsorbent bed pressure (P) and amount of produced ice (Mice) calculated for the period 17–26 December 2011.
Table 13System performance for December 2011.
Date 17/12 18/12 19/12 20/12 21/12 22/12 23/12 24/12 25/12 26/12
COP 0.52 0.59 0.54 0.52 0.53 0.54 0.56 0.54 0.54 0.59SCOP 0.232 0.245 0.224 0.226 0.239 0.228 0.221 0.212 0.220 0.241ESCOP 0.251 0.265 0.254 0.258 0.264 0.258 0.255 0.241 0.246 0.279SCP (W kg!1) 4.16 4.33 4.56 3.92 3.78 4.1 4.29 4.50 4.29 3.85Mice (kg) 11.52 12.1 13.0 10.83 9.80 10.66 11.67 12.35 11.46 9.89mm(d) (kg) 4.73 4.32 4.90 4.33 4.13 4.37 4.46 4.79 4.57 3.79mm(a) (kg) 4.39 4.58 4.81 4.41 4.01 4.35 4.55 4.76 4.55 4.08Pe (kPa) 3.50 3.51 3.42 3.55 3.58 3.55 3.51 3.48 3.52 3.58Pc (kPa) 14.45 15.14 14.72 14.79 15.64 16.91 15.41 16.01 16.41 16.38
Table 14System predicted performance data for both June and December of 2011.
Mice (kg) COP SCOP ESCOP SCP (W kg!1) Te ("C)
4.25–13 0.42–0.59 0.119–0.245 0.143–0.279 2.7–4.6 (!1.3)–(!4)
540 N.A.A. Qasem, M.A.I. El-Shaarawi / Solar Energy 98 (2013) 523–542
5.5 kg as a maximum and about 0.34 as a minimum; theaverage desorbed and adsorbed amounts of methanolduring those 10 days (from 17th to 26th December) areabout 4.439 and 4.422 kg with the average desorption(mm(d)/Mm) and adsorption ratios (mm(a)/Mm) equal74.1% and 73.82%, respectively. Mice increases to anexcellent value that reaches 13 kg on 19th December;the minimum Mice is about 9.8 out of 13 kg on 21stDecember as shown in both Fig. 23 and Table 13 becauseof the higher minimum adsorbent temperature at the endof 21st December cycle (Ta = 19.4 "C) as shown inFig. 22. Fig. 23 and Table 13 also show the system oper-ative pressure is between 3.5 and about 17 kPa (absolutepressure) for December 2011.
These June and December results according to the per-vious collector improvements may denote that the perfor-mance of the system during any day in a whole year is inbetween the values corresponding to mw = 7 kg for Juneand mw = 13 kg for December, as given in Table 14. Mice
is between 4.25 kg and 13 kg per m2 of solar collector withthe corresponding minimum evaporator temperature isbetween !1.3 and !4 "C, respectively. SCOP is alsoimproved to be between 0.119 and 0.245 for Dhahran hotand cold days, respectively.
5. Conclusion
Performance of an intermittent solar thermal poweredactivated carbon/methanol adsorption cooling system isinvestigated in this research using the MATLAB modelingunder weather data for Dhahran. The modeling studyshows that:
' Thin stainless steel absorber tubes should be selectedwith suitable selective coating to improve both operativeand performance parameters.' Activated carbon NORIT RX3-Extra is more conve-
nient for improving a solar adsorption ice-maker perfor-mance than the other known types; about 14.1 kg ofNORIT RX3-Extra per m2 of collector is the optimalmass for these improvements.' In order to increase the desorption temperature and the
amount of desorbed methanol for producing highamount of ice and improving the performance, the dou-ble glazing system should be chosen rather than TIM(Transparent Insulation Material) and single coversystems.' Thermal insulation material used in the system is pre-
ferred to have quite low thermal conductivity. In addi-tion, the increase of rear insulation of the collectorenhances the performance. However the recommendedthickness is 10 cm to avoid an exaggerated thickness ofthe collector.' The collector tilt angle should be changed monthly to
the suitable angle for collecting higher solar radiation.Furthermore, it is suitable to delay the start of heating
time to be at 6 AM (solar time) in Dhahran summerdays to give some extra minutes for enhancing coolingeffect.
Finally, the results show that the system can producefrom 5 kg of ice up to 13 kg by m2 of collector under Dhah-ran climate conditions. Coefficient of performance (COP)and solar coefficient of performance (SCOP) are improvedfrom about 0.42 and 0.12 as the minimum in the hot daysto about 0.59 and 0.24 as the maximum in the cold days,respectively.
Acknowledgment
The support of King Fahd University of Petroleum andMinerals to carry out this investigation is acknowledged.
References
Critoph, R.E., 1988. Performance limitations of adsorption cycles forsolar cooling. Solar Energy 41 (1), 21–31.
San, J.Y., Lin, W.M., 2008. Comparison among three adsorption pairs forusing as the working substances in a multi-bed adsorption heat pump.Applied Thermal Engineering 28 (8–9), 988–997.
Wang, L.W., Wang, R.Z., Oliveria, R.G., 2009. A review on adsorptionworking pairs for refrigeration. Renewable and Sustainable EnergyReviews 13 (3), 518–534.
Askalany, A.A.M., Ismail, S.I.M., Ali, A.H.H., Morsyb, M.G., 2012. Areview on adsorption cooling systems with adsorbent carbon. Renew-able and Sustainable Energy Reviews, 493–500.
Alghoul, M.A., Sopian, K., Sulaiman, M.Y., Azmi, B., 2007. Review ofmaterials for adsorption refrigeration technology. Anti-CorrosionMethods and Materials 54 (4), 225–229.
Srivastava, N.C., Eames, I.W., 1998. A review of adsorbents andadsorbates in solid–vapour adsorption heat pump systems. AppliedThermal Engineering 14, 707–7014.
Eric, J.H.U., 1998. A study of thermal decomposition of methanol in solarpowered adsorption refrigeration systems. Solar Energy 52 (5), 325–329.
Vasta, S., Maggio, G., Santori, G., Freni, A., Polonara, F., Restuccia, G.,2008. An adsorptive solar ice-maker dynamic simulation for northMediterranean climate. Energy Conversion and Management 49 (11),3025–3035.
Zhao, H., Zhang, M., Liu, Z., Liu, Y., Ma, X., 2008. Mechanical andexperimental study on freeze proof solar powered adsorption coolingtube using active carbon/methanol working pair. Energy Conversionand Management 49, 2434–2438.
Hassan, H.Z., Mohamad, A.A., Bennacer, R., 2011. Simulation of anadsorption solar cooling system. Energy 36, 530–537.
Leite, A.P.F., Grilo, M.B., Andrade, R.R.D., Belo, F.A., Meunier, F.,2007. Experimental thermodynamic cycles and performance analysis ofa solar-powered adsorptive icemaker in hot humid climate. EnergyRenewable 32, 697–712.
Medini, N., Marmottant, B., Golli, E.S., Grenier, P., 1991. Study of asolar icemaker machine. International Journal of Refrigerate 14, 363–367.
Ogueke, V., Anyanwu, E.E., 2009. The performance analysis of a solidadsorption solar refrigerator during collector cool-down and refriger-ant evaporation/re-adsorption phase. Journal of Process MechanicalEngineering 223 (1), 11–19.
Li, M., Wang, R.Z., 2003. Heat and mass transfer in a flat plate solar solidadsorption refrigeration ice maker. Renewable Energy 28, 613–622.
Chekirou, W., Boukheit, W., Kerbache, T., 2007. Numerical modeling ofcombined heat and mass transfer in a tubular adsorber of a solid
N.A.A. Qasem, M.A.I. El-Shaarawi / Solar Energy 98 (2013) 523–542 541
adsorption solar refrigerator. Revue des Energies Renouvelables 10(3), 367–379.
Critoph, R.E., Tamainot-Telto, Z., 1997. Solar adsorption refrigeration.Renewable Energy 12 (4), 409–417.
Li, M., Wang, R., Xu, Y., Wu, J., Dieng, A., 2002. Experimental study ondynamic performance analysis of a flat-plate solar solid-adsorptionrefrigeration for ice maker. Renewable Energy 27, 211–221.
Wang, R.Z., Li, M., Xu, Y.X., Wu, J.Y., 2000. An energy efficient hybridsystem of solar powered water heater and adsorption ice maker. SolarEnergy 68, 189–195.
Critoph, R.E., 1999. Adsorption refrigerators and heat pump. In:Burchell, T.D. (Ed), Carbon Materials for Advanced Technologies,Chap 10, ISBN 0-08-042683-2, pp. 303–340.
Duffie, J.A, Beckman, W., 2006. Solar Energy Thermal Processes. JohnWiley& Sons. Inc..
Passos, E.F., Escobedo, J.F., Mrunier, F., 1989. Simulation of anintermittent adsorptive solar cooling system. Solar Energy 42 (2),103–111.
Zhao, Y., HU, E., Blazewicz, A., 2012a. Dynamic modeling of anactivated carbon–methanol adsorption refrigeration tube with
considerations of interfacial convection and transient pressure process.Applied Energy 95, 276–284.
Anyanwu, E.E., Ezekwe, C.I., 2003. Design, construction and test run of asolid adsorption solar refrigerator using activated carbon/methanol, asadsorbent/adsorbate pair. Energy Conversion and Management 44(18), 2879–2892.
Leite, A.P.F., Grilo, M., Andrade, R.R.D., Belo, F.A., 2004. Dimension-ing, thermal analysis and experimental heat loss coefficients of anadsorptive solar icemaker. Renewable Energy 29, 1643–1663.
Zhao, Y., Hu, E., Blazewicz, A., 2012b. A comparison of three adsorptionequations and sensitivity study of parameter uncertainty effects onadsorption refrigeration thermal performance estimation. Heat MassTransfer 48, 217–226.
El-Sharkawy, I.I., Hassan, M., Saha, B.B., Koyama, S., Nasr, M.M.,2009. Study on adsorption of methanol onto carbon based adsorbents.International Journal of Refrigeration 32 (7), 06–011.
Henninger, S., Schicktanz, M., Hugenell, P., Sievers, H., Henning, H.M.,2012. Evaluation of methanol adsorption on activated carbons forthermally driven chillers part I: thermophysical characterization.International Journal of Refrigeration 35 (3), 543–553.
542 N.A.A. Qasem, M.A.I. El-Shaarawi / Solar Energy 98 (2013) 523–542

![Its impact on Arctic marine biological pumpinjapan.no/arctic2016-day1/files/2016/04/ASIW_EijiWatanabe_Sessio… · Ice Algal Productivity Annual primary production of ice algae [mmol-N/m2]](https://static.fdocuments.net/doc/165x107/60766ed1cc518c540b676791/its-impact-on-arctic-marine-biological-ice-algal-productivity-annual-primary-production.jpg)