Improving Estimate Maturity For More Successful …galorath.com/blogfiles/estimate maturity 2010...
34
Improving Estimate Maturity For More Successful Projects Successful Projects SEER / Tracer Alliance Presentation March 2010 Dan Galorath Dan Galorath [email protected]
Transcript of Improving Estimate Maturity For More Successful …galorath.com/blogfiles/estimate maturity 2010...

Improving Estimate Maturity For More Successful ProjectsSuccessful ProjectsSEER / Tracer Alliance Presentation March 2010
Dan GalorathDan Galorath

An Estimate Defined
• An estimate is the most knowledgeable statement you can make at a particular point in time regarding:• Effort / Cost
• Schedule
• Staffing
• Risk
• Reliability
• Estimates more precise with progress• Estimates more precise with progress• A WELL FORMED ESTIMATE IS A
DISTRIBUTIONDISTRIBUTION
2

Delusions of Success: How Optimism Undermines Executives' Decisions (Source: Richard Hartley, HBR)
Problem: Humans seem hardwired to be optimistsProblem: Humans seem hardwired to be optimists• Routinely exaggerate benefits & discount costs
• Optimism from cognitive biases & organizational pressures• Exaggerate talents & degree of control
• Attribute negative consequences to external factors
• Anchoring (relying too heavily on one piece of information) magnifies • Anchoring (relying too heavily on one piece of information) magnifies optimism
• Most pronounced for new initiatives
• Solution: Temper with “outside view”• Solution: Temper with “outside view”• Supplements traditional forecasting w/ statistical analysis of
analogous efforts
Don’t remove optimism but balance optimism & realism• Don t remove optimism, but balance optimism & realism
“When pessimistic opinions are suppressed,hil ti i ti d dwhile optimistic ones are rewarded,
an organizations ability to think critically is undermined”
Estimation Organizational Maturity V1.7
Level 0
Informal or no estimating
Manual effort estimating without a process
Manual effort estimating without a process
Level Direct Task Direct Task S d h tS d h t Ad Hoc
1Direct Task EstimationDirect Task Estimation SpreadsheetsSpreadsheets Ad Hoc
Process
Level 2
Formal Sizing (e.g.
function points)
Direct Task
Estimation
Direct Task
Estimation
Simple model (Size *
Productivity) or informal SEER Use
Simple model (Size *
Productivity) or informal SEER Use
Some measureme
nt & analysis
Informal Process
Level 3
FormalSizing
Robust Parametric estimation
(SEER)
Robust Parametric estimation
(SEER)
Estimate vs. actual capture
Formalized Multiple Estimate Process
Rigorous measurement
& analysis
Parametric planning &
ControlRisk
ManagementRepeatable
process
Level 4
Formal sizing Repeatable process
Robust parametric estimating
(SEER)
Robust parametric estimating
(SEER)
Rigorous measurement
& analysis
Parametric estimation
with tracking & control
Risk Management
Process improvement via lessons
learned4 ( )( )
Level 5
Formal sizing Repeatable process
Robust parametric estimating
(SEER)
Robust parametric estimating
(SEER)
Rigorous measurement
& analysis
Parametric estimation
with tracking & control
Risk Management
Continuous process
improvement
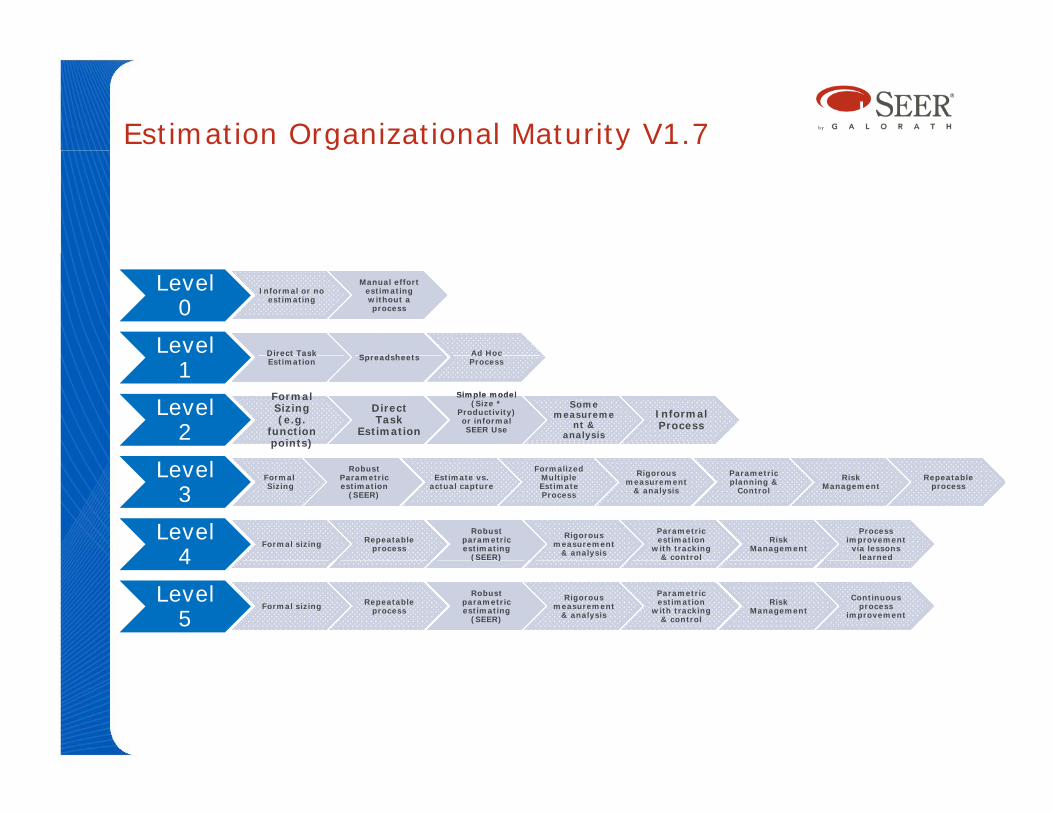
Estimation Organizational Maturity Level 0
Level Informal or no
Manual effort estimating without a
Manual effort estimating without a 0
oestimating without a
processwithout a process
Guessing is the most widely used estimation techniqueGuessing is the most widely used estimation technique

Poor Estimates Effects on Projects• Inaccurate estimates can reduce project success:
• Poor implementations• Critical processes don’t scalep• Emergency staffing• Cost overruns caused by underestimating project needs
• Scope creep from lack of well defined objectives • Scope creep from lack of well defined objectives, requirements, & specifications
• Forever changing project goals
F t ti• Frustration• Customer dissatisfaction• Cost overruns and missed schedules• Project Failures
• Poor estimates & plans are root cause of program risk
And important project business decisions made early
6
And important project business decisions made early with minimum knowledge & maximum uncertainty

“Run IT Like a Business”
• Cutter Consortium Software Project Survey:• 62% overran original schedule by more than 50%
• 64% more than 50% over budget;
• 70% had critical product quality defects after release
• Standish Group CHAOS ReportStandish Group CHAOS Report• 46% challenged
• 19% failed
35% f l• 35% successful
~$875 billion spent on IT$300 billion spent on IT projects ~$300 billion spent on IT projects
~$57 billion wasted annually

Estimation Organizational Maturity Level 1
Level 1
Direct Task EstimationDirect Task Estimation SpreadsheetsSpreadsheets Ad Hoc
Process1 EstimationEstimation pp Process

Basic Estimation Tribes (Adapted from DCG/Galorath Webinar)
1. Napkins – Ad-hoc, hero driven estimators …past successes are legendary… napkin scribbling taken as gospel
2. Guts – Feeling /experience oriented project managers…years of i d d b d d dl f l l experience, good and bad…trusted regardless of actual results
(tenure benefits of being a survivor)3. Spreadsheets – Former Napkins and Guts translating tribal
knowledge onto spreadsheetsknowledge onto spreadsheets• Bestows mathematical accuracy and empirical integrity on home-
grown estimation algorithms
• Tribal estimation knowledge can and does work
• However, it comes with high risk and cost
• Rarely repeatable
• Consistency is sporadicy p
• Heroic energy is kept in reserve used to mitigate risk
• Knowledge almost never institutionalized outside of personal knowledge and desktop PC filesg p
• Knowledge lost when heroes retire or leave
© 2009 Copyright Galorath Incorporated 9

Manual Estimates: Human Reasons For Error (Metrics Can Help)
• Manual Task estimates yield SIGNIFICANT errorerror
• Desire for “credibility” motivates overestimate behavior (80% probability?)overestimate behavior (80% probability?)• So must spend all the time to be “reliable”
• Better approach force 50% probability & have “buffer” for overruns
• Technical pride sometimes causes underestimates• Technical pride sometimes causes underestimates
10

Estimation Organizational Maturity Level 2
Level Formal Sizing ( f i Direct Task Direct Task
Simple model (Size * Productivity) or
Simple model (Size * Productivity) or Some
& Informal
2(e.g. function
points)Direct Task EstimationDirect Task Estimation
y)informal SEER Use
y)informal SEER Use measurement &
analysisInformal Process
Gartner says even Level 2 reduces estimate vs actualvariance by 50% (Source “Why Galorath Matters” Gartner)variance by 50% (Source Why Galorath Matters , Gartner)

Many Viable Size Metrics: Depends On Organization & Goals
Software type is best characterized bySoftware type in this column…
… is best characterized by…
Lines Functions SEER-FBS Use Cases COTSTraditional X X X X (ROM) Information Technology Algorithmic Processing
X X X X (ROM) Processing Auto-gen Code X X X (ROM) COTS Integration X X (ROM) X Non-Line Based X X X (ROM X
E ti t t b t tif i l
12
Estimate a range to best quantify size early
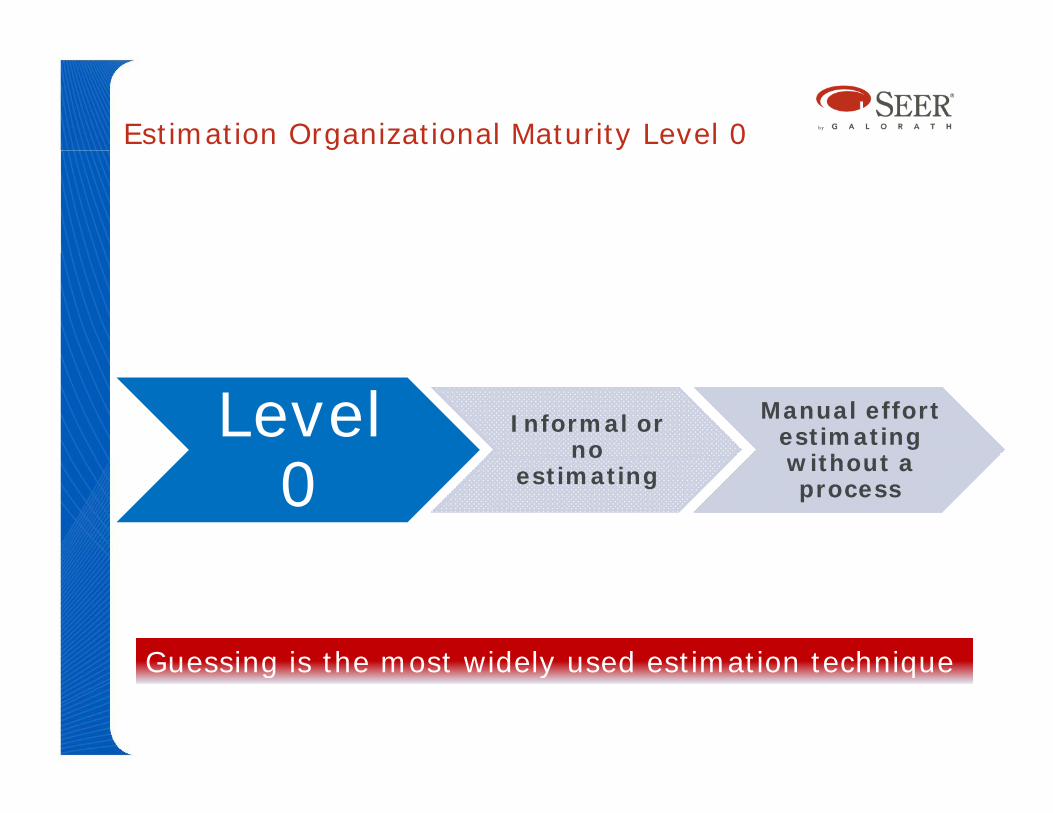
Estimation Should Use More Than Simple Productivity Measures• Just simple size over productivity measures may not
adequately project the effort for a new system• Unless the system is VERY similar• Unless the system is VERY similar
• Additional estimation parameters are required to describe the situation• Quality
• Reuse
• Retest
• Staffing
T h l & E i t ( i t l tilit )• Technology & Environment (e.g. requirements volatility)
And productivity measures are generally based on
13
And productivity measures are generally based onSize… so low maturity organizations may lag there too
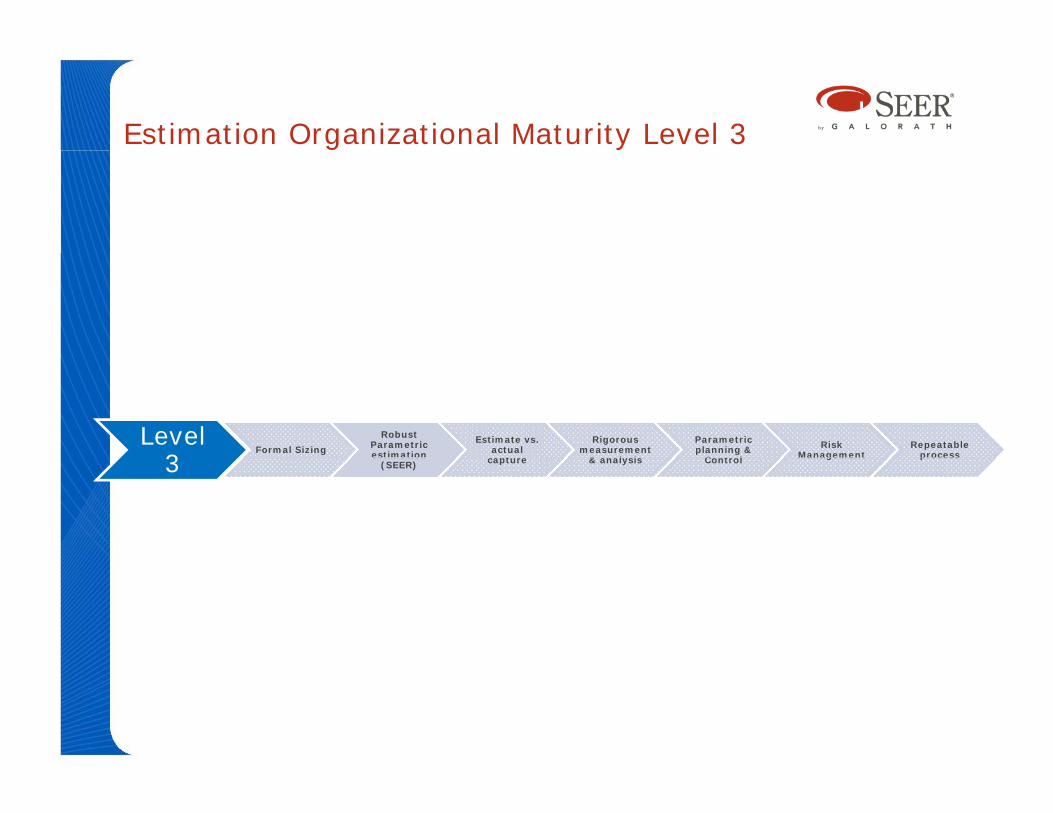
Estimation Organizational Maturity Level 3
Level 3
Formal SizingRobust
Parametric estimation
Robust Parametric estimation
Estimate vs. actual
capt e
Rigorous measurement
& anal sis
Parametric planning &
Cont olRisk
ManagementRepeatable
process3 estimation (SEER)
estimation (SEER) capture & analysis Control Management process

10 Step Software Estimation Process:Consistent Processes = Reliable Estimates
10 Track Project1. Establish Estimate Scope
9. Document Estimate and Lessons
10. Track Project Throughout Development
2. Establish Technical Baseline, Ground Rules, Assumptions
8. Generate a Project Plan
and Lessons Learned
3. Collect Data
4 Estimate and Validate
7. Quantify Risks and Risk Analysis
4. Estimate and Validate Software Size 6. Review, Verify
and Validate Estimate
155. Prepare
Baseline Estimates

Fundamental Metrics For Fundamental Metrics For Estimation, Planning & ControlEstimation, Planning & Control
• Size• AKA Volume, Mass
• Effort• AKA Work, Labor,
• Units: Source Lines of Code (SLOC); Function Points (FP) Use Cases
,
• Units: Staff Months, Staff Hours
• Cost• New versus rework
• COTS & Packages
ff h l
• Cost• AKA Budget, Money
• Units: $, other currencies• Effective Technology
• AKA Productivity Potential, Efficiency
• Staffing• AKA Manpower Loading
• Units: none
• TimeAKA D ti S h d l
• Units: FTE People
• Defects• AKA Reliability Quality
1616
• AKA Duration, Schedule
• Units: Calendar Months, Calendar Weeks
AKA Reliability, Quality
• Units: Defect Count

Learn & Improve With MetricsLearn & Improve With Metrics
•Shows actual data, ranges, and correlations
Pl i d •Plots estimates and contrasts with data points
•Plots actual data and / or t dtrends
171717

© 2009 Copyright Galorath Incorporated 18

Balancing Resources & Schedule Is A Science
For a given Size, Complexity and TechnologyMinimum TimeTo Complete
Work ExpandsTo Fill Time
(Eff t ITo Complete(Effort Increases
to Reduce Schedule)
(Effort Increases
due to lack of pressure)
Minimum TimeEffort Increasedue to Longer
Optimal Effort(Lower Effort rt
Mon
ths
gSchedule
(Lower Effort for Longer Schedule)
Effo
r
Calendar Time
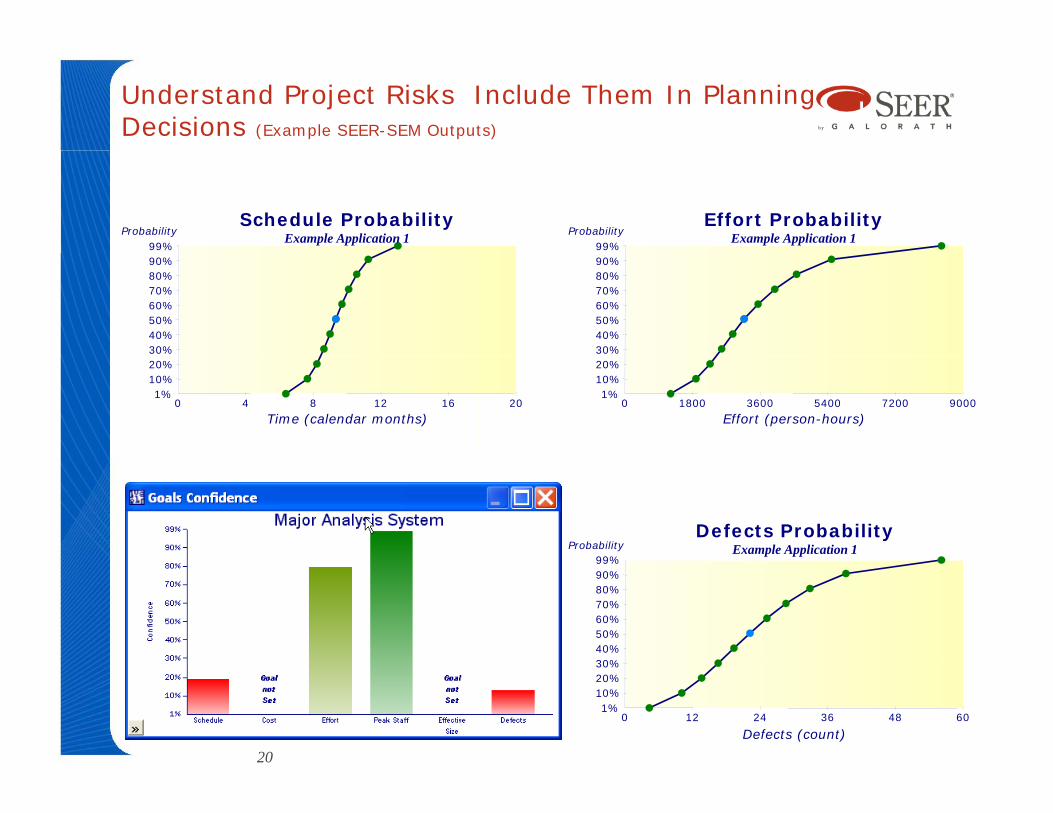
Understand Project Risks Include Them In Planning Decisions (Example SEER-SEM Outputs)
Schedule ProbabilityExample Application 1Probability
99% 99%
Effort ProbabilityExample Application 1Probability
30%40%50%60%70%80%90%
30%40%50%60%70%80%90%
0 4 8 12 16 20Time (calendar months)
1%10%20%
0 1800 3600 5400 7200 9000Effort (person-hours)
1%10%20%
Defects ProbabilityExample Application 1Probability
99%
30%40%50%60%70%80%90%99%
0 12 24 36 48 60Defects (count)
1%10%20%30%
20

Example Benchmark Versus an Estimate.. Why Are We So Expensive?

Use Earned Value To Quantify Progress Versus Effort FOR DEVELOPMENT AND MAINTENANCE
• Main concern of EVM: what has been accomplished in a given time and budget, versus what was planned for the
ti d b d tsame time and budget• A project is generally healthy if what has been accomplished is
what was planned, or more
• Project unhealthy if accomplishment lags expectations
• Definition: Earned value = budgeted value for the work accomplished (what you got for what it cost you)accomplished (what you got for what it cost you)
Budget$Healthy
Budget$Unhealthy
g
EV
g
EV
22Time = Now Time = Now
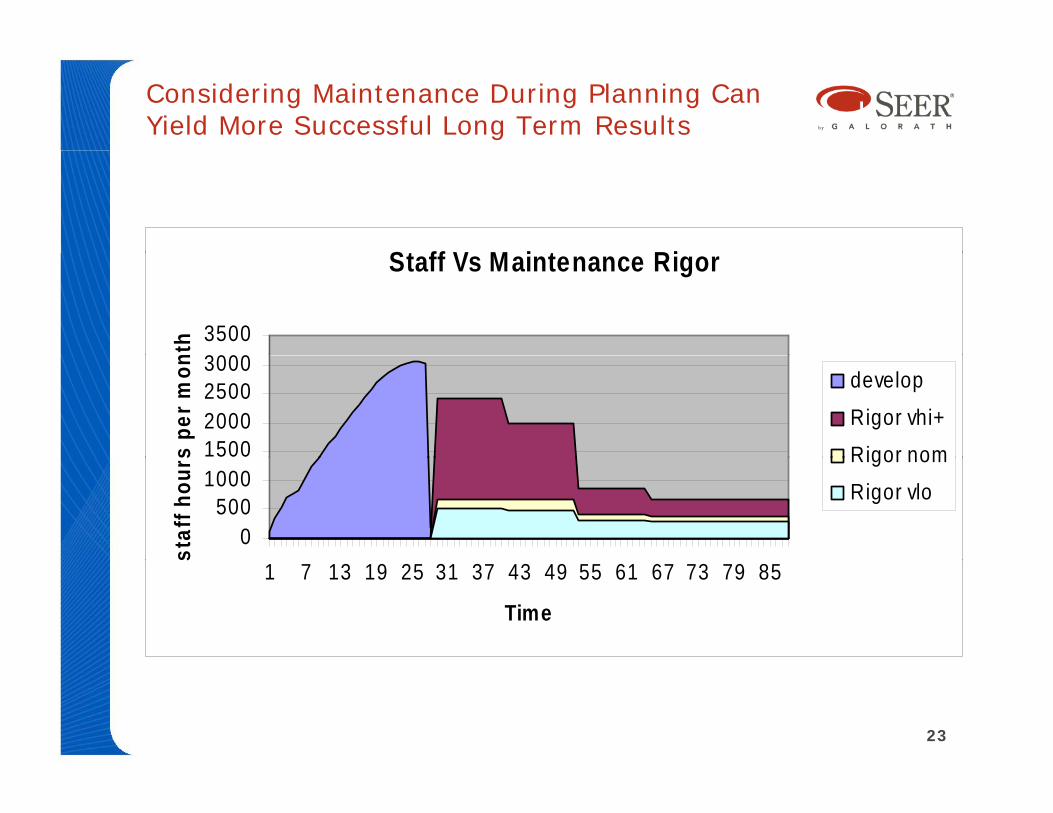
Considering Maintenance During Planning Can Yield More Successful Long Term Results
St ff V M i t RiStaff Vs Maintenance Rigor
30003500
nth
1500200025003000
s pe
r mon develop
Rigor vhi+
Rigor nom
0500
1000
staf
f hou
rs Rigor nom
Rigor vlo
1 7 13 19 25 31 37 43 49 55 61 67 73 79 85
Time
s
23
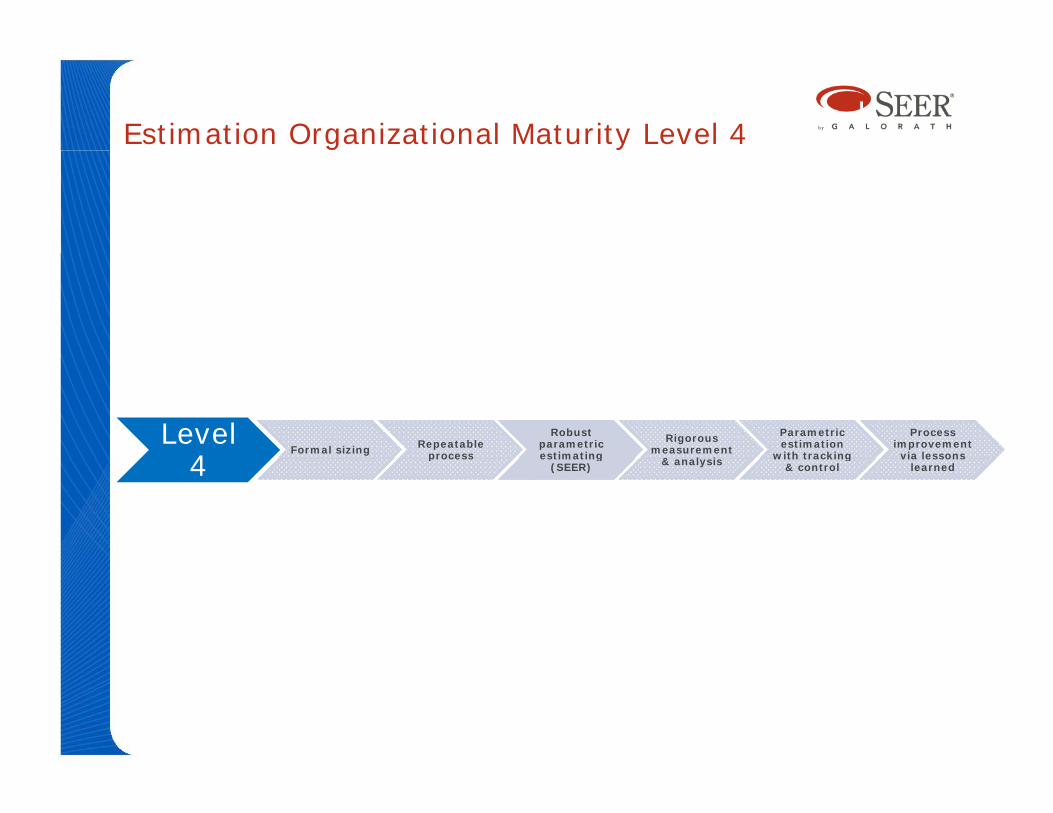
Estimation Organizational Maturity Level 4
Level 4
Formal sizing Repeatable process
Robust parametric estimating
Robust parametric estimating
Rigorous measurement
& l i
Parametric estimation
with tracking
Process improvement via lessons 4 process estimating
(SEER)estimating
(SEER) & analysis with tracking & control
via lessons learned

What To Measure: Multiplicity of Metrics11.Obvious: Status / Trend Metrics
• E.g. productivity, defects removal rate, g p ycost, schedule
2.Most important for improvement: p pEffectiveness ( 5 max)• “What we are doing that we should not do” g
e.g. number of delivered critical defects
• “What we are not doing that we should do” e.g. number of defects that got past inspections
These metrics may change over time as we • These metrics may change over time as we improve 25

Understanding & Tracking Defects, Growth And Other Metrics
Track defect discovery and
removal t i t
Heath and Status Indicator shows status and trends from
the previous snapshot
rates against expected
rates
the previous snapshot
•Including Size Growth and Defect Discovery/Removal Rate
•User defined control limits to control the transition between
red-yellowyellow-green
I d d f t Increased defect reporting rate
shows a worsening trend
Track software size
growth 26

Estimation Organizational Maturity Level 5
Level 5
Formal sizing Repeatable process
Robust parametric estimating
Robust parametric estimating
Rigorous measurement
& l i
Parametric estimation
with tracking Continuous
process i t5 process estimating
(SEER)estimating
(SEER) & analysis with tracking & control improvement

Making Business Decisions Via Estimating Total Ownership Cost & ROI
D t i if Determine &
Quantify Benefits ti
Determine total ownership costs
i t h d l
Determine if project
worthwhile (sufficient ROI) over time against schedule (sufficient ROI) on its own or as
part of a portfolio
© 2009 Copyright Galorath Incorporated 28
Core Metric: Value Provided By Software• Concept: Spend where you obtain the most value
• Value = savings to company or additional revenue due to the software
• Software Fails to add value much too often• Users enamored with concept• Concept deployed• Little to no value contributed to company…• Bad assumptions: E g assuming saving 1 minute per • Bad assumptions: E.g. assuming saving 1 minute per
day of employees filling in their time card has a huge savings in a year
• Many reasons often no changes in business rules• Many reasons… often no changes in business rules
• MRP is a classic example of software hyped but which did not provide value
• Up to 80% of projects never produce positive ROI
Lessons Learned ReviewsLessons Learned Reviews
• Document upon estimate complete AND project complete• Records lessons learned• Provides evidence of process validityProvides evidence of process validity• Shows estimate generated in good faith• Captures actuals to substantiate / calibrate estimation models
• Document missing or incomplete informationDocument missing or incomplete information• Capture risks, issues, & problems process addressed• Document key decisions made during the estimate & results • Document dynamics that occurred during the process e g• Document dynamics that occurred during the process e.g.
• interactions of your estimation team• interfaces with stakeholders• trade-offs made to address issues identified during the process• trade-offs made to address issues identified during the process
• Conduct lessons-learned session ASAP while memories are fresh
Every software project is opportunity to improve
303030
Every software project is opportunity to improvethe estimating process

Estimate Total Ownership Costs; 60+% Can Be Infrastructure & Services
• Software Development
S ft M i t• Software Maintenance
• IT Infrastructure
IT S i• IT Services
© 2009 Copyright Galorath Incorporated 31

Getting Started
© 2009 Copyright Galorath Incorporated 32

Conclusions
• Estimation and estimation process are core for successful software projects
• Improving estimate maturity can improve your • Improving estimate maturity can improve your project success rate
• Gartner says even basic improvement using tool gimproves estimate vs. actual variance by 50%
• A good guess is not a substitute for a viable estimate
• Looking at total ownership cost can change project prospective
• Much of the industry is at level 1 in estimation • Much of the industry is at level 1 in estimation maturity
• Process initiatives like CMMI require:q• Estimation & planning, monitoring & control,
measurement & analysis© 2009 Copyright Galorath Incorporated 33

Additional Information
• www.galorath.com
• Dan on estimating BLOG: www.galorath.com/wp
• Email: [email protected]
© 2009 Copyright Galorath Incorporated 34