
Improving engineering processes using Lean Six...
63
Improving engineering processes using Lean Six Sigma by Ilir Sadriu Jenny Larsson Diploma work No. 194/2017 at Department of Materials and Manufacturing Technology CHALMERS UNIVERSITY OF TECHNOLOGY Gothenburg, Sweden Diploma work in the Master programme Quality and Operations Management & Supply Chain Management Performed at: Flexlink AB Byfogdegatan 11, 415 05 Gothenburg Supervisor(s): Svante Anderholm Flexlink AB Byfogdegatan 11, 415 05 Gothenburg Examiner: Peter Hammersberg Department of Materials and Manufacturing Technology Chalmers University of Technology, SE - 412 96 Gothenburg
Transcript of Improving engineering processes using Lean Six...
Improving engineering processes using Lean Six Sigma
by
Ilir Sadriu Jenny Larsson
Diploma work No. 194/2017 at Department of Materials and Manufacturing Technology
CHALMERS UNIVERSITY OF TECHNOLOGY Gothenburg, Sweden
Diploma work in the Master programme Quality and Operations Management & Supply Chain Management Performed at: Flexlink AB Byfogdegatan 11, 415 05 Gothenburg Supervisor(s): Svante Anderholm Flexlink AB Byfogdegatan 11, 415 05 Gothenburg Examiner: Peter Hammersberg Department of Materials and Manufacturing Technology
Chalmers University of Technology, SE - 412 96 Gothenburg

Improving engineering processes using Lean Six Sigma Ilir Sadriu Jenny Larsson © ILIR SADRIU & JENNY LARSSON Diploma work 194/2017 Department of Materials and Manufacturing Technology Chalmers University of Technology SE-412 96 Gothenburg Sweden Telephone + 46 (0)31-772 1000 Chalmers Reproservice Gothenburg, Sweden 2017
Improving engineering processes using Lean Six Sigma Ilir Sadriu Jenny Larsson Department of Materials and Manufacturing Technology Chalmers University of Technology
This thesis project aims to improve operational engineering processes in the automationindustry. The engineering operations at FlexLink are responsible for designing customizedconveyor solutions according to customer specifications. FlexLink is expecting significantgrowthduringthenextfiveyearsandisinneedofincreasedcapacity.Duringthepasttheyhaveexperienceddifficultiesingrowingwithoutinvestingcorrespondingresources.Inotherwords, they could only grow at a linear rate. Therefore, FlexLink desires to increase theproductivityoftheiroperationsinordertoachievelargeroutputwiththesameamountofinput,thusallowingexponentialgrowth.SeveralimprovementprojectswereinitiatedwithintheglobalLeanSixSigma(LSS)programdeployed at the company, with the purpose of facilitating the future growth plans. Thisthesis was one of the initiated LSS projects and had its focus on investigating smallerengineeringprojectswheretheoutcomeisasimpleconveyorsystemdesign.Inadditiontothe overall capacity and productivity problem, FlexLink had received indications that theyaretooexpensiveinthecategoryofsmallerconveyorsystemsandthuslesscompetitiveinthis area. The companydesired to reduce the amountofmanual engineeringwork in theengineering projects as much as possible by automating process steps, as a means tobecomemorecompetitiveindeliveringsimpleconveyorsolutions.ThethesisprojectwasperformedaccordingtotheDMAICframeworkknownfromSixSigma,in combinationwith the corporate group guidelines for LSSprojects. Theprocess of smallengineering projects was investigated in order to both identify waste in the process andexplore the possibility of automating process steps. The result was identification of over6000 engineering hours/year of waste in the process, as well as concrete improvementrecommendations with 1.5MSEK in annual savings by automating process steps into thealready existing IT tools. Furthermore, a new productivity KPIwas introduced in order tomonitorandmeasuretheperformanceoffutureimprovementprojects.TheKPIwastestedon historical data, which showed that FlexLink had indeed not been able to increaseproductivityduringthepasttwoyears. Keywords: Lean Six Sigma, process improvement, process automation, waste reduction
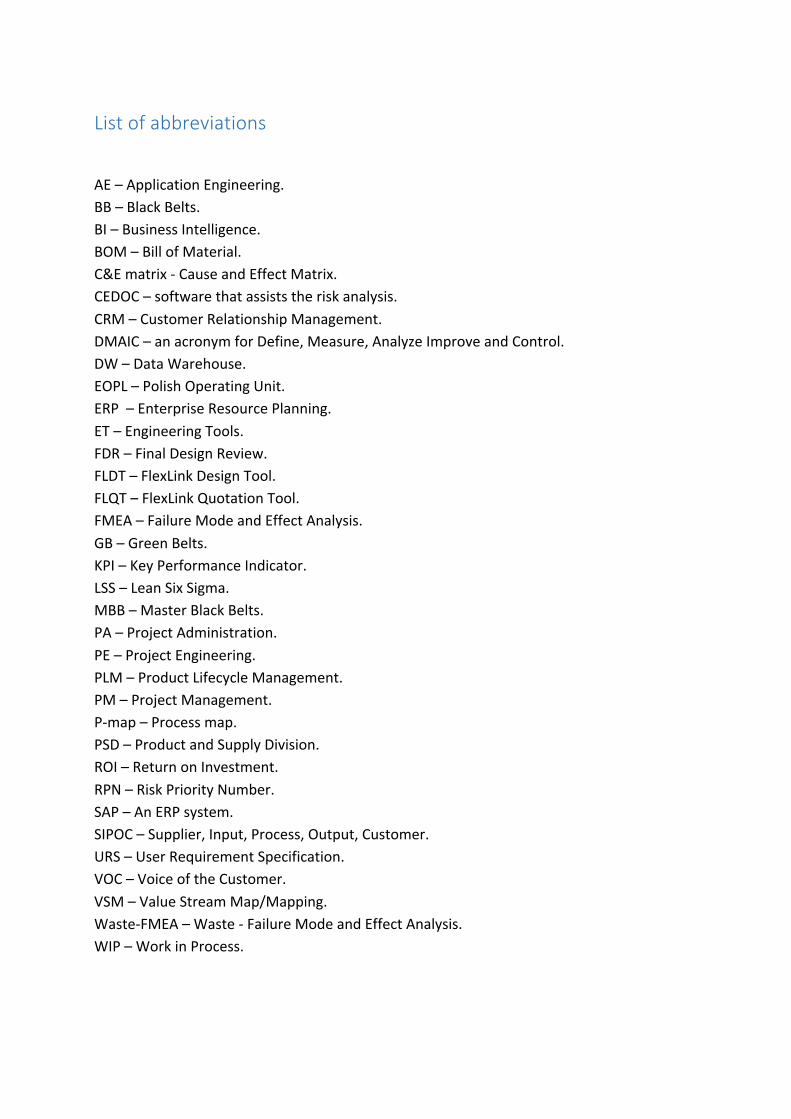
Listofabbreviations AE–ApplicationEngineering.BB–BlackBelts.BI–BusinessIntelligence.BOM–BillofMaterial.C&Ematrix-CauseandEffectMatrix.CEDOC–softwarethatassiststheriskanalysis.CRM–CustomerRelationshipManagement.DMAIC–anacronymforDefine,Measure,AnalyzeImproveandControl.DW–DataWarehouse.EOPL–PolishOperatingUnit.ERP–EnterpriseResourcePlanning.ET–EngineeringTools.FDR–FinalDesignReview.FLDT–FlexLinkDesignTool.FLQT–FlexLinkQuotationTool.FMEA–FailureModeandEffectAnalysis.GB–GreenBelts.KPI–KeyPerformanceIndicator.LSS–LeanSixSigma.MBB–MasterBlackBelts.PA–ProjectAdministration.PE–ProjectEngineering.PLM–ProductLifecycleManagement.PM–ProjectManagement.P-map–Processmap.PSD–ProductandSupplyDivision.ROI–ReturnonInvestment.RPN–RiskPriorityNumber.SAP–AnERPsystem.SIPOC–Supplier,Input,Process,Output,Customer.URS–UserRequirementSpecification.VOC–VoiceoftheCustomer.VSM–ValueStreamMap/Mapping.Waste-FMEA–Waste-FailureModeandEffectAnalysis.WIP–WorkinProcess.
TableofContents1 Introduction ......................................................................................................................... 1
1.1 Background .................................................................................................................. 11.1.1 FlexLink and Coesia ............................................................................................. 11.1.2 Description of the problem ................................................................................... 1
1.2 Aim ............................................................................................................................... 21.2.1 Purpose .................................................................................................................. 21.2.2 Scope ..................................................................................................................... 21.2.3 Delimitations ......................................................................................................... 3
2 Theory ................................................................................................................................. 52.1 Six Sigma ..................................................................................................................... 52.2 Lean Production ........................................................................................................... 52.3 Lean Six Sigma ............................................................................................................ 62.4 Lean in service operations ............................................................................................ 72.5 Six Sigma in Service processes .................................................................................... 8
3 Methodology ..................................................................................................................... 113.1 Empirical research ...................................................................................................... 11
3.1.1 Define .................................................................................................................. 113.1.2 Measure ............................................................................................................... 113.1.3 Analyze ............................................................................................................... 113.1.4 Improve ............................................................................................................... 123.1.5 Control ................................................................................................................ 12
3.2 Literature study .......................................................................................................... 123.3 Data collection ............................................................................................................ 123.4 Action research ........................................................................................................... 133.5 Three point estimation ................................................................................................ 13
4 Define ................................................................................................................................ 154.1 Company structure ..................................................................................................... 15
4.1.1 Spaghetti chart of operations .............................................................................. 164.2 Value Stream Map (VSM) ......................................................................................... 174.3 SIPOC and customer requirements ............................................................................ 184.4 The European Machinery Directive ........................................................................... 204.5 Engineering tools ........................................................................................................ 21
4.5.1 FlexLinkQuotationTool ...................................................................................... 214.5.2 FlexLinkDesignTool ............................................................................................ 214.5.3 FlexCAD ............................................................................................................... 214.5.4 FlexLinkOnlineStore .......................................................................................... 22
4.6 Expanding problem knowledge .................................................................................. 224.7 LSS Culture at FlexLink and Coesia .......................................................................... 23
5 Measure ............................................................................................................................. 255.1 Process map/flow chart .............................................................................................. 255.2 Baseline and financial model ..................................................................................... 275.3 Process cycle time estimation .................................................................................... 28
6 Analyze ............................................................................................................................. 296.1 P-map ......................................................................................................................... 296.2 Cause and Effect matrix ............................................................................................. 296.3 W-FMEA .................................................................................................................... 306.4 Factors in focus for improvements ............................................................................. 32
6.4.1 Engineering time in the workshop ...................................................................... 326.4.2 Rework of drawings ............................................................................................ 336.4.3 FLDT knowledge ................................................................................................ 336.4.4 Knowledge .......................................................................................................... 346.4.5 Project documentation and assembly time calculation ....................................... 346.4.6 Production binder ................................................................................................ 35
7 Improve ............................................................................................................................. 377.1 Brainstorming ............................................................................................................. 377.2 Interviews ................................................................................................................... 377.3 Business Intelligence system ...................................................................................... 377.4 Improvement recommendations ................................................................................. 38
7.4.1 Automated spare part list .................................................................................... 387.4.2 Automated assembly time calculation ................................................................ 397.4.3 Knowledge base for operating units ................................................................... 417.4.4 Engineering time in workshop ............................................................................ 41
7.5 Discarded factors ........................................................................................................ 427.6 Recommendations for future improvement projects .................................................. 42
8 Control .............................................................................................................................. 438.1 Updated W-FMEA ..................................................................................................... 438.2 Control plan ................................................................................................................ 44
8.2.1 Monitoring usage ................................................................................................ 448.2.2 Reaction plan ...................................................................................................... 44
8.3 Introducing a new productivity KPI ........................................................................... 449 Results ............................................................................................................................... 4710 Analysis............................................................................................................................. 4911 Conclusion ........................................................................................................................ 5112 References ......................................................................................................................... 5313 Appendix ........................................................................................................................... 55
1
1 Introduction
1.1 Background
1.1.1 FlexLinkandCoesiaFlexLink is a global company that provides high-end manufacturing solutions to severaldifferentindustries.Thecompanyhasaround900employees,unitsin30differentcountriesandispartoftheCoesiaGroup.TheFlexLinkheadquartersislocatedinGothenburg,Swedenandhas125employees.
FlexLink is a factory automation expert with broad knowledge of improving productionprocesses.Thecorebusinessisdeliveringautomatedproductionflowsolutionsthatenhancetheperformanceofcustomer’s factoriesby forexample loweroperatingcostsandmakingsaferproductionsystems.Thecustomerscanbefoundinseveraldifferentindustriessuchaslife science, automotive, bearings, food industry, etc. The solutions are based on Leanprinciples,andgivebenefitssuchasreducedwaste,increasedthroughputtimeandreducedstocks.Thisthesishad itsfocusonengineeringoperationsthat isresponsiblefordesigningthe customized conveyor systems. The conveyor systems are the core of the automationservicesprovidedbythecompany.Themainpurposeoftheconveyorsystemistotransportgoodswithincustomers’manufacturingfacility.Thesystemsaredesignedwithmodularizedstandard parts that are developed by FlexLink. These parts can be used in millions ofdifferentcombinationsinordertobuildacustomizedconveyorsystem.Theconveyorscomeinseveraldifferentproductplatforms.Theplatformsservedifferentneedsandaredifferentinsize,materialandfunctionality.
Coesia isagroupof companiesproviding industrialandpackaging solutionswithin severaldifferentareas.TheheadquartersislocatedinBologna,Italy.FlexLinkhasbeenapartoftheCoesiaGroup since 2012 and has since then adopted andmaturedwithin Lean Six Sigma(LSS)culture.CoesiahasdeployedLSSasaglobalimprovementprogramtoallsubsidiaries,withthepurposeofguidingallsubsidiariestowardsacontinuouschangeandimprovementcycle.ThereareseveralLSS improvementprojectsonbothBlackBeltandGreenBelt levelcompletedeveryyearwithinCoesia.ThismasterthesiswasinitiatedasapartoftheongoingLSSprogram.
1.1.2 DescriptionoftheproblemWhenacustomerordersaconveyorsystem,aninternalengineeringprojectisstartedwithinFlexLink.Thecentralpartoftheengineeringprojectistodesignandassembletheconveyorsystembasedonthecustomerneeds.Theseprojectscanbeofdifferentsizesdependingonthe complexityof the conveyor system. Someprojects are smaller andonly requirea fewhours of engineering time to complete all the necessary steps, while the larger projectsrequireseveralhundredhoursofengineeringtime.FlexLinkisexpectingasignificantgrowthduringthenextfiveyears. Inthepasttheyhaveexperiencedaproblemwithgrowth;they
2
could only grow at a linear rate by hiring more personnel, which requires investment intraining. In order to succeed with the expected growth, FlexLink desires to increase thecapacity to take on more projects without adding additional costs. This LSS project wasthereforeoneoftheinitiativestocontributetothatgoal.
Furthermore, FlexLink desired that this thesis should focus on the smaller engineeringprojects, since therewere several other LLS projects that already covered larger projects.There are set methods and engineering tools (IT tools) that are used to carry out theprojects, sometimes independentof thesizeof theproject.Thesemethodsaredevelopedfor largeprojects inordertoensurequalityand“fool-proof”theprocess.This isnecessaryfor large projects but a bit redundant for the small projects. Smaller projects are morefrequent and usually have higher profitmargin, they are therefore important to FlexLink.However,FlexLinkhavereceivedindicationthattheyaretooexpensiveinthisareabecausethecostsofrunningthemarehigh.ThismakesFlexLinklesscompetitiveforsmallerprojects.Furthermore, FlexLink believed that the engineering tools used to design the conveyorsystemsarealsoofkeyimportancetothisLSSprojectsincetheyhaveadirectimpactontheperformanceoftheprocess.
1.2 Aim
1.2.1 PurposeFlexLinkwish to increase capacity by reducing the required engineering time to completeprojectsthatareconsideredtobesimple.Theyalsodesiretobecomemorecompetitiveinthis area. It was believed that too many engineering hours is required for these smallerprojects, which results in a higher price for the customers. There was no previousinvestigationonwhythiswasthecaseandthereareonlytimereportsforengineeringtimeon a higher level, not for engineering subtasks. Therewere also no investigations on thecapacity. Two thesis projects as well as internal LLS projects were initiated in order toinvestigate this issue. The projects were carried out by the LSS methodology applied atCoesiaGroup.Both thesisprojectswere run inparallel and supervisedbyaFlexLinkBlackBelt.Therewasfrequentcooperationbetweentheprojectssincetheywerecloselyrelated.This thesis had the aim to increase capacity by reducing the amount of engineering timerequiredtocompleteaproject,focusingonthesmallerandsimplerprojects.Furthermore,FlexLink desired to investigate if the engineering process of small projects could beenhanced by integrating/automating process steps into the already existing engineeringtools.
1.2.2 ScopeThescopeofthisprojectistoimprovetheengineeringprocess,sothatthesameamountofworkcanbedoneinlesstime.Theengineeringprocessneedstobeinvestigatedinordertofindoutwheretimeisspent.Theengineeringprocessalsohasastrongdependencyontheengineeringtoolsthataredeliveredfromthesoftwaredepartment.Theperformanceofthe
3
engineering process is dependent on the performance and utilization of the engineeringtools.Therefore,animportantpartofthisthesisistoconsiderhowtheengineeringtoolsareused and if process steps can be automated. Themain focus are smaller projects with arevenue below 25000€ and a high amount of FlexLink material. The following researchquestionswillguidetheworkinthisthesis:
• Whatfactorsaffecttheengineeringtimeofsmallprojects,withtheabovementioneddefinitionofsmall?
• HowcantheexistingITtoolsbeusedtoautomateprocesssteps?
1.2.3 DelimitationsThis report will only consider the engineering phase where the conveyor systems aredesigned, as well as the handovers before and after that have a direct impact on theengineeringphase.Duringtheinitialplanningoftheprojectitwasdecidedthatthedeliveryofthisthesisshouldonlyincludeimprovementsuggestionsandnotactualimplementations,becauseoftheshorttimeframeof20weeks.Europeanengineeringprojectswitharevenuebelow 25000€ and above 90% FlexLink material will be investigated. However, if anysuggestedimprovementturnouttobeeasytoscaleuptoagloballevelorany“lowhangingfruit”foundthatareeasytoimplementitwillbedone.

4
5
2 TheoryThischapterpresentsthetheorythatwasrelevanttothethesisproject.TheoryofLeanandSixSigmaispresentedasitwasthemethodologieswereimportanttotheproject.Sincetheinvestigatedprocesscouldbedefinedasaserviceprocess,theoryonLeanandSixSigmainserviceoperationsispresented.
2.1 SixSigmaOne of the cornerstones of Quality Management is improving continuously. Due to thequality demands from customers, the development of technology and newly createdbusiness activities is it crucial for companies to improve thequalityof goods and servicescontinuously. The always existing possibility to improve the quality without using moreresources is the basis for continuous improvement. Even the smallest steps can echothroughanorganizationwithbetterqualityandlowercosts.Thehardpartistolocatethosesteps. One methodology used to enable continuous improvement is Six Sigma. Themethodology was developed by Motorola in 1987 and has since then gained increasedpopularity.(BergmanandKlefsjö,2010)
According to Schroeder (2008), there are several different definitions of Six Sigma. Onemutualaspectinallversionsofthedefinitionisthatfindingtherootcauseofproblemsistheessential part. By doing so, the symptoms of a problem are not mistaken for the realproblem.TheproblemsolvingstepsofSixSigmaisanexpansionofthePlan-Do-Study–Act (PDCA) cycle. Theexpansion is commonly called theDMAIC cycle,whereDMAIC is anacronymforDefine,Measure,Analyze,ImproveandControl.(BergmanandKlefsjö,2010)SixSigmastrivestoreduceormitigatetheeffectofthevariationdiscoveredintheproductvariablesperceivedasimportantbythecustomer.OnecriteriaforSixSigmaprojectstobesuccessfulissupportandcommitmentfromthetopmanagement,withoutthatisitnoteasyforsuchprojectstoreallymakeanimpactintheorganization.(Bañuelas,AntonyandBrace,2005;BergmanandKlefsjö,2010)
SixSigmadefinesqualitycharacteristicyasafunctionof ,wherethex’sarethefactorstocontrolinordertogainthedesiredoutputofthecharacteristic.Thefactorscanbeclassified either as controllable (C), noise (N) or standard operator procedure (SOP). ThedifferencebetweenCandNisthatthenoisefactorscannotbecontrolledorisselectednottobecontrolled.ThepurposewiththeSixSigmamethodologyistounderstandhowtousethe controllable factors tomitigate the influence of the non-controllable on the selectedquality characteristic. Theyarealso referred toas the criticalX’sof theprocess thathavestrongimpactontheoutputY(Bañuelas,AntonyandBrace,2005).
2.2 LeanProductionLeanproductionhasitsorigininToyotaandtheToyotaProductionSystem.Thefounderofthe Toyota Production Systemwas Kiichiro Toyoda,who combined inspiration frommass
6
productionaswellasJapanesequalitymovementstocreatethetodaywellknownsystem.TheToyotasystemisbasedontheJust-in-Timeprinciple,whichstrivestodelivertherightquantity at the right time. The expression Lean Productionwas coined byWomack et al.(1990) in their book “The Machine That Changed the World” with inspiration from theToyotawayofworking.SincethenhasmanybooksandarticlesbeenwrittenontheToyotawayandtheLeanprinciples.
Slack, Chambers and Johnston (2010, p.433) defines Lean as “to meet demandinstantaneouslywithperfectqualityandnowaste”.ThisdefinitionofLeanisbasedonthreeaspects: get everyone involved, striving to improve continuously and waste elimination.Waste elimination themost important aspect according to Slack, Chambers and Johnston(2010). Waste is defined as activities that do not add any value to the final product orservice.Researchshowthatonly5percentofthethroughputtimeincompaniesisspentonvalue-addingactivities(Slack,ChambersandJohnston,2010).Operationsthatarenotvalue-addingarethusonlyaddingunnecessarycoststotheproductorserviceandcanbeclassifiedaswaste.ThereareseventypesofcategoriesestablishedbyToyotaProductionSystem:
• Over-production – The outcome from one process is higher than what the nextprocess-stepdemandsasinput.
• Waiting–Waitingforthenextprocessstep.• Transport – The movement of items due to inefficient layout, methods of
transportationororganizationoftheworkplace.• Over-processing–Puttingmoreeffortthanrequired.• Inventory–Storeduprawmaterial,workinprogressorfinishedgoods.• Motion–Unnecessarymovementofpeople.• Rework–Doingthesameoperationsseveraltimes,forexampleduetodefects.
One important step to be able to eliminate activities that are considered waste is todistinguishbetweenwhichactivitiesarevalue-addingandwhicharenot.Thiscanbedonebymappingthevaluestreamoftheprocess.Thespeedatwhichtheactivitiesflowthroughthevaluestreamshouldmatchthepaceofthecustomer’sdemand.Whenalloperationsaresetso that theymatch the output of the process,whichmatches the customer demand, thepace isat takt timeandthere isapull throughtheprocess.Pull isan importantaspectofLean,whichmeansthatthecustomerneedsareincontroloftheproduction.(BergmanandKlefsjö,2010)
2.3 LeanSixSigmaLSSwasfirstusedbyGeneralElectric.Beforethat,thereisnoreporteduseofacombinationofthemethodologies.ResearchsuggeststhatLeanandSixSigmaareinfactcomplementarytoeachother(Psychogios,AtanasovskiandTsironis,2012).ItispointedoutbydeKoningetal (2006)thatsinceLeanandSixSigmacomplementeachothershouldacombinationturnoutwell. This is because Lean looks at theprocesson amoreholistic level and Six Sigma
7
provides a core to confirm or redefine, thereafter for solving problems and model forstructuring up the organization. The first step of DMAIC is the most important for stepchangesandinnovativedevelopmentoftheorganization.BothLeanandSixSigmasupporttheprincipleofpull-thinking;startwiththecustomerinmind.(deKoningetal,2006).
CombiningthemainprinciplesofLeanandSixSigmagivesgreatadvantagetoLSS.ThemainprinciplesforLeanareprocessimprovementbasedonwhatisconsideredvalue-addingwhilekeeping thecustomer’s requirements in focuswhenmakingdecisions.ThemainSixSigmaprinciples is tounderstandvariationthatmakesdecisionsto lowerqualitydeviationbasedon statistical facts as well as having a training and education structure for the wholeorganization.(Psychogios,AtanasovskiandTsironis,2012)
ContinuousimprovementcanbeachievedbothbyaLeanapproachandSixSigmaapproach.Leaniswell-knownforwastereductionwhileSixSigmaisknownforreductionofvariation.Whatthetwoapproacheshaveincommonisthatbothstriveforcontinuousimprovement,butusingthemseparatelyatthesametimehasprovedtobe inefficient. InordertoreachthebestresultwhencombiningLeanandSixSigmatheyneedtobealigned.Forexample,SixSigmaisagreatcomplementtoenhancethechangesmadebyLeanprinciples.Leanmetrics,based on averages, tend to be more directly related to business performance. But theaverage level canbebaddue to toomuchvariationand the Lean toolboxdonotaddressvariation, which makes Six Sigma essential. (Pacheco et al., 2015; Assarlind, Gremyr andBäckman,2013)
Assarlind,GremyrandBäckman (2013)pointedout thatLean iseffectiveat reducingnon-valueaddingactivitieswhileSixSigmahasafocusonenhancingthevalueaddingactivities.ThefollowingquotefromtheCoesiaLSShandbooksumsuptheviewofLeanandSixSigmawithinCoesia:“LeanfocusonissuesthatareamilewidewhileSixSigmafocusonissuesthatareamiledeep”.ItcanbeconcludedthatacombinationofLeanandSixSigmaissupportedbybothpractitionersandresearchers.
2.4 LeaninserviceoperationsÅhlström (2004) explored whether translated Lean principles can be implemented in aservice context. Emphasis is put on the word translated here, since simply implementingleanproductionprinciplesastheyareforaserviceoperationwouldnotbepossible.Theleanprinciplesconsideredintheresearchwerewasteelimination,zerodefects,pull-orientation,multifunctionalteams,decentralizedresponsibility,verticalinformationsystemandimprovecontinuously. Four different organizations were used as cases where the translation wasinvestigated.Itwasfoundthatallprinciplescouldtosomeextentbeimplementedinallfourcases.What differs froma traditional production context is that customers are in generalinvolvedtoahigherdegreeinserviceoperations.Thisleadstothattheeliminationofwastebecomes subjective, what one considers waste may another think of as value-adding.
8
Furthermore,servicesarenotpossibletostorewhichmeansthatthereisalreadypullratherthanpushthroughouttheoperations.(Åhlström,2004)
Using Lean principles in manufacturing is known to have a contribution to increase inproductivity, performance and a decrease of waste. Research indicates that using Leanprinciples in office and administrative can lead to a better business performance andeconomicbenefits.Ithasbeenfoundthatcontinuousimprovementinanofficeenvironmentcan be complicated and sometimes does not achieve the intended result. Commonofficeoperationssuchasquoting,accountingandschedulingareoften60-80percentoftheleadtimeoftheprocess.Ifthoseoperationsareinefficientwilltheoverallperformancebepoor,independent of the quality of the product or service. Finding inefficient processes in anofficecontexthaveprovedtobetrickierthaninmanufacturing,sincetheyaremoredifficulttodefine.Theprocessflowinserviceoperationsisinvisibleandtheownershipofprocessescanoftenbeunknown.Furthermore,theprocessflowisoftennotmeasuredandthereisahighriskofmismatchwiththecustomerneeds.(Thenewimprovementfrontier,2005)
2.5 SixSigmainServiceprocessesSixSigmaisawell-establishedbusinessstrategyinmanyorganizationsinthemanufacturingindustry. It isalso implementedforserviceoperations,althoughtheimplementationisnotaswidely spread in the sector.Companies in the services sectorhavemuch togainwhenimplementingSixSigma.AccordingtoAntony(2006),reportedbenefitsare:
• Lowervariabilityinserviceperformance• Customerneedsarebetterunderstood• Shifting from guessing to relying on data bring more effective decisions by the
management• Theinternaloperationsaremoreefficientandtrustworthy• Tools and methods for solving problems are better understood throughout the
company• Operationsthatarenon-valueaddingaredecreased• Shiftinthecultureintheorganizationfromreactivetoproactive• Theteamworkacrossfunctionsareimprovedinthewholecompany
Inordertomakequalityimprovementsinaserviceoperation,itisimportanttoquantifythevariation.Thisisnotaseasyasinmanufacturingprocessessinceserviceoperationsaremoreintangible, that is,peoplearepartof theprocesses ina largerextentandby thata largersourceofvariation.AnotherdifficultywithusingSixSigmainaservicecontextisthetroubleof knowing how to define a defect aswell as to predict the severity of a defect (Antony,2006). Several research papers argue that one of the most common challenges with SixSigma in serviceoperations is thedifficulty of gatheringquality data (Antony et al., 2007;HensleyandDobie,2005;NevesandNakhai,2011).AnotherchallengementionedbyNevesandNakhai(2011)isthatdatainserviceoperationslackreliabilitysinceitisoftencollected

9
by verbal communication. Antony et al. (2007) mentioned that measuring customersatisfactionismoredifficultandthatwillingnesstochangeislowerthaninamanufacturingcontextasadditionalchallenges.

10
11
3 MethodologyThisprojectwasexecutedaccordingtheDMAICcycle.SincetheprojectwasapartoftheLSSprogram at FlexLink, it followed the internal guidelines for DMAIC projects developed byCoesia.ThepracticalworkwastoalargeextentguidedbytheCoesiaLSShandbookaswellas the Coesia Master Black Belt. The data for the project was mostly collected throughinterviews.Therewere40interviewsconductedintotalwithprojectengineers,applicationengineers, project managers, software developers, administrators, business controllers,operators,middlemanagersanduppermanagers.
3.1 EmpiricalresearchThis report has been carriedout basedon theDMAICmethodology. The empirical part isdividedintothosefivephases,thusarethischapterdividedintofiverepresentativeparts.Ineach phase was appropriate tools used, and during all phases were also qualitative datacollectedwithinterviews,structuredandvisualized.
3.1.1 DefineThefirststepwastoinvestigateandgainknowledgeonwhatneedstobeimprovedandforwhom. A Value StreamMap (VSM) was created to show information flows andmaterialflows in the process steps that are in the scope. Furthermore was a SIPOC, high levelmappingoversupplier,input,process,outcomeandcustomer,made.Thisisdonewhenthesupplier, input and process is known, and the result is the findings of the selectedcharacteristicoftheoutputandcustomerrequirements.
3.1.2 MeasureAflowchartwasdonetounderstandtheprocessonadetailed level.TheultimategoaloftheMeasurephasewastoquantifythecycletimesoftheengineeringprocessasitistoday,that is the baseline.Due to lack of data and large variation in the project time, the cycletimeswasestimatedbyusingthreepointestimation.
3.1.3 AnalyzeA more thorough process map (P-map) was done, listing all inputs and outputs to eachprocess step, respectively. The P-map is the first tool in the Six Sigma flow of qualitativetoolstomappotentialvariationsources.ThenexttoolusedwasaCauseandEffectMatrix,the process inputs found earlier was analyzed against the seven wastes of Lean (Slack,ChambersandJohnston,2010).Thereasonfordoingthiswastoqualitativelyfilterthegrosslist of x relative the variation in theoutput characteristic of interest. Finallywas a FailureModeandEffectAnalysis(FMEA)usedtoidentifywherewastereductioncanbemadeintheprocess.ThewasteanalysisconductedintheAnalyzephasepointedoutwastefulactivitiesinthe process. The waste was then quantified by using estimations, such as three pointestimation,aswellasbythegatheredquantitativedata,suchasprojectandquotationdata.
12
3.1.4 ImproveBrainstormingsessionswereheldwithselectedemployeesandideasforimprovementweregenerated.Meetingswere then heldwith cross functional teams in order to improve theideas, verify that they were possible to execute and start the handover process of theprojecttotheinvolvedstakeholders.Focuswasputondefiningthecosts,savingpotentials,benefitsandReturnonInvestment(ROI)fortheideas.ThequantificationofwastefromtheAnalyzephasewasusedasabasisforthecalculationsofsavingpotentialswhilethecostoftheideaswereestimatedduringinterviewswithemployeesfromthesoftwaredevelopmentdepartment.
3.1.5 ControlA control plan was made in order to enable for Flexlink to monitor the usage of theimprovementrecommendations.Thecontrolplanalsoincludedinformationonhowtoknowwhenperformanceisdroppingandwhatcounteractionstotakeincasethishappens.AnewproductivityKPIwasalsointroduced,therelationshipsales/hour,whichaimstotracktrendsandconnecttrendswithfutureimprovements.
3.2 LiteraturestudyAliteraturestudywasdoneinordertogatherrelevanttheorytotheproject.Thiswasdonebothbeforeandduringtheimprovementproject.SincetheSixSigmaorganizationinCoesiaisbasedonLeanSixSigma, itwasrelevant tostudytheoryonbothLeanandSixSigmaaswellasthecombinationofthetwopractices.Furthermore,sincetheinvestigatedprocessinthisthesiscouldbedefinedasaserviceprocess,itwasrelevanttogatherinformationonthebenefitsandchallengeswithLeanandSixSigmainserviceoperations.
3.3 DatacollectionThequalitativedatainthisthesishasbeencollectedintwoways:throughobservationsandinterviews. Interviews was the most frequent and important way of data collection.“Gemba” walks were also done in the process. Gemba comes from the Japanese GenchiGenbutsuwhichmeanstobeattheactualplaceandobserveinordertogainunderstandingoftheprocess(Liker,2004).Qualitative interviews are used to gather qualitative data, such interviews can either beunstructuredorsemi-structured(BrymanandBell,2003).Doingqualitativeinterviewisnotasstructuredasquantitativeinterviews,whenthesetofquestionstobeaskedisveryclear(BrymanandBell, 2003). Instead, inqualitative interviews, is itmore interestingwhat theinterviewobjectthinks, talkingbesidesthetopic isencouragedbecause itviewswhatthatperson perceives as important (Bryman and Bell, 2003). When doing a semi-structuredinterviewhastheresearcherspreparedquestionsonthetopicthatisdesiredtobecoveredintheinterview.Thislistofquestionsisnottheschedulefortheinterviewthough,sincenewquestionsmaybeaskedbasedontheinterviewee’spreviousanswer.Theinterviewsinthisthesishavebeenofsemi-structuredcharacterinordertofindoutwhattheintervieweeseesas important. The stakeholders that have been interviewed have been selected through
13
snowballsampling,whichmeansthatnextinterviewisbasedonthefindingsofthecurrentinterview.Quantitativedataofrelevancehasalsobeencollected,suchasfinancialdataandprojectdata (hours spent inproject, amountofprojectsper year,etc.). Thisdatawas thebasisforcalculationsdoneintheanalyzephase.
3.4 ActionresearchBryman and Bell (2003) states that action research can be defined broadly as when theresearchersworktogetherwithanotherstakeholder fromtheorganizationbothtosolveaproblem and to find a solution to that problem. Action research aims to give continuouslearningtobothcontributorsintheproblemsolving.Theproblemsinquestionarerealthatanorganizationhasanddoingactionresearchgeneratesbothacademictheoryandactionsfor theorganization tomake (BrymanandBell,2003).Thismaster thesishasbeencarriedoutasanactionresearch.ThecurrentsituationatFlexLinkhasbeenmapped,bythehelpofrelevant theory and key stakeholders in the organization have problems been defined.Finallyhasappropriate improvementsuggestionsbeenmade.Thesuggestionswereupfordiscussion with selected stakeholders and were then either discarded or subject fordevelopment.Thestateofthecompanywasthuschangedduringthethesis,meaningthatrepeatingtheexactsameresearchwouldnotgeneratethesameresult.
3.5 ThreepointestimationThree point estimation is a tool that can be used to make the first estimations andpredictions,whenthere isnoreliabledataavailable.Hammersberg (n.d.)states that threepoint estimation can be used when there is variability in the data and it is desired toestimatethemeanandvariation.Thismethodincludesthreevariables:a,bandm.Variableaisthemostoptimisticvaluethatcanhappen.Forexamplethemostoptimisticcasewithanoccurrence rate of 1/1000. Variable b is the most pessimistic value, with the sameoccurrenceasvariablea.Variablemisthemostlikelyvaluetooccur.Theexpectedvalueisthengivenbytheformula:
! = $ + 4' + (6
Thereasonforusingthisestimationisthattheexpectedvalueewillbebiggerthanthemostlikelyvaluem.Thatisbecausethemostlikelyvalueisnotinthemeanoftheoptimisticandpessimisticvariables.(Kerzner,1998) Threepointestimationwasusedfrequentlythroughouttheprojectasamethodtoestimatearoughdistributionofthedatawhenrealdataisnotpossibletocollect.Thevariablesa,bandmwerefilled in foreachprocessstep.Thevaluesweredeterminedtogetherwiththeprojectengineers.Thecalculationsgave theestimatedcycle time foreachprocessstepaswellasanestimationfortheaverageprojectleadtime.

14
15
4 DefineTheaimoftheDefinephasewastounderstandtheorganizationandthehigh-levelprocess,itssuppliers,customersandcustomerrequirementsaswellasgettingabroaderviewoftheproblem.ThiswasdonebyacombinationofusingLSStoolsandgatheringofqualitativedatathrough interviews, observations and Gemba walks. The focus during the conductedinterviewsandobservations intheDefinephasewastogatherthecustomerrequirementsandidentifyproblematicactivitiesintheengineeringprojects.
4.1 CompanystructureFlexLinkisdividedintoseveraldifferentsubsidiaries.ThesubsidiariesthatwereofinteresttothisthesisweretheoperatingunitsandPSD(Product&SupplyDivision).Theoperatingunitsare the subsidiarieswhereall theoperationalwork takesplace. This iswhereengineeringprojectsare sold,designedandassembled.Theoperatingunitsare strategically located inseveraldifferentcountries inordertohaveclosecontactwiththe localmarket.PSD is thedeveloper, producer and supplier of all FlexLink material and is where new productplatformsaredeveloped.PSDalsohaveunitsindifferentcountries,howevernotasmanyastheoperatingunits.
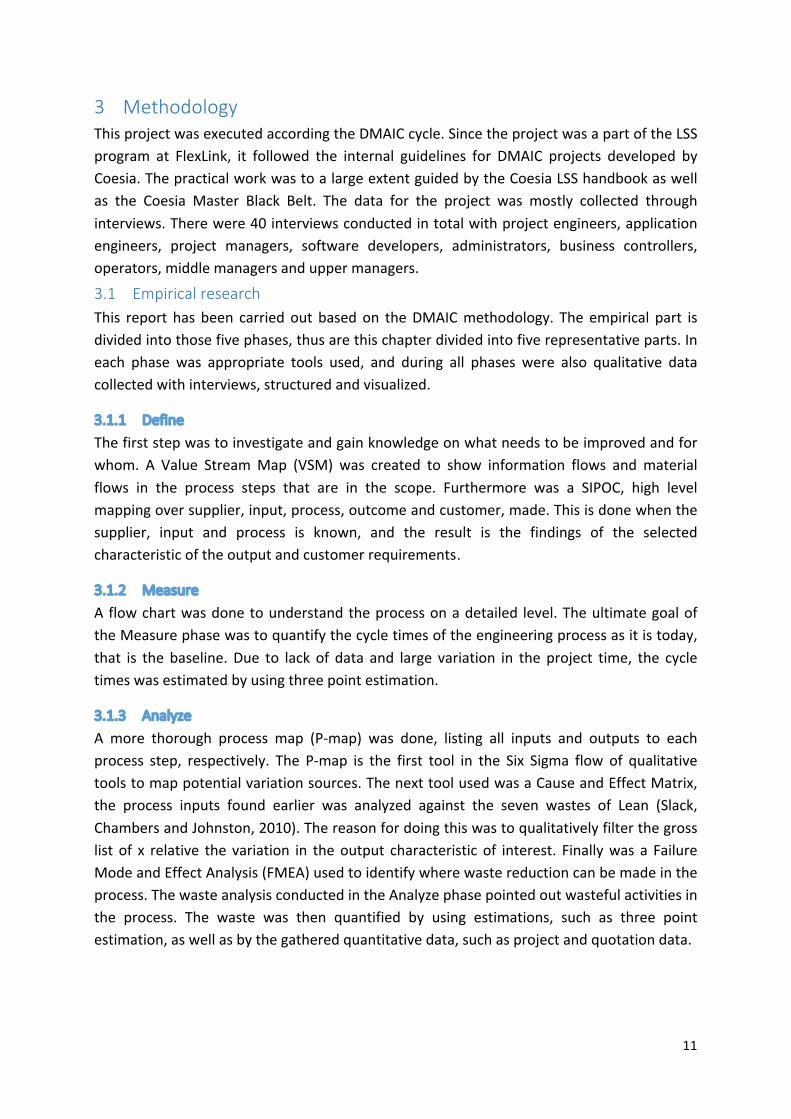
Figure1showstheoverallfunctionsofanoperatingunit.TheprocessstartswithsalesandUser Requirement Specification (URS) which are the customer needs translated intospecification.TheURSinformationisthenpassedtoApplicationEngineering(AE).AconceptoftheconveyorsystemisdevelopedbytheapplicationengineersbasedontheURS.Iftheorderiswon,aninternalengineeringprojectisstartedandtheconceptproceedstoProjectEngineering(PE)wheretheentireconveyorsystemisdesignedindetail.Assemblydrawingsare delivered from the engineering phase to the assembly phase, so that the conveyorsystemcanbeassembled.Thefinalstepis installationatcustomersite,whichisanoptionforthecustomer.ThereisalsoaProjectManagement(PM)phasewhichrunsinparallelwiththeotherphases.
Figure 1
16
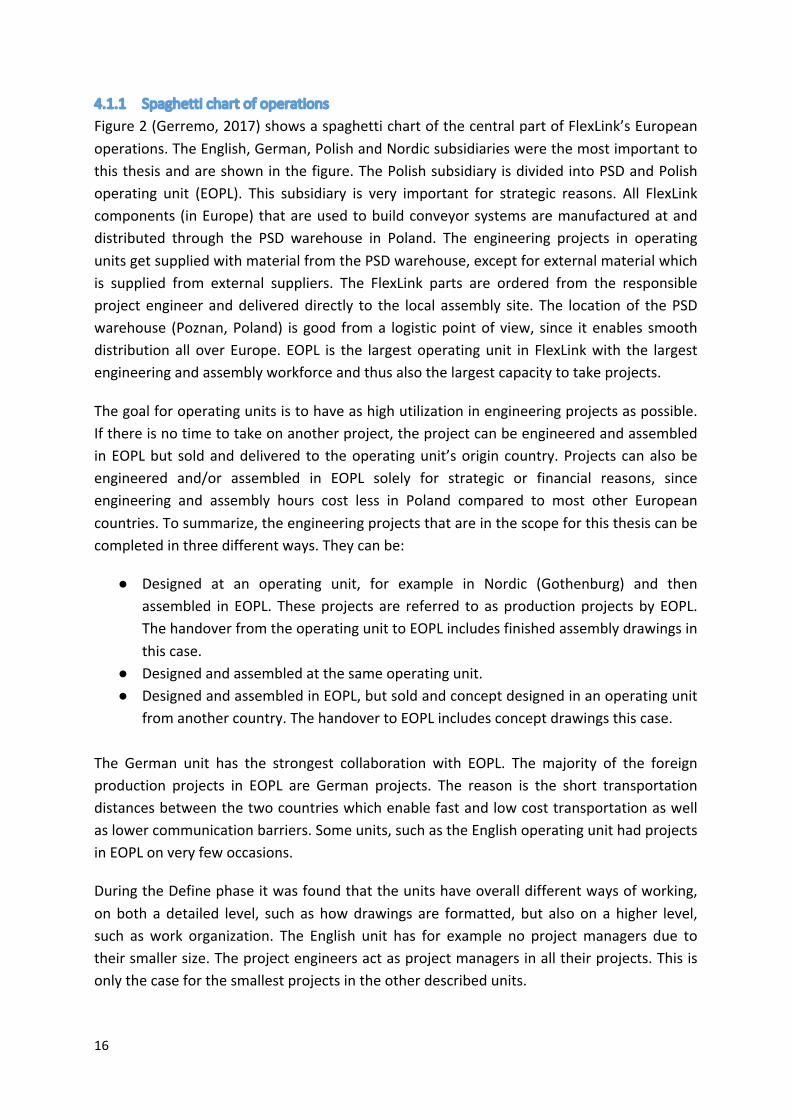
4.1.1 SpaghettichartofoperationsFigure2(Gerremo,2017)showsaspaghettichartofthecentralpartofFlexLink’sEuropeanoperations.TheEnglish,German,PolishandNordicsubsidiarieswerethemostimportanttothisthesisandareshowninthefigure.ThePolishsubsidiaryisdividedintoPSDandPolishoperating unit (EOPL). This subsidiary is very important for strategic reasons. All FlexLinkcomponents (inEurope)thatareusedtobuildconveyorsystemsaremanufacturedatanddistributed through the PSD warehouse in Poland. The engineering projects in operatingunitsgetsuppliedwithmaterialfromthePSDwarehouse,exceptforexternalmaterialwhichis supplied from external suppliers. The FlexLink parts are ordered from the responsibleprojectengineeranddelivereddirectly to the local assembly site. The locationof thePSDwarehouse (Poznan,Poland) isgood froma logisticpointofview, since itenables smoothdistributionall over Europe. EOPL is the largestoperatingunit in FlexLinkwith the largestengineeringandassemblyworkforceandthusalsothelargestcapacitytotakeprojects.
Thegoalforoperatingunitsistohaveashighutilizationinengineeringprojectsaspossible.Ifthereisnotimetotakeonanotherproject,theprojectcanbeengineeredandassembledinEOPLbut soldanddelivered to theoperatingunit’sorigin country.Projects canalsobeengineered and/or assembled in EOPL solely for strategic or financial reasons, sinceengineering and assembly hours cost less in Poland compared to most other Europeancountries.Tosummarize,theengineeringprojectsthatareinthescopeforthisthesiscanbecompletedinthreedifferentways.Theycanbe:
● Designed at an operating unit, for example in Nordic (Gothenburg) and thenassembled inEOPL. Theseprojects are referred toasproductionprojectsbyEOPL.ThehandoverfromtheoperatingunittoEOPLincludesfinishedassemblydrawingsinthiscase.
● Designedandassembledatthesameoperatingunit.● DesignedandassembledinEOPL,butsoldandconceptdesignedinanoperatingunit
fromanothercountry.ThehandovertoEOPLincludesconceptdrawingsthiscase.The German unit has the strongest collaboration with EOPL. The majority of the foreignproduction projects in EOPL are German projects. The reason is the short transportationdistancesbetweenthetwocountrieswhichenablefastandlowcosttransportationaswellaslowercommunicationbarriers.Someunits,suchastheEnglishoperatingunithadprojectsinEOPLonveryfewoccasions.
DuringtheDefinephaseitwasfoundthattheunitshaveoveralldifferentwaysofworking,onboth a detailed level, such as howdrawings are formatted, but alsoon a higher level,such aswork organization. The English unit has for example no projectmanagers due totheirsmallersize.Theprojectengineersactasprojectmanagersinalltheirprojects.Thisisonlythecaseforthesmallestprojectsintheotherdescribedunits.
17
Figure 2
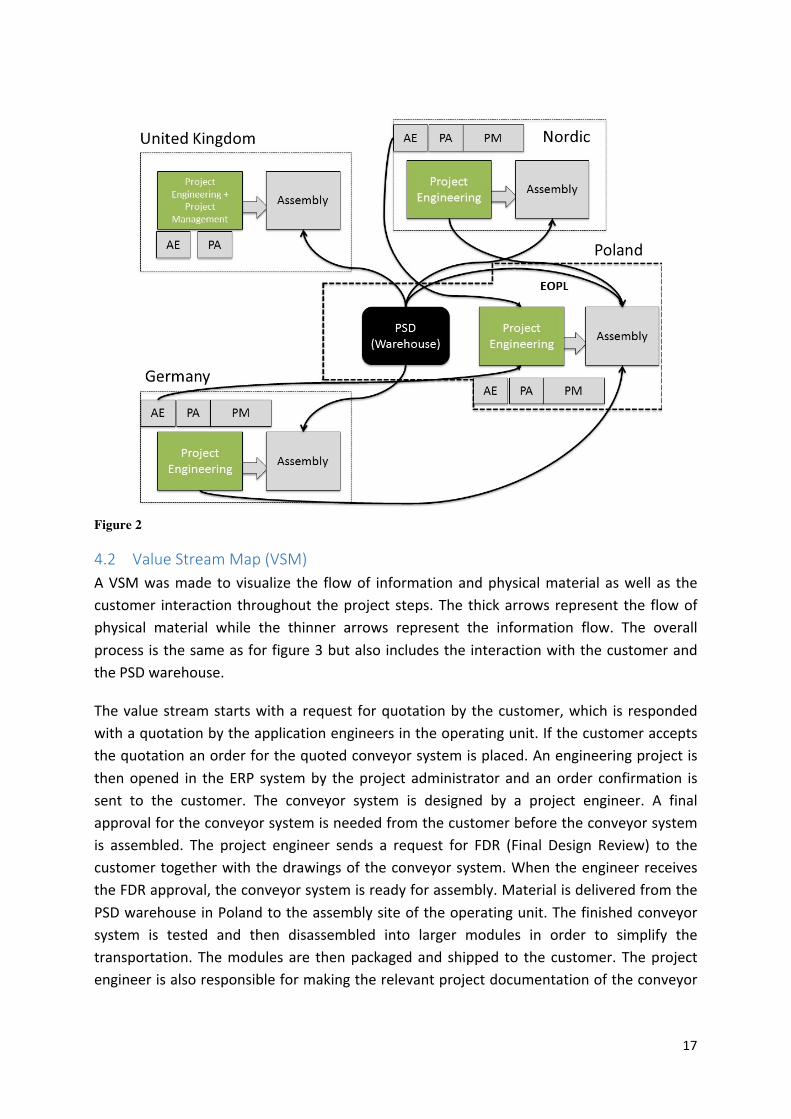
4.2 ValueStreamMap(VSM)AVSMwasmade tovisualize the flowof informationandphysicalmaterialaswell as thecustomer interaction throughout theproject steps.The thickarrows represent the flowofphysical material while the thinner arrows represent the information flow. The overallprocessisthesameasforfigure3butalsoincludestheinteractionwiththecustomerandthePSDwarehouse.
Thevaluestreamstartswitharequest forquotationbythecustomer,which is respondedwithaquotationbytheapplicationengineersintheoperatingunit.Ifthecustomeracceptsthequotationanorderforthequotedconveyorsystemisplaced.Anengineeringprojectisthenopened in theERP systemby theproject administrator andanorder confirmation issent to the customer. The conveyor system is designed by a project engineer. A finalapprovalfortheconveyorsystemisneededfromthecustomerbeforetheconveyorsystemis assembled. The project engineer sends a request for FDR (Final Design Review) to thecustomertogetherwiththedrawingsoftheconveyorsystem.WhentheengineerreceivestheFDRapproval,theconveyorsystemisreadyforassembly.MaterialisdeliveredfromthePSDwarehouseinPolandtotheassemblysiteoftheoperatingunit.Thefinishedconveyorsystem is tested and then disassembled into larger modules in order to simplify thetransportation.Themodulesare thenpackagedand shipped to thecustomer.Theprojectengineerisalsoresponsibleformakingtherelevantprojectdocumentationoftheconveyor
18
system, such as spare part lists and operating manuals that are sent to the customertogetherwiththeconveyorsystem.
AtthisstageitwasrealizedthatthecycletimesintheVSMwouldbehardtomeasure,sinceeveryprojectisuniqueandthereisalargevariationinthecycletimesbetweenprojectsforthisreason.Furthermore,itwasfoundthattherecouldbeseveraldaysofwaitingtimeforgetting theFDRapprovalby thecustomer.This canbeannoying for theprojectengineerssincetheyhavetoswitchovertootherprojectsmeanwhilewaiting.
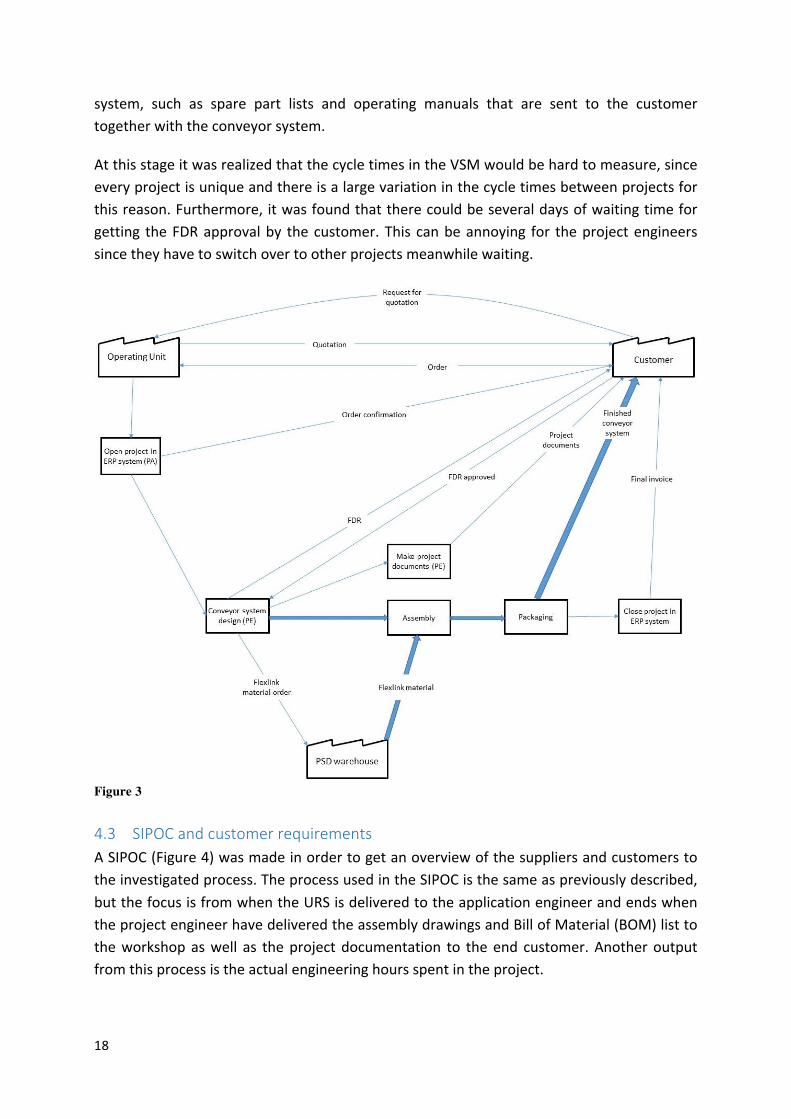
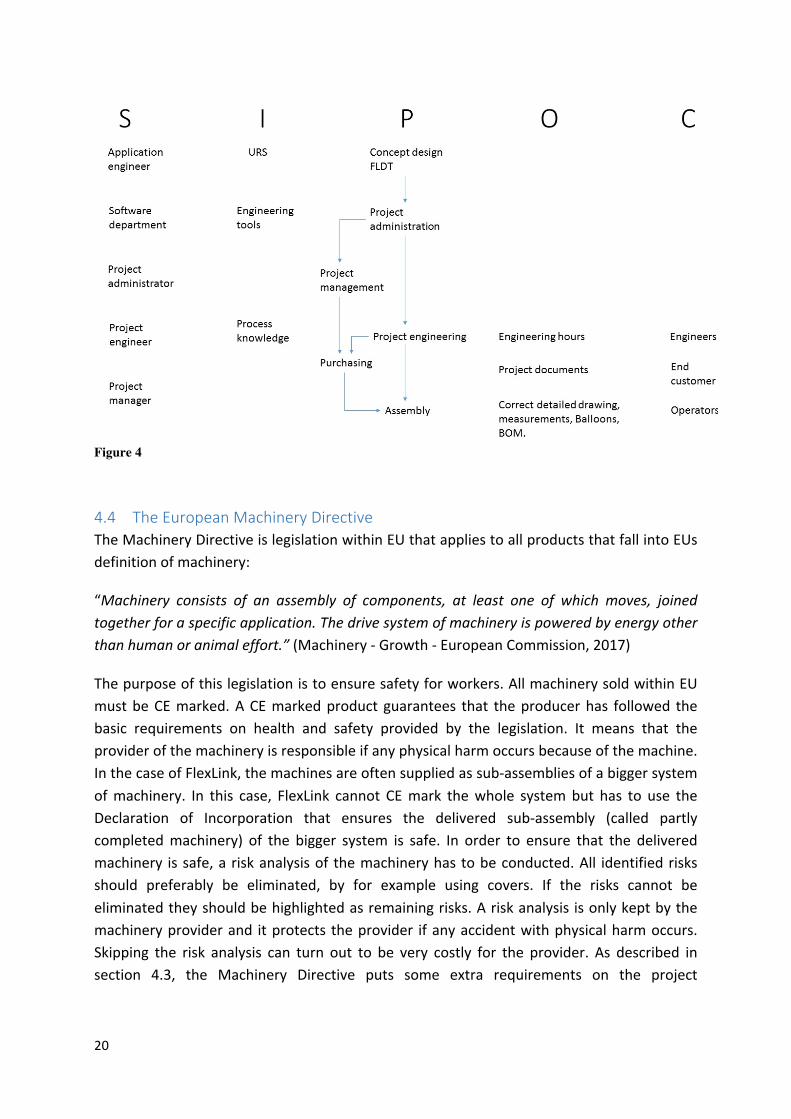
Figure 3 4.3 SIPOCandcustomerrequirementsASIPOC(Figure4)wasmadeinordertogetanoverviewofthesuppliersandcustomerstotheinvestigatedprocess.TheprocessusedintheSIPOCisthesameaspreviouslydescribed,butthefocusisfromwhentheURSisdeliveredtotheapplicationengineerandendswhentheprojectengineerhavedeliveredtheassemblydrawingsandBillofMaterial(BOM)listtotheworkshopaswell as theprojectdocumentation to theend customer.Anotheroutputfromthisprocessistheactualengineeringhoursspentintheproject.
19
Therewerethree identifiedcustomers for thisprocess; the firstcustomer is theengineersthat work with the process. Their requirement on the process output is to complete theengineeringprojectswithasfewhoursaspossible.Thesecondcustomer istheoperatorsworking intheworkshops.Therequirementsontheprocessoutputfromtheoperatorsare:
• Correctdrawingswithsufficientdetaillevel.• Sufficientmeasurementsinthedrawings.• Numbered“balloons”inthedrawingsforconnectingeachcomponentinthedrawing
withthecorrespondingpartintheBOMlist(Forexampleabeamwithnumber15intheBOMlistshouldhavethesamenumberinthedrawing,pointedtoitsposition).
Thethirdcustomerforthisprocessistheendcustomerthatreceivesprojectdocumentationalongwiththephysicalproduct.Thisdocumentationconsistsofasparepart list,operatingmanualsandaDeclarationofIncorporation.ThelatterisarequirementfromtheEuropeanMachineryDirective(discussedinsection4.4below),whichalsoputssomerequirementsonthe project documentation. The requirements from the end customer and MachineryDirectiveontheprocessoutputare:
• Correctsparepartlistwithpricesforallparts.• Relevantoperatingmanualsforthedeliveredconveyorsystem.• A Declaration of Incorporation should not be delivered without conducting a risk
analysisoftheconveyorsystem(MachineryDirective).• Operatingmanualsmustbe in the languageusedby theendcustomer (Machinery
Directive).
20
Figure 4
4.4 TheEuropeanMachineryDirectiveTheMachineryDirectiveislegislationwithinEUthatappliestoallproductsthatfallintoEUsdefinitionofmachinery:
“Machinery consists of an assembly of components, at least one of which moves, joinedtogetherforaspecificapplication.Thedrivesystemofmachineryispoweredbyenergyotherthanhumanoranimaleffort.”(Machinery-Growth-EuropeanCommission,2017)
Thepurposeofthislegislationistoensuresafetyforworkers.AllmachinerysoldwithinEUmustbeCEmarked.ACEmarkedproduct guarantees that theproducerhas followed thebasic requirements on health and safety provided by the legislation. It means that theproviderofthemachineryisresponsibleifanyphysicalharmoccursbecauseofthemachine.InthecaseofFlexLink,themachinesareoftensuppliedassub-assembliesofabiggersystemofmachinery. In this case, FlexLink cannot CEmark thewhole systembut has to use theDeclaration of Incorporation that ensures the delivered sub-assembly (called partlycompletedmachinery) of the bigger system is safe. In order to ensure that the deliveredmachinery issafe,ariskanalysisof themachineryhastobeconducted.All identifiedrisksshould preferably be eliminated, by for example using covers. If the risks cannot beeliminatedtheyshouldbehighlightedasremainingrisks.Ariskanalysis isonlykeptbythemachineryproviderand itprotects theprovider ifanyaccidentwithphysicalharmoccurs.Skipping the risk analysis can turn out to be very costly for the provider. As described insection 4.3, the Machinery Directive puts some extra requirements on the project
21
documentation delivered to the end customer. (Declaration of Incorporation - Workequipmentandmachinery,n.d.)
4.5 EngineeringtoolsTherearedifferentengineeringtoolsthatareinputstotheinvestigatedprocess.Thesecanbegroupedinto:Designtools,Quotationtools,CADtools,OnlinetoolsandCalculationtools.Theengineering toolswerea centralpartof this thesisproject, since theefficiencyof theengineering process is highly dependent on the performance and utilization of theengineering tools. These tools have been developed over a longer time period andwereinitiallysimplesupporttools.Theyhavenowevolvedtoincludemoreadvancedfunctionalitytosimplifytheengineeringprocess.Theengineeringtoolsaredevelopedandmaintainedbythe softwaredevelopmentdepartment that is locatedwithin the FlexLinkheadquarters inGothenburg, Sweden. The tools that are important inputs to the process were identifiedduringGembawalksandinterviewsandaredescribedbelow.
4.5.1 FlexLinkQuotationToolFlexLinkQuotationTool (FLQT) isusedtomakeprojectcalculationsandcreatequotations.FLQT is mostly used by application engineers but also by project managers and projectengineerstokeeptrackofprojectdatasuchasbudgetedhours,actualhoursspent,projectmargin,etc.
4.5.2 FlexLinkDesignToolFlexLink Design Tool (FLDT) is used to design conveyor systems containing only FlexLinkmaterial by a simple drag and drop functionality. FLDT is mostly used by applicationengineerswhenmakingconceptlayoutsandprojectengineersforsimpleprojects.Itcannothandle design of external parts since it is not a CAD program, but is much faster whendesigning concepts or conveyor systemswith only FlexLinkmaterial. It features logic anddesign ruleswhich prevents from designing inaccurate conveyor systems. Furthermore, italso keeps track of each and every part that is a part of the whole assembly and it canautomaticallygenerateaccurateBOMlists.ItispossibletodesignentiresystemsandmakeassemblydrawingsbyonlyusingFLDTforsimpleprojectsthatonlycontainFlexLinkmaterial,thusshorteningtheprojectengineeringtimebyasignificantamountcomparedtoonlyusingCAD.ItisthereforeagoalforFlexLinktoutilizeFLDTasmuchaspossible,CADshouldonlybeusedwhennecessary.
4.5.3 FlexCADFlexCADisaCADlibrarythatisusedasapluginforInventorandAutoCAD.FlexCADprovidesstandardparts andmodules that canbe imported into the3Dmodel, so themodularizedstandardparts in theFlexLinkproduct cataloguedonothave tobedesigned fromscratcheverytime.Italsofeatureslogicwhichcanautomaticallycalculateandassisttheuserwithrelevant information. FlexCAD keeps track of the parts used and can thus also generateaccurateBOMlists.FlexCADisthemostfrequentlyusedCADlibraryinthecompany.
22
4.5.4 FlexLinkOnlineStoreFlexLinkOnlineStoreisusedtoorderFlexLinkmaterial.Itismostlyusedbyprojectengineerswho was responsible for the drawings but can also be used directly by end customers.CustomersmayhavedifferentpricesforcomponentsbasedontheirimportancetoFlexLink.ThereisaconnectionbetweentheOnlineStoreandFLDT/FlexCAD,meaningthataBOMlistcanbeexporteddirectlytotheOnlineStorefromthe3Dmodel.TheEuropeanordersintheonlinestoreareprocessedfromthePSDwarehouseinPoland.
4.6 ExpandingproblemknowledgeAtthispointintheDefinephase,theresearchershadgottenenoughinformationaboutthestructureof thecompanyandtheprocessbythedifferentLSStools thatwereused.Sincetheaimwastoreducetheengineeringhours,theresearchershadtoexpandtheknowledgeabout the actual problem. This was done by interviews, observations and Gemba walks,whiletheLSStoolshelpedtoidentifythecustomerrequirements.TheNordicoperatingunitwasthemainfocus,buttripsweremadetothePolishandEnglishunitstoconductthesameinterviewsandobservations.TheGermanunitwasalsoconsidered,butinterviewswereheldduringconferencesessionsinGothenburgandPoznan.Atthisstage,theinterviewsfocusedonareasthatnegativelyaffect theengineeringtimeandotherareasthatareperceivedasproblematicbytheengineers,operatorsandengineeringmanagers.
Oneareathatgotattentionwasthatreworksometimesoccurswhenengineeringprojectsareput inEOPL forassembly. In somecases, thedrawings receivedbyEOPLdonotmeettheirqualitystandardandaredeemedtobelackingimportantinformation.Inthiscase,thedetailed conveyordesign ismade from thebeginningbyengineers at EOPL,meaning thatthe same work is done twice. The operating unit that sent the drawings are then ofteninvoiced for theextrahours.Theengineeringmanagerat theNordicoperatingunit statedthat there are communication barriers between them and EOPL. There are for exampleinternal procurements between the units when projects are handed over and theysometimeshavetoargueoverthebudgetedhours.
AnotherproblemisthatEOPLandtheGermanoperatingunituseanotherCADlibrary,whichisnotcompatiblewithFlexCAD.SincemostotheroperatingunitsuseFlexCAD,CADfilessentbetweenEOPLandotherunitscannotbeedited.Theengineersat theNordicunitpointedoutthatthereisalackofworkstandardandguidelines.Engineerswouldforexamplesaveprojectfiles indifferentwaysandatdifferent locations,whichmakesitharderforanotherengineer to go back to that project later. Furthermore, itwas found that an overall issuewithintheorganization is thatalloperatingunitshavedevelopedtheirownprocessesandtheirowntoolstoaidtheprocesses,andthatthereisamindsetsometimestoprioritizethebenefitofthelocalunittotheexpenseofthewholeorganization.
Mostoftheengineersperceivedtheworkofmakingtheprojectdocumentationastiresomeand repetitive. This was also one of the reasons for saving them for last. The same
23
information has to be put in several different times to the different documents.Furthermore, every unit has developed their ownway ofmaking the project documents.Someusedifferentsoftwareorself-developedexceltoolsfordifferentsteps.Interviewswithhighermanagersrevealedthattheissuethateveryunithasdevelopedtheirown processes has caused problems for the company in the past. FlexLink is a flexibleorganizationwherepeoplefromdifferentunitscanrotatebetweenunitsandgoforshorterjobstoaunitthatisheavilyloaded.However,theyhaveexperiencedlonglearningperiodswhenpersonnelhaveshiftedbetweentheunitsbecauseofthattheyworksodifferently.
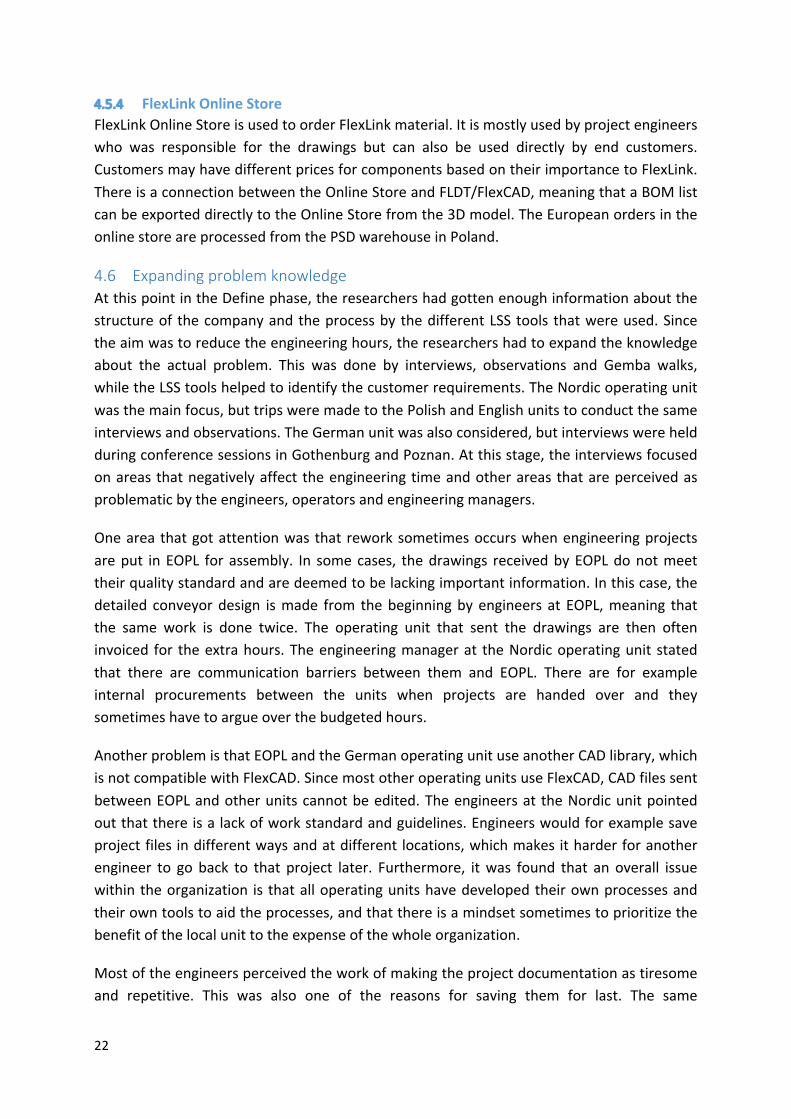
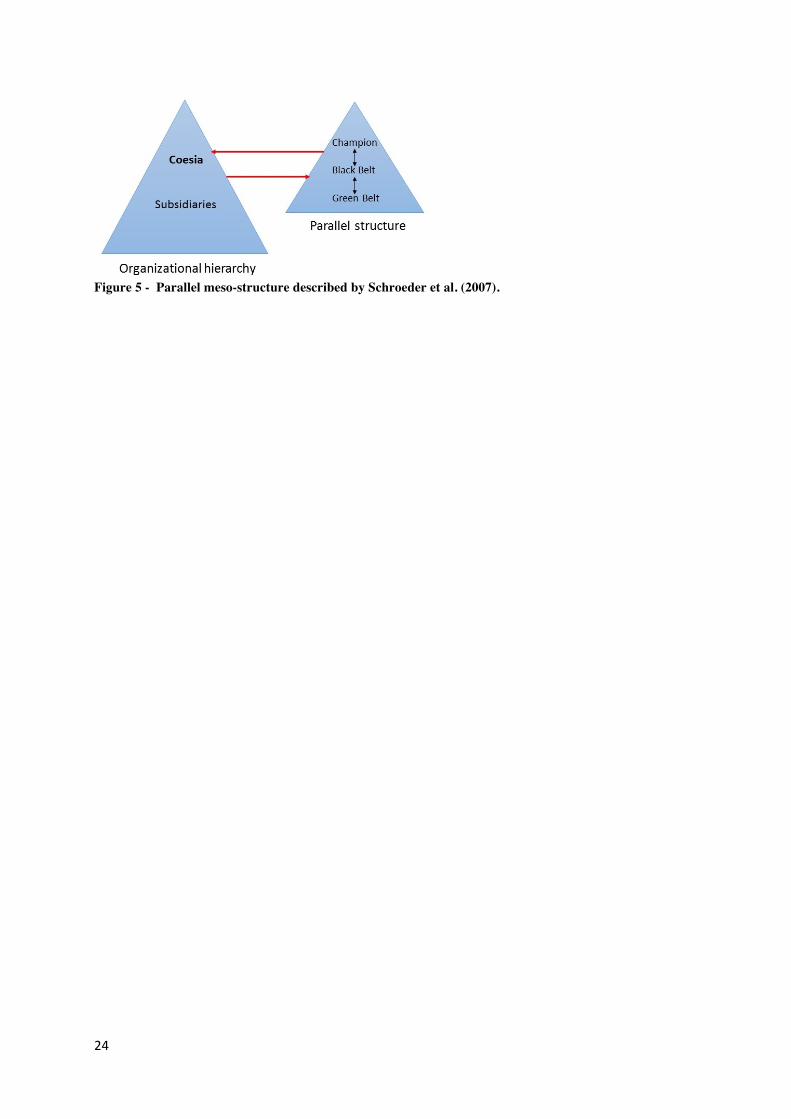
4.7 LSSCultureatFlexLinkandCoesiaCoesiahasdeployedLSSasaglobalimprovementprogramtoallsubsidiaries.ThepurposeofLSS at Coesia is to guide its subsidiaries towards a continuous change and improvementcycle. The LSS culture iswell establishedwithin the company and there are a substantialamountofimprovementprojectsonbothGreenandBlackBeltlevelcarriedouteachyear.CoesiaemploystwoMasterBlackBelts(MBB),19BlackBelts(BB)and149GreenBelts(GB)intotalwithinallthesubsidiaries.CoesiaalsorunsaninternalSixSigmaeducationprogram,whereemployeeshavethepossibilitytoattendGBandBBtrainingwithinthecompany.TheeducationisbasedwithintheheadquartersinBologna,Italy,whereemployeesallovertheworldtraveltoparticipateintheeducation.CoesiahasdevelopedprocessesforconductingSixSigmaprojects,aswellastheirownpockethandbookwithhelpfultipsandtools.BlackBelts within Coesia are devoted to improvement projects on full time, while Green Beltsspendaround30%oftheirtimeinimprovementprojects.TheSixSigmaorganizationwithinthe company is a parallel meso-structure, as described by Schroeder et al. (2007). Thefollowing quote from Schroeder et al. (2007, p.5) concludes the usual Six Sigma structurewhich is alsopresent inCoesia: “Six Sigmaprovidesahierarchical structurewhere leaders(Champions) initiate,support,andreviewkey improvementprojects;BlackBelts thenserveasprojectleaderswhomentorGreenBeltsinproblem-solvingefforts.”ThisLSSprojectwascarriedoutaccordingtotheLSSprocessdevelopedbyCoesia.SincethematuritywithinLSSwashighwithinthecompany,itbecameevidentduringtheDefinephasethat therewasnoneedto focuson implementingLLS techniquesorprinciples throughoutthe thesis,but rathermuch focuson improving the initialmetricof theLLSproject,whichwastoreducetheamountofhoursrequiredtocompleteanengineeringproject.TherewasalsofrequentfeedbackandguidancethroughouttheprojectfromtheMBBatCoesiaaswellastheprojectsponsorandBBthesissupervisoratFlexLink.
24
Figure 5 - Parallel meso-structure described by Schroeder et al. (2007).
25
5 MeasureTheMeasurephasefocusedonidentifyingthecurrentstateoftheprocess. Interviewsandobservationsweremadeinordertodefinetheprocess.Aprocessflowchartwasthenmadebasedonthecollecteddata.Theflowchartwaschangedseveraltimesuntilitwasverifiedbytheprojectengineers.Furthermore,theprocesscycletimeswereestimatedusingthethreepointestimation,accordingtosection3.5.Sincenodatawasavailabletocalculatetheactualcycletimesandmeasuringthecycletimeswouldbetootime-consumingfortheengineers,theonlyoptionwastoproceedwithestimations,becausetheprimaryobjectiveinthisstagewastocreateaprocessoverviewanditsstructure.
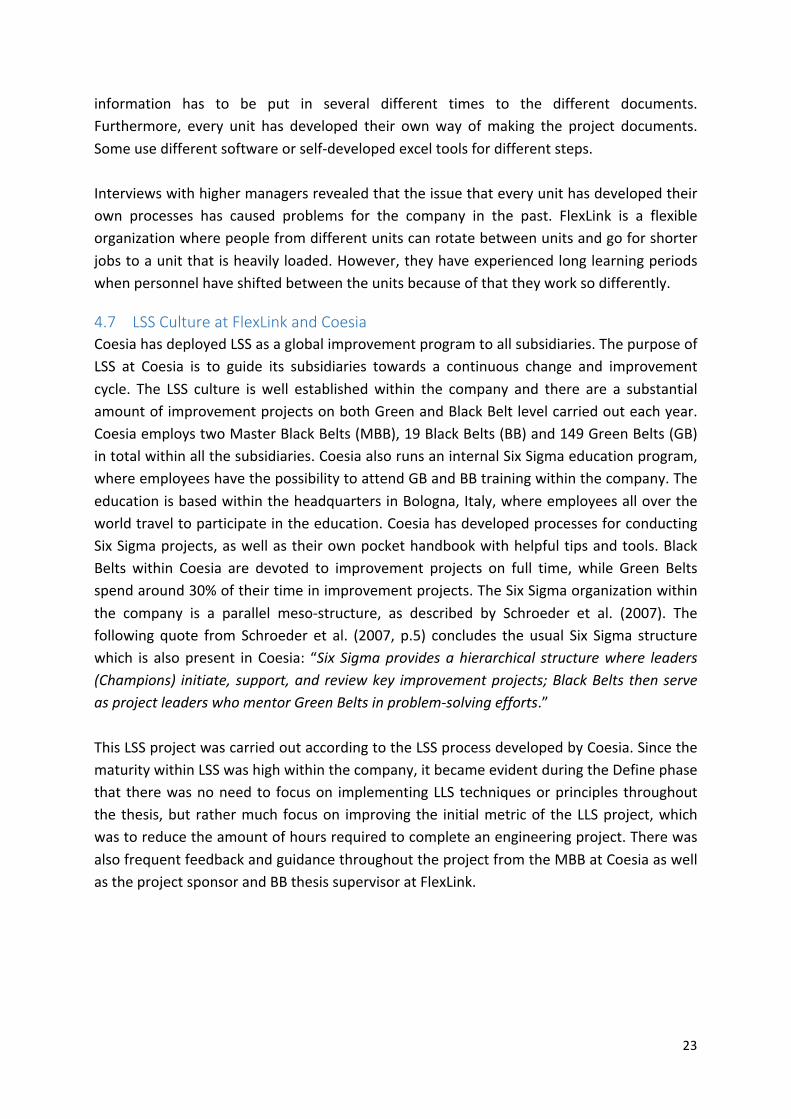
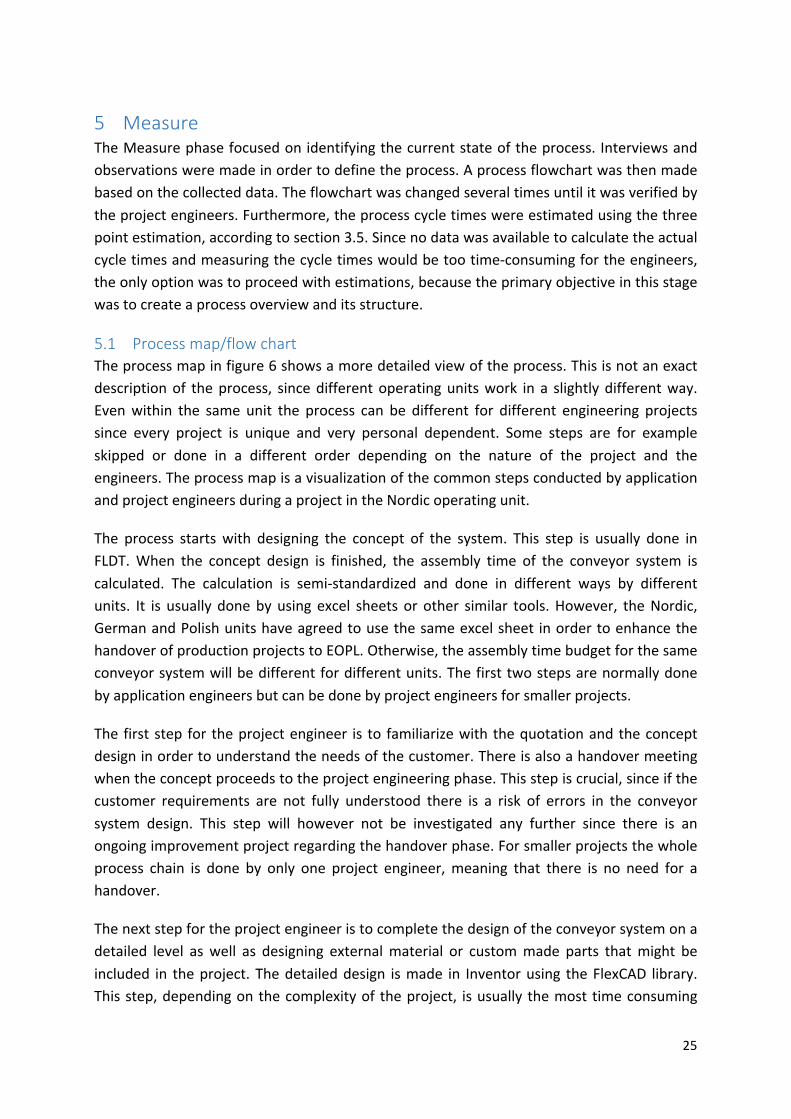
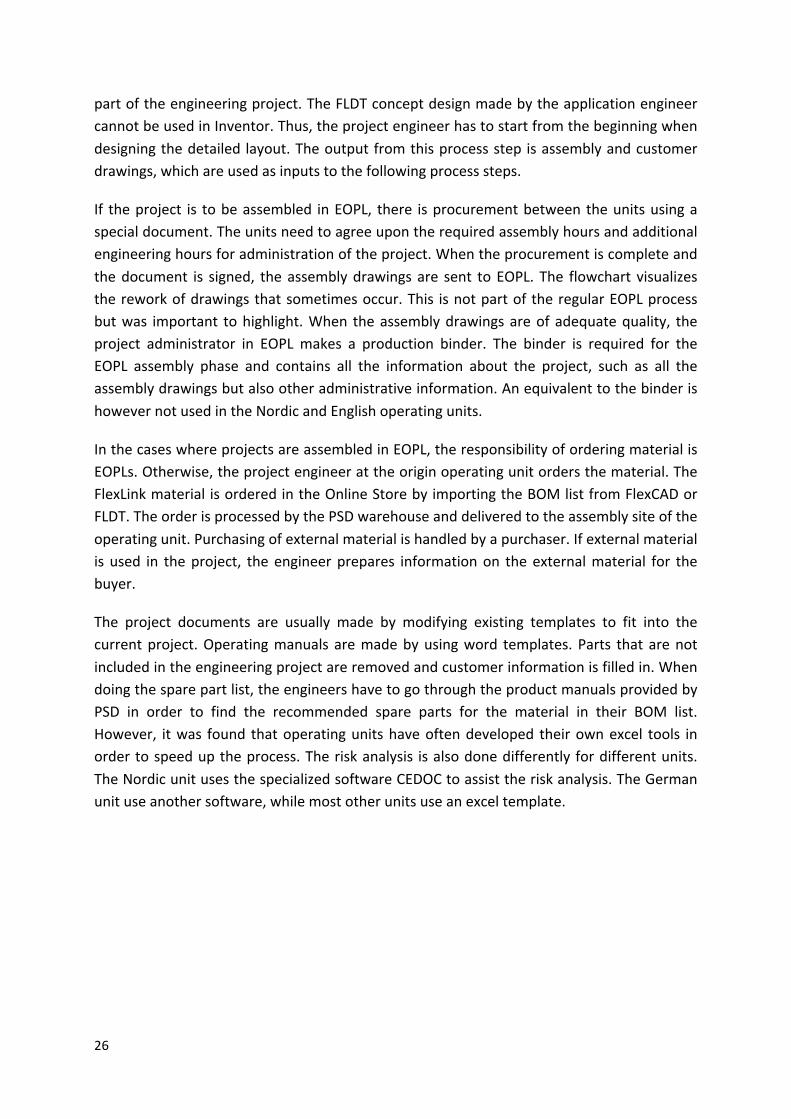
5.1 Processmap/flowchartTheprocessmapinfigure6showsamoredetailedviewoftheprocess.Thisisnotanexactdescriptionof theprocess, sincedifferentoperatingunitswork in a slightlydifferentway.Evenwithin the same unit the process can be different for different engineering projectssince every project is unique and very personal dependent. Some steps are for exampleskipped or done in a different order depending on the nature of the project and theengineers.TheprocessmapisavisualizationofthecommonstepsconductedbyapplicationandprojectengineersduringaprojectintheNordicoperatingunit.
The process startswith designing the concept of the system. This step is usually done inFLDT.When the concept design is finished, the assembly time of the conveyor system iscalculated. The calculation is semi-standardized and done in different ways by differentunits. It is usually donebyusing excel sheets or other similar tools.However, theNordic,GermanandPolishunitshaveagreedtousethesameexcelsheet inordertoenhancethehandoverofproductionprojectstoEOPL.Otherwise,theassemblytimebudgetforthesameconveyorsystemwillbedifferentfordifferentunits.Thefirsttwostepsarenormallydonebyapplicationengineersbutcanbedonebyprojectengineersforsmallerprojects.
The firststep for theprojectengineer is to familiarizewiththequotationandtheconceptdesigninordertounderstandtheneedsofthecustomer.Thereisalsoahandovermeetingwhentheconceptproceedstotheprojectengineeringphase.Thisstepiscrucial,sinceifthecustomer requirements are not fully understood there is a risk of errors in the conveyorsystem design. This step will however not be investigated any further since there is anongoingimprovementprojectregardingthehandoverphase.Forsmallerprojectsthewholeprocess chain is done by only one project engineer,meaning that there is no need for ahandover.
Thenextstepfortheprojectengineeristocompletethedesignoftheconveyorsystemonadetailed level aswell as designing externalmaterial or custommade parts thatmight beincluded in theproject.Thedetaileddesign ismade in Inventorusing theFlexCAD library.Thisstep,dependingonthecomplexityof theproject, isusually themosttimeconsuming
26
partoftheengineeringproject.TheFLDTconceptdesignmadebytheapplicationengineercannotbeusedinInventor.Thus,theprojectengineerhastostartfromthebeginningwhendesigningthedetailed layout.Theoutputfromthisprocessstep isassemblyandcustomerdrawings,whichareusedasinputstothefollowingprocesssteps.
If theproject is tobeassembled inEOPL, there isprocurementbetweentheunitsusingaspecialdocument.Theunitsneedtoagreeupontherequiredassemblyhoursandadditionalengineeringhoursforadministrationoftheproject.Whentheprocurementiscompleteandthedocument is signed, theassemblydrawingsare sent toEOPL. The flowchart visualizesthereworkofdrawingsthatsometimesoccur.This isnotpartoftheregularEOPLprocessbutwas important tohighlight.When theassemblydrawingsareofadequatequality, theproject administrator in EOPL makes a production binder. The binder is required for theEOPL assembly phase and contains all the information about the project, such as all theassemblydrawingsbutalsootheradministrativeinformation.AnequivalenttothebinderishowevernotusedintheNordicandEnglishoperatingunits.
InthecaseswhereprojectsareassembledinEOPL,theresponsibilityoforderingmaterialisEOPLs.Otherwise,theprojectengineerattheoriginoperatingunitordersthematerial.TheFlexLinkmaterial isorderedintheOnlineStorebyimportingtheBOMlistfromFlexCADorFLDT.TheorderisprocessedbythePSDwarehouseanddeliveredtotheassemblysiteoftheoperatingunit.Purchasingofexternalmaterialishandledbyapurchaser.Ifexternalmaterialis used in theproject, theengineerprepares informationon theexternalmaterial for thebuyer.
The project documents are usually made by modifying existing templates to fit into thecurrentproject.Operatingmanuals aremadebyusingword templates.Parts that arenotincludedintheengineeringprojectareremovedandcustomerinformationisfilledin.Whendoingthesparepartlist,theengineershavetogothroughtheproductmanualsprovidedbyPSD in order to find the recommended spare parts for the material in their BOM list.However, itwas found thatoperatingunitshaveoftendeveloped theirownexcel tools inordertospeeduptheprocess.Theriskanalysis isalsodonedifferently fordifferentunits.TheNordicunitusesthespecializedsoftwareCEDOCtoassisttheriskanalysis.TheGermanunituseanothersoftware,whilemostotherunitsuseanexceltemplate.
27
Figure 6 5.2 BaselineandfinancialmodelAfinancialmodelfortheLSSprojectwasdevelopedbythefinancedepartmentatFlexLink.Itwas used as a baseline for the engineering hours spent in projects as well as a tool forcalculating potential cost savings by cutting engineering time. There were in total 1855projects in Europe during 2015. 1336 of those projects qualified as small projects,with arevenue below 25000€. The 1336 small projects had in total 24868 engineering hours.According to the data in the financial model, the average small project had around 18.6hoursofengineeringtime.There were 112 362 engineering hours when all the 1855 projects were included in thecalculation.Thebigdifferenceinhoursfromthesmallprojectscanbeexplainedbythatthelargestprojectsaccountforalargepartofthetotalengineeringhours.Thereasonforthisis
28
thatthe largestprojectsareusuallyveryresourcedemandingbecauseofthemanyspecialfunctionsthatareincluded.Itcouldbeconcludedthatthemajorityoftheprojectsfallintothecategoryofsmallprojects.Thelargeprojectsarefewinnumbersbutaccountformostoftheengineeringhours.Therearealsoprojectsofmediumsize,witharevenuehigherthan25000€butalowamountofexternalmaterialandspecialcomponents.
5.3 ProcesscycletimeestimationIn themeasure phase, the researchers proceededwith the processmapwith the goal tomeasurethecycletimeforeachprocessstepinordertogetanoverviewofwhereprojectengineeringtimeisspent.Thereisalargevariationintheengineeringtimespentinprojectssinceeveryprojectisunique,meaningthatthereisalsoalargevariationinthecycletimeofeachprocessstep.Theengineeringtimespentinprojectsisonlyrecordedonahigherlevel.Thisisdoneinordertocalculatetheefficiencyoftheengineeringdepartment.Thus,therewasnotanyexistingdatathatcouldbeusedtomeasurethecycletimeineachproject.
Itwasdecidedtoestimatethecycletimesbyusingthethreepointestimation(Appendix).Thedata(hours)forthemostlikely,optimisticandpessimisticvaluesforeachprocessstepwerefilledintogetherwithprojectengineersfromtheNordicoperatingunitandwasbasedon their judgementof theprocess.Only smallandmediumsizedprojectswere taken intoconsideration.
Theprocessstepwiththehighestcycletimewasasexpectedthedetailedlayoutdesignandmakingoftheassemblydrawings.Theprocessstepsthatgotthemostattentionduringtheinterviewsatthisstagewasthetimespentworkshopandmakingtheprojectdocuments.Itwasfoundthattheexpectedtimetospendintheworkshopforanengineeringprojectwas1.7hours.Thatincludedboththetimeittooktobookworkshoptimefortheassemblyoftheconveyoraswellasthetimeengineershadtospendintheworkshoptoanswerquestions.Thequestionsweremostlyrelatedtothedrawings.Thereareoftenissuesthatneedfurtherexplanation.Italsohappensthatengineersleaveminordetailsoutonpurposebecausetheyare not sure about the best way to assemble them. The expected time for making theproject documents was around 2.7 hours. Both these process steps were investigatedfurtherinthelaterstagesoftheproject.
Thesumoftheestimatedprocesscycletimesshowedthattheexpectedengineeringtimeofaproject is19hours (thefirst twoprocessstepsareapplicationengineeringtimewhich isnotrecordedintheproject).Thisestimationalsofittedwellwiththeaveragetimecalculatedfromthefinancialmodel,whichwas18.6hours.
29
6 AnalyzeThegoaloftheAnalyzephasewastoidentifythecriticalXfactorsintheprocess,causingthelargepartofthevariationintheengineeringleadtime.AsequenceofqualitativeLSStoolswas used throughout the Analyze phase in order to identify the factors. The sequencestartedwithaP-map.Theoutcomeof theP-mapwasusedas input toaCauseandEffectmatrixandtheoutputfromtheCauseandEffectmatrixwasthenusedasinputtoaFMEA.BasedontheresultoftheFMEA,factorsforfurtherimprovementwerechosen.Thecostsofthesefactorswerealsoquantifiedinordertofacilitatethediscussionwiththestakeholders.
6.1 P-mapP-map(Appendix) isaprocessmap,similartotheflowchart insection5.1,butwithalltheinputs and outputs for all process steps listed. The P-mapwas usedwith the purpose ofidentifyingallprocessinputsthatcanhaveanimpactontheprocess.Itisalsoausefultoolforgettingabetterunderstandingoftheprocessandtherequiredinputsforaprocesssteptobesuccessfullyexecuted.TheinformationintheP-mapwasfilledinbasedontheprocessflowchartandinputsfromprojectengineers.ItisimportanttogettheP-mapright,sincetheinputstotheproceedingtoolsarebasedonthefindingsfromtheP-map.
6.2 CauseandEffectmatrixACauseandEffect(C&E)matrixwasusedtomakeawasteanalysisoftheprocess.ThegoalwastofindthecriticalXfactorstofocustheresearchon.Theprocessinputsidentifiedfromthe P-mapwere used as an input to the Cause and Effectmatrix. The inputs were ratedagainst the sevenwastes fromLean theory inorder toquantify the contributionofwastefromeachfactor.Thefactorswerethensortedbasedontheirscore.
Themostsignificanttypesofwastefoundintheprocesswerereworkandover-processing.Although waiting scored as high as rework, the contribution to high score in waiting iscausedbythenoisefactor“ApprovedFDR”,sinceitcantakeseveraldaysforcustomerstoapprovetheFDRsentbytheprojectengineer.Reworkwasmostlyduetothedrawingsnotbeing sufficientwhileover-processingwasmostly connected tobadprocessdesign. Therewasnowastepresent inthecategoryoverproduction,sincetheengineeringprojectsareapullsystembynature.Thecriteria’sforchoosingthefactorswere:
• High score in the C&EMatrix, thus contributing to a high amount ofwaste in theprocess.
• Possibility to integrate process input into the existing engineering tools, since aninitial goal of the project was to investigate if the engineering tools could beenhancedinordertoimprovetheengineeringprocess.
30
6.3 W-FMEAFMEA (Failure Mode and Effect Analysis) is a systematic approach of identifying andprioritizingqualityriskswithinaprocesswiththegoalof findingquality improvements.deSouza&Carpinetti(2014)presentedtheW-FMEA(Waste-FailureModeandEffectAnalysis),amodifiedFMEAwith the focusonwaste reduction inprocessesby identifying thewastemodes,effectsofwastemodesandcausesofwastemodesforthekeyprocessinputs.
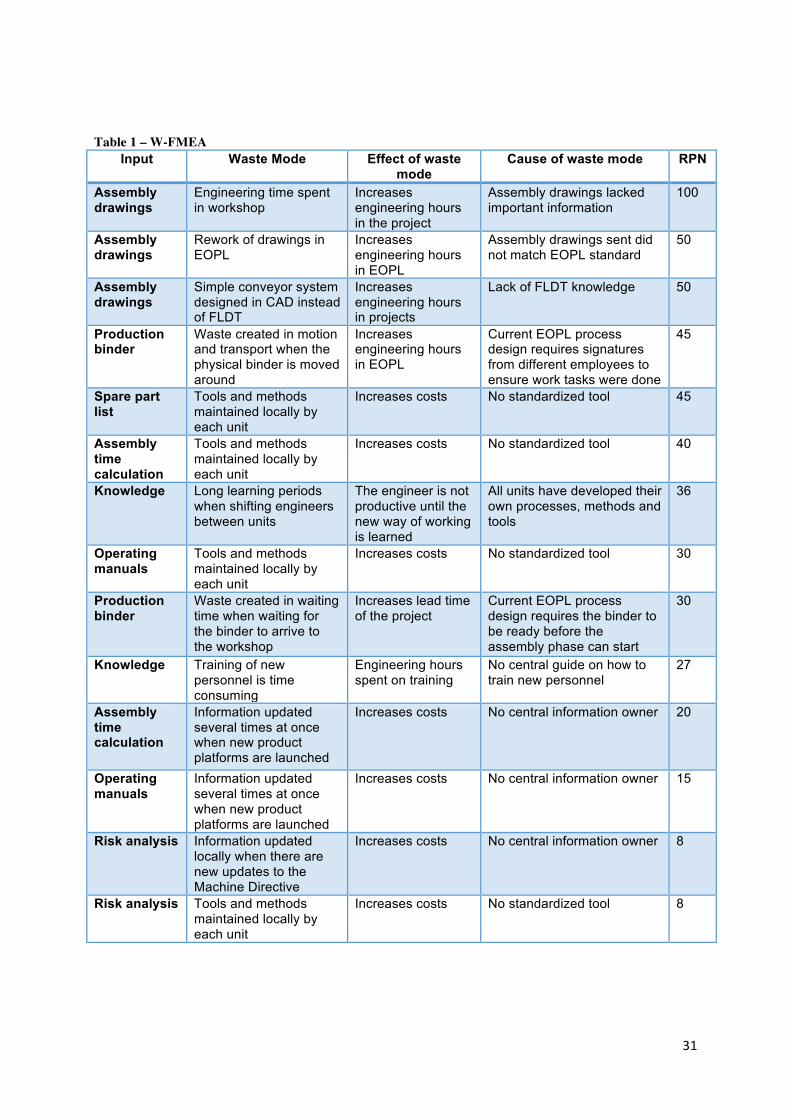
AW-FMEAwasconductedbasedonthemethodologypresentedbydeSouza&Carpinetti(2014).TheprocessinputschosenfromtheCauseandEffectmatrixwereinvestigatedintheW-FMEA.Riskscoreswereassignedtoeachwastemodebasedontheseverity,occurrenceanddetectabilityofthewastemodeeffects.ARiskPriorityNumber(RPN)wascalculatedforeachwastemodebasedontheriskscores.TheinputwiththethreehighestRPNscoreswastheassemblydrawings.Thecorrespondingprocessstephasthelongestcycletimeandisthemaindeliverytoassembly.ThecausesofthewastemodesfortheassemblydrawingswereeitherrelatedtolackofinformationinthedrawingsorlackofFLDTknowledge.Thecausesofwastemodesfortheprojectdocumentationinputswerenotrelatedtotheactualprocessstepsbutrathertheinformationandtoolownershipbehind.
31
Table 1 – W-FMEA
Input Waste Mode Effect of waste mode
Cause of waste mode RPN
Assembly drawings
Engineering time spent in workshop
Increases engineering hours in the project
Assembly drawings lacked important information
100
Assembly drawings
Rework of drawings in EOPL
Increases engineering hours in EOPL
Assembly drawings sent did not match EOPL standard
50
Assembly drawings
Simple conveyor system designed in CAD instead of FLDT
Increases engineering hours in projects
Lack of FLDT knowledge 50
Production binder
Waste created in motion and transport when the physical binder is moved around
Increases engineering hours in EOPL
Current EOPL process design requires signatures from different employees to ensure work tasks were done
45
Spare part list
Tools and methods maintained locally by each unit
Increases costs No standardized tool 45
Assembly time calculation
Tools and methods maintained locally by each unit
Increases costs No standardized tool 40
Knowledge Long learning periods when shifting engineers between units
The engineer is not productive until the new way of working is learned
All units have developed their own processes, methods and tools
36
Operating manuals
Tools and methods maintained locally by each unit
Increases costs No standardized tool 30
Production binder
Waste created in waiting time when waiting for the binder to arrive to the workshop
Increases lead time of the project
Current EOPL process design requires the binder to be ready before the assembly phase can start
30
Knowledge Training of new personnel is time consuming
Engineering hours spent on training
No central guide on how to train new personnel
27
Assembly time calculation
Information updated several times at once when new product platforms are launched
Increases costs No central information owner 20
Operating manuals
Information updated several times at once when new product platforms are launched
Increases costs No central information owner 15
Risk analysis Information updated locally when there are new updates to the Machine Directive
Increases costs No central information owner 8
Risk analysis Tools and methods maintained locally by each unit
Increases costs No standardized tool 8
32
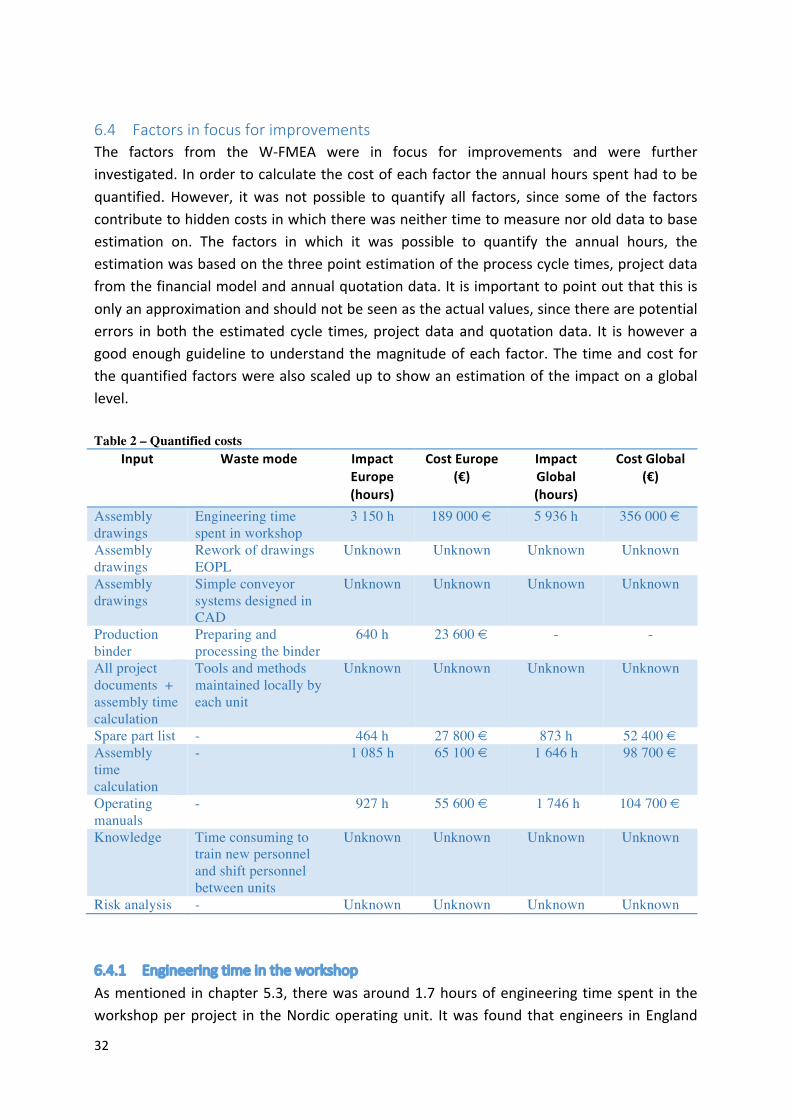
6.4 FactorsinfocusforimprovementsThe factors from the W-FMEA were in focus for improvements and were furtherinvestigated.Inordertocalculatethecostofeachfactortheannualhoursspenthadtobequantified. However, itwas not possible to quantify all factors, since someof the factorscontributetohiddencostsinwhichtherewasneithertimetomeasurenorolddatatobaseestimation on. The factors in which it was possible to quantify the annual hours, theestimationwasbasedonthethreepointestimationoftheprocesscycletimes,projectdatafromthefinancialmodelandannualquotationdata.Itisimportanttopointoutthatthisisonlyanapproximationandshouldnotbeseenastheactualvalues,sincetherearepotentialerrors inboth theestimatedcycle times,projectdataandquotationdata. It ishoweveragoodenoughguidelinetounderstandthemagnitudeofeachfactor.Thetimeandcost forthequantifiedfactorswerealsoscaleduptoshowanestimationoftheimpactonagloballevel.Table 2 – Quantified costs
Input
Wastemode
ImpactEurope(hours)
CostEurope(€)
ImpactGlobal(hours)
CostGlobal(€)
Assembly drawings
Engineering time spent in workshop
3 150 h 189 000 € 5 936 h 356 000 €
Assembly drawings
Rework of drawings EOPL
Unknown Unknown Unknown Unknown
Assembly drawings
Simple conveyor systems designed in CAD
Unknown Unknown Unknown Unknown
Production binder
Preparing and processing the binder
640 h 23 600 € - -
All project documents + assembly time calculation
Tools and methods maintained locally by each unit
Unknown Unknown Unknown Unknown
Spare part list - 464 h 27 800 € 873 h 52 400 € Assembly time calculation
- 1 085 h 65 100 € 1 646 h 98 700 €
Operating manuals
- 927 h 55 600 € 1 746 h 104 700 €
Knowledge Time consuming to train new personnel and shift personnel between units
Unknown Unknown Unknown Unknown
Risk analysis - Unknown Unknown Unknown Unknown
6.4.1 EngineeringtimeintheworkshopAsmentioned inchapter5.3,therewasaround1.7hoursofengineeringtimespent intheworkshopperproject in theNordicoperatingunit. Itwas found thatengineers inEngland
33
alsospendtimeintheworkshoptoanswerquestionsonaregularbasis.TheotherLSSthesisproject(Gerremo,2017)conductedasurvey,showingthattherewasasignificantamountoftimespentintheworkshopbytheengineersatEOPLaswell.Thistimecanbeclassifiedaswaste, since thegoal is todeliver justenough informationso thatnoquestionsarise.Thecauseofthiswastemodeisthattheassemblydrawingslackedimportantinformation.
The time spent in the workshop is not reported separately, so the exact duration of theworkshopvisitsremainsunknown.TheestimatedtimefromtheNordicprocesswasusedtocalculateanapproximatevalueforthewastecreatedonallprojects.Theestimationshowedthatthisisthemostcostlyfactorfromallthefactorsthatwaspossibletoquantify.
6.4.2 ReworkofdrawingsThe rework of drawings is themost obvious wastemode in the process, since the sameprocess steps are done twice. The underlying reason for this issue is believed to be thatthere is no standardway ofmaking drawingswith sufficient information in the company.Thereisalsoavariationinthepreferredwayofworkingandtheexperienceoftheoperatorsamongsttheunits.Thishasledtothateveryunithasdevelopedtheirownwayofdeliveringinformation to assembly. Another issue thatwas brought up during the interviews in theNordic unit was that they did not feel like they belong in the same organization, due tocommunicationbarriersandalltheinternalprocurementsbetweenthemandEOPL.
Itwas not possible to estimate thewaste for this factor since therewas no data on howoftenandhowmuch timewasspenton reworkof thiskind.However, therewereseveralprojects found during the thesis projectwhere rework had occurredwith over 100 hoursspent on redoing drawings. One example was a production project coming from anotherEuropeanunittoEOPL,where45hoursofengineeringwasspentintheorigincountryandanother40-50hoursofengineeringwasspenttoredothedrawingsinEOPL.Thedrawingsfor the projects with reworkwere collected and compared. Several interviewswere heldwithengineersandoperatorsfrommultipleunits. Itwasfoundthat lackofmeasurementsandviewswerethemostimportantreasonsforredrawing.However,therewasfoundtobemixed opinions on how to make drawings amongst the engineers in the different units.Some engineers’ opinion is that EOPL puts toomany details in the drawings while somewouldagreemorewiththedetaillevelprovidedbyEOPL,whilemostoftheoperatorswouldingeneralpreferthedetaillevelprovidedbyEOPL.
6.4.3 FLDTknowledgeItisagoalforFlexLinktoutilizeFLDTasmuchaspossible,sinceitisfasterthanusingCAD.Therewasfoundtobea largevariation inFLDTknowledgeamongsttheunits.Thiscausesengineers to sometimes process drawings in CAD when the conveyor system could havebeendesignedinFLDTinsteadinthefractionofthetime.FLDTwasinitiallydesignedtobeatoolforapplicationengineerstoquicklymakeaconceptdrawing.Ithashoweverevolvedtoinclude more advanced functionality and it is now possible to complete small projectswithoutusingCADatall.Itwasfoundthatsomeunitshavenotkeptuptodatewithallthe

34
updates inFLDT.Otherunitsalsoprefer touseAutoCAD in theapplicationphase instead.Thiswasevidentwheninterviewingseveralkeystakeholdersfromdifferentunits,notleastthe head of software development that is also responsible for training in the engineeringtools. According to him, the Nordic unit gives by far the most improvement proposalsthroughFLDTsownfeedbacksystem.TheNordicunitisalsowhereFLDTisutilizedthemost.Thereasonforthisisbelievedtobethatthesoftwaredevelopmentdepartmentislocatedinthe same building, thus improving the communication between them and the engineers.CommunicationbarriersarebelievedtobeareasonforthesloweradoptionofFLDTinotherunits.
Itwasnotpossibletoquantifythetimeandcostforthiswastemode,butthereisariskthatthiswastemodecouldbealargehiddencost.Thetimespentontheconveyordesignisthemost time consumingprocess step and the cycle timeestimation revealed that it ismorethan50%ofthetotalprojecttime,whichmeansthatthereisalargetimesavingpotentialbyusingFLDTinsteadofCADincaseswherepossible.
6.4.4 KnowledgeThis causeof thiswastemode is that there isnoefficientwayof spreadingknowledgeaswellas lackingworkstandards.Therearenoformalworkstandardsandguidelines fortheengineers, except for some defined processes in the QualityManagement System, whichwasfoundtobeseldomviewedandpoorlycommunicatedtotheengineers.Thefollowingquotefromaprojectengineerdescribesthesituation:“Nobodytellsuswhattodo,weoftenhavetofindawaybyourselves”.Thisisevidentwhenpassingknowledgetonewemployees.Since there isnostandardizedwayof trainingnewemployeesandconsultants, it requirestheengineerstospendasignificantamountoftimeintrainingnewpersonnel.Theengineerhastocomeupwithhisownwayof teaching.Another issue is that theengineershaveto“reinventthewheel” incertainsituationsbecausetherearenospecifiedguidelines,whichalso increases theriskofmakingerrors.Another issue is thatall theunitshavedevelopedtheir own ways of working because of a lacking central standardization of processes. Ithinders a smooth cooperation between the units with the long learning periods whenshiftingemployeesbetweenunits.Thisfactorcontributestohiddencoststhataredifficulttoquantify.
6.4.5 ProjectdocumentationandassemblytimecalculationTheprojectdocumentationconsistsofoperatingmanuals,sparepart listandadeclarationofincorporation.Thelatterrequiresthatariskanalysiswasdone.Thewastemodesrelatedtothesefactorsarehiddencostswheneveryunithastoupdateandmaintaintheirownself-developed tools. For example if a newplatform is released, the documentation and toolsneeds to be updated for that platform. Another problem is that there is no centralinformation owner. These factors had medium-low RPN score in the W-FMEA, since theoccurrenceofthewastemodesislow.Theywerechosenforfurtherinvestigationbecauseitwas believed that they could be automated by integrating functionality into the existing
35
engineeringtools,thusreducingthecycletimeoftheprocesssteptoalmostzeroandatthesame time eliminating the necessity of keeping local tools. Furthermore, theVoice of theCustomer(VOC)showedthatthesearetiresomeactivitiesthatareusuallysavedforlast.
Theminimalcycletimeforprojectdocumentationwasfoundtobeonehourbuttheaveragetimefromthethreepointestimation inchapter5.3was2.7hours.Projectdocumentsarealwaysprepared,nomatterhowsmall theproject is. Itmeansthattheproportionoftimespentondocumentationforverysmallprojectsbecomesunreasonablyhigh.Thetimeandcost was estimated for each of the project documentation component as well as theassembly time calculation by using the annual project data (financial model) and theestimatedcycletimefortheprocesssteps.
6.4.6 ProductionbinderProduction binder is an extra administrative set of documents used in EOPL that are notused in other units. The binder contains both documents that are value adding, such asassemblydrawings (required toassemble the system)aswell asdocuments that arenon-value adding, such as documents of entirely administrative nature due to their currentprocessdesign.TheproductionbinderisputtogetherbytheprojectadministratorinEOPL.Alltheassemblydrawingsareprintedoutandthensortedintherightorder.Compilingtheproduction binder with all the necessary documents and sorting them in the right ordertakesaboutonehour,basedonthreepointestimation.Theadministrativedocumentsinthebinder are then filled out by different employees, meaning that waste is createdtransportingthedocumentbetweenpersonnel.TheoperatorsinEOPLareinfavorofusingthebindersinceitsimplifiestheirwork.However,theadministrativedocumentinthebinderisnotaddinganyvalue.

36
37
7 ImproveIn the Improvephase,potential improvement ideasweregeneratedanddiscussed for thedifferent factors in theW-FMEA. Brainstorming and interviewswith key stakeholderswasthemost importantpartoftheImprovephase.Someideasturnedouttobeimprovementsuggestions while other factors were discarded for different reasons. The solutions werechosen based on ROI (Return on Investment) as well as contribution to standardizationamongsttheunits,sinceeveryactthatwouldmaketheoperatingunitsmorestandardizedwas seen as a benefit from the company. Furthermore,many of the improvementswerefocusedaroundtheengineeringtoolsandtheprojectdocumentation.Therefore,thefocusof the interviews in the Improve phase shifted from the operating units to the softwaredevelopment department. The cost of each solution were estimated and the potentialbenefitswerebasedontheestimationsfromtable6.2.
7.1 BrainstormingBrainstorming sessions were held continuously during the Improve phase. The sessionsincludedprojectengineersaswellastheFlexLinkBlackBelts.Thesessionsgeneratedideasthatwerelaterapprovedordiscardedduringtheinterviewsessions.Someoftheideaswerementioned by employees during the thesis project and were further discussed in thebrainstormingsessions.
7.2 InterviewsTheinterviewsessionsduringtheImprovephasegatheredkeystakeholdersfromoperatingunits, PSD, software and IT departments. The purpose of the sessions was to start adiscussion between the departments about the different improvement ideas, since someideasrequiredcrossfunctionalteamstodevelop. Itwasfoundthatsomeoftheideasthathadbeenbroughtupbyotheremployeesinthepastdidnotgetmuchattention.Therefore,these sessions turned out to be very successful since the discussion happened directlybetween the key stakeholders and common agreement between the stakeholders wasreached. The researchers had the intention tomake them own the solutions themselvesratherthantoactasmiddlemenbetweenthestakeholders.Itwasalsoimportanttodiscardthe ideas that were too complex to develop as well as to ensure that the proposedimprovements were possible and realistic to develop. All the stakeholders were positivetowardstheideasthatwereturnedtoimprovementrecommendations.
7.3 BusinessIntelligencesystemFigure7describesthepresentBusinessIntelligence(BI)systematFlexLink.DataisstoredintheDataWarehouse(DW)withinthesystemfromfourdifferentsources:
• ProductLifecycleManagement(PLM)system• EnterpriseResourcePlanning(ERP)system• CustomerRelationshipManagement(CRM)system• EngineeringTools(ET)
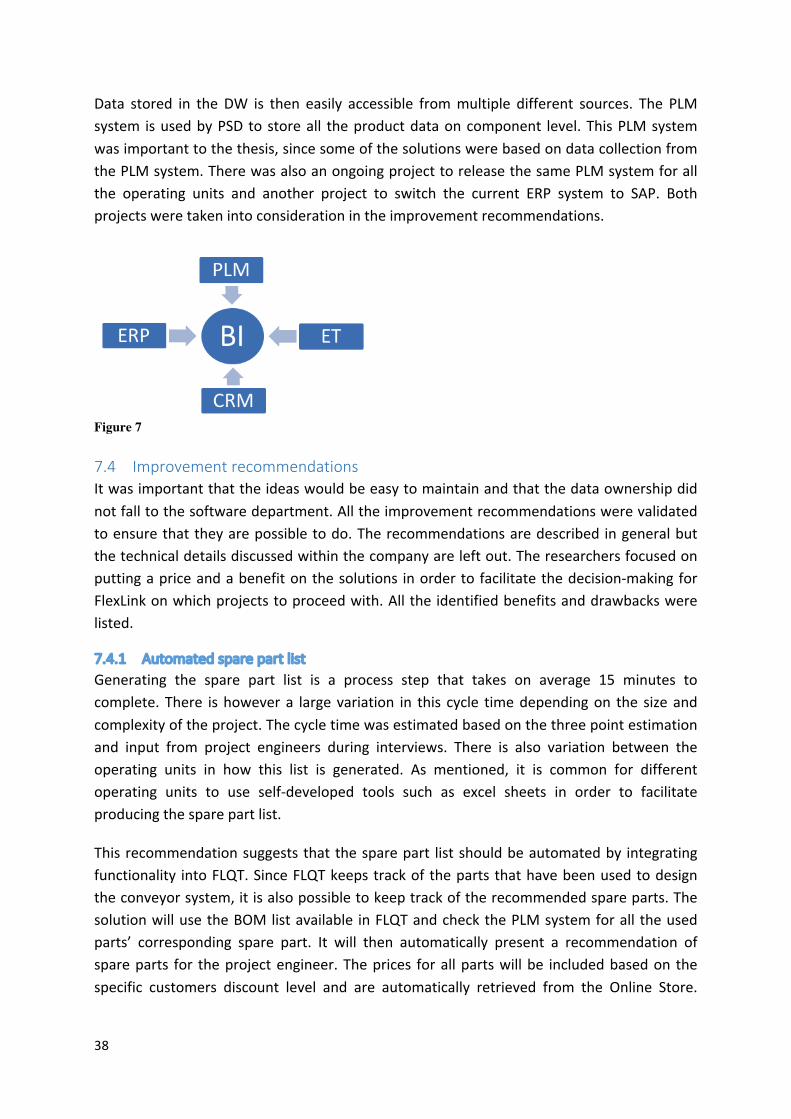
38
Data stored in the DW is then easily accessible frommultiple different sources. The PLMsystem isusedbyPSD tostoreall theproductdataoncomponent level.ThisPLMsystemwasimportanttothethesis,sincesomeofthesolutionswerebasedondatacollectionfromthePLMsystem.TherewasalsoanongoingprojecttoreleasethesamePLMsystemforallthe operating units and another project to switch the current ERP system to SAP. Bothprojectsweretakenintoconsiderationintheimprovementrecommendations.
Figure 7 7.4 ImprovementrecommendationsItwasimportantthattheideaswouldbeeasytomaintainandthatthedataownershipdidnotfalltothesoftwaredepartment.Alltheimprovementrecommendationswerevalidatedtoensurethattheyarepossibletodo.Therecommendationsaredescribed ingeneralbutthetechnicaldetailsdiscussedwithinthecompanyareleftout.Theresearchersfocusedonputtingapriceandabenefitonthesolutions inordertofacilitatethedecision-makingforFlexLinkonwhichprojectstoproceedwith.Alltheidentifiedbenefitsanddrawbackswerelisted.
7.4.1 AutomatedsparepartlistGenerating the spare part list is a process step that takes on average 15 minutes tocomplete. There ishowevera largevariation in this cycle timedependingon the sizeandcomplexityoftheproject.Thecycletimewasestimatedbasedonthethreepointestimationand input from project engineers during interviews. There is also variation between theoperating units in how this list is generated. As mentioned, it is common for differentoperating units to use self-developed tools such as excel sheets in order to facilitateproducingthesparepartlist.
Thisrecommendationsuggeststhatthesparepart listshouldbeautomatedby integratingfunctionality intoFLQT.SinceFLQTkeepstrackofthepartsthathavebeenusedtodesigntheconveyorsystem,itisalsopossibletokeeptrackoftherecommendedspareparts.ThesolutionwillusetheBOMlistavailable inFLQTandcheckthePLMsystemforall theusedparts’ corresponding spare part. It will then automatically present a recommendation ofspareparts for theprojectengineer.Theprices forallpartswillbe includedbasedon thespecific customers discount level and are automatically retrieved from the Online Store.
39
Furthermore, PSDhave agreed to be responsible for adding spare parts in the system forfutureproductplatforms.
It was believed that automating the spare part list would reduce the cycle time for thisprocess step to almost zero. The estimated annual saving potential is then 464 hours inEuropeand873hoursonaglobal level.This corresponds to52400€annual savingsonaglobal level. Based on information from interviews, this solution requires 236 hours todevelop:
• 40hoursofsoftwaredevelopmentinFLQT.• 36 hours of database updates in order for the FLQT functionality to be able to
retrievethedata.• 160hoursoffeedinginformationtothePLMsystem.
Thebenefitsthatwereidentifiedforthissolutionarelistedbelow:
• ItcaneasilybescaleduptoallprojectsandtoagloballevelsinceallunitsalreadyuseFLQT.
• Will contribute to a more standardized way of working between units, thuseliminating waste by for example removing the necessity of developing andmaintainingself-developedexceltools.Theinformationandthetoolwillbeupdatedcentrallyforthewholecompany.
• Easiertoensuresparepartlistsarealwayssenttocustomers.• Reducesriskofmakinghumanerrorsinthesparepartlist.• Customerpriceincludedautomatically.Withthecurrentsolutiontheengineershave
tofindthespecificcustomerpriceintheOnlineStore.• ROIlessthanayear.• Stakeholdersareinfavorofthesolution.• Sparepartlistcanbeproducedintheapplicationphaseinsteadwithoutaddingmuch
extratime.FlexLinkwantstoinvestigateifthismightincreasetheirsparepartsales.• Simplifiestheengineeringprocess.
Thedrawbacksare that itwill onlyprovide theengineerwitha recommendationof spareparts.Theengineerwillstillinsomecaseshavetomodifythelistaccordingtotheconveyorsystemdesign,forexamplechangingthequantityofparts.Furthermore,itwillonlyincludetheFlexLinkmaterialatthispoint.
7.4.2 AutomatedassemblytimecalculationThe assembly time calculation takes on average 20minutes to complete. Likemost otherprocesssteps,thereisavariationinthecycletimedependingonthesizeandcomplexityoftheengineeringproject.Thethreepointestimationwasusedtocalculatethecycletime.ThecurrentexceltoolusedbytheNordic,PolishandGermanoperatingunitshadanextensiveamountofdevelopmenthoursinordertodetermineaccurateformulasforthecalculation.The formulas are for example based on the length of the beams used in the conveyor
40
system.Itwasinitiallyinvestigatedifthecurrenttoolcouldbeeasilyimplementedintotheengineering tools. However, it was found that the formulas are too many and toocomplicatedtointegratetoasustainablesolutionthatiseasytomaintain.
Therecommendedsolution is insteadsimilartotheprevioussolution.FunctionalitywillbeintegratedintoFLDT,sothattheassemblytimeofadesignedsystemcanbeautomaticallycalculatedbythematerialintheBOMlist.FLDTwillretrievetheinformationfromthePLMsystem, which requires that assembly time is determined on subgroups of parts of theconveyorsystem.Determininghowtodivideintosubgroupsaswellastheassemblytimeforthe determined subgroups requires extensive product knowledge. Thisworkwas initiatedduringtheinterviewsessionswiththestakeholders.PSDhaveagreedtoowntheprocessofputtingassemblytimeonsubgroupsfornewproductplatformsinthesystem.Today,everyoperatingunithasto figureouttheassemblytimesontheirownwhennewplatformsarereleased. Furthermore, it is recommended to have EOPL as the owner of updating theassemblytimesforthesubgroups,sincetheyhavebyfarthehighestassemblyvolumes.Ifitis foundbyanyunit that a certain subgroup should takemoreor less time than the timedefinedinthePLMsystem,aprocessshouldbestartedatEOPLtodetermineiftheassemblytimeshouldbeupdated.
Itwas believed that 15minutes could be cut fromquotations by automating this processstep.Somequotationsarerevisionsofoldquotationsanddonotalways includeassemblytimecalculation.The revisionsweresortedout fromthequotationdataandanestimatedbufferwasthenaddedtocoverupfortherevisionswheretheassemblytimewascalculated.The annual benefits was then estimated to be 1085 hours saved in European applicationdepartmentsand1646hourssavedonagloballevel,correspondingto98700€.Thecosttodevelopthesolutionwasestimatedto480hours,basedoninformationfromtheinterviews.The 480 hours were divided into 320 hours of software development and 160 hours ofdevelopingthenecessaryframeworkfortheassemblytimesonsubgroups.Thebenefitsthatwereidentifiedforthissolutionarelistedbelow:
• ItcaneasilybescaleduptoallprojectsandtoagloballevelsinceallunitsalreadyuseFLDTforconceptdesigns.
• Will contribute to a more standardized way of working between units, thuseliminating waste by for example removing the necessity of developing andmaintainingself-developedexceltools.Theinformationandthetoolwillbeupdatedcentrallyforthewholecompany.
• Reducestheriskofmakinghumanerrors.• Reduces time spent by application engineers means reducing time not paid by
customers.• Stakeholdersareinfavorofthesolution.• ROIlessthanayear.• Simplifiestheengineeringprocess.
41
Thedrawbacksare that the solutiononly includesFlexLinkmaterial andwill require somemanualworkforthemostcomplexdesigns.
7.4.3 KnowledgebaseforoperatingunitsThisimprovementsuggestionisconnectedtothesecondhighestscoringfactorintheCauseandEffectmatrix“Knowledge”.ThewastemodesfromthisfactoridentifiedintheW-FMEAwere that it is timeconsuming to trainnewpersonneland shiftpersonnelbetweenunits.Thecausesforthewastemodeswasthatthereisnoprocessownerforspreadingstandards,guidelinesandinformationthatareapplicableforalloperatingunitsandthatallunitshavedevelopedtheirownwaysofworking.
This solution recommendscreatingaknowledgebase foralloperatingunits.Aknowledgebase is a system for storing and spreading knowledge within a company. Such a systemalreadyexistatFlexLink,onewithpublicinformationandoneonlyforPSD.Thus,extendingittooperatingunitswasseenasaneasytaskbythesoftwaredepartment.Thepublicsystemincludesknowledgeandtutorialsaboutalltheengineeringtools.Howeveritwasfoundthatnotallengineersare familiarwith itand it isseldomused.Byusingaseparateknowledgebaseforoperatingunits, itcanbeusedasacommunicationchannel fortraining,tutorials,standards, guidelines, etc. It can thus also be used as a tool to increase FLDT knowledge,which was a cause of a high scoring waste mode in theW-FMEA. The idea is to have ageneralpagethatappliestoalloperatingunitsbutalso includesubpageswith informationthatonlyapplies to localunits.Thegoal is touse itasa tool tounite theunits towardsamorestandardizedwayofworking.For that towork, it requiresastructurebehind itwithemployees that have ownership and responsibility to communicate standards, guidelinesandinformation.
AnotherareainwhichthissolutioncouldbebeneficialwastheupcomingreleaseofthePLMsystem foroperatingunits and the switch to SAP.During interviewswithemployees fromPSD, it was found that the PSD knowledge base was used mostly when using the PLMsystem.ThePSDemployeesbelievedthatiftheinformationdidnotexistinthePLMsystem,theywouldhave toask the ITdepartmentevery time. It is reasonable tobelieve that thesame need for fast accessible informationwill arise from the project engineerswhen thePLMsystemisrolledoutforoperatingunitsaswellasfromemployeesworkingwithSAP.
7.4.4 EngineeringtimeinworkshopThe approximation in table 6.2 showed that over 6000 engineering hours per annum arewastedbyengineersspending time inworkshops.Onecauseof thiswastemodewas thatthe assembly drawings lacked important information, so the engineers had to go to theworkshopandanswerquestionsorsolveproblems.However,furtherinvestigationisneededsinceitwasbelievedthattherearemorecauses,orthattheabovementionedmightnotbetheactualrootcause.ArecommendedactionistoinitiateanewLSSprojectwiththegoaltoreducethiswastemode.
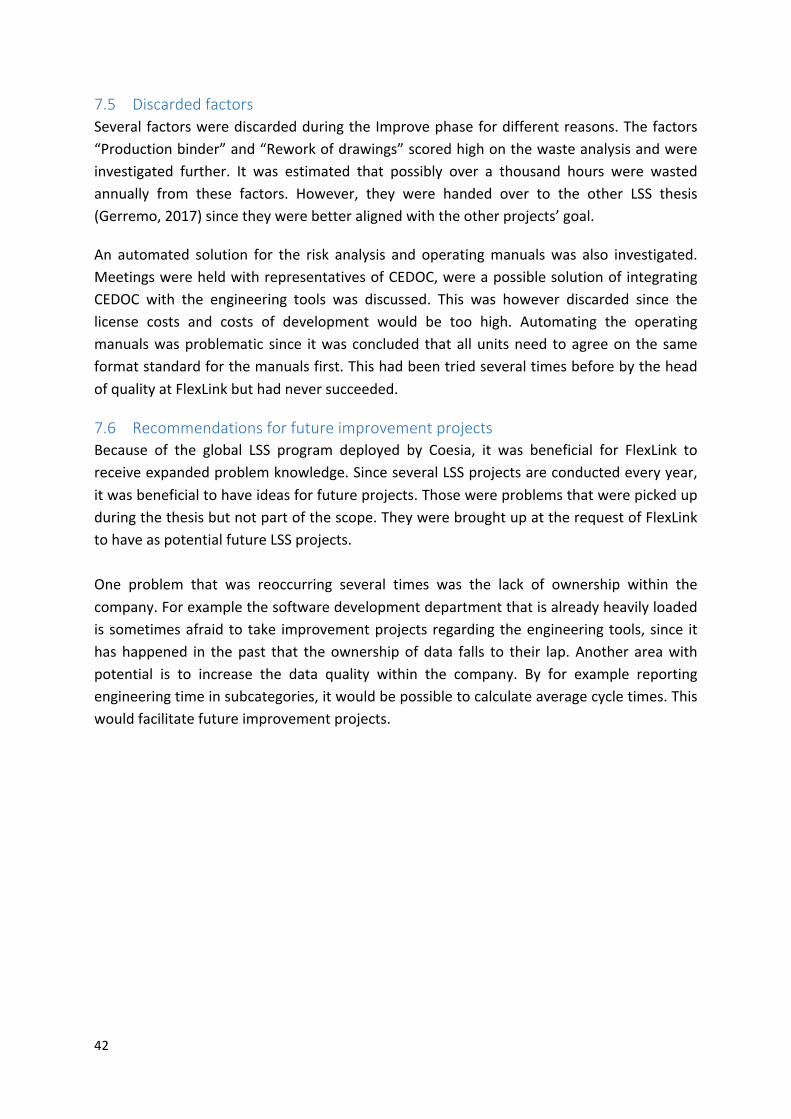
42
7.5 DiscardedfactorsSeveralfactorswerediscardedduringtheImprovephasefordifferentreasons.Thefactors“Productionbinder”and“Reworkofdrawings”scoredhighonthewasteanalysisandwereinvestigated further. It was estimated that possibly over a thousand hours were wastedannually from these factors. However, they were handed over to the other LSS thesis(Gerremo,2017)sincetheywerebetteralignedwiththeotherprojects’goal.
An automated solution for the risk analysis and operatingmanualswas also investigated.MeetingswereheldwithrepresentativesofCEDOC,wereapossiblesolutionof integratingCEDOC with the engineering tools was discussed. This was however discarded since thelicense costs and costs of development would be too high. Automating the operatingmanualswasproblematic since itwasconcluded thatallunitsneed toagreeon the sameformatstandardforthemanualsfirst.ThishadbeentriedseveraltimesbeforebytheheadofqualityatFlexLinkbuthadneversucceeded.
7.6 RecommendationsforfutureimprovementprojectsBecause of the global LSS program deployed by Coesia, it was beneficial for FlexLink toreceiveexpandedproblemknowledge.SinceseveralLSSprojectsareconductedeveryyear,itwasbeneficialtohaveideasforfutureprojects.Thosewereproblemsthatwerepickedupduringthethesisbutnotpartofthescope.TheywerebroughtupattherequestofFlexLinktohaveaspotentialfutureLSSprojects.One problem that was reoccurring several times was the lack of ownership within thecompany.Forexamplethesoftwaredevelopmentdepartmentthatisalreadyheavilyloadedis sometimesafraid to take improvementprojects regarding theengineering tools, since ithashappened in thepast that theownershipof data falls to their lap.Another areawithpotential is to increase the data quality within the company. By for example reportingengineeringtimeinsubcategories,itwouldbepossibletocalculateaveragecycletimes.Thiswouldfacilitatefutureimprovementprojects.
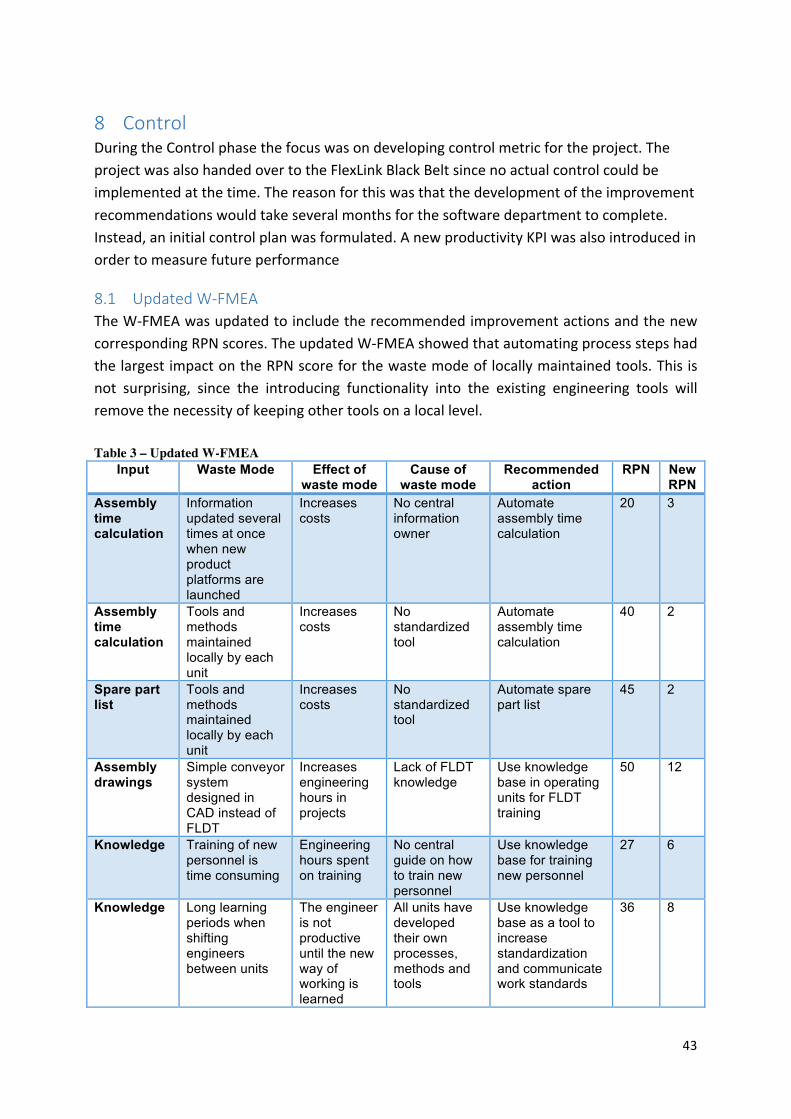
43
8 ControlDuringtheControlphasethefocuswasondevelopingcontrolmetricfortheproject.TheprojectwasalsohandedovertotheFlexLinkBlackBeltsincenoactualcontrolcouldbeimplementedatthetime.Thereasonforthiswasthatthedevelopmentoftheimprovementrecommendationswouldtakeseveralmonthsforthesoftwaredepartmenttocomplete.Instead,aninitialcontrolplanwasformulated.AnewproductivityKPIwasalsointroducedinordertomeasurefutureperformance
8.1 UpdatedW-FMEATheW-FMEAwasupdatedtoincludetherecommendedimprovementactionsandthenewcorrespondingRPNscores.TheupdatedW-FMEAshowedthatautomatingprocessstepshadthelargestimpactontheRPNscoreforthewastemodeoflocallymaintainedtools.Thisisnot surprising, since the introducing functionality into the existing engineering tools willremovethenecessityofkeepingothertoolsonalocallevel.Table 3 – Updated W-FMEA
Input Waste Mode Effect of waste mode
Cause of waste mode
Recommended action
RPN New RPN
Assembly time calculation
Information updated several times at once when new product platforms are launched
Increases costs
No central information owner
Automate assembly time calculation
20 3
Assembly time calculation
Tools and methods maintained locally by each unit
Increases costs
No standardized tool
Automate assembly time calculation
40 2
Spare part list
Tools and methods maintained locally by each unit
Increases costs
No standardized tool
Automate spare part list
45 2
Assembly drawings
Simple conveyor system designed in CAD instead of FLDT
Increases engineering hours in projects
Lack of FLDT knowledge
Use knowledge base in operating units for FLDT training
50 12
Knowledge Training of new personnel is time consuming
Engineering hours spent on training
No central guide on how to train new personnel
Use knowledge base for training new personnel
27 6
Knowledge Long learning periods when shifting engineers between units
The engineer is not productive until the new way of working is learned
All units have developed their own processes, methods and tools
Use knowledge base as a tool to increase standardization and communicate work standards
36 8
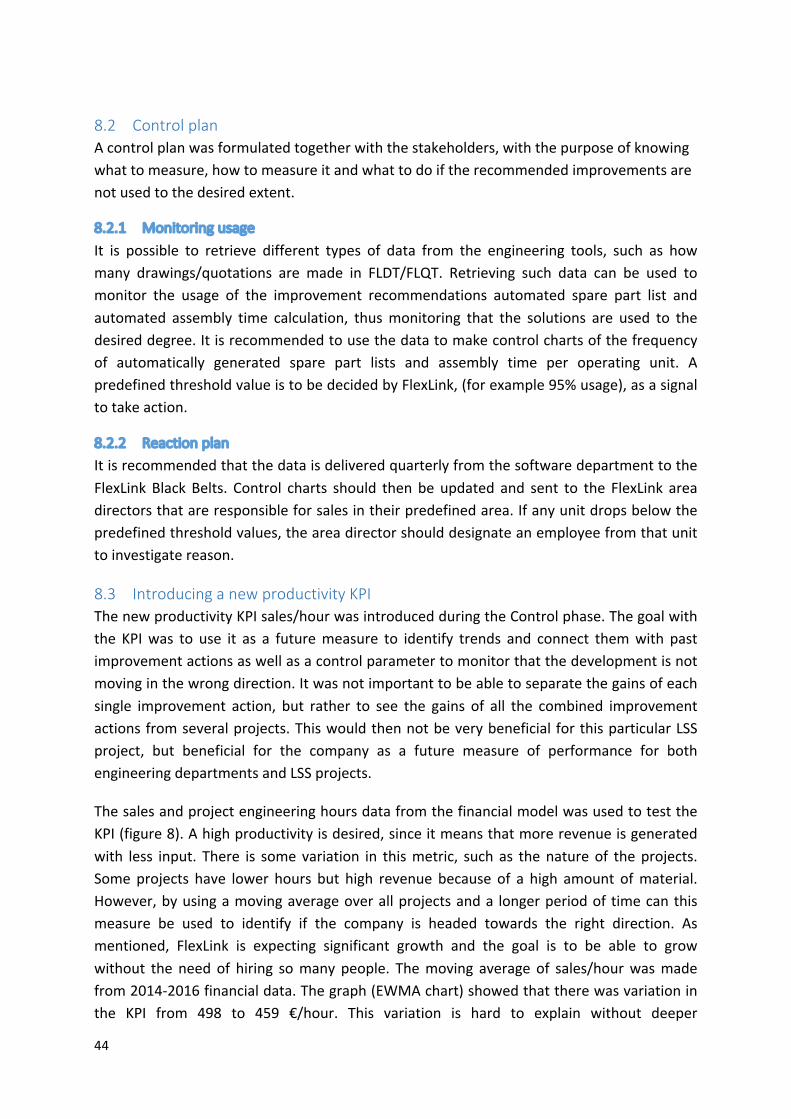
44
8.2 ControlplanAcontrolplanwasformulatedtogetherwiththestakeholders,withthepurposeofknowingwhattomeasure,howtomeasureitandwhattodoiftherecommendedimprovementsarenotusedtothedesiredextent.
8.2.1 MonitoringusageIt is possible to retrieve different types of data from the engineering tools, such as howmany drawings/quotations are made in FLDT/FLQT. Retrieving such data can be used tomonitor the usage of the improvement recommendations automated spare part list andautomated assembly time calculation, thusmonitoring that the solutions are used to thedesireddegree.Itisrecommendedtousethedatatomakecontrolchartsofthefrequencyof automatically generated spare part lists and assembly time per operating unit. ApredefinedthresholdvalueistobedecidedbyFlexLink,(forexample95%usage),asasignaltotakeaction.
8.2.2 ReactionplanItisrecommendedthatthedataisdeliveredquarterlyfromthesoftwaredepartmenttotheFlexLink Black Belts. Control charts should then be updated and sent to the FlexLink areadirectorsthatareresponsibleforsalesintheirpredefinedarea.Ifanyunitdropsbelowthepredefinedthresholdvalues,theareadirectorshoulddesignateanemployeefromthatunittoinvestigatereason.
8.3 IntroducinganewproductivityKPIThenewproductivityKPIsales/hourwasintroducedduringtheControlphase.Thegoalwiththe KPIwas to use it as a futuremeasure to identify trends and connect themwith pastimprovementactionsaswellasacontrolparametertomonitorthatthedevelopmentisnotmovinginthewrongdirection.Itwasnotimportanttobeabletoseparatethegainsofeachsingle improvement action, but rather to see the gains of all the combined improvementactionsfromseveralprojects.Thiswouldthennotbeverybeneficial forthisparticularLSSproject, but beneficial for the company as a future measure of performance for bothengineeringdepartmentsandLSSprojects.
ThesalesandprojectengineeringhoursdatafromthefinancialmodelwasusedtotesttheKPI(figure8).Ahighproductivityisdesired,sinceitmeansthatmorerevenueisgeneratedwith less input. There is some variation in thismetric, such as thenatureof theprojects.Someprojects have lower hours but high revenue because of a high amount ofmaterial.However,byusingamovingaverageoverallprojectsanda longerperiodof timecanthismeasure be used to identify if the company is headed towards the right direction. Asmentioned, FlexLink is expecting significant growth and the goal is to be able to growwithout the need of hiring somany people. Themoving average of sales/hourwasmadefrom2014-2016financialdata.Thegraph(EWMAchart)showedthattherewasvariationinthe KPI from 498 to 459 €/hour. This variation is hard to explain without deeper
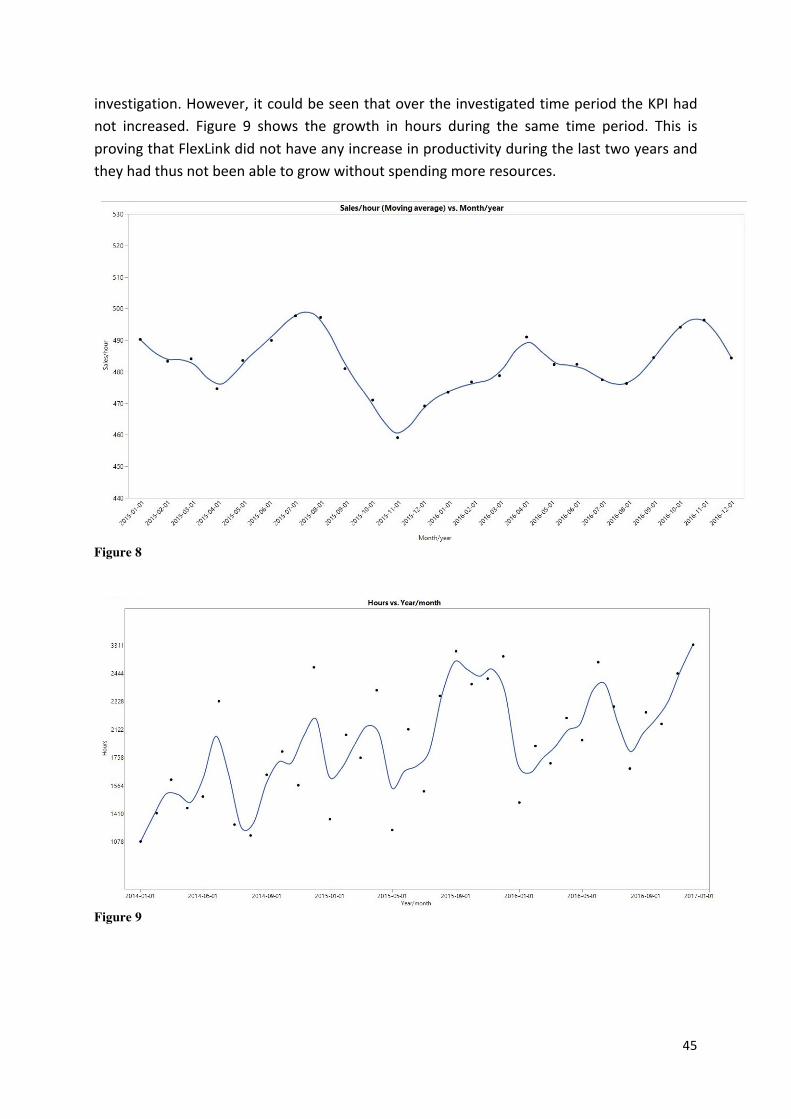
45
investigation.However,itcouldbeseenthatovertheinvestigatedtimeperiodtheKPIhadnot increased. Figure 9 shows the growth in hours during the same time period. This isprovingthatFlexLinkdidnothaveanyincreaseinproductivityduringthelasttwoyearsandtheyhadthusnotbeenabletogrowwithoutspendingmoreresources.
Figure 8
Figure 9

46
47
9 ResultsDuringtheDMAICcycle,anestimatedwasteofover6000hoursperyearwasfoundwithinthe operational part of the company. This wasmostly due to rework activities and over-processing.Itwasfoundthatthelackofstandardizationamongsttheunitswasthecauseofseveral problems. The effect of this cause is that all the units have developed their ownprocesses,methodsandtoolsfortheengineeringprojects.Thiswasseentohinderasmoothcooperationbetweentheunits.
This report resulted in concrete improvement recommendations, newcontrolmetrics andexpandedknowledgewithinproblematicareasthatmightbecomefutureprojectsintheLSSorganization.ThreeconcreteimprovementrecommendationswereformulatedasaresultofthefindingsduringtheDMAICcycle.TherecommendedimprovementsfocusedonutilizingITtoolstoimprovetheengineeringprocessandstandardizeworktasksbetweentheunits.Theimprovements“Automatedsparepartlist”and“Automatedassemblytimecalculation”weresuggested inorder toeliminate theprocess steps for thesmallengineeringprojects,andreducecycletimefortheengineeringprojectscontainingexternalmaterial.Theywereestimated to save 2519 hours annually, which corresponds to 151100 €, as well aseliminatedhiddencostsofallunitsmaintainingtheirowntoolsandinformationconnectedwith these process steps. The direct benefit will however come in the form of increasedcapacity.Thethirdconcreteimprovementsuggestionfocusedonusingaknowledgebaseasacommunicationchannelinordertocommunicatestandards,guidelinesandinformationinorder to reduce waste, lower communication barriers and increase standardization. Theknowledge base was believed to contribute to lower learning periods when shiftingpersonnelbetweenunitsaswellaslesstimerequiredtotrainnewemployees.Itisintendedasthebackboneofabroadpossibilityofapplications.
Control parameters were suggested based on the improvement recommendations. Thecontrol parameterswere focused onmeasuring if the solutionswere used to the desiredextentratherthanmeasuringthegains.ThenewKPIsales/hourwasproposed,whichcanbeused to measure the gains of several LSS projects and improvement actions regardingengineeringprojects.Whenthesales/hourwasplottedforhistoricdata,itwasevidentthatthe companyhadbeenunable to improve their engineering processes significantly duringthelasttwoyears,andthattheinitialproblembackgroundisvalid;theycouldonlygrowbyspendingmorehours.Thisresultisimportantsinceitvisualizestheproblemforthefirsttimeanditisthuseasierforhighermanagementtotakedecisions.

48
49
10 AnalysisThethreepointestimationwasusedseveraltimesthroughoutthethesis.Moreimportantly,theresultswerebasedonthethreepointestimation.Thismeansthat there isapotentialerrorinthenumbersbasedonthestandarddeviation.Asmentionedbyseveralauthors,oneofthemostcommonchallengeswithSixSigmaprojectsinserviceoperationsisthegatheringofqualitydata(Antonyetal.,2007;HensleyandDobie,2005;NevesandNakhai,2011).Thisstatementwas also confirmed by this thesis. Cycle time datawas not possible to gather,which meant that the basis of the report had to be based on estimations. The thesisconductedbyGerremo(2017)alsofoundthattheengineeringtimewasnotreportedtothedesired extent, whichmakes it hard to use the data for analysis. This thesis proposed tointroduce reportingofcycle times inengineeringprojectsasa recommendation for futureimprovement projects. Having access to this data facilitates future improvement projectswithin the LSS organization in the company. Another challengementioned by Neves andNakhai (2011) is thatdata inserviceoperations lackreliabilitysince it isoftencollectedbyverbal communication. This statement was also confirmed during the thesis. Situationsoccurredwhendifferentintervieweeshadcontradictingstatements,whichmadeithardtorelyonthedata.
Another encountered issue was the difficulty to define waste within the process. Manywastemodesfoundwerehiddenwithintheprocessandthushardtodiscover.Therewerefrequentdiscussionswithstakeholdersonwhichactivitiesthatcouldbeclassifiedaswaste,since there were often disagreements. This connects with the statement from Åhlström(2004),thatdefiningwasteinserviceoperationsissubjective,incontrasttomanufacturing.Whatoneconsiderswastemaybevalue-addingtosomeoneelse.
The major gains of this thesis was decreasing of non-value adding activities, increasedstandardization amongst the units and increased efficiency in the operations. ThesewerealsosomeofthebenefitsofSixSigmainserviceoperationsmentionbyAntony(2006).ThiscasestudythusconfirmsbothreportedbenefitsandchallengeswithusingLeanSixSigmainserviceoperations.

50
51
11 ConclusionThisprojecthadtheaimto increasecapacityforFlexLinkbyreducingthetimerequiredtocomplete engineering projects. The thesis was performed according to the DMAIC cycleknownfromLSSmethodology.Furthermore,thethesiswasapartoftheglobalLSSprogramdeployedbyCoesiaandfollowedtheinternalLSSproceduresadoptedbytheorganization.The research questions focused on the factors affecting the engineering time for smallprojects,enhancementofengineeringtoolsandalignmentofthisreportwithLSStheoryinservice operations. It was found that the engineering time was mostly affected by theassembly drawings and repetitive tasks such as assembly time calculation and projectdocumentation.Producingtheassemblydrawingswasexpectedtobeatimeconsumingtaskin the engineering projects, since it is themain delivery of the process. There were alsoongoinglargerimprovementprojectsregardingthisarea.Thefocuswasthereforedirectedto the repetitive tasks. These taskswerealsohighly relevantwith respect to the researchquestion of how to enhance the engineering tools. All the repetitive tasks with a highamount of manual information transfer were candidates for automation. Concreteimprovementrecommendationswereformulatedonhowtoenhancetheengineeringtoolssothattwoprocessstepscouldbeautomated.Itwasestimatedthatthiswouldbringsavingsof1.5MSEK.Thesavingswouldbenoticeableasincreasedcapacityintheorganization.Thisthesisalsostarteddiscussionsonautomatingotherprocesssteps.Therewerealsoseveralother benefits of process automation besides the savings. Automation of repetitive tasksreceived positive feedback from the engineers, since they all agreed on that these taskswerethe leaststimulating intheirdailywork.Furthermore, itwouldremovehiddenwastebystandardizingprocessbetweenthedifferentunits.

52
53
12 ReferencesAhlstrom, P. (2004). Lean service operations: translating lean production principles to service operations. International Journal of Services Technology and Management, 5(5/6), p.545. Antony, J., Jiju Antony, F., Kumar, M. and Rae Cho, B. (2007). Six sigma in service organisations: Benefits, challenges and difficulties, common myths, empirical observations and success factors. International Journal of Quality & Reliability Management, 24(3), pp.294-311. Antony, J. (2006). Six sigma for service processes. Business Process Management Journal, 12(2), pp.234-248. Assarlind, M., Gremyr, I. and Bäckman, K. (2013). Multi-faceted views on a Lean Six Sigma application. International Journal of Quality & Reliability Management, 30(4), pp.378-402. Bañuelas, R., Antony, J. and Brace, M. (2005). An Application of Six Sigma to Reduce Waste. Quality and Reliability Engineering International, 21(6), pp.553-570. Bergman, B. and Klefsjö, B. (2010). Quality from Customer Needs to Customer Satisfaction. 3rd ed. Lund: Studentlitteratur AB, pp.37-45, 51-52, 567-580. Bryman, A. and Bell, E. (2003). Business research methods. 1st ed. Oxford: Oxford University Press. de Koning, H., Verver, J.P.S., van den Heuvel, J., Bisgaard, S., & Does, R.J. (2006) Lean Six Sigma in Healthcare. Journal for Healthcare Quality, Vol. 28, No 2. Pp. 4-11 Declaration of Incorporation - Work equipment and machinery. (n.d.). [online] Hse.gov.uk. Available at: http://www.hse.gov.uk/work-equipment-machinery/declaration-incorporation.htm [Accessed 4 Nov. 2016]. Gerremo, E. (2017) Improving Engineering Process productivity when visualizing waste and mitigating variation. Gothenburg: Chalmers University of Technology. (Diploma work at Department of Materials and Manufacturing Technology) Griffin, R. and Pustay, M. (1999). International business: A Managerial Perspective. 2nd ed. Addison-Wesley Publishing Company, Inc, pp.327-329, 347-356. Hammersberg, P. (n.d.). 3 point estimate. Hensley, R. and Dobie, K. (2005). Assessing readiness for six sigma in a service setting. Managing Service Quality: An International Journal, 15(1), pp.82-101. Kerzner, H. (1998). Project Management, Sixth Edition, Wiley & Sons, 1998, pp. 660-661. Leung, K., Bhagat, R., Buchan, N., Erez, M. and Gibson, C. (2005). Culture and international business: recent advances and their implications for future research. Journal of International Business Studies, 36(4), pp.357-378.
54
Liker, J. (2004). The Toyota way: 14 Management Principles from the World's Greatest Manufacturer. 1st ed. New York: McGraw-Hill. Machinery - Growth - European Commission. (2017). [online] Growth. Available at: http://ec.europa.eu/growth/sectors/mechanical-engineering/machinery [Accessed 4 Nov. 2016]. Neves, J. and Nakhai, B. (2011). Six Sigma for services: a service quality framework. International Journal of Productivity and Quality Management, 7(4), p.463. Pacheco, D., Pergher, I., Vaccaro, G., Jung, C. and ten Caten, C. (2015). 18 comparative aspects between Lean and Six Sigma. International Journal of Lean Six Sigma, 6(2), pp.161-175. Psychogios, A., Atanasovski, J. and Tsironis, L. (2012). Lean Six Sigma in a service context: A multi-factor application approach in the telecommunications industry. International Journal of Quality & Reliability Management, 29(1), pp.122-139. Schroeder, R., Linderman, K., Liedtke, C. and Choo, A. (2008). Six Sigma: Definition and underlying theory. Journal of Operations Management, 26(4), pp.536-554. Slack, N., Chambers, S. and Johnston, R. (2010). Operations management. 6th ed. Harlow, England: Financial Times Prentice Hall. The new improvement frontier. (2005). Strategic Direction, 21(11), pp.33-35. Wedgwood, I. (2006). Lean sigma: a practitioners' Guide. 1st ed. Upper Saddle River, N.J.: Prentice Hall.
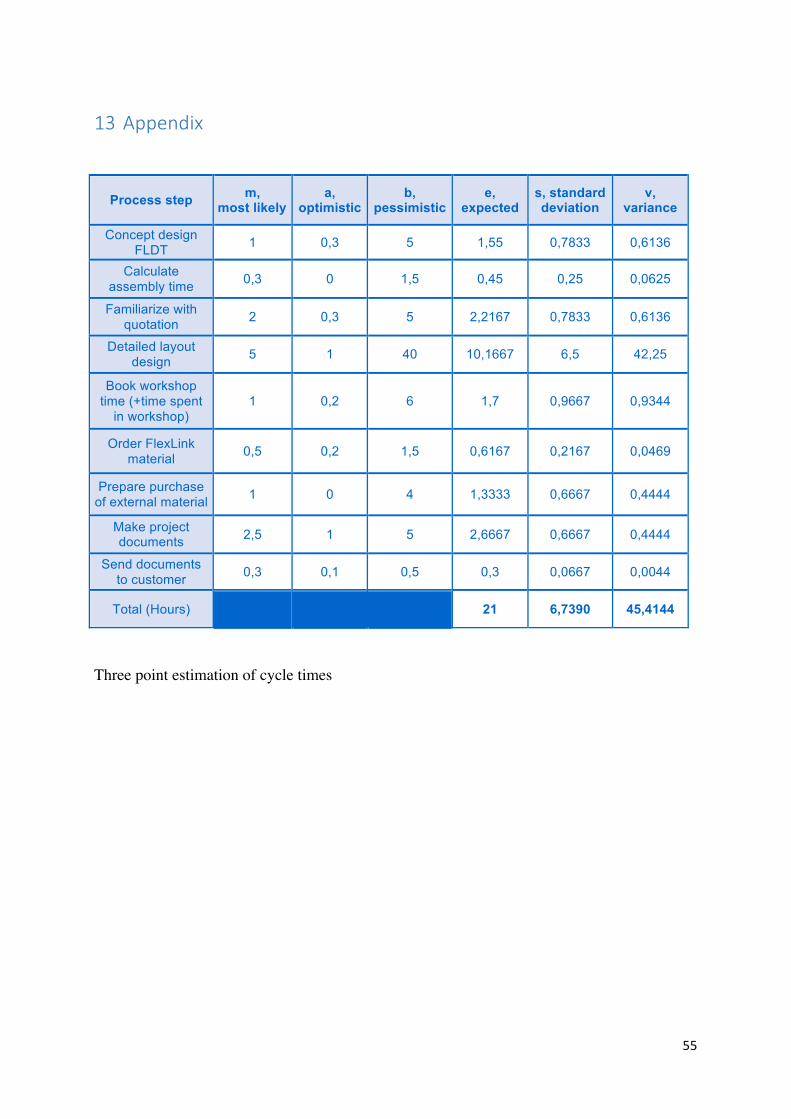
55
13 Appendix
Three point estimation of cycle times
Process step m, most likely
a, optimistic
b, pessimistic
e, expected
s, standard deviation
v, variance
Concept design FLDT 1 0,3 5 1,55 0,7833 0,6136
Calculate assembly time 0,3 0 1,5 0,45 0,25 0,0625
Familiarize with quotation 2 0,3 5 2,2167 0,7833 0,6136
Detailed layout design 5 1 40 10,1667 6,5 42,25
Book workshop time (+time spent
in workshop) 1 0,2 6 1,7 0,9667 0,9344
Order FlexLink material 0,5 0,2 1,5 0,6167 0,2167 0,0469
Prepare purchase of external material 1 0 4 1,3333 0,6667 0,4444
Make project documents 2,5 1 5 2,6667 0,6667 0,4444
Send documents to customer 0,3 0,1 0,5 0,3 0,0667 0,0044
Total (Hours)
21 6,7390 45,4144
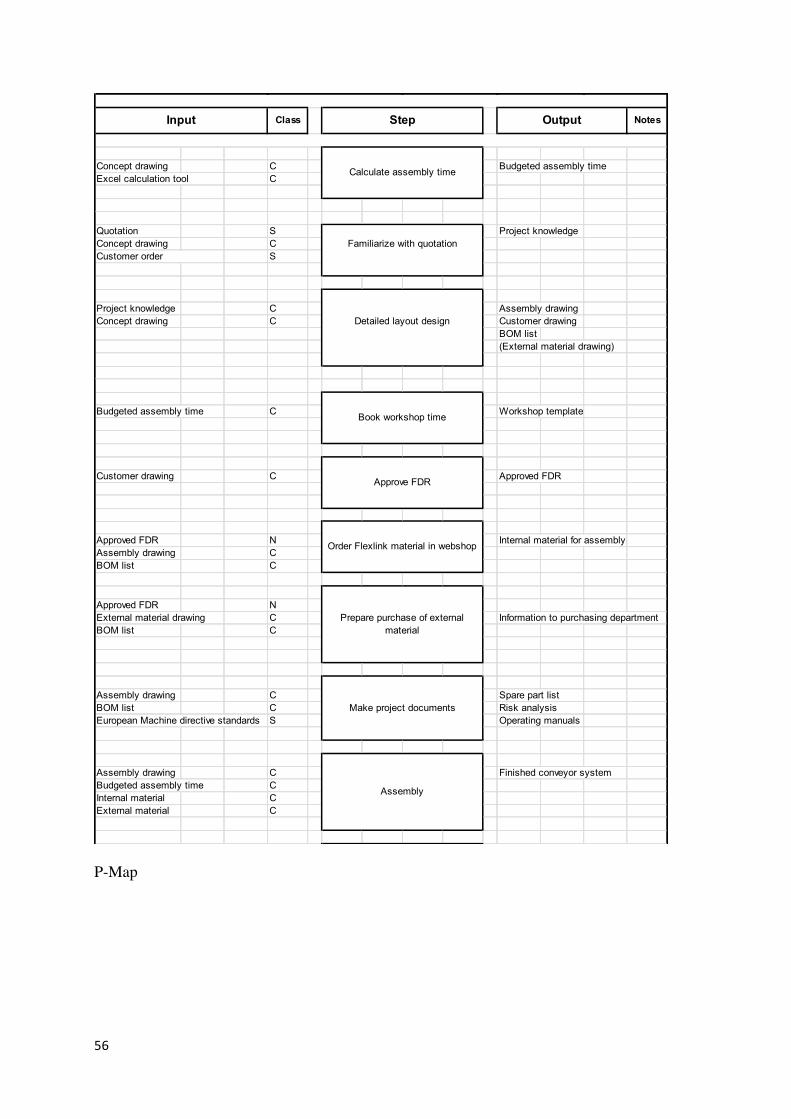
56
Concept drawing C Budgeted assembly timeExcel calculation tool C
Quotation S Project knowledgeConcept drawing C
S
Project knowledge C Assembly drawingConcept drawing C Customer drawing
BOM list(External material drawing)
Budgeted assembly time C Workshop template
Customer drawing C Approved FDR
Approved FDR N Internal material for assemblyAssembly drawing CBOM list C
Approved FDR NExternal material drawing C Information to purchasing departmentBOM list C
Assembly drawing C Spare part listBOM list C Risk analysisEuropean Machine directive standards S Operating manuals
Assembly drawing C Finished conveyor systemBudgeted assembly time CInternal material CExternal material C
Assembly
Customer order
Calculate assembly time
Prepare purchase of external material
Order Flexlink material in webshop
Approve FDR
Output NotesInput Class Step
Make project documents
Book workshop time
Detailed layout design
Familiarize with quotation
P-Map
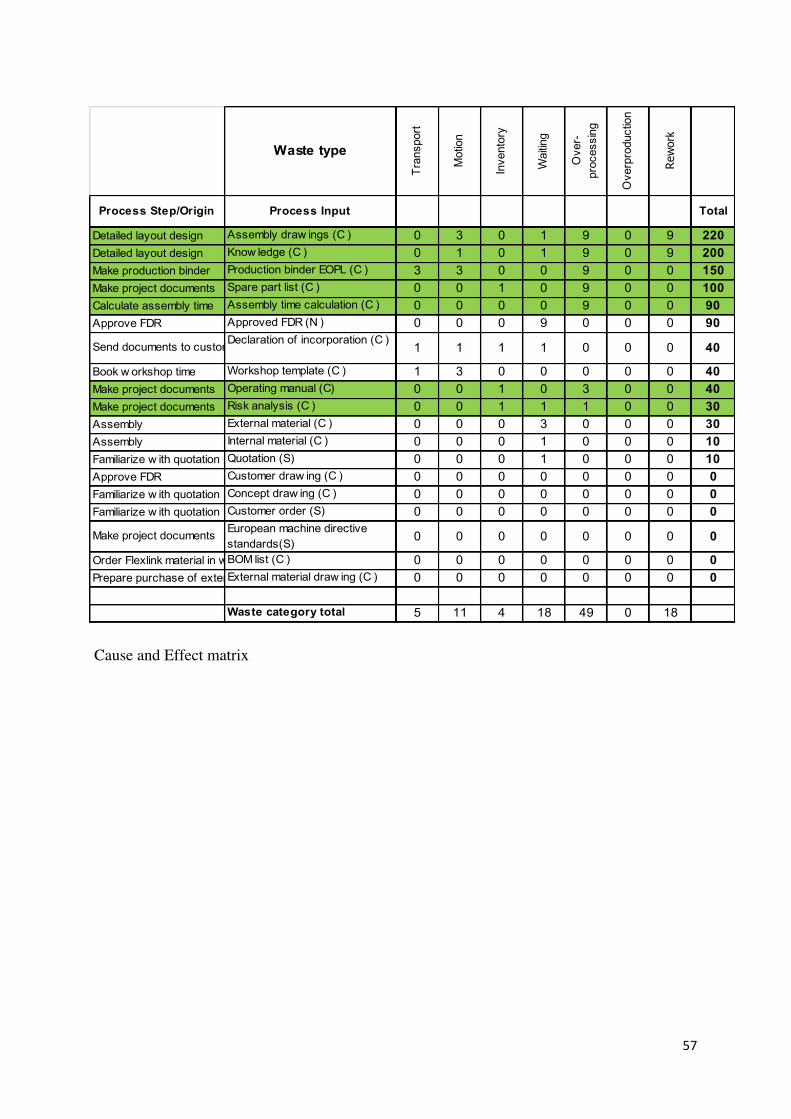
57
Cause and Effect matrix
Waste type
Tran
spor
t
Mot
ion
Inve
ntor
y
Wai
ting
Ove
r-pr
oces
sing
Ove
rpro
duct
ion
Rework
Process Step/Origin Process Input Total
Detailed layout design Assembly draw ings (C ) 0 3 0 1 9 0 9 220Detailed layout design Know ledge (C ) 0 1 0 1 9 0 9 200Make production binder Production binder EOPL (C ) 3 3 0 0 9 0 0 150Make project documents Spare part list (C ) 0 0 1 0 9 0 0 100Calculate assembly time Assembly time calculation (C ) 0 0 0 0 9 0 0 90Approve FDR Approved FDR (N ) 0 0 0 9 0 0 0 90
Send documents to customerDeclaration of incorporation (C ) 1 1 1 1 0 0 0 40
Book w orkshop time Workshop template (C ) 1 3 0 0 0 0 0 40Make project documents Operating manual (C) 0 0 1 0 3 0 0 40Make project documents Risk analysis (C ) 0 0 1 1 1 0 0 30Assembly External material (C ) 0 0 0 3 0 0 0 30Assembly Internal material (C ) 0 0 0 1 0 0 0 10Familiarize w ith quotation Quotation (S) 0 0 0 1 0 0 0 10Approve FDR Customer draw ing (C ) 0 0 0 0 0 0 0 0Familiarize w ith quotation Concept draw ing (C ) 0 0 0 0 0 0 0 0Familiarize w ith quotation Customer order (S) 0 0 0 0 0 0 0 0
Make project documents European machine directive standards(S) 0 0 0 0 0 0 0 0
Order Flexlink material in w ebshopBOM list (C ) 0 0 0 0 0 0 0 0Prepare purchase of external materialExternal material draw ing (C ) 0 0 0 0 0 0 0 0
Waste category total 5 11 4 18 49 0 18