Improving energy efficiency of existing buildings - LTH · 2013-06-05 · zużycia energii w...
98
Improving energy efficiency of existing buildings - Recommendations and approaches to consider in Poland and Kosovo LTH School of Engineering at Campus Helsingborg Housing Development & Management Bachelor thesis: Alan Esad Fatri Rexhepi
Transcript of Improving energy efficiency of existing buildings - LTH · 2013-06-05 · zużycia energii w...

Improving energy efficiency of existing buildings - Recommendations and approaches to consider in Poland and Kosovo
LTH School of Engineering at Campus Helsingborg
Housing Development & Management
Bachelor thesis: Alan Esad Fatri Rexhepi

Non scholae, sed vitae discimus

Copyright Alan Esad, Fatri Rexhepi LTH School of Engineering Lund University Box 882 SE-251 08 Helsingborg Sweden LTH Ingenjörshögskolan vid Campus Helsingborg Lunds universitet Box 882 251 08 Helsingborg Printed in Sweden Media-Tryck Biblioteksdirektionen Lunds universitet Lund 2012

Abstract
Improving energy efficiency of existing buildings – Recommendations and
approaches to consider in Poland and Kosovo
The energy issue has in recent years become a hot topic around the world.
Discussions about how to reduce the greenhouse gases in a sustainable manner
have been raised. Given that this is an emerging problem, and that many
people lack knowledge regarding this subject, it is about time that they get the
information needed to be able to contribute in some way. In general, the
building sector represents a high proportion of the total energy consumption in
all countries. By letting people get acquainted with the benefits of building
energy-efficient, the building sector would be seen as a major contribution
towards reducing the overall energy consumption in a country.
In this report we have chosen to take a closer look on two houses, one in
Poland and the other one in Kosovo. At present, 40 % of all houses were built
during the 1970’s in Poland, with an older building technology. By improving
such a large amount of buildings, positive results can be achieved energy wise.
After the war ended in Kosovo in 1999, thousands of housing units have been
built all over the country in an expedited manner. Most of the houses are poor
from an insulation point of view, therefore it is important to provide them with
a basis of the benefits when building energy-efficient.
We began by studying the thermal performance of the two houses, to be able
to see what errors that gave increased energy consumption. From there we
came up with various improvements that we later on simulated in a program
called DEROB-LTH. This program provided us with values of how much
each improvement contributed in reducing the use of energy. Calculations of
how much it costs to implement the proposed improvements were also made.
All materials that we used in our improvements are available in respective
countries.
The results that we received were found to have a long payback period if the
house was already relatively well insulated. On the other hand, if the house
was poorly insulated we received a payback period that should be taken in
consideration.
Keywords: Energy-efficient, existing buildings, Poland, Kosovo, insulation,
windows, simulation, payback period.

Sammanfattning
Energieffektiviseringsåtgärder av befintliga byggnader – Rekommendationer
och tillvägagångssätt att beakta i Polen och Kosovo
Energifrågan har under de senaste åren blivit ett hett ämne runt om i världen.
Diskussioner har framtagits där man nämner hur man skall minska växthus-
gaserna på ett hållbart sätt. Eftersom detta är ett växande problem och män-
niskor saknar kunskap om detta, är det på tiden att de får den information som
krävs för att mer eller mindre kunna bidra. Generellt, så står byggsektorn för
en stor andel av den totala energiförbrukningen i alla länder. Genom att få
människor att bli bekanta med de fördelar som finns med att bygga energi
effektivt, så kommer byggnadssektorn att ses som en bidragande faktor för
minskningen av den totala energiförbrukningen i ett land.
I denna rapport så har vi valt att titta lite närmare på två hus, ett i Polen och
det andra i Kosovo. För närvarande är 40 % av alla byggda hus i Polen från
1970-talet och är byggda med en äldre byggnadsteknik. Genom att förbättra en
så stor mängd av byggnader, kan positiva resultat uppnås energimässigt. Efter
att kriget slutade i Kosovo år 1999, har man under en kort tid byggt tusentals
hus över hela landet. De flesta husen är dåligt isolerade, därför är det viktigt
att visa vilka fördelar det finns att bygga energieffektivt.
Vi började med att göra en byggteknisk analys med fokus på energi, för att se
vilka felaktigheter som gav ökad energiförbrukning. Därefter diskuterade vi
fram olika lösningar som vi sedan simulerade i ett program som heter
DEROB-LTH. Utifrån detta program så fick vi värden på hur mycket varje
förbättring har bidragit med till att minska energiförbrukningen i kWh. Vi
gjorde också beräkningar på hur mycket det kostar att utföra varje förbättring.
All material som vi använde i våra beräkningar finns på marknaden i
respektive land.
Resultatet som vi fick, visade att om huset redan var bra isolerat så fick man
en lång återbetalningstid. Men om huset var dåligt isolerat, så fick vi en
återbetalningstid som bör tas i beaktande.
Nyckelord: Energisnål, befintliga byggnader, Polen, Kosovo, isolering,
fönster, simulering, återbetalningstid.

Streszczenie Termomodernizacja w istniejących budynkach – Rekomendacje oraz
propozycje które należy uwzględnić w Polsce i Kosowie
Kwestia energii w ostatnich latach stała się gorącym tematem na całym
świecie. Prowadzone są rozmowy i opracowania dotyczące ograniczenia
emisji gazów cieplarnianych. Ponieważ jest to rosnący problem, społeczność
międzynarodowa prowadząc dyskusje na ten temat wskazuje w jaki sposób
ograniczyć zużycie energii zwracając szczególną uwagę na zalety budow-
nictwa energooszczędnego. Powszechna świadomość i wiedza w śród ludzi
dotycząca efektu cieplaniarnego i konieczności budownictwa energo-
oszczędnego, spowoduje stosowanie wyłącznie nowoczesnych technologi
budowlanych i materiałów izolacyjnych, zmniejszając jednocześnie zużycie
energii.
W prezentowanym raporcie zdecydowaliśmy się dokonać oceny energe-
tycznej domów jednorodzinnych,jednego w Polsce i jednego w Kosowie.
Obecnie 40 % istniejących budynków mieszkalnych w Polsce było wy-
budowanych w latach 1970 do 1989r. według starej technologi budowlanej i
niskich parametrach izolacyjnych. Zastosowanie nowoczesnych systemów
dociepleń w tych budynkach w znacznym stopniu ograniczy zużycie energii, a
tym samym emisję gazów cieplarnianych. Po zakończeniu wojny w 1999r. w
Kosowie wybudowano tysiace domów, lecz bez odpowiedniej izolacji
cieplnej, dlatego też istotnym jest wykazanie korzyści jakie wynikają ze
stosowania technologi budownictwa energooszczędnego.
Dokonaliśmy analizy strukturalnej ze szczególnym uwzględnieniem para-
metrów energetycznych budynków w celu wykazania błędów jakie pop-
ełniono i w konsekwencji których następuje zwiększone zużycie energii.
Następnie opisaliśmy różne rozwiązania i symulacje przy zastosowaniu
programu DEROB-LTH. Za pomocą tego programu otrzymaliśmy wartości na
ile każda poprawa w strukturze budynku przyczyniłaby się do zmniejszenia
zużycia energii w przeliczeniu na kWh, oraz obliczenia kosztów dokonując
tych zmian. Do obliczeń i symulacji przyjęto charakterystyki materiałów
budowlanych znajdujących się obecnie na rynku budowlanym obydwu
krajów.
Uzyskane wyniki wykazały, że jeżeli budynek został dobrze izolowany to
poniesione koszty na obniżenie energochłonności podlegałyby długiemu
okresowi zwrotu. Natomiast w przypadku domu niedostatecznie izolowanego
okres zwrotu kosztów poniesionych na poprawę parametrów energetycznych

budynku jest znacząco krótszy, a tym samym powinien być brany pod uwagę
przy realizacji tego przedsięwzięcia.
Słowa kluczowe: energooszczędne, istniejące budynki, Polska,
Kosowo, izolacja, okna, symulacja, okres zwrotu.

Përmbledhje Masat e efiçiencës së energjisë në ndërtesat ekzistuese - Rekomandimet dhe
qasjet për t'u marrë parasysh në Poloni dhe në Kosovë
Çështja e energjisë në vitet e fundit është bërë një temë e nxehtë në mbarë
botën. Diskutimet janë zhvilluar duke u përmendur reduktimin e gazeve-serë
në mënyrë të qëndrueshme. Që kjo është një problem në rritje dhe njerëzve ju
mungojn njohurit në lidhje me këtë, është koha që ata të marrin informacionin
e nevojshëm për gjendjen dhe pak a shumë për të kontribuar. Në mënyrë të
përgjithshme, sektori i ndërtimaris qëndron prapa një pjesë të madhe të
konsumit të energjisë totale në të gjitha vendet. Duke marrë njohuri ekzistuese
njerëzit njifen më mirë me përparësitë e ndërtimit efikas të energjisë, atëherë
sektori i ndërtimit do të shihet si një faktor që kontribuon në reduktimin e
konsumit të përgjithshëm të energjisë në një vend.
Në këtë raport ne kemi zgjedhur për të marrë një vështrim nga afër dy
shtëpive, një në Poloni dhe një në Kosovë. Aktualisht, 40 % e të gjitha
shtëpive të ndërtuara në Poloni jan ndërtim i viteve 1970 dhe jan të ndërtuara
me një teknik të vjetër ndërtimi. Duke përmirësuar një numër të madh të
ndërtesave, mund të arrihen rezultate pozitive në kursimin e energjis. Pas
përfundimit të luftës në Kosovë në vitin 1999, brenda një kohe të shkurtë jan
ndërtuar me mijëra shtëpi në të gjithë vendin. Shumica e shtëpive janë të
izoluara dobët, kështu që është e rëndësishme për të treguar se çfarë përfitime
ka për të ndërtuar energji-efektive.
Ne kemi filluar të bëjmë një analizë tekniko-ndërtimore me fokus në energji,
për të parë cilat ishin gabimet që kan rezultuar në rritjen e konsumit të
energjisë. Pastaj kemi diskutuar zgjidhje të ndryshme që ne pastaj i kemi
modeluar në një program të quajtur DEROB-LTH. Përmes këtij programi,
kemi marrë vlerat në çdo përmirësim që ka kontribuar në reduktimin e
konsumit të energjisë në kWh. Ne gjithashtu kemi bërë llogaritjet se sa
kushton për të kryer çdo përmirësim. Të gjitha materialet që i kemi përdorur
në llogaritjet tona janë në tregjet e secilit vend aktual.
Rezultati që ne kemi marrë, treguan në qoftë se shtëpit ishin te izoluara mirë
ata do të ken një periudhë të gjatë të përfitimit. Por në qoftë se shtëpia është e
izoluar dobët, do të kemi një periudhë përfitimi që duhet të kemi kujdes.
Fjala kyçe: Energji-efikas, ndërtesat ekzistuese, Poloni, Kosovë, izolimin,
dritare, simulimi, kushtet e përfitimit.

Foreword Dear readers,
This bachelor thesis has arisen subsequent to a discussion with Johnny
Åstrand and Erik Johansson from the department of Housing Development
and Management at the University in Lund. It has been written during the
spring of 2012, and it was the last part of our education before we were
provided the title as Bachelors of Science in Civil Engineering.
First of all we would like to thank both our examiner Johnny Åstrand and our
tutor Erik Johansson for helping us developing this subject, during our first
meeting in the fall of 2011. Apart from that we would like to express a special
thank to Erik Johansson, who has shown great commitment concerning this
report and for providing us with all the assistance that was needed to make this
report possible.
Then we would like to express our deepest thanks to our respective beloved
relatives in Poland and Kosovo, who have been very helpful by organizing our
interviews and various meetings during our visit. We also want to thank our
families and friends, who have supported us, not only during the accomp-
lishing of this report but also throughout our whole education.
Finally, we wish a pleasant reading, with the hope that the information in this
report can contribute to give you a sense of how the process of making
existing buildings energy efficient works.
Helsingborg, June 2012
Alan Esad, Fatri Rexhepi
Division of work Alan Esad: 2, 3.1-3.2, 4, 5.1, 6.1, 7.1-7.3, 8.1.
Fatri Rexhepi: 3.3, 5.2, 6.2, 7.4, 8.2.
Together: 1, 9, Foreword, Abstracts, Simulations and Interviews.

List of contents
1 Introduction ..................................................................................... 1
1.1 Background ............................................................................... 2
1.2 Objectives .................................................................................. 4
1.3 Target group .............................................................................. 4
1.4 Method ....................................................................................... 4
1.5 Limitations ................................................................................. 5
1.6 Structure of thesis .................................................................... 5
2 Historic development of housing and building technology ......... 7
2.1 Historic development of housing ............................................ 7
2.1.1 The growth of housing units in Poland .................................. 7
2.1.2 Evolution of building technology in Poland ........................... 7
2.1.3 The growth of housing units in Kosovo ................................. 8
2.1.4 Evolution of building technology in Kosovo ........................... 8
3 Climate analysis .............................................................................. 9
3.1 General information .................................................................. 9
3.2 Poland ........................................................................................ 9
3.2.1 Climate ............................................................................... 10
3.2.1.1 Climatic factors ............................................................ 10
3.2.1.2 Mahoney & Givoni recommendations ........................... 11
3.3 Kosovo .................................................................................... 12
3.3.1 Climate ............................................................................... 12
3.3.1.1 Climatic factors ............................................................ 12
3.3.1.2 Mahoney & Givoni recommendations ........................... 14
4 Theory ............................................................................................ 15
4.1 Energy theory .......................................................................... 15
4.1.1 Energy sources .................................................................. 15
4.1.1.1 Coal ............................................................................. 16
4.1.1.2 Oil Products ................................................................. 16
4.2 Climate and its natural influence ........................................... 16
4.2.1 Indoor comfort .................................................................... 16
4.2.2 Orientation .......................................................................... 17
4.2.3 Wind direction..................................................................... 19
4.2.4 Solar Radiation ................................................................... 19
4.3 Moisture theory ....................................................................... 19
4.4 Heating theory ......................................................................... 20
4.5 Air tightness ............................................................................ 21
4.6 Thermal bridges ...................................................................... 22
5 Thermal performance of the buildings before improvements.... 23

5.1 Poland ..................................................................................... 23
5.1.1 Floor plan ........................................................................... 23
5.1.2 Elevations .......................................................................... 23
5.1.3 Roof ................................................................................... 23
5.1.4 Exterior walls ...................................................................... 26
5.1.5 Windows ............................................................................ 27
5.1.6 Air tightness ....................................................................... 28
5.1.7 Measured indoor climate in the house ................................ 29
5.2 Kosovo .................................................................................... 31
5.2.1 Floor plan ........................................................................... 31
5.2.2 Elevations .......................................................................... 31
5.2.3 Roof ................................................................................... 31
5.2.4 Exterior walls ...................................................................... 32
5.2.5 Windows ............................................................................ 34
5.2.6 Air tightness ....................................................................... 35
5.2.7 Measured indoor climate in the house ................................ 35
6 Measures to improve the energy efficiency ................................ 38
6.1 Poland ..................................................................................... 38
6.1.1 Roof ................................................................................... 38
6.1.2 Exterior walls ...................................................................... 39
6.1.3 Windows ............................................................................ 40
6.1.4 Air tightness ....................................................................... 41
6.2 Kosovo .................................................................................... 41
6.2.1 Roof ................................................................................... 41
6.2.2 Exterior walls ...................................................................... 42
6.2.3 Windows ............................................................................ 43
6.2.4 Air tightness ....................................................................... 44
7 Simulations & calculations ........................................................... 45
7.1 Simulation program ................................................................ 45
7.2 Conditions ............................................................................... 45
7.3 Poland ..................................................................................... 45
7.3.1 Case 1 – Before improvements .......................................... 46
7.3.1.1 Calculated results ........................................................ 46
7.3.2 Case 2 – Improvement of air tightness ............................... 47
7.3.2.1 Calculated results ........................................................ 47
7.3.3 Case 3 – Roof with 300 mm of supplementary insulation ... 48
7.3.3.1 Calculated results ........................................................ 48
7.3.4 Case 4 – External wall with 80 mm of supplementary insulation..................................................................................... 49
7.3.4.1 Calculated results ........................................................ 49
7.3.5 Case 5 – Improvement of windows .................................... 49
7.3.5.1 Calculated results ........................................................ 49

7.3.6 Case 6 – Combined improvement ...................................... 50
7.3.6.1 Calculated results ........................................................ 50
7.3.7 Conclusion over results from DEROB-LTH ......................... 50
7.4 Kosovo .................................................................................... 51
7.4.1 Case 1 – Before improvements .......................................... 52
7.4.1.1 Calculated results ........................................................ 52
7.4.2 Case 2 – Improvement of air tightness ............................... 53
7.4.2.1 Calculated results ........................................................ 53
7.4.3 Case 3 – Roof with 120 mm of supplementary insulation ... 54
7.4.3.1 Calculated results ........................................................ 54
7.4.4 Case 4 – External wall with 120 mm of supplementary insulation ..................................................................................... 54
7.4.4.1 Calculated results ........................................................ 55
7.4.5 Case 5 – Improvement of windows ..................................... 55
7.4.5.1 Calculated results ........................................................ 55
7.4.6 Case 6 – Combined improvement ...................................... 55
7.4.6.1 Calculated results ........................................................ 56
7.4.7 Conclusion over results from DEROB-LTH ......................... 56
8 Payback time for increasing the energy-efficiency ..................... 58
8.1 Poland ...................................................................................... 58
8.1.1 Materials ............................................................................. 58
8.1.2 Costs .................................................................................. 59
8.1.3 Calculations ........................................................................ 59
8.1.3.1 Savings after measures ............................................... 60
8.2 Kosovo .................................................................................... 60
8.2.1 Materials ............................................................................. 60
8.2.2 Costs .................................................................................. 61
8.2.3 Calculations ........................................................................ 62
8.2.3.1 Savings after measures ............................................... 62
9 Discussion and conclusions ........................................................ 64
References ........................................................................................ 69
Annexes ............................................................................................ 72
1 Interviews ....................................................................................... 72
1.1 Interview with Zbigniew Stempak, Poland ............................ 72
1.2 Interview with Latif Jashari, Kosovo ..................................... 74
2 Floor plan ....................................................................................... 77
2.1 Poland ...................................................................................... 77
2.2 Kosovo .................................................................................... 78
3 Givoni charts ................................................................................. 79
3.1 Wroclaw ................................................................................... 79
3.2 Pristina .................................................................................... 80

4 Mahoney table ............................................................................... 81
4.1 Wroclaw ................................................................................... 81
4.2 Pristina .................................................................................... 83


1
1 Introduction
In recent years the issue of energy has created quite a stir because of the global
warming. It is increasing due to the greenhouse gases emitted from factories,
cars etc. This in turn means that the atmosphere gets less permeable to long-
wave radiation, which means that it becomes thicker and the average temp-
erature on earth increases sharply (Climate, 2012). If the mankind does not
come up with a sustainable solution in the near future, we can expect some
devastating damage to our planet. It has become an important topic around the
world, and the question everyone is asking themselves, is how to reduce the
energy consumption in a sustainable manner.
The use of energy is as of today a huge part of our society, and the usage
varies depending on the countries needs, economical finances, conditions and
climate. To obtain a structure of energy consumption several countries have
joined various types of agreements such as the Kyoto Protocol and the
European Climate Change Program. These agreements contain different types
of goals on how to achieve a greener environment (Energy, 2012).
These agreements which we mentioned in the previous paragraph are often
achieved politically. It is therefore vital that ordinary citizens get the
knowledge needed to contribute towards a greener environment. One way
which we believe in and that probably will solve plenty of problems is the
energy efficiency measure of buildings. The building sector represents a high
proportion of the total energy expenditure in a country, it is therefore imp-
ortant to let people get acquainted with the benefits of building energy-
efficient.
The EU government has together with its members come to an agreement
which says that all new buildings should be “near-zero-energy” by the year
2020 (Energy buildings, 2012). This is now seen as a very positive act, but
still there are plenty of existing buildings left that needs to get modernized to
even get close to the requirements of being a “near-zero-energy” building.
People who have already built their houses before this agreement do not have
to modernize it. But it is important to give them the proper information if they
eventually would consider making a modernization. This information should
include the benefits that exist economically and energy wise, and further on
declare what savings they can make over time.
In this chapter we will discuss how we will carry out the process of making
existing residential buildings energy-efficient in Poland and Kosovo.
2
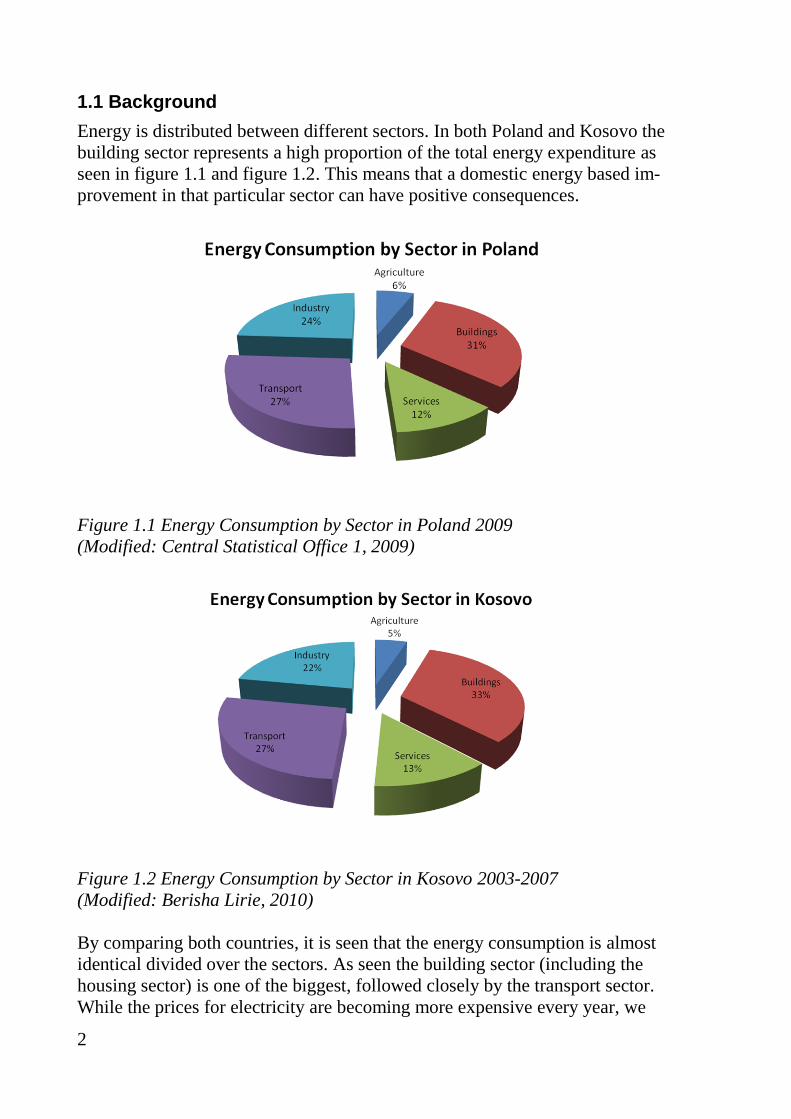
1.1 Background
Energy is distributed between different sectors. In both Poland and Kosovo the
building sector represents a high proportion of the total energy expenditure as
seen in figure 1.1 and figure 1.2. This means that a domestic energy based im-
provement in that particular sector can have positive consequences.
Figure 1.1 Energy Consumption by Sector in Poland 2009
(Modified: Central Statistical Office 1, 2009)
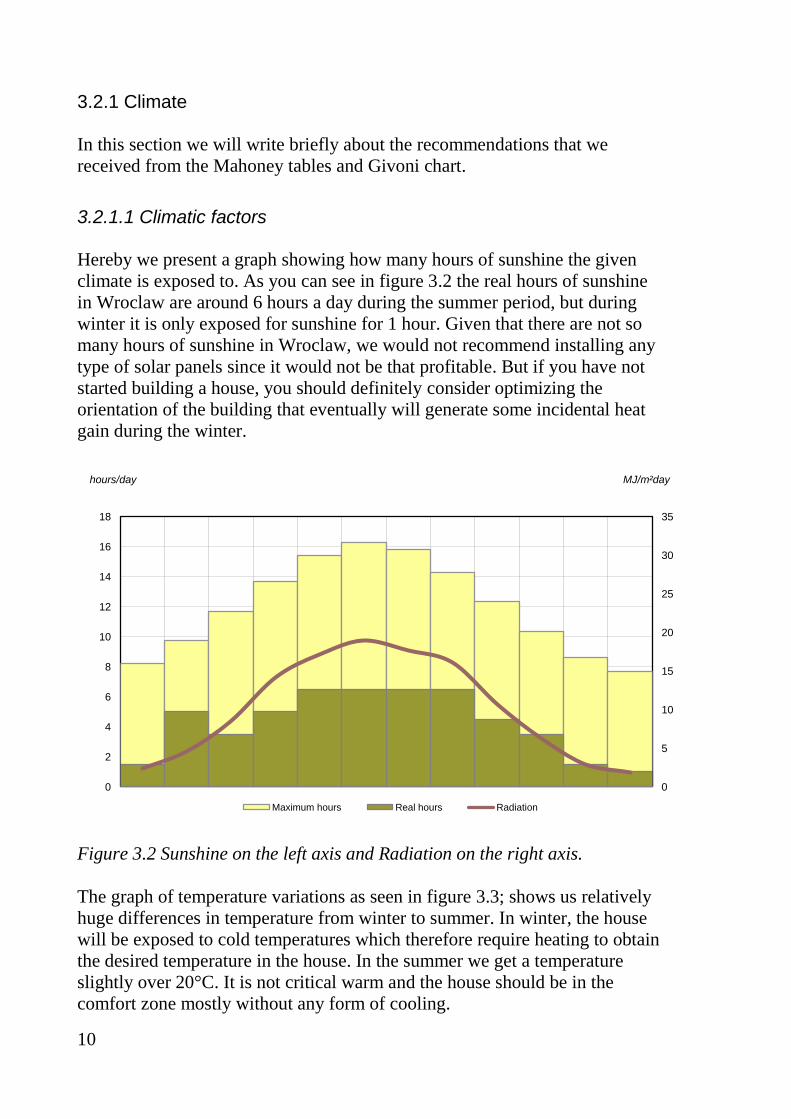
Figure 1.2 Energy Consumption by Sector in Kosovo 2003-2007
(Modified: Berisha Lirie, 2010)
By comparing both countries, it is seen that the energy consumption is almost
identical divided over the sectors. As seen the building sector (including the
housing sector) is one of the biggest, followed closely by the transport sector.
While the prices for electricity are becoming more expensive every year, we

3
strive to be more efficient with our use of electricity, since we want to pay less
for heating. The main reason for that is because of the technological develop-
ment in the last decades. We now have much richer equipment in the house-
holds than before; like computers, washing machines, televisions etc. The
usage and extraction of energy sources has led to an increased concentration
of carbon dioxide in the air. In both Poland and Kosovo the production of
electricity is coming largely from fossil fuels.
Figure 1.3 Final Energy Consumption by Energy Carrier in Kosovo 2007
(Modified: Energy development, 2007)
Figure 1.4 Final Energy Consumption by Energy Carrier in Poland 2009
(Modified: Central Statistical Office 2, 2009)

4
The constant use of fossil fuels is not sustainable in the long run. Therefore,
countries that have the opportunity must take advantage of the technology that
exists, which is not dependent of fossil fuels. Measures to improve existing
buildings are one solution; the idea with this is to minimize the use of heating
as much as possible.
1.2 Objectives
The purpose of doing this bachelor thesis is to create sort of a guideline to
follow on how to modernize your own house in terms of local costs and
availability of materials. We want to provide a basis for our target group on
how to make this kind of procedure as efficient and economical as possible.
This research will be written in a reasonable level so that a person that is not
familiar with this subject can understand and perform our recommendations.
Our intention is to come up with various proposals on how to make a building
energy-efficient. Further on we will describe which of the proposed solutions
that is most profitable and energy-efficient, this will give our target group the
opportunity to make a choice on how they want to modernize their building
based on their economical life and needs.
1.3 Target group
This research is primarily intended for the inhabitants in Poland and Kosovo,
since all the calculations are based on their energy- and material costs. Con-
cerning the selection of the houses that we have studied, we chose to look at
our relative’s houses. We think that they represent very well the houses that
have been built in recent years in both countries. When it comes to the exe-
cution of the modernization, we would gladly encourage others than our target
group to take part of this research and use it as a guideline.
1.4 Method
By doing this research we want to assure ourselves that this bachelor thesis is
qualified to be as complete as possible. Therefore we have chosen to travel to
both destinations, and once there collect vital information such as material
costs and availability of materials. We stayed for a week in both countries; the
trip to Kosovo was in 11th-17
th of March and from 29
th of March to 5
th of April
in Poland. We also want to illustrate in this report with plenty of pictures that
has been taken during our trips, in this way the reader will more easily under-
stand what we describe. In order to collect information about materials we
contacted a building company or a person who works within the building
sector. What we did was that we interviewed those persons about the dev-
elopment of building houses over the last years and what requirements there
exist. The costs that we wanted to obtain from each country are the following:

5
Energy Carrier
Electricity (kWh)
Energy Source
Fuel oil
Materials
Windows
Insulation
Apart from that we have sent devices to each house that measure the inside
temperature under a longer period of time. Both devices were sent in
November 2011. In Kosovo, the device measured the indoor temperature from
5th
of December to 11th
of March. In Poland the measuring started in 1st of
December and ended in 4th
of April. Those measurements are meant to help us
when we do our energy simulations, so that we can compare our measured
values against the values we get from the simulation.
To help us simulate our improvements in our buildings we have received an
application called DEROB-LTH. This is an energy simulation application
which was at the very first developed by the University of Texas, and later on
further developed by LTH. This will help us to see how the solar radiation,
sun blinds and the given climate affect the energy balance in our two
buildings.
1.5 Limitations
Our study includes two houses; the first one in Poland and the second one in
Kosovo which represents the houses built in recent years. In our simulations
and calculations, we use parameters and values that cannot be used on other
buildings in similar studies.
We have laid focus on the improvement of windows, external walls and roofs.
Other factors that can affect the energy consumption are also mentioned, but
no further calculations have been made.
1.6 Structure of thesis
Chapter 1 – An introduction of the problem and further on what method we
will use to answer it.
Chapter 2 – Explaining how the housing unit looks in Poland and Kosovo as
of today, and how the building technology has evolved over the years.

6
Chapter 3 – A climate analysis for the two houses, where we mention the
various recommendations that the Mahoney tables and the Givoni chart gives
us.
Chapter 4 – Simplified theory, where we explain the various factors that affect
and influence the energy consumption of a building.
Chapter 5 – An investigation of the various building elements that we want to
improve. Here we discuss and analyze what disadvantages there is with the
existing buildings.
Chapter 6 – With the knowledge that we acquired from the investigation, we
follow up with a discussion where we propose solutions that contribute to an
energy efficient building.
Chapter 7 – We simulate the proposals that we have come up with, and obtain
what reduction in energy consumption there is.
Chapter 8 – We calculate the profitability of each improvement, where we
show how long the payback period is.
Chapter 9 – A discussion of our results that we obtained from each house,
where we make our own conclusions.

7
2 Historic development of housing and building technology
2.1 Historic development of housing
In this section we looked at how the number of housing units has changed in
the recent years in both Poland and Kosovo, and how the building sector has
evolved in terms of materials and the way the buildings are built.
2.1.1 The growth of housing units in Poland
After the fall of communism in Poland in the year 1989, the housing supply
that existed was less than the demand. Therefore, they started to build a lot of
houses and apartments to cover this demand. After about a decade, more
precisely in the year of 2002 there was still a deficit in the household sector
which approximately was estimated to 1.5 million.
Many houses in Poland were built during the 70’s; together they account a
total amount of 40 % of all houses built in Poland. These houses are built with
older technology and will definitely require some sort of renovation to meet
the energy requirements as of today. By improving such large percentage of
houses, positive results can be achieved from an energy point of view (OECD,
2012).
2.1.2 Evolution of building technology in Poland
From the interview with Zbigniew Stempak (2012), we were told that Poland
had undergone a major change when it comes to the building technology.
Under socialism, everything in terms of materials was highly limited. Because
of the lack of materials, people had to wait a long time before they could get
their order of materials. This is why it could take several years to complete a
house. In many cases, you had to make your own concrete on site, something
that is unimaginable in today’s Poland. Zbigniew Stempak (2012) further on
explained that as of today there is no limitation but your financial pocket,
when it comes to how you want to build your own house. After Poland joined
the European Union in 2004, the availability of materials expanded even more,
since then they have now access to the latest technology within the building
sector.

8
2.1.3 The growth of housing units in Kosovo
The growth of housing units is something that is increasing dramatically
worldwide, because more and more people would rather have a house than an
apartment if the economy permits. In Kosovo, the household growth increases
due to the increased population in the country.
Hereby, we present some data from the Federal Office of Former Yugoslavia
on how the growth of households has moved forward between the years 1948
and 1991. In 1948 Kosovo had a total of 733 132 inhabitants and 115 293
households scattered over the country. In under 50 years, more precisely in the
year 1991 the total amount of inhabitants had grown to 1 956 196 and the
households had increased to 289 246 (Households in Kosovo, 2008).
As of the year 2009 the total population of Kosovo was around 2 207 000
inhabitants. The households has compared to the statistics from 1991
decreased to 274 223 (Population in Kosovo, 2010). The reason for the
reduction of households may depend on different factors. As Latif.Jashari
(2012) pointed out in the interview, he said that many houses built outside the
cities are not being correctly registered as they should be, that is why the
number of household may be higher than presented.
2.1.4 Evolution of building technology in Kosovo
Since the war ended in 1999, Kosovo has steadily progressed in terms of
building technology. Before the war, Latif Jashari (2012) explained that there
were a lot of houses built by inexperienced and uneducated people, which lead
to an outcome of building errors. Plenty of single family houses have been
built all over the country. They all use pretty much the same material in the
building framework, in this case hollow bricks. This is probably due to the
limited choice of materials, and because there exists a relatively huge
difference in terms of costs if you eventually would consider a building
framework built of wood or concrete. A huge part of the materials that were
available were imported from Slovenia.

9
3 Climate analysis
3.1 General information
In the spring of 2012 we had a course called International Sustainable
Construction (ABA600) within our education. During that course we got
acquainted with how to build sustainably in different kind of climates around
the world. We also got an Excel-document where we were able to input
various climate data and then obtain results from the Mahoney tables and the
Givoni chart (Givoni, 1998).
The Mahoney tables give general recommendations to consider when
choosing to build a house in the specified climate. To mention a couple of the
recommendations that is given in the table; such as orientation, air movement,
openings in the building etc. As for the Givoni chart you get a diagram with
various zones where one of them is a comfort zone. Based on the given cli-
mate we can see how well it relates to the comfort zone during the different
months. In certain months the given climate will not be in the comfort zone,
instead it ends up in other zones which tell you if heating, ventilation, cooling
etc is required (Givoni, 1998).
3.2 Poland
The house in Poland is located in a small village called Mierzwin, it was
completed in 2002. Since we were unable to obtain climate data for that
particular village, we use climate data from the nearest city which is Wroclaw.
Figure 3.1 The house in Poland
10
3.2.1 Climate
In this section we will write briefly about the recommendations that we
received from the Mahoney tables and Givoni chart.
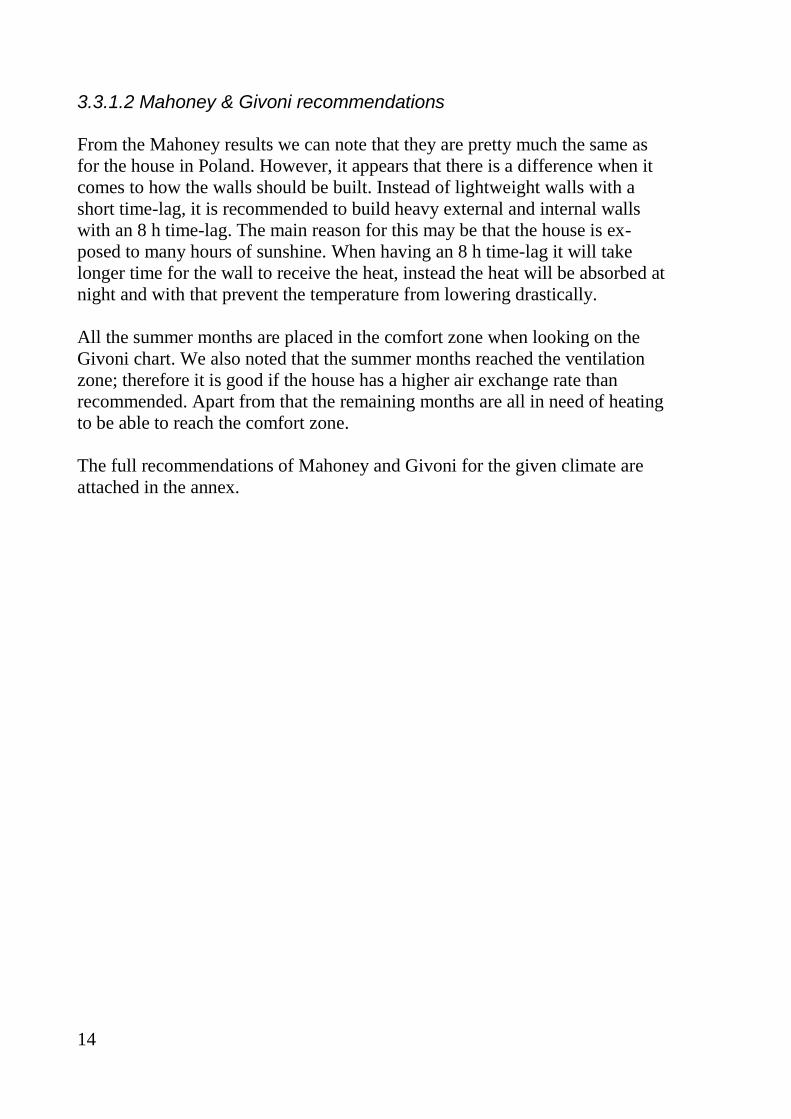
3.2.1.1 Climatic factors
Hereby we present a graph showing how many hours of sunshine the given
climate is exposed to. As you can see in figure 3.2 the real hours of sunshine
in Wroclaw are around 6 hours a day during the summer period, but during
winter it is only exposed for sunshine for 1 hour. Given that there are not so
many hours of sunshine in Wroclaw, we would not recommend installing any
type of solar panels since it would not be that profitable. But if you have not
started building a house, you should definitely consider optimizing the
orientation of the building that eventually will generate some incidental heat
gain during the winter.
Figure 3.2 Sunshine on the left axis and Radiation on the right axis.
The graph of temperature variations as seen in figure 3.3; shows us relatively
huge differences in temperature from winter to summer. In winter, the house
will be exposed to cold temperatures which therefore require heating to obtain
the desired temperature in the house. In the summer we get a temperature
slightly over 20°C. It is not critical warm and the house should be in the
comfort zone mostly without any form of cooling.
0
5
10
15
20
25
30
35
0
2
4
6
8
10
12
14
16
18
MJ/m²day hours/day
Maximum hours Real hours Radiation

11
Figure 3.3 Temperatures in Wroclaw
3.2.1.2 Mahoney & Givoni recommendations
As we mentioned earlier in this chapter, the Mahoney table gives you certain
recommendations to consider when building a house in the given climate.
Regarding the orientation of the building it is recommended that the long axis
of the building is placed from east to west in order to take maximum advan-
tage of the solar radiation. The positive thing here is that the house in Poland
fortunately is placed in that particular way. When it comes to wall and roof
recommendations, it says that lightweight constructions should be applied
with short time-lag. Note that time-lag is a description of how fast a structural
component can claim the heat that is produced by the nature.
From the Givoni chart we noted that all the summer months are placed in the
comfort zone, and it would be enough with internal gain from human beings
needed if it tends to get slightly colder. The remaining months need heating to
be able to reach the comfort zone.
The full recommendations of Mahoney and Givoni for the given climate are
attached in the annex.
-5
0
5
10
15
20
25
30
Jan Feb Mar Apr May Jun Jul Aug Sep Oct Nov Dec °C
Extreme max Mean max Mean Mean min Extreme Min

12
3.3 Kosovo
The house that we have chosen to study in Kosovo is located in the outer edge
of Mitrovice. This house is relatively new considering that it was completed in
2008. The same conditions applies here as in the house in Poland; we could
not get hold of the climate data for Mitrovice, so instead all data is based on
the climate in Pristina which is located barely 40 km from our target.
Figure 3.4 The house in Kosovo
3.3.1 Climate
In this section we will write briefly about the recommendations that we
received from the Mahoney table and Givoni chart.
3.3.1.1 Climatic factors
Figure 3.5 shows how many hours of sunshine Pristina is exposed to. During
the summer we can get up to 9 hours of sunshine. When being exposed to the
sun that much, the house can easily obtain a high temperature and become
uncomfortable indoors. In figure 3.4 you can note that the house in Kosovo
has a relatively large window area on one of the elevations, and therefore it is
vital to consider having proper sun protection, if possible external. In winter
we have about 2 hours of sunshine, and by having this huge amount of
windows may help generating incidental heat gain.

13
Figure 3.5 Sunshine on the left axis and Radiation on the right axis.
In figure 3.6 we are showing a graph of how the temperature varies during the
year in Pristina. During the summer the temperature is at least 20°C. Com-
bining the high temperature with the high amount of sunshine hours, the
building’s indoor climate can become pretty uncomfortable if no ventilation
and shading is used.
Figure 3.6 Temperatures in Pristina
0
5
10
15
20
25
30
35
0
2
4
6
8
10
12
14
16
18
MJ/m²day hours/day
Maximum hours Real hours Radiation
-5
0
5
10
15
20
25
30
Jan Feb Mar Apr May Jun Jul Aug Sep Oct Nov Dec °C
Extreme max Mean max Mean Mean min Extreme Min
14
3.3.1.2 Mahoney & Givoni recommendations
From the Mahoney results we can note that they are pretty much the same as
for the house in Poland. However, it appears that there is a difference when it
comes to how the walls should be built. Instead of lightweight walls with a
short time-lag, it is recommended to build heavy external and internal walls
with an 8 h time-lag. The main reason for this may be that the house is ex-
posed to many hours of sunshine. When having an 8 h time-lag it will take
longer time for the wall to receive the heat, instead the heat will be absorbed at
night and with that prevent the temperature from lowering drastically.
All the summer months are placed in the comfort zone when looking on the
Givoni chart. We also noted that the summer months reached the ventilation
zone; therefore it is good if the house has a higher air exchange rate than
recommended. Apart from that the remaining months are all in need of heating
to be able to reach the comfort zone.
The full recommendations of Mahoney and Givoni for the given climate are
attached in the annex.

15
4 Theory
In our bachelor thesis we will go deeper in how to make a building more
energy efficient, therefore our research and calculations will only be energy
based. But still there will be other important factors that affect the buildings
construction, materials and indoor comfort. Such factors as heating, solar
radiation, thermal bridges etc. may have a vital impact. Those factors will be
further explained in an understandable level in this chapter so that the reader
can understand different terms, what complications and possible solutions the
buildings have when we describe them in detail in our structural examination.
4.1 Energy theory
As mentioned earlier heating buildings stands for a relatively huge proportion
of the total energy consumption, this in turn means increased carbon dioxide
emission. We heat our buildings with different types of energy sources, dep-
ending on what heating energy requirement there is. The choice of using one
specific energy source is usually based on availability and costs.
4.1.1 Energy sources
From each type of fuel different amount of kWh can be extracted. In table 4.1
there is a list of different fuels and their specific energy value.
Table 4.1 Heating values of fuels
(Modified: Energifakta, 2010)
Amount/unit Fuel kWh/unit
1 tonne Coal 7560
1 m³ Oil 10070
1 m³ Rapeseed oil 9340
1 m³ Motor gasoline 9100
1 m³ Ethanol 5900
1000 m³ Natural Gas 11048
1 tonne Pellet, 11 % moisture 4670
1 tonne Fuel wood, 30 % moisture 3530
1 tonne Peat, 35 % moisture 3550
1 tonne Household waste 2800
1 kg Natural uranium 140000

16
Here comes a general description of the most common energy sources in
Poland and Kosovo. And further on an explanation of what advantages and
disadvantages there may be with each specific energy source.
4.1.1.1 Coal
Coal is a fossil fuel that is widely used around the world. Its main purpose is
to be used as an energy feedstock in the production of electricity and heat. In
Poland and Kosovo there is a huge amount of coal and it is considered being
an important energy source. The most notable negative impact that coal has on
the environment is that it generates a huge amount of carbon dioxide emis-
sions when extracted that in turn affects the climate (Coal, 2012).
4.1.1.2 Oil Products
Oil products are as of today one of the most if not the most used energy source
around the world. It is very easy to come by, that is why it is mainly used as
fuel by the transport sector and the industry sector. Like coal it is affecting the
environment negatively when used. More and more people are using oil when
heating up their buildings during winter. To prevent the central boiling heater
from releasing greenhouse gases when oil is being burned there is a modern
technology which filters out most of the toxin (Oil, 2012). In terms of
disadvantages, besides emitting greenhouse gases the price of oil has increased
dramatically in recent years.
4.2 Climate and its natural influence
In this section we will write briefly about how various factors from the en-
vironment affects the building’s indoor climate. Further on mentioning how to
deal with them to make the building as efficient as possible.
4.2.1 Indoor comfort
Information in this section is taken from, “Projektering av VVS-
installationer”. (Source: Warfvinge and Dahlblom, (2010)).
Everyone wants to experience the best possible indoor comfort in their own
house. The requirement for what we as individuals think is the most suitable
indoor temperature varies. There are a couple of factors that influence the
indoor comfort, some are dependent on individuals and the other depends on
the environment. We will mainly focus on the factors that are influenced by

17
the environment, since they have the greatest impact on the behaviour of the
indoor temperature. The factors are as follows:
Air temperature
Air velocity
Ambient surface temperature
Air humidity
The measuring of air temperature is something that we all are very familiar
with. We use the temperature as a measure of how comfortable it is in a place
where we are staying. Under a whole year period the indoor temperature var-
ies depending on the seasons, in winter it usually should be around 20 °C and
in summer up to 25 °C.
High air velocity can contribute to a local cooling of the body. The reason for
an increase in air movements may be due to leaks and cold downdraught caus-
ed resulting from the cold surface of the window.
Given that the thermal conductivity varies depending on the materials, it creat-
es temperature differences on the ambient surfaces. An example of that is
when we approach a window which usually has a lower temperature, what
happens is that the human body loses heat through thermal radiation and that
leads to a local cooling of our body temperature which often can be perceived
as discomfort.
During the summer when the air temperature rises inside a building, the air
humidity can have a negative impact on the human body if it tends to rise.
The reason of high air humidity can be due to increased sweating by us human
beings, it is therefore important to have different kind of apertures so that
airing can be applied when needed.
4.2.2 Orientation
To reduce the cost of heating during the winter we want to have access to as
much incidental heat gain in form of sun heat as possible. But during the sum-
mer we want the contrary, instead we strive to reject as much as sun heat as
possible. Therefore, we have to find a balance in between that suits us perfect-
ly, that is why orientating a building plays a major part.

18
Figure 4.2 Movement of the sun during the winter and summer.
(Source: Orientation, 2011)
The most optimum solution is to place the long axis of the building from east
to west as seen in figure 4.2. By placing a relatively huge area of windows on
the southern elevation the building will be able to generate plenty of incidental
heat gain during the heating season if correctly done.
Figure 4.3 Function of a Passive Solar House
(Source: Passive Solar, 2011)

19
In figure 4.3, we can see how it might look like when trying to build with solar
radiation in mind. It is not only important to get incidental heat gain during
winter. What also must be in mind is to adapt the building so that it can protect
the building from solar radiation during summer, when the sun is positioned
higher up in the sky. By having a sufficient depth to the eaves (control in
figure 4.3), you will be able to prevent the solar radiation from entering the
building (Passive Solar, 2011).
4.2.3 Wind direction
When building a house, it is positive if you can use the wind direction effect-
ively as a cooling mechanism during the summer. Given that the wind direc-
tion varies depending on where you are, it becomes difficult to orientate the
building effectively if you also are having the solar radiation in mind. A di-
lemma arises and you will have to study which of the factors that is most
rewarding based on the climate. What you can do is to orientate the building
so that it partially can take advantage of both the sun and wind, or just totally
focus on one another (Wind direction, 2009).
4.2.4 Solar Radiation
Part of the information in this section is taken from, “Praktisk
Byggnadsfysik”. (Source: Sandin, (2009)).
Solar radiation can have a major impact on a buildings energy balance. If a
house is poorly insulated you can get major heat losses in the form of trans-
mission. Therefore it is good if a building can take advantage of the solar
radiation that exist in the given climate, and by that get incidental heat gain to
somewhat compensate the heat losses (Solenergi, 2010)
Solar radiation is measured in W/m². When the solar radiation is directed
perpendicular to the surface it strikes it is measured 1090 W/m². This value is
called the solar constant. The solar radiation varies around the world depend-
ing on the climate; if it tends to be cloudy often it will definitely inhibit the
intensity of the solar radiation.
4.3 Moisture theory
Information in this section is taken from, “Praktisk Byggnadsfysik”. (Source:
Sandin, (2012)).
Moisture can cause major problems and cause poor thermal insulation in a
building. Therefore it is important to notice that when a modernization is

20
being made, building only from an energy perspective is not that clever. It is
also vital to be aware of what moisture consequences there exist.
Moisture can be transported through the construction in two different ways; by
water vapour convection and water vapour diffusion.
Water vapour diffusion occurs when there is a difference in the vapour
concentration. What happens then is that the vapour concentration wants to
equal on both sides which creates a moisture transfer. Water vapour
convection is more complicated to resist, it is caused by differences in the
atmospheric pressure. This difference in pressure is created by the action of
internal wind, temperature differences and ventilation arrangements.
4.4 Heating theory
Information in this section is taken from, “Praktisk Byggnadsfysik” and “Fukt
handbok”. (Source: Nevander and Elmarsson, (2006) and Sandin, (2009)).
A building can lose thermal energy in two ways; through transmission and
ventilation. It is therefore important to reduce these losses by carrying out
certain basic steps. Transmission losses mean that you lose heat through
windows, walls, roof and ground. By properly insulating the building envelope
you can obtain minimal heat losses. When it comes to ventilation losses the
real culprit here are the air leakages that exist around the building. This can be
reduced by applying airtight layers where the risk can occur. Those risks can
usually be found where the roof and wall meet and even in the air- inlet and
outlet.
The thermal energy will transport as soon as there is a temperature difference
between two spaces, because it wants to equalise the temperatures. This heat
transfer can be divided into three different procedures; those are radiation,
convection and conduction.
The phenomenon radiation is generated when heat is transferred from a
warmer surface to a colder surface. An example of this is during winter
as the window surface becomes cold it absorbs the heat from the ceiling
that in turn becomes cooled down remarkably.
Convection means that a gas or a fluid flows past surfaces transporting
heat. The causes of convection can be described as natural and forced.
Natural convection occurs due to the temperature differences in the air,
further on providing density differences where warm air rises and cold
air drops. Forced convection is a result of external influences such as
winds and fans.

21
Conduction occurs when thermal energy is transported through solid
materials such as concrete, steel and bricks. The coefficient of thermal
conductivity differs among all materials, which is why we human
perceive certain materials colder than others even though they have the
same temperature.
When performing calculations regarding heating a term called U-value is often
used. The definition of U-value is as follows “the amount of heat that per unit
time is passed through a unit area of the structure when the difference in air
temperature on both sides of the structure is one degree”.
Apart from that there is also a measure of how well the thermal insulation
capacity is in a given material. This term is called thermal conductivity and
often in calculations written as λ-value. It’s defined as “the amount of heat
that per second is passed through an m² of a material with a thickness of 1 m
when the air temperature difference is one degree”. The lower the value is the
better it is from an insulation point of view.
4.5 Air tightness
In Sweden there is an administrative authority named Boverket, this agency is
in charge of matters relating to the built environment and conservation of land
and water areas, land-use planning, construction and management of buildings
and housing issues (Boverket 1, 2012). Within Boverket there is an established
collection of building codes named BBR, this lattice contains the requirements
and rules on how to build and should be approached as a helping guide. Here
is an excerpt from chapter 6 in BBR about air tightness.
6:531, Air tightness
General recommendation
“To avoid damage due to water vapour convection the buildings climate
separated parts should have as good air tightness as possible. In most
buildings the risk of water vapour convection is huge in the upper building
parts, i.e. when there’s an internal overpressure. Special care in achieving air
tightness is advised when there’s high moisture loads in swimming facilities or
at very high temperature differences. The air tightness can affect the moisture
condition, thermal comfort, ventilation and the buildings heat loss. Method for
determining air leakages is described in SS-EN 13829. For the determination
of possible air leakages it should also be examined whether the air leakage is
concentrated to any building part. If so the risk of moisture damage exists”.
(Boverket 2, 2012)

22
4.6 Thermal bridges
Information in this section is taken from, “Fukthandbok”. (Source: Nevander
and Elmarsson, (2006)).
Thermal bridges in all types of constructions can be very energy consuming;
therefore it is good if they can be located and minimized if not eliminated
completely. If there is a structural part with a relatively homogenous thermal
resistance, there should not be any problems at all with thermal bridges.
However if a structural part with lower thermal resistance passes through the
more homogenous structural part it will work as a thermal bridge as seen in
figure 4.4.
Figure 4.4 Intermediate floor made of concrete with lower thermal resistance
passing through the layer of insulation creating a thermal bridge.
(Source: Isover Saint-Gobain, 2012)
Problems that may occur are primarily condensation due to water vapour
diffusion and presence of mould.

23
5 Thermal performance of the buildings before improvements
In this chapter we will take a closer look at different structural parts of the
buildings. With the knowledge that we now possess from chapter 4, we will
analyze the different parts and finally come up with theoretical conclusions on
its structure. In this way we will be able to discuss the disadvantages and
advantages of how it is structured and further on how we can improve it to
make it more energy efficient. Note that all measurements are written in mm.
5.1 Poland
This is a structural analysis of the building in Poland. All photographs of the
building have been taken by us during our visit there.
5.1.1 Floor plan
The house in Poland is a one-storey house; it consists of four rooms, kitchen,
utility kitchen, laundry room and two toilets. All rooms have a single window,
except the living room that has a more open space with multiple windows. As
of today two people lives in this house, that is why only half the house area is
being heated during the winter. The reason for this is that these people only
stay in the living room and kitchen during the day and at night in their bed-
room. In consequence, the heating of all rooms would generate unnecessary
costs.
5.1.2 Elevations
The building itself is well placed in terms of orientation to the sun. The long
axis of the building runs from east to west. The majority of all windows are
installed on the southern elevation, which eventually will lead to some
incidental heat gain during the winter. In summer it can instead get pretty
warm inside if the sun radiation is allowed to go through the windows.
Luckily the depth to the eaves is enough to prevent a majority of the sun
radiation from entering.
5.1.3 Roof
The roof has a structure that is quite common among all one-story houses built
last 10 years in Poland. It is a none-insulated traditional tiled roof over a wind
space with an intermediate insulated ceiling. Hereby, we present two tables of
what the roof and loft floor is built of.
24
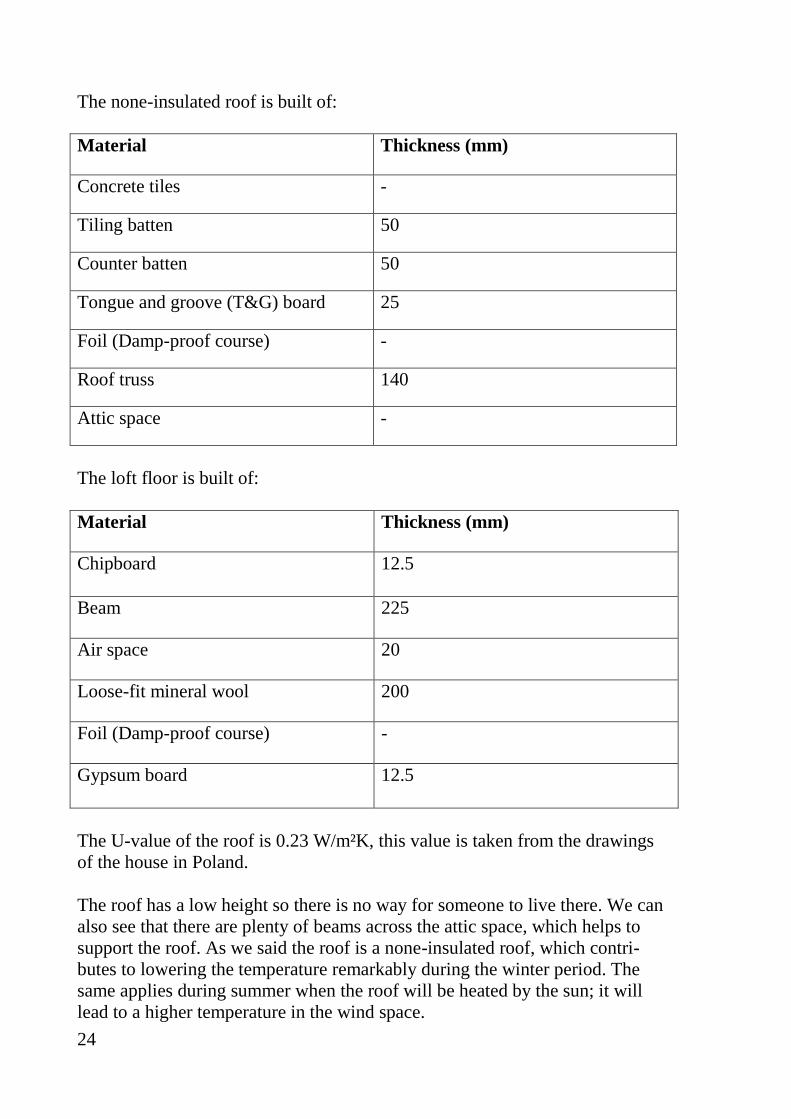
The none-insulated roof is built of:
Material Thickness (mm)
Concrete tiles -
Tiling batten 50
Counter batten 50
Tongue and groove (T&G) board 25
Foil (Damp-proof course) -
Roof truss 140
Attic space -
The loft floor is built of:
Material Thickness (mm)
Chipboard 12.5
Beam 225
Air space 20
Loose-fit mineral wool 200
Foil (Damp-proof course) -
Gypsum board 12.5
The U-value of the roof is 0.23 W/m²K, this value is taken from the drawings
of the house in Poland.
The roof has a low height so there is no way for someone to live there. We can
also see that there are plenty of beams across the attic space, which helps to
support the roof. As we said the roof is a none-insulated roof, which contri-
butes to lowering the temperature remarkably during the winter period. The
same applies during summer when the roof will be heated by the sun; it will
lead to a higher temperature in the wind space.

25
Figure 5.1 Roof construction
There are small ventilation openings that go through the ceiling; their task is to
provide the indoor space with some fresh air during the summer. But as we
noticed, these ventilation openings have given rise to some major problems.
First of all, you get a thermal bridge, which makes it possible for the heat to
easily transfer from the inside. Those living in the house have tried to elimi-
nate that problem by covering the openings with some sort of cloth, so that the
heat cannot pass though.
During the winter when the attic space is cold due to the low temperature, the
water content in the air is also low. Inside the house the temperature is higher
and in combination with some activity from the people, the water content in
the air becomes higher. What happens is that the water from the inside trans-
ports through the ventilation opening, freezes when it reaches the attic space.
After some time when the attic space becomes warmer, the water that earlier
breezed now instead melts and in turn that gives some major moisture damage
around the ventilation opening as seen in figure 5.2.

26
Figure 5.2 Moisture damage in the ventilation opening
5.1.4 Exterior walls
An external wall built of wood is not very usual to encounter in Poland.
Instead, it is usually heavy structures where the building carcass is built on
concrete. Externally directly on the concrete, you apply insulation where the
thickness varies greatly depending on how much you are prepared to invest
financially. There is no real requirement set on how much insulation that is
required. But Zbigniew Stempak (2012) told us during the interview, that the
average thickness of insulation in external walls usually nowadays is around
150 mm.
Material Thickness (mm)
Render 10
Mineral wool 120
Aerated concrete 240
Gypsum plasterboard 13

27
The external wall has a U-value of 0.27 W/m²K, this value is taken from the
drawings of the house in Poland.
As we mentioned earlier the most common building frameworks in Poland are
built on concrete and in some cases hollow bricks. The house in Poland is built
on aerated concrete which is seen in figure 5.3. This is a relatively brittle mat-
erial, and must therefore be handled with caution during the construction and
delivery. The structural strength in the concrete varies depending on how
much moisture is stored inside. If the moisture content exceeds 10 %, you will
get major changes in the structural strength. It is therefore important to have
insulation on the outside so that the concrete does not under any circumstances
get exposed to any form of moisture. The thermal conductivity is pretty low if
you compare it to standard concrete, this in turn means that it is a good
alternative from an insulation point of view (Burström, 2010).
Figure 5.3 External walls built of aerated concrete
5.1.5 Windows
All windows in the house are double glazed windows with a U-value of 2.6
W/m²K. The U-value of these windows is not good enough considering the
options that are available as of today. The windows can be opened in two diff-
erent ways; one way in which you open the whole window inwards and the

28
other way where you can tilt the top of the window inwards. The feature
where you can tilt the window inwards is very helpful during the summer,
when ventilation is useful.
All windows have a solid sun protection that can be mechanically regulated.
The good thing with these kinds of sun protections that are placed on the
outside is that it during the summer stops the heat from entering the house.
Those living in the house are claiming that the room obtains a comfortable
temperature when protected against the sun; making it easier to sleep during
the night.
Figure 5.4 Window with external sun blind
5.1.6 Air tightness
Air tightness is important to consider as it can provide unnecessary heat losses
during winter if not properly executed. In this house we noticed two culprits
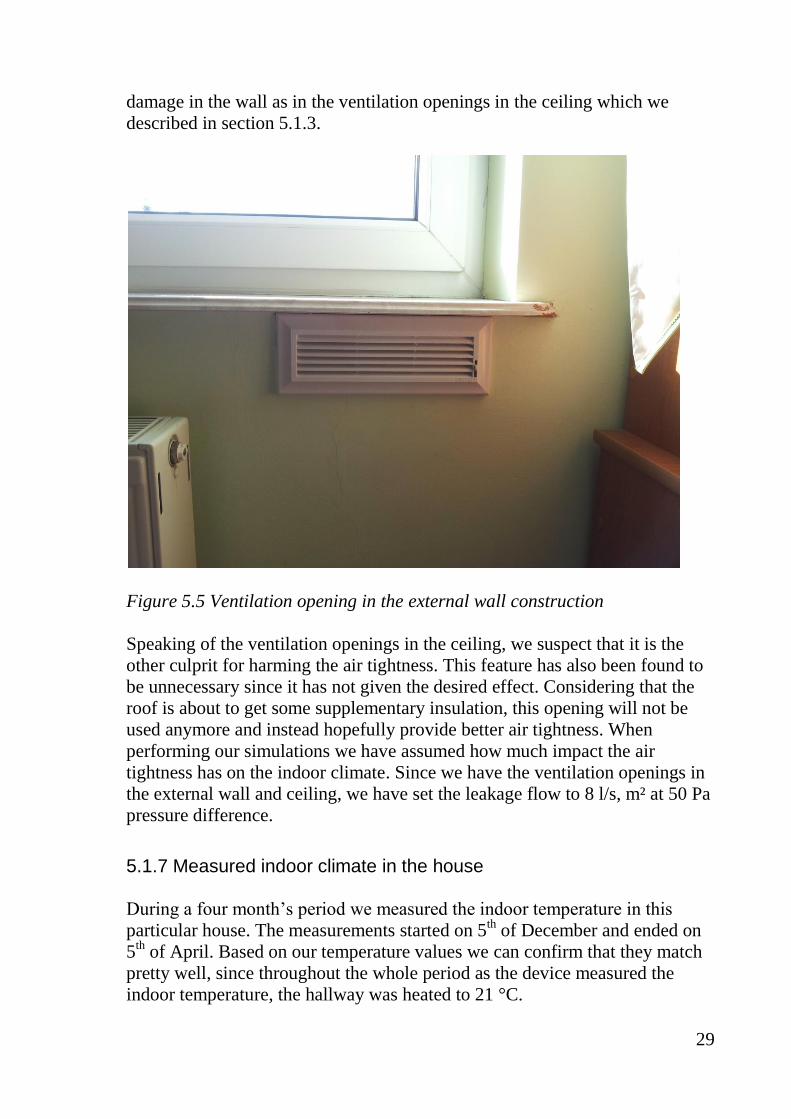
that most likely affect the air tightness. In each room there is an opening under
the window that can be regulated as seen in figure 5.5. In this way you have
the opportunity to ventilate the house with the air from the outside. We feel
that this feature is unnecessary given that you have the window that can be
tilted and fix this need. On the other hand, it can provide similar moisture
29
damage in the wall as in the ventilation openings in the ceiling which we
described in section 5.1.3.
Figure 5.5 Ventilation opening in the external wall construction
Speaking of the ventilation openings in the ceiling, we suspect that it is the
other culprit for harming the air tightness. This feature has also been found to
be unnecessary since it has not given the desired effect. Considering that the
roof is about to get some supplementary insulation, this opening will not be
used anymore and instead hopefully provide better air tightness. When
performing our simulations we have assumed how much impact the air
tightness has on the indoor climate. Since we have the ventilation openings in
the external wall and ceiling, we have set the leakage flow to 8 l/s, m² at 50 Pa
pressure difference.
5.1.7 Measured indoor climate in the house
During a four month’s period we measured the indoor temperature in this
particular house. The measurements started on 5th
of December and ended on
5th
of April. Based on our temperature values we can confirm that they match
pretty well, since throughout the whole period as the device measured the
indoor temperature, the hallway was heated to 21 °C.

30
Figure 5.6 Device measuring the indoor temperature in the hallway
In figure 5.6 you can see how we placed the device in the hallway.
Figure 5.7 Indoor temperatures during 20th
-27th December of 2012
In figure 5.7 we present a graph of how the indoor temperature varies under a
one week period in December. The temperature goes up and down but you can
clearly see that it tries to adhere to 21 °C.
19,5
20
20,5
21
21,5
22
22,5
23
1
8
15
22
29
36
43
50
57
64
71
78
85
92
99
10
6
11
3
12
0
12
7
13
4
14
1
14
8
15
5
16
2
16
9
17
6
18
3
19
0
Ind
oo
r Te
mp
era
ture
( C
els
ius
)
Hours ( h )

31
5.2 Kosovo
This is a structural analysis of the building in Kosovo. All photographs of the
building have been taken by us during our visit there.
5.2.1 Floor plan
This is a two-storey house which consists of 4 rooms, two toilets and a
kitchen. The lay out plan is simply formed; with a toilet, living room and
kitchen on the ground floor and with the second toilet and three bedrooms on
the 2nd
floor. To get to the 2nd
floor you have an opening in the corner where
there is room for a staircase. If there would be some heating on the ground
floor, some of the heat would more or less affect the temperature on the
second floor, given that hot air rises.
5.2.2 Elevations
The house has a square type of structure, which probably is not the most opti-
mal when it comes to the use of sun radiation. One problem that we found
with this house is that it is oversized with windows on one of the elevations. If
you do not have a proper heating system or solid sun protection, it will
definitely get very cold during winter and warm during summer in that part of
the house. By looking on the elevation you can directly see that the house is
complicated built, with many construction elements that stand out and causes
unnecessary thermal bridges.
5.2.3 Roof
The roof has no insulation in the roof between the roof trusses neither directly
on the loft floor. That is why it becomes pretty cold during winter, as we
mentioned earlier in the previous chapter. Hereby, we present a table of what
the roof is built of.
Material Thickness (mm)
Concrete tiles -
Tiling batten 45
Counter batten 45
T&G Board 20
Top chord 140

32
The loft floor has no insulation, and it only consists of 250 mm of hollow
bricks.
Figure 5.8 Roof trusses with a centre distance of 900 mm.
The roof has a U-value of 0.64 W/m²K, this value comes from the simulation
program DEROB-LTH, when we specified what materials the roof consists of.
Under the roof there is space for a large room of 8.8 x 3.7 m. If this room
eventually would be used for living purpose it would have to be insulated, to
keep the indoor temperature somewhat comfortable. When we entered the
room under our visit we could feel the cold coming from the top of the build-
ing, because the temperature was rising further down the house we came.
During the summer the temperature rises to a level where it is not comfortable,
and this can be due to the low heating capacity. The whole building's climate
is thus affected by the non-insulated roof. In the ceiling there are three chim-
neys, these are built of bricks. One of them is placed in the room area and the
other two in each side of the room.
5.2.4 Exterior walls
The exterior walls are constructed by hollow bricks. On the outside there is a
layer of 50 mm Styrofoam with a render of 10 mm on it. On the inside the
external wall is covered by a thin internal plastering to stop the moisture from

33
entering the hollow bricks. An electricity and water installation goes inside of
the hollow bricks.
Material Thickness (mm)
Render 10
Insulation (Styrofoam) 50
Hollow bricks 250
Gypsum plasterboard 10
The external wall has U-value of 0.52 W/m²K, which we also received from
the simulation program DEROB-LTH.
Figure 5.9 Exterior wall built with hollow bricks.
According to Latif Jashari (2012), the hollow bricks are the best option when
building a house in Kosovo. That is why they are basically used in nearly all
buildings around here. The question is if 50 mm insulation is sufficient enough
to stop the heat from the inside to escape. The winter can be pretty cold here
around, and therefore a good U-value in the construction parts is something
that must be considered. Just to mention the requirement of insulation that is
needed in Sweden, there is a recommendation which says that there should be
at least 200 mm (Isover 2, 2012). The hollow bricks are good in some aspects
in comparison to massive bricks. Since there are small holes filled with air

34
inside the brick that improves the U-value, and apart from that it also becomes
cheaper than the massive bricks.
5.2.5 Windows
The windows are double glazed windows with a plastic construction. The U-
value is 2.6 W/m²K. This leads to a lot of transmission losses from the house.
We asked Latif Jashari (2012), why double glazed windows are used and if
there possibly are any better options. He said that there nowadays also are
triple glazed windows available on the market. But that almost no one was
willing to invest so much money on such windows, since they are almost
twice as expensive as the double glazed windows. All windows in the house
contain internal window blinds for sun protection. Those blinds will create a
shadow so that it will be more comfortable to stay in the room. But it is also
important to mention that the internal sun protections, does not prevent the
room from heating up. In that case we will have to use external sun protection,
which not only creates a shadow, but it also stops the heat from entering. The
window is constructed in such manner so that you can open it in two different
ways. You can either open the whole window inwards as you can see in figure
5.10, or by just tilting the top of the window. This works as a great ventilation
function, especially during the summer when it can become pretty warm
inside.
Figure 5.10 Double glazed windows with a U-value of 2.6 W/m²K

35
5.2.6 Air tightness
The air tightness of the roof is a major problem here. Throughout our whole
examination we discovered small air holes all over the place. The air tightness
was worst executed where the chimneys and roof meet. You could see out
from inside the attic. There are three chimneys in the house, which is too
many because everyone releases hot air from the house. The air tightness was
also poorly executed in the connection between the roof and the exterior wall.
Figure 5.11 Air transfer in the connection between the chimney and roof
We can hereby conclude that the air tightness is poorly done, therefore in our
simulations we have assumed a leakage flow of 10 l/s. m² at 50 Pa pressure
difference.
5.2.7 Measured indoor climate in the house
At the moment there is no heating system installation in this house, but there
are pipes laid for future installment of radiators. However, since there is no
heating the indoor temperature becomes remarkably cold during winter. By
looking on the data that we received from our measurements, we discovered
that the temperature was unacceptably low. The measuring device was placed
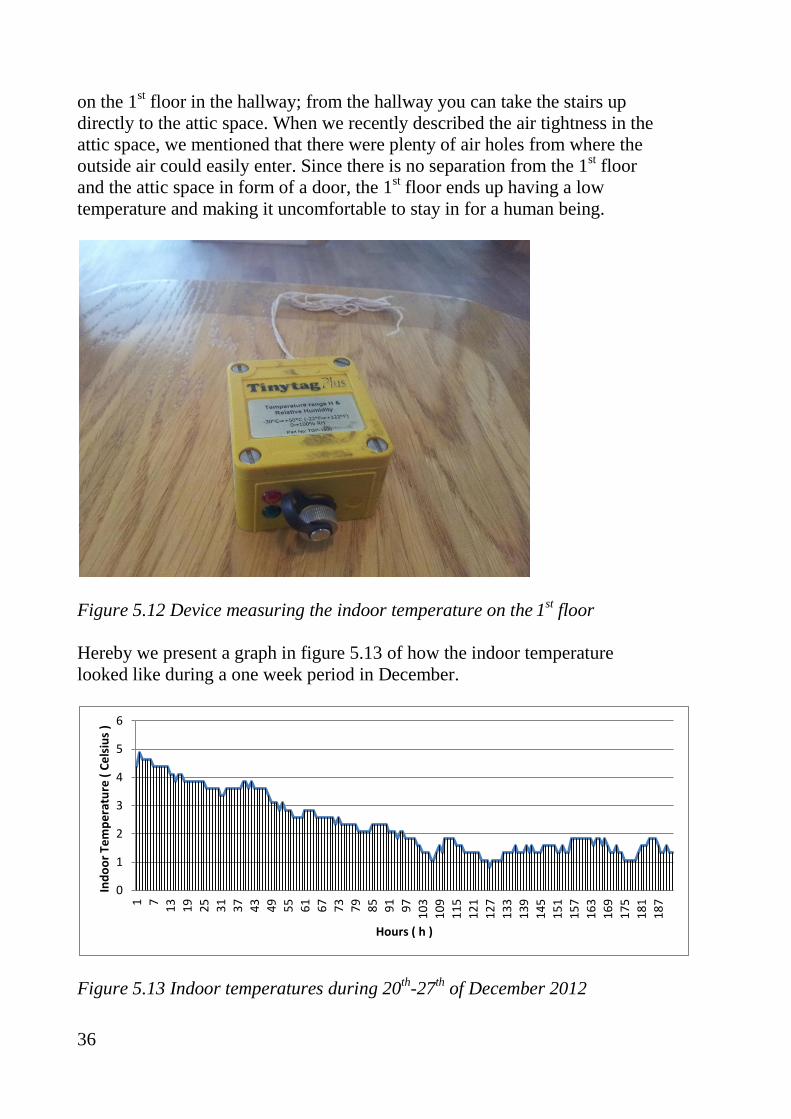
36
on the 1st floor in the hallway; from the hallway you can take the stairs up
directly to the attic space. When we recently described the air tightness in the
attic space, we mentioned that there were plenty of air holes from where the
outside air could easily enter. Since there is no separation from the 1st floor
and the attic space in form of a door, the 1st floor ends up having a low
temperature and making it uncomfortable to stay in for a human being.
Figure 5.12 Device measuring the indoor temperature on the 1
st floor
Hereby we present a graph in figure 5.13 of how the indoor temperature
looked like during a one week period in December.
Figure 5.13 Indoor temperatures during 20th
-27th of December 2012
0
1
2
3
4
5
6
1
7
13
19
25
31
37
43
49
55
61
67
73
79
85
91
97
10
3
10
9
11
5
12
1
12
7
13
3
13
9
14
5
15
1
15
7
16
3
16
9
17
5
18
1
18
7 In
do
or
Tem
pe
ratu
re (
Ce
lsiu
s )
Hours ( h )

37
As you can see the temperature is below 5 °C, and is almost down to zero
temperature. When all the different building materials and pipes in the house
get exposed for these kinds of temperatures, you can get devastating outcomes
since they all are more or less susceptible to frost damage.

38
6 Measures to improve the energy efficiency
Now that we have gone through the most vital building elements and analyzed
them in detail, we will now propose possible measures which eventually can
contribute to energy conservations.
6.1 Poland
6.1.1 Roof
Insulating the attic space is a great way to save heating costs, it can provide up
to 25 % in savings and it is possibly the easiest action to perform. Given that
no one will stay in the attic space during the year, there is no point to insulate
to roof. The loft floor already has an existing insulation of 200 mm. By
looking on ISOVER Sweden’s website, they recommend a total insulation of
500 mm (Isover 1, 2012). Therefore, we want to apply a supplementary
insulation (glass wool) of 300 mm above the loft floor. This measure will also
contribute to a remarkably lowering of the U-value.
Figure 6.1 Improvement of the roof with 300 mm of supplementary insulation
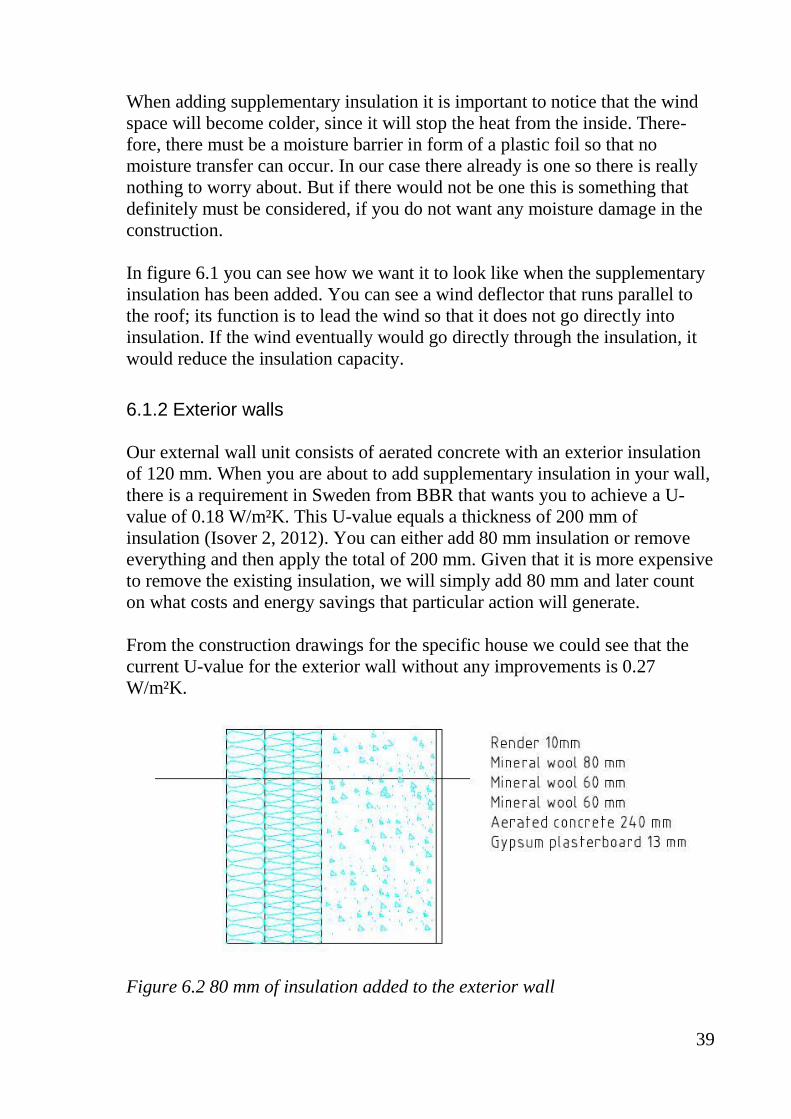
39
When adding supplementary insulation it is important to notice that the wind
space will become colder, since it will stop the heat from the inside. There-
fore, there must be a moisture barrier in form of a plastic foil so that no
moisture transfer can occur. In our case there already is one so there is really
nothing to worry about. But if there would not be one this is something that
definitely must be considered, if you do not want any moisture damage in the
construction.
In figure 6.1 you can see how we want it to look like when the supplementary
insulation has been added. You can see a wind deflector that runs parallel to
the roof; its function is to lead the wind so that it does not go directly into
insulation. If the wind eventually would go directly through the insulation, it
would reduce the insulation capacity.
6.1.2 Exterior walls
Our external wall unit consists of aerated concrete with an exterior insulation
of 120 mm. When you are about to add supplementary insulation in your wall,
there is a requirement in Sweden from BBR that wants you to achieve a U-
value of 0.18 W/m²K. This U-value equals a thickness of 200 mm of
insulation (Isover 2, 2012). You can either add 80 mm insulation or remove
everything and then apply the total of 200 mm. Given that it is more expensive
to remove the existing insulation, we will simply add 80 mm and later count
on what costs and energy savings that particular action will generate.
From the construction drawings for the specific house we could see that the
current U-value for the exterior wall without any improvements is 0.27
W/m²K.
Figure 6.2 80 mm of insulation added to the exterior wall

40
6.1.3 Windows
The existing double glazed windows have a U-value of 2.6 W/m²K, which
nowadays is classified as poor from an energy perspective. Their area is
relatively huge compared to the facade, if we now replace the existing
windows with triple glazed windows we will hopefully be able to obtain
staggering downsizing in energy costs.
Figure 6.3 Recommended triple glazed windows
By improving the U-value of the windows from 2.6 W/m²K to 0.8 W/m²K it
will probably lead to higher indoor temperatures during the summer, if no
form of ventilation/cooling is applied. Therefore it makes sense if the new
windows have the same sort of mechanical features as the previous ones,
which we explained earlier in section 5.1.5. Especially the external sun
protection, as it stops the sunlight from entering the house. Many people
believe that internal sun protections in form of venetian blinds are enough to
protect the house from the heat. The only thing they do is to create a shadow
inside, but the sunlight will continue through the window and heat up
internally. Consequently, we strongly recommend that you install external sun
protection unless you already have these, even if they are slightly more
expensive. When increasing the insulation in the external wall, the window
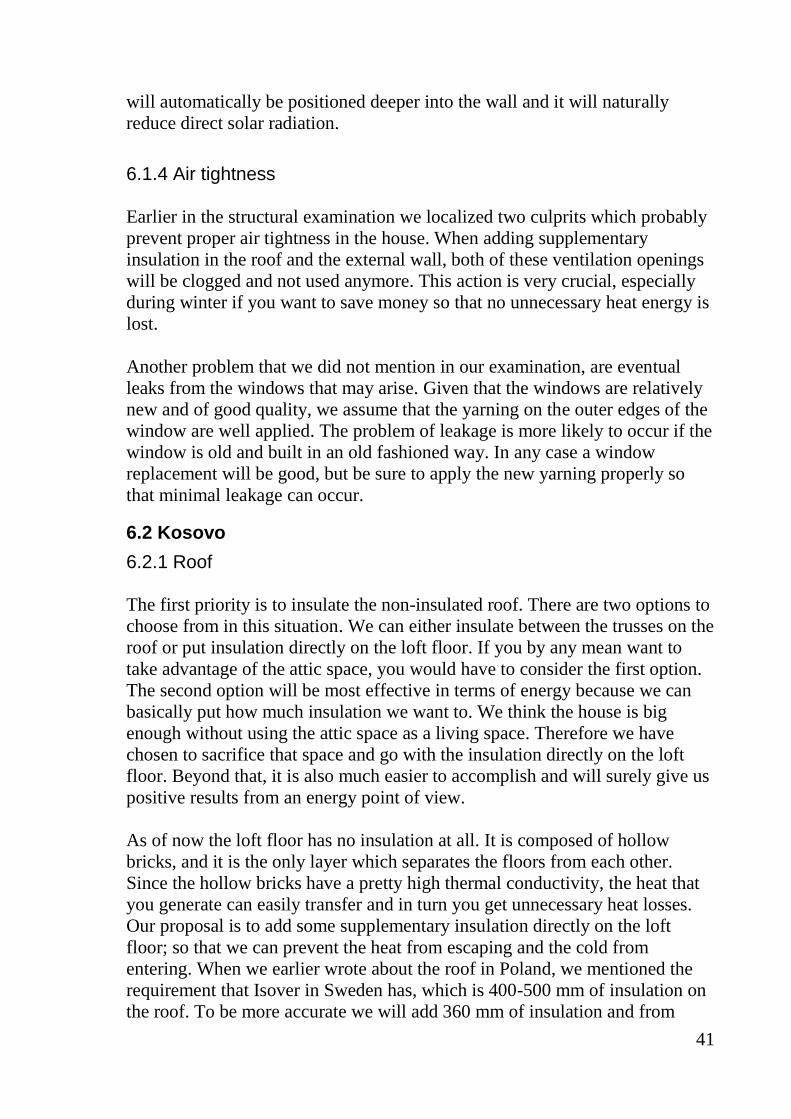
41
will automatically be positioned deeper into the wall and it will naturally
reduce direct solar radiation.
6.1.4 Air tightness
Earlier in the structural examination we localized two culprits which probably
prevent proper air tightness in the house. When adding supplementary
insulation in the roof and the external wall, both of these ventilation openings
will be clogged and not used anymore. This action is very crucial, especially
during winter if you want to save money so that no unnecessary heat energy is
lost.
Another problem that we did not mention in our examination, are eventual
leaks from the windows that may arise. Given that the windows are relatively
new and of good quality, we assume that the yarning on the outer edges of the
window are well applied. The problem of leakage is more likely to occur if the
window is old and built in an old fashioned way. In any case a window
replacement will be good, but be sure to apply the new yarning properly so
that minimal leakage can occur.
6.2 Kosovo
6.2.1 Roof
The first priority is to insulate the non-insulated roof. There are two options to
choose from in this situation. We can either insulate between the trusses on the
roof or put insulation directly on the loft floor. If you by any mean want to
take advantage of the attic space, you would have to consider the first option.
The second option will be most effective in terms of energy because we can
basically put how much insulation we want to. We think the house is big
enough without using the attic space as a living space. Therefore we have
chosen to sacrifice that space and go with the insulation directly on the loft
floor. Beyond that, it is also much easier to accomplish and will surely give us
positive results from an energy point of view.
As of now the loft floor has no insulation at all. It is composed of hollow
bricks, and it is the only layer which separates the floors from each other.
Since the hollow bricks have a pretty high thermal conductivity, the heat that
you generate can easily transfer and in turn you get unnecessary heat losses.
Our proposal is to add some supplementary insulation directly on the loft
floor; so that we can prevent the heat from escaping and the cold from
entering. When we earlier wrote about the roof in Poland, we mentioned the
requirement that Isover in Sweden has, which is 400-500 mm of insulation on
the roof. To be more accurate we will add 360 mm of insulation and from

42
there see how it affects the energy consumption. We will also test with 120
mm to be able to see if there is a huge difference in energy use.
Figure 6.4 Roof in Kosovo with supplementary insulation
6.2.2 Exterior walls
Usually they say that if a material has a very good insulation capability, its
heat capacity suffers. The same applies when it is on the contrary, and as we
mentioned earlier the external wall is built of hollow bricks. Hollow bricks are
in this case a middle ground; it has a good insulation capability and a good
heat capacity.
The wall has an external insulation of 50 mm; the most optimal would be to
add 150 mm of insulation so that the total would be 200 mm which we strive
for. But since the insulation in Kosovo is sold in 120 mm in thickness we will
not be able to choose 150 mm of insulation. Therefore we will add a total of
120 mm of supplementary insulation. In this way we will somewhat be able to
match the requirement from BBR in Sweden.

43
Figure 6.5 120 mm of insulation added to the external wall
6.2.3 Windows
The current windows are not that good from a U-value point of view. Since
this house has a large window area, by replacing the current windows with
triple glazed windows we can obtain positive energy results when we simu-
late. The house has balconies that act as sun protection for the windows. The
windows also have internal sun protection in form of venetian blinds, but as
we explained earlier they are not enough to protect the house from the sun
radiation. Therefore, we also recommend that you consider external sun
protection. This will help a lot, especially during the summer when it can
become pretty warm in Kosovo.
Figure 6.5 Triple glazed windows
44
6.2.4 Air tightness
Earlier in our structural examination, we could conclude that the air tightness
was not the properly executed up in the attic space. This leads to a chain
reaction, when the wind space get cold during winter so will the rest of the
house. The reason for that is because there is no form of separation from the
attic space to the rest of the house, instead there is an opening through the loft
floor and intermediate floor to make room for the stairs.
When we insulate the loft floor we will separate the attic space from the
remaining floors, thus the poor air tightness will not matter anymore since it
will not affect the rest of the house.

45
7 Simulations & calculations
7.1 Simulation program
In order to help us perform our simulations we used an application called
DEROB-LTH. As we described earlier in chapter 1, this is an energy simu-
lation program which will provide us with results of how efficient the im-
provements we make actually are. In the program we have built a 3D-model of
the houses that we are studying in Poland and Kosovo. For each house we
have got a climate file that we set in the program, in this way our results
became more realistic. During the simulations the program takes sun radiation
and sun protection into account, from there it calculates the indoor tempera-
ture, energy demand and air leakage flow.
7.2 Conditions
During our simulations we had exactly the same settings for both houses. The
production of internal loads was set to 500 W during the day and 150 W
during the night. Both houses have a light-coloured facade, thereof we have
set the absorptance to 35 %. Indoors there are also light colours but the
absorptance was set to 25 %. The roof has a darker colour and the absorptance
was set to 70 % for both houses. The leakage flow is set individually since it is
based on how well the assumed air tightness is for that specific house.
7.3 Poland
In figure 7.1 we can see a simplified model of the house in Poland that we
have sketched in DEROB. The house is divided into two volumes, because the
house was heated differently. The first volume was heated up to 21 °C during
a six month period, and the second volume was only heated up to 16 °C.
Figure 7.1 Model of the house in Poland – Note that volume 1 is on the right
side and volume 2 is on the left side

46
With this simulation we have a couple of things that we want to accomplish.
First, we simulated the house without any improvements to see how many
kWh it requires to get up to 21°C in volume 1 and 16°C in volume 2. Then we
compared the value of kWh that we get from the simulation with the real
amount of kWh that was used. After that, we individually simulated the
various proposals that we have come up with. In this way we were able to see
which of the measures that gave us the greatest reduction in kWh. Finally, we
brought up all the proposals together and simulated them simultaneously, and
from there we could see what the total reduction of kWh was.
7.3.1 Case 1 – Before improvements
We simulated the house as it stands today, and from there we could see how
much kWh is required. Then we compared the number of kWh that we receiv-
ed from the simulations with the real amount of kWh that was during a one
year period.
Before we started the simulation we had to put in some data into the program.
In our walls, windows and roof we have the exact same materials that we
described earlier in chapter 5. We have also thought about the poor air
tightness and since there were some deficiencies, we made an adoption and
have put the average leakage flow of the wall and roof to 8 l/s, m².
7.3.1.1 Calculated results
Figure 7.2 Oil burner

47
From our simulation we got that the average air exchange rate was 0.84 ach/h
when the leakage flow is set to 8 l/s, m². Today they usually say that the air
exchange rate should be at a maximum of 0.5 ach/h to be classified as good.
When we improve the air tightness we will surely be able to meet the require-
ment.
All water that is sent to the radiators is heated up by a burner driven on oil.
During a one year period the house used 1100 dm³ of oil for heating purpose,
and by looking on chart 4.1 we can calculate that 1100 dm³ of oil equals
11077 kWh. Since the oil burner has an efficiency set at 80%, the real amount
of kWh produced is 8861 kWh. From our simulations we could tell that the
house needs 8457 kWh when being heated to 21°C in volume 1 and 16°C in
volume 2. By comparing those two values we can conclude that they match
pretty well. If you instead would like to heat the whole house to 21°C,
according to the simulations it would require a total of 10367 kWh. This value
will be seen as a reference point that we start from when we improve the
different parts of the house.
Table 7.1 Input data before improvements
Building element U-value (W/m²K) Leakage flow (l/s, m²)
Roof 0.23 8
External wall 0.27 8
Windows 2.6 -
7.3.2 Case 2 – Improvement of air tightness
In this case we will improve the air tightness by lowering the leakage flow
from 8 l/s, m² to 4 l/s, m². Hopefully we will be able to reduce the air
exchange value to 0.5 ach/h or below. And that will in turn lead to a less
required amount of energy.
7.3.2.1 Calculated results
By lowering the leakage flow we received an improvement in the air
exchange. In the previous case when the leakage flow was set to 8 l/s, m² we
had an average air exchange of 0.84 ach/h. Now when the leakage flow
instead was set to 4 l/s, m² we received an average air exchange of 0.42 ach/h.
By this we can conclude that this value match the requirements that we
mentioned in the previous case. To prove that good air tightness in the

48
building envelope results in less energy losses, we also simulated how much
energy that now was required to heat the house to a temperature of 21°C.
From the simulations we could now tell that the house requires a total of 8081
kWh which is a decrease of 2286 kWh. We will not calculate how much it
costs to improve the air tightness. But by looking on the improvement it
provides in kWh, and how cheap it is to fix we can conclude that this is a very
profitable measure.
Table 7.2 Input data when improving the leakage flow
Building element U-value (W/m²K) Leakage flow (l/s, m²)
Roof 0.23 4
External wall 0.27 4
Windows 2.6 -
7.3.3 Case 3 – Roof with 300 mm of supplementary insulation
Now we will add the 300 mm of supplementary insulation on the roof and see
what results we get from the simulations.
7.3.3.1 Calculated results
We get a significant improvement of the U-value when we apply loose-fit
mineral wool directly on the top of the loft floor. The new U-value is 0.1
W/m²K and gives us a reduction of 526 kWh.
Table 7.3 Input data when adding supplementary insulation on the loft floor
Building element U-value (W/m²K) Leakage flow (l/s, m²)
Roof 0.1 8
External wall 0.27 8
Windows 2.6 -
The improvement in kWh is much lower than we had expected, you should
almost consider not doing any improvements on the roof. In a short-term this
affair can become pretty expensive. The reason we got such a small improve-
ment when we added the supplementary insulation, may be due to the fact that
there already was an insulation of 200 mm.

49
7.3.4 Case 4 – External wall with 80 mm of supplementary insulation
The external wall consists, as we mentioned earlier of 120 mm insulation. In
this case we added 80 mm of insulation with a λ-value of 0.039 W/mK, so that
the total would be 200 mm.
7.3.4.1 Calculated results
Table 7.4 Input data when improving the external wall
Building element U-value (W/m²K) Leakage flow (l/s, m²)
Roof 0.23 8
External wall 0.169 8
Windows 2.6 -
As in the previous case, we expected a greater improvement. As you can see
the new improved U-value in the external wall after adding the supplementary
insulation is 0.169 W/m²K, and that gives us a reduction of 529 kWh. The
former U-value of the external wall was 0.27 W/m²K which is not bad;
therefore the improvement of kWh is not that overwhelming.
7.3.5 Case 5 – Improvement of windows
At the moment the double glazed windows in the house has a U-value of 2.6
W/m²K, and in this case we did replace them with triple glazed windows with
a U-value of 0.7 W/m²K.
7.3.5.1 Calculated results
Table 7.5 Input data when adding triple glazed windows
Building element U-value (W/m²K) Leakage flow (l/s, m²)
Roof 0.23 8
External wall 0.27 8
Windows 0.7 -
By replacing the windows we received an improvement of 833 kWh. Besides
the improvement of the air tightness, this is the best reduction that we received

50
in kWh from our simulations. In this case we may have wished for a better
improvement, since triple glazed windows cost twice as much as double
glazed windows.
7.3.6 Case 6 – Combined improvement
In this case we simulated all the improvements at once. In other words the
improved U-values of the building elements and the lowered leakage flow.
7.3.6.1 Calculated results
Table 7.6 Input data when combining all improvements
Building element U-value (W/m²K) Leakage flow (l/s, m²)
Roof 0.1 4
External wall 0.169 4
Windows 0.7 -
When combining everything, we get a reduction of 4349 kWh which equals
432 dm³ of oil. This means that we almost halved the use of energy, which
can generate positive results economically.
7.3.7 Conclusion over results from DEROB-LTH
After having worked out how much each case contributes to the decreasing of
kWh, we have set up a chart that shows the improvement of each case in
percentage.
Table 7.7 Improvement in percentage
Case Improvement Energy use
(kWh)
Improvement
(%)
1 - 10367 -
2 Air tightness 8081 22
3 Roof 9841 5
4 External wall 9838 5
5 Windows 9534 8
6 Combined 6018 42

51
If we start by looking on the air tightness, you can see that it contributes to as
much as 22 % of the improvement. This is by far the best of all cases and
demonstrates the importance of having an airtight building envelope.
By adding supplementary insulation in the roof and external walls, it appeared
that it gave the same improvement in percentage. Before the simulations we
thought that we would have a greater reduction in kWh. It may be due to the
fact that we simulated the improvement of air tightness individually. Because
when you add insulation there are always small openings in the existing
insulation that can be clogged by applying the new insulation tightly. The
same procedure goes for the windows, as you can see in the chart we received
an improvement of 8 %. This value could get slightly higher if the air tightness
would be taken in consideration. When replacing windows, you always apply
new yarning around the window, which often improves the air tightness as
well. Looking at the case where we combined all the improvements, we
received a reduction of 42 % in energy use. As we mentioned earlier, this
means that we almost halved the previous energy use.
7.4 Kosovo
Now it is time to simulate the house in Kosovo, and as you can see in figure
7.3, this is our model that we have sketched in DEROB. In reality the house
has a more complex structure; with oriels and balconies. Therefore, we had do
simplify the model a lot by making the house more square like and adding
basic shading screens.
Figure 7.3 Model of the house in Kosovo – The house is divided into two
volumes, of which volume 1 is the ground floor and volume 2 is the 1st floor

52
The house has no heating system installed; there are only pipes laid through
the external walls and intermediate floors for possible future installation. We
started by looking what indoor temperature the house gets without any heating
and compared it with our measurements that we received from our measure-
ments. Thereafter we simulated how many kWh it requires to get up to a
temperature of 21 °C indoors without any improvements in the building
elements. Lastly we simulated all the proposals that we came up with;
individually and simultaneously. As we did with the house in Poland, we
made a chart at the end that shows us which measurement that gives us the
greatest reduction in kWh.
7.4.1 Case 1 – Before improvements
In this case we started by simulating the house without any heating, so that we
could see what indoor temperatures we receive. Followed by a simulation, that
shows us how many kWh that is required, to achieve an indoor temperature of
21°C when the house is being heated.
7.4.1.1 Calculated results
As you can see in table 7.8 the U-value is not acceptably good in the building
elements. As for the leakage flow, we have assumed a value of 10 l/s, m² since
we found it to be very cold due to the poor air tightness.
Table 7.8 Input data before improvements
Building element U-value (W/m²K) Leakage flow (l/s, m²)
Roof 0.64 10
External wall 0.52 10
Windows 2.6 -
When we have a leakage flow of 10 l/s, m² we receive an average air exchange
rate at 1.08 ach/h. As we mentioned earlier, the air exchange should not
exceed 0, 5 ach/h to be classified as good. Since the house is poorly insulated,
the various building elements have a high U-value. That is why we received a
pretty high value of energy consumption from our simulations, more precisely
11626 kWh. This energy value is required when the house is being heated to
21°C, and will be seen as a reference point as we improve different building
elements.

53
We also compared the minimum indoor temperature we obtained from the
simulation, with the average indoor temperature that we received from our
devices that measured on site.
Table 7.9 Comparison of average indoor temperatures during a whole month
Month Measurements (°C) Simulation (°C)
January 0.4 -2.5
February -3.0 -0.9
As seen in table 7.9, the values do not match completely, but still the
differences are not that huge. The gap may be due to the weather of that
specific period which varies from year to year, which affect the outdoor
temperature. However, the important thing here is to demonstrate that the
values match reasonably.
7.4.2 Case 2 – Improvement of air tightness
We have assumed a leakage flow of 10 l/s, m² and in this case we lowered it to
5 l/s, m² and from there we could see what energy savings we got.
7.4.2.1 Calculated results
By improving the air tightness with a lowered leakage flow of 5 l/s, m² we
received an average exchange rate of 0.55 ach/h, unfortunately we could not
get under 0.5 ach/h and match the requirements, but still it is a great improve-
ment. But this value can be useful in a relatively hot climate, where the high
air exchange can act as ventilation. Apart from that, the lowered air exchange
rate also manifests itself in reduced energy consumption. From our simulatio-
ns we could now tell that the house requires a total of 9032 kWh, which is a
decrease of 2594 kWh.
Table 7.10 Input data when improving the leakage flow
Building element U-value (W/m²K) Leakage flow (l/s, m²)
Roof 0.64 5
External wall 0.52 5
Windows 2.6 -

54
7.4.3 Case 3 – Roof with 120 mm of supplementary insulation
In this case we will add 360 mm of insulation in the roof as we proposed in
chapter 6. We will also test with 120 mm of insulation in order to see how
huge the difference is. And from there see what amount of energy that is
required.
7.4.3.1 Calculated results
The U-value of the roof section before improvements was 0.64 W/m²K, and
after adding the supplementary insulation of 360 mm we received a significant
improvement. The new U-value is 0.095 W/m²K and the total energy
consumption ends up at 9505 kWh which is a decrease of 2121 kWh. The
mineral wool which we use for this house in Kosovo, are sold in 120 mm in
thickness. For this improvement we used three layers, but we also tried and
simulated with only one layer of 120 mm mineral wool, to see what energy
savings that particular measure would provide. By adding 120 mm our new U-
value ended up at 0.22 W/m²K and gave us a reduction of 1890 kWh. We can
conclude that when removing 240 mm of insulation we get an increase of 231
kWh. The difference is not remarkably huge; therefore we have considered
adding 120 mm of insulation instead of 360 mm as planned, which surely will
be more profitable economically in the long run.
Table 7.11 Input data when adding supplementary insulation on the loft floor
Building element U-value (W/m²K) Leakage flow (l/s, m²)
Roof 0.22 10
External wall 0.52 10
Windows 2.6 -
7.4.4 Case 4 – External wall with 120 mm of supplementary insulation
The current exterior wall is very bad from an insulation point of view. With its
measly 50 mm of insulation we receive a U-value of 0.52 W/m²K. This is far
too high; therefore we added 120 of supplementary insulation (Styrofoam)
with a λ-value of 0.039 W/mK. As in the previous case like the mineral wool,
the Styrofoam is only sold in 120 mm in thickness.

55
7.4.4.1 Calculated results
As you can see in table 7.12, the new improved U-value when adding 120 mm
of insulation the external wall receives a U-value of 0.20 W/m²K. From our
simulation we can tell that the total energy consumption after this improve-
ment was 10484 kWh which is a reduction of 1142 kWh.
Table 7.12 Input data when improving the external wall
Building element U-value (W/m²K) Leakage flow (l/s, m²)
Roof 0.64 10
External wall 0.20 10
Windows 2.6 -
7.4.5 Case 5 – Improvement of windows
The double glazed windows in this house have a U-value of 2.6 W/m²K. In
this case we will replace them with triple glazed windows with a U-value of
0.8 W/m²K.
7.4.5.1 Calculated results
Table 7.13 Input data when adding triple glazed windows
Building element U-value (W/m²K) Leakage flow (l/s, m²)
Roof 0.64 10
External wall 0.52 10
Windows 0.8 -
The improvement is much lower than anticipated; it is by far the poorest
improvement of all cases for the house in Kosovo. According to the simulation
we the total energy consumption is 11379 kWh, this gives us a reduction of
247 kWh.
7.4.6 Case 6 – Combined improvement
This is the final case, where we simulated all the improvements simultaneou-
sly. We did not use the U-value that we received when adding 360 mm of

56
insulation in the roof as intended from the beginning. Instead we used the U-
value when adding 120 mm, since it almost gave the same reduction in kWh.
7.4.6.1 Calculated results
Table 7.14 Input data when combining all improvements
Building element U-value (W/m²K) Leakage flow (l/s, m²)
Roof 0.22 5
External wall 0.20 5
Windows 0.8 -
After simulating all the improvements at the same time, we get a total energy
consumption of 5437 kWh; this in turn gives us a reduction of 6189 kWh.
Although the replacement of windows proved us wrong and did not give us
the desired effect, we got a good improvement in the roof and external wall to
compensate from an energy point of view.
7.4.7 Conclusion over results from DEROB-LTH
Now as we are finished with all the simulations, we have set up a table that
shows how much each case has improved in percentage.
Table 7.15 Improvement in percentage
Case Improvement Energy use
(kWh)
Improvement
(%)
1 - 11626 -
2 Air tightness 9032 22
3 Roof 9736 16
4 External wall 10484 10
5 Windows 11379 2
6 Combined 5437 53
First up comes the air tightness, where we obtained an improvement of 22 %.
Once again we want to point out the importance of having an enclosed
building envelope, since it generates less energy losses. From the very

57
beginning, the house was poorly insulated. No insulation up in the roof, and
only 50 mm of Styrofoam in the external wall. After improving both of these
building elements, we received great reduction in kWh. The reason for this
great reduction may be due to the fact that there practically was no insulation
at first. So by adding some supplementary insulation on the roof and external
wall, we received great improvements in percentage and they will surely give
us some great results when we count on the payback time. When it comes to
the windows, we were a little bit shocked by the results that the simulation
gave us. We only received an improvement of 2 %, which is unacceptably low
and can almost directly be considered as not worth improving. The reason why
the improvement is that low, can depend on many factors. We believe that it
can be due to the fact that the windows area is not equally divided over the
elevations. Instead the house almost has all the windows on the western
elevation, while the remaining elevations only have a small window area.
However, even though we received a bad result from the case with the
windows, the combined improvement must be seen as a success. It gives a
total reduction of 53 % in energy use; with the roof, external wall and air
tightness playing a major role.
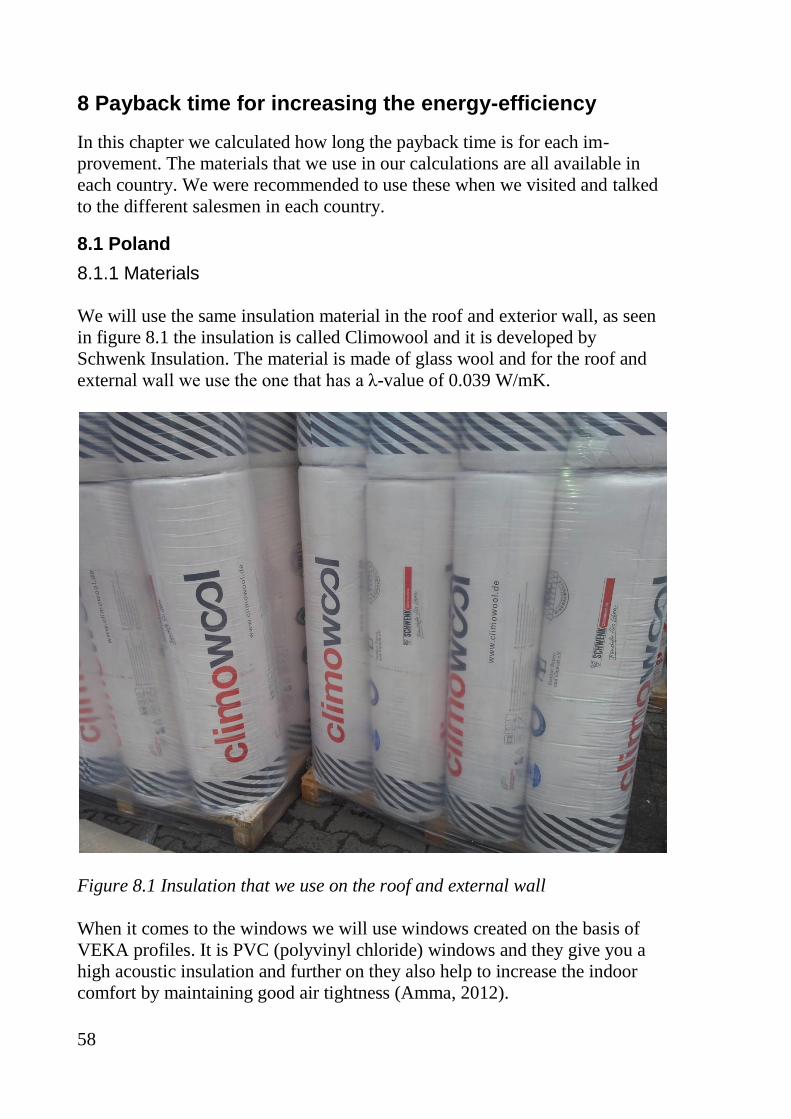
58
8 Payback time for increasing the energy-efficiency
In this chapter we calculated how long the payback time is for each im-
provement. The materials that we use in our calculations are all available in
each country. We were recommended to use these when we visited and talked
to the different salesmen in each country.
8.1 Poland
8.1.1 Materials
We will use the same insulation material in the roof and exterior wall, as seen
in figure 8.1 the insulation is called Climowool and it is developed by
Schwenk Insulation. The material is made of glass wool and for the roof and
external wall we use the one that has a λ-value of 0.039 W/mK.
Figure 8.1 Insulation that we use on the roof and external wall
When it comes to the windows we will use windows created on the basis of
VEKA profiles. It is PVC (polyvinyl chloride) windows and they give you a
high acoustic insulation and further on they also help to increase the indoor
comfort by maintaining good air tightness (Amma, 2012).

59
8.1.2 Costs
The cost of the insulation in the roof and external wall are both retrieved from
the same vendor. In this case as we mentioned earlier from Schwenk
Insulation (Schwenk, 2012).
Table 8.2 Material costs for the roof and external wall
Improvement Material Price (€/m²)
Roof DF1 039 11.5
External wall FD1/ V 039 6.7
To obtain the price for triple glazed windows we talked to Andrzej Udzielak
(2012), who works at a company called Amma in Boleslawiec, Poland. He
told us that a triple glazed window with a U-value of 0.7 W/m²K costs 75
€/m². In this price the labour costs were also included.
We must also know how much 1 dm³ of fuel oil costs when we do our
calculations. The owner of the house that we are studying told us that at
present time 1dm³ of fuel oil cost 0.84 €. This price is relatively cheap in
comparison to Sweden’s oil prices. Therefore, you should keep in mind that
the payback period in our calculations will be longer, due to the cheap price of
oil. But given that the oil prices will increase year by year in Poland and that
the energy-efficiency of buildings will continue, the payback period will
become shorter and the improvements in total will become more profitable.
8.1.3 Calculations
In this section we calculated how much each improvement will cost to
implement. In table 8.3 you can see the total area of the various building
elements.
Table 8.3 Total cost for each improvement
Building
element
Area (m²) Price of material
(€/m²)
Total cost (€)
Roof 154 11.5 1771
External wall 202.9 6.7 1359
Windows 29.47 75 2210

60
As we expected, the improvement of windows turned out to be the most ex-
pensive. Followed by the improvement of roof and the cheapest improvement
to carry out is the external wall.
8.1.3.1 Savings after measures
Table 8.4 Payback period of each improvement
Recommended
improvement
Energy
Savings
(kWh/year)
Cost
savings
(€/year)
Implementation
cost (€)
Payback
period
(year)
Roof 526 44.2 1771 40
External wall 529 44.5 1359 30
Windows 833 70 2210 31
Herby, in table 8.4 you can see how long time it will take to repay the
recommended improvements. We can confirm that we have received a very
long payback time, which can be interpreted as, if it is even worth making any
improvements. The reason why it will take such a long time to repay the
improvement of the roof and external wall must certainly be due to the fact
that there already was existing insulation. Thereof, we had no substantial
reduction in energy use. Regarding the windows, we thought that the payback
period would be shorter. We did not have huge reduction in energy consump-
tion after doing our simulations, which is why the energy saving for a year is
low.
8.2 Kosovo
8.2.1 Materials
For the roof we have chosen to put mineral wool manufactured by Knauf
Insulation, which we were referred to from the company Izolimi Dekor (2012)
in Mitrovice. Knauf Insulation is a well known company in Kosovo, and they
produce insulation for all parts of the house. The insulation that we will count
on has a λ-value of 0.038 W/mK (Knauf, 2012).
The existing insulation on the external wall is made of Styrofoam, which is
one of the most usual insulation materials used when insulating external walls
in Kosovo. That is why we have chosen to add 120 mm of Styrofoam from
Izolimi Dekor (2012) as supplementary insulation. You can see the insulation

61
that we are about to use for the external wall in figure 8.5, it has a λ-value of
0.039 W/mK.
Figure 8.5 Styrofoam which we will use to insulate the external wall
As for the windows, we were not able to come in contact with a vendor who
sells windows. But when we were interviewing Latif Jashari (2012), he told us
that there are triple glazed windows with a U-value of 0.8 W/m²K available in
the market.
8.2.2 Costs
Information regarding costs for both the roof and external wall was received
when interviewing the employees from Izolimi Dekor (2012). To insulate the
roof with 120 mm of mineral wool would cost 4.50 €/m², and to insulate the
external wall with 120 mm of Styrofoam would cost 9.40 €/m². Note that
labour costs are not included.
In terms of the prices for windows we talked to Latif Jashari (2012). He told
us during the interview that the prices for triple glazed windows are twice the
price of double glazed windows. Therefore, we went and looked at the receipts
for the windows that they used for this particular house. From the receipts we
could tell that double glazed windows cost 125 €/m², which means that triple
glazed windows cost approximately 250 €/m².

62
We also had to know the kWh price, to be able to make our calculations. From
October 1st to March 31
st a kWh cost 0.064 € (KEK-Energy, 2012). As the
price of oil in Poland, this price is low in comparison to Sweden’s as well. In
turn the payback period in our calculations becomes longer. Therefore, be
aware of the fact that the kWh price will surely increase in Kosovo.
8.2.3 Calculations
In this section we calculated how much each improvement will cost to
implement. In table 8.6 you can see the total area of the various building
elements.
Table 8.6 Total cost for each improvement
Building
element
Area (m²) Price of material
(€/m²)
Total cost (€)
Roof 81.34 4.5 366
External wall 152 9.4 1429
Windows 25.16 250 6290
We received about the same cost when we improved the roof and external
wall, and as you can see in table 8.6. Hopefully the payback period will not be
so lengthy. But to improve the windows turned out to be an expensive affair,
given how expensive the triple glazed windows are per m².
8.2.3.1 Savings after measures
Table 8.7 Payback period for each improvement
Recommended
improvement
Energy
Savings
(kWh/year)
Cost
savings
(€/year)
Implementation
cost (€)
Payback
period
(year)
Roof 1890 122.7 366 3
External wall 1142 74.1 1428 19
Windows 247 16.03 6290 392

63
In table 8.7 we present the payback period for each improvement. If we begin
by looking on the windows, we must admit that we were not surprised over the
payback period, considering how expensive the triple glazed windows are. As
Latif Jashari (2012) pointed out in the interview, there is only a small fraction
of the population that has these windows in their houses, which is totally un-
derstandable. We can already now conclude that it is not profitable to install
these windows in Kosovo as of today. Before we improved the roof, there was
no insulation as known. After the improvement we got a positive reduction in
energy consumption, whereas the costs were not so high either. This resulted
in a payback period of 3 years, which is acceptable and should certainly be
considered. When it comes to the external walls, the results here were pretty
good as well. The payback period turned out to be about 19 years, and if you
think about it in a long term, this improvement should also be taken in
consideration.

64
9 Discussion and conclusions
We begin with an individual discussion about the simulations and results for
each house. After that we proceed with a common conclusion, to close it all
together.
Before we started with improvements for the house in Poland, it was not that
bad from an insulation point of view. The loft floor which separates the attic
space from the indoor space had an existing insulation of 200 mm. While the
external wall with aerated concrete as a building framework, had an exterior
insulation of 120 mm. When adding supplementary insulation to both the roof
and external wall, we did not receive any significant reductions in the total
energy consumption for the house. The total implementation cost for each
improvement was not so high, given that the total area was huge. But still this
led to a payback period that exceeded 30 years.
When we changed the windows from double glazed with a U-value of 2.6
W/m² to triple glazed with a U-value of 0.7 W/m²K, the reduction of kWh was
about 60 % higher than the improvement for the roof and external wall. On the
other hand the implementation cost was pretty expensive, which also led to a
payback period of 30 years.
So what conclusions can we make from here, is it even worth improving
anything in this particular house? One thing that must be clarified is that this
house was properly insulated from the very beginning, the better the house is
insulated, the smaller reduction you get in kWh when improving with addi-
tional insulation. Since not all the houses built in Poland in the last 10 years
have the same amount of insulation applied, there is no reason to stare blindly
on these results and believe that it is not worth it. Not to mention all the
buildings built during the 70’s and after the fall of socialism, they represent a
large proportion of all buildings in Poland. As we explained in the first
chapter, these houses were built with an older building technology, when
insulation materials were not the most effective.
But as for the triple glazed windows, we think that at the present it is not
worth spending money on this improvement in Poland. It is the most
expensive measure to carry out, and it generates a long payback period. In our
simulation we showed you how the air tightness affected the total energy
consumption when we lowered the leakage flow. It gave us by far the best
reduction in kWh, so instead of replacing the windows, focus should be laid
on the yarning around the frame of the windows.

65
The house in Kosovo was not good at all from an insulation point of view,
before we started with the improvements. The roof was found to have the
largest deficiencies, with its poor air tightness and with no insulation applied
anywhere. The external wall with the hollow bricks did only have an exterior
insulation of 50 mm. The U-value for both the roof and external wall exceeded
0.50 W/m²K, which is way too bad. It was also shown in the measurements
that we collected from the devices, where the indoor temperature in December
was around 5°C. When adding the proposed insulation in the roof and external
wall we received major reductions in the total energy consumption. From the
very beginning we wanted to add 360 mm of insulation on the loft floor, but
the simulations showed us that a thickness of 120 mm gave almost the same
reduction. Associated with relatively low implementation costs we received a
payback period of 3 years. We also added 120 mm of supplementary insul-
ation in the external wall, and this improvement gave us a payback period of
19 years.
When replacing the existing doubled glazed windows with the triple glazed
windows, we knew that it would give us a very long payback period, since
they were very expensive. It turned out that the payback period was 393 years.
So what conclusions can we make regarding the windows? One thing that we
want to point out is that they are way too expensive. And as we mentioned
earlier when discussing the windows in the house in Poland, focus should
instead be laid on the yarning around the window frame to improve the air
tightness. When it comes to the roof and external wall we received good
results, especially when improving the roof. The reason for that is because
there was no insulation before, and by only adding a thickness of 120 mm, the
U-value of the roof improved from 0.64 W/m²K to 0.22 W/m²K. The U-value
in the external wall improved from 0.52 W/m²K to 0.20 W/m² when adding
120 mm of insulation. By coming down to a U-value around 0.20 W/m²K, you
can obtain somewhat great reductions in kWh. After that there is no sense to
lower the U-value further, considering that the reduction of kWh levels out
and does not improve that much.
So far in this discussion we have only mentioned a little bit about the air
tightness and its impact on the energy consumption. The air tightness was
found to give the greatest reduction in kWh in both Poland and Kosovo. In
both cases we had a decrease of at least 2000 kWh, when we halved the
assumed air leakage flow. As we have already mentioned we did not calculate
the costs of materials that are required when improving the air tightness.
Therefore, we want to emphasize the importance of having an airtight building
envelope. By using materials such as; airtight layers and weather strips you
can obtain major cuts in the total energy consumption. At the same time the

66
total cost will be much cheaper than the improvements that we have focused
on.
The common conclusions of the two houses from an insulation point of view
are as follows:
Not worth to improve the existing windows with triple glazed windows
in both Poland and Kosovo. Applying proper yarning around the
window frame should be more profitable, since it surely is less
expensive.
If the U-values of the roof and external wall are around 0.20-0.30
W/m²K. There is no sense to add more insulation since it gives a long
payback period. Focus instead on applying weather strips to get an air
tight building envelope.
However, if the U-value is way over 0.30 W/m²K, it surely is due to the
fact that there is no insulation or that there is only a low thickness of
insulation. In that case there is no need to add an excessive amount of
insulation and spend unnecessary costs on materials. Instead reach a
total thickness around 150 mm with the supplementary insulation.
The costs of insulation were quite similar in Poland and Kosovo. The mineral
wool costs about the same in both countries per m². The payback period after
improving the external walls in Kosovo was 19 years, and the main reason for
that is because we used Styrofoam. Styrofoam is in general more expensive
than mineral wool, but still the most usual insulation to use in Kosovo.
Mineral wool is not that common in Kosovo, as it is in Sweden. One
explanation could be that more houses are built of wood in Sweden, and in
that case mineral wool is a better option since it is easier to pack tightly
between the studs. To wrap it all up, the payback period for improving the
external walls in Kosovo, could be lower if mineral wool would be used
instead.
As we mentioned earlier the majority of all houses in both Poland and Kosovo
are built of bricks and concrete, therefore the use of Styrofoam is very usual.
But in Poland in recent years, the mineral wool is starting to get more
commonly used, not only because it is cheaper than the Styrofoam but also
due to the fire risks that the Styrofoam holds.
Regarding the windows, it was a huge difference in prices when comparing
between Poland and Kosovo. The price for a triple glazed window with a U-
value of 0.8 W/m²K in Poland was 75 €/m², in Kosovo you have to pay 250
€/m² for a similar window. The difference may exist because these windows
are more common in Poland, and self-produced as well. This leads to com-

67
petitiveness among the vendors and in turn the price must be lowered. In
Kosovo, triple glazed windows are imported from other countries where the
purchase price is pretty expensive, that is the reason why they are sold at such
a high price.
We also want to provide you with guidelines, in which we recommend how to
make your building energy efficient. The guidelines are based on our
conclusions and they are made for each of the houses. They are presented in a
numerical order, where the first one is the most important to consider.
Guidelines in Poland
1. If there is no insulation applied in the roof, this will definitely be the
first measure to improve. Add enough insulation so that the roof
achieves a U-value around 0.20 W/m²K.
2. Improve the air tightness in the building envelope. The first thing to do
is to yarn properly around the window frame. Secondly, look at the loft
floor and see if there are some openings that affect the air tightness and
can cause moisture damage, these can be eliminated by applying an
airtight layer.
3. In general, the buildings built in the last 10 years have an insulation
thickness that exceeds 100 mm in the external wall which is good from
an energy point of view. There is no sense to add more insulation but if
a facade replacement will be performed, check that the insulation is well
packed to improve the air tightness.
4. Replacing the windows is not really recommended, but nowadays there
is an option where you can add a glass to the existing window. This
measure will reduce the U-value and it is also cheaper than replacing
the entire window. This measure should only be considered if the
previous recommendations are fully fulfilled.
Guidelines in Kosovo
1. Start by insulating the roof; do not use an unnecessary amount of
insulation. Instead aim to reach a U-value around 0.20 W/m²K.
2. Improve the air tightness around the window frame. During the same
time install external sun protection, this will not only improve the air
tightness but also work as a cooling mechanism during summer.
3. If the exterior walls have an insulation thickness less than 100 mm, add
supplementary insulation so that the total thickness ends up around 150
mm. If possible, use mineral wool instead of Styrofoam since it is less
expensive per m².

68
4. A replacement of windows is not to recommend because of the high
price, focus should instead be laid on the previous recommendations in
this guideline.

69
References
Amma (2012). PVC. Accessed 2012-05-14 from:
<http://amma.com.pl/art,pl,okna-i-drzwi-pvc.html>
Andrzej Udzielak (2012). Personal Communication. Company: PPHU
AMMA. Address: Galczynskiego 13a, 59-700 Boleslawiec, Poland. E-mail:
[email protected]. Tel: +48757327473
Berisha Lirie (2010). Energy Consumption by Sector in Kosovo. Accessed
2012-04-01 from:
<https://ritdml.rit.edu/bitstream/handle/1850/13048/LirieBerisha_CapstonePro
ject_Presentation_11-2010.pdf?sequence=2>
Boverket 1 (2012). Om Boverket. Accessed 2012-03-19 from:
<http://www.boverket.se/Om-Boverket/>
Boverket 2 (2012). Lufttäthet. Accessed 2012-03-26 from:
<http://www.boverket.se/Global/Webbokhandel/Dokument/2011/BBR-18/6-
hygien-halsa-miljo-bbr-18.pdf>
Burström (2010). Autoklaverad lättbetong. In: Byggnadsmaterial –
Uppbyggnad, tillverkning och egenskaper. 2010. ISBN: 978-91-44-02738-8.
Lund: Studentlitteratur AB.
Central Statistical Office 1 (2009). Energy Consumption by Sector in Poland.
Accessed 2012-04-01 from:
<http://www.stat.gov.pl/cps/rde/xbcr/gus/PUBL_ee_energy_efficiency_in_Pol
and_1999-2009.pdf>
Central Statistical Office 2 (2009). Final Energy Consumption by Energy
Carrier in Poland. Accessed 2012-03-31 from:
<http://www.stat.gov.pl/cps/rde/xbcr/gus/PUBL_ee_energy_efficiency_in_Pol
and_1999-2009.pdf>
Climate (2012). Klimatförändringen. Accessed 2012-02-23 from:
<http://klimatforandringen.nu/vad-ar/>
Coal (2012). Svenska kolinstitutet. Accessed 2012-02-27 from:
<http://www.kolinstitutet.se/ccs.htm>
Energy (2012). Klimat & mål. Accessed 2012-02-23 from:
<http://energikunskap.se/sv/FAKTABASEN/Klimat-och-miljo/>

70
Energy buildings (2012). Near-zero-energy. Accessed 2012-02-23 from:
<http://www.europe-
re.com/system/main.php?pageid=2616&articleid=15160>
Energy development (2007), Final Energy Consumption by Energy Carrier in
Kosovo. Accessed 2012-03-31 from:
<http://www.kosovo.undp.org/repository/docs/KHDR-eng-opt.pdf>
Energifakta (2010). Heating values. Accessed 2012-03-03 from:
<http://www.ssolar.com/Solenergi2010/EnergifaktaDEL1brSolenFramtidensb
asenergi/Energik%C3%A4llor/tabid/603/Default.aspx>
Givoni (1998). “The building bio-climatic charts” In: Climate Considerations
in Building and Urban Design. New York: Van Nostrand Reinhold 1998.
(ISBN 0-442-00991-7)
Households in Kosovo (2008). Households of Kosovo until 2008. Accessed
2012-03-19 from: <http://esk.rks-gov.net/ENG/publikimet/cat_view/36-
general-statistics?limit=20&order=date&dir=ASC&start=20>
Isover Saint-Gobain (2012). Thermal Bridge. Accessed 2012-03-22 from:
<http://www.isover.com/Q-A/Implementation/What-is-a-thermal-bridge>
Isover 1 (2012). Isolering av vinden. Accessed 2012-04-04 from:
<http://isover.se/till%C3%A4ggsisolering/att+till%C3%A4ggsisolera/vinden/i
solera+vinden>
Isover 2 (2012). Krav från BBR. Accessed 2012-04-04 from:
<http://isover.se/till%C3%A4ggsisolering/bbrs+krav>
Izolimi Dekor (2012). Personal Communication. Company: Izolimi Dekor. E-
mail: [email protected]. Tel: +38149400399
KEK-Energy (2012). Electricity Prices in Kosovo. Accessed 2012-05-20
from: <http://www.kek-
energy.com/doc/df/Tarifave%20me%20pakic%C3%AB%20t%C3%AB%20en
ergjis%C3%AB%20elektrike%20.pdf>
Knauf (2012). Knauf Insulation. Accessed 2012-05-20 from:
<http://www.knaufinsulation.com/al/sq/products/kr-s-2>

71
Nevander and Elmarsson (2006). Teori. In: Fukthandbok. 2006. ISBN: 978-
91-73-33156-2. Stockholm: Svensk Byggtjänst.
OECD (2012). Housing sector overview. Accessed 2012-03-06 from:
<http://www.oecd.org/dataoecd/33/7/1844449.pdf>
Orientation (2011). Placing your house. Accessed 2012-03-25 from:
<http://www.ecowho.com/articles/6/The_importance_of_building_orientation.
html?p=2>
Passive Solar (2011). What is Passive Solar?. Accessed 2012-03-29 from:
<http://www.ecowho.com/articles/5/What_is_Passive_Solar?.html>
Population in Kosovo (2010). Women and Men in Kosovo. Accessed 2012-03-
19 from: <http://esk.rks-gov.net/ENG/publikimet/cat_view/8-population-
statistics>
Sandin (2009). Teori. In: Praktisk Byggnadsfysik. 2009. Lund: KFS AB
Schwenk (2012). Climowool. Accessed 2012-05-24 from: <www.schwenk.pl>
Solenergi (2012). Energi från solen, Accessed 2012-03-19 from:
<http://www.ssolar.com/Solenergi2010/EnergifaktaDEL1brSolenFramtidensb
asenergi/Solenergi%C3%A4rendelavl%C3%B6sningen/tabid/607/Default.asp
x>
Warfvinge and Dahlblom (2010). Termisk komfort. In: Projektering av VVS-
installationer. 2010. ISBN: 978-91-44-05561-9. Lund: Studentlitteratur AB
Wind direction (2009). Air movement. Accessed 2012-03-30 from:
<http://globalbioweather.com/air_movement_page1.html>
Interviews
Latif Jashari (2012). Bachelor of Science in Engineering, Civil Engineering,
Co-owner of AlfaING in Mitrovice.
Zbigniew Stempak (2012). Bachelor of Science in Engineering, Civil
Engineering, Safety Inspector, E-mail: [email protected]

72
Annexes
1 Interviews
1.1 Interview with Zbigniew Stempak, Poland
1. What requirements are there to fulfil for a client to get building
permission for a single family house?
Answer: The client must pass the following requirements:
Being in disposition of property for construction purposes
Have a building project
A physical development plan
Compliance with the terms of the project (document containing the
objectives that has to be achieved during the project).
Agreement with various types of suppliers; such as energy,
electronics, water supply and sewerage. To be able to come to an
agreement with the suppliers, the client must meet the requirements.
The land, on which the house is to be built on, cannot be cultivated
land.
2. What requirements are there regarding the total energy consumption of
a single family house?
Answer: As of today we have no exact standard on how much the total
energy consumption can be. But we usually say that a house up to 220 m²
shall have a maximum energy consumption of 140 kWh/m²*year.
3. What kind of heating systems are available in the market, and which is
the most common?
Answer: Here in Poland we have all kinds of heating systems available
and all depends on how much you are ready to sacrifice financially. Of the
more modern there are:
Solid fuels (Coal, wood)
Liquid fuels (Heating oil)
Gas fuels ( Liquid gas, natural gas)
Electric heating
Heat pumps
4. What type of insulation is used in single family houses?

73
Answer: The most basic and least expensive systems used are as follows:
Thermal insulation of styrofoam
Thermal insulation of mineral wool
Glass wool
Of course the price of the insulation varies depending on the U-value
and its density.
5. Which window type is the most common?
Answer: In recent years the window market has introduced all kinds of
windows with different U-values. The most common to encounter in a
single family house as of today is double glazed windows, with a U-value
of at least 2 W/m²K. Then there are also triple glazed windows with a U-
value down to 0, 8 W/m²K, but these are twice as expensive. But I believe
that going with the triple glazed windows will pay off in the long run, and
that is why I recommend installing them even to my clients.
6. What is the biggest difference in terms of materials and technology
from the period of socialism and today?
Answer: During the socialism period in Poland, there was a poor variation
of materials available for construction. Those that luckily were available
were in poor condition and did not meet the requirements at that point. I
remember that for construction of houses we used very basic materials such
as:
Concrete block of very poor quality
Concrete of sand for the basement
Brick by poor quality
Adhesives for brick masonry was very bad
The carpenters did not have the latest technology in the manufacturing of
windows, doors etc. Exterior walls were built in a old fashioned way, were the
top priority was to make the building carcass solid without paying much
attention to the insulation. Most of the materials as concrete, cement and nails
had to be done on your own; since it was difficult to get. A house built at that
time was not allowed to exceed 110 m². After the fall of socialism, Poland was
up for a great change in terms of construction technology. The availability of
materials was now much wider and in better quality, especially for single
family houses. At the moment the, the availability of materials is virtually
unlimited, and their quality allows the construction to present a huge level
within the European standard.

74
1.2 Interview with Latif Jashari, Kosovo
1. What requirements must be met to obtain building permission?
Answer: There have been major problems in obtaining building
permissions in the city, because we had no official city plan. It was not
until the 17 of June 2011 that the first official city plan came in force. This
plan applies only to the centre of the city, with the help of the plan it is
easier to decide how high the building can be and where you can build
them. In order to obtain a building permission you must present:
Proof of ownership of the ground
Material plan for the house
Plan for electric installations of the house
Owners of older and poor built houses can often not afford to renovate, apart
from that they don’t want to sell their land. This is a huge problem for the
city’s growth.
2. How are these laws against the EU laws?
Answer: As of today we have come up with a proposal of new
construction laws in the parliament. When they come into force, they will
be equivalent to the EU laws.
3. In Sweden there is a requirement which says that the total energy
consumption in a single family house should be around 110
kWh/m²*year. Is there a similar value here in Kosovo?
Answer: These requirements are not yet available here, as I mentioned
before we are still waiting for the new construction laws to come in force.
However, there are requirements regarding the external wall which says
that the insulation must be at least 50 mm thick.
4. What kind of heating systems are used here?
Answer: The use of heating systems is a huge problem here. Wood, coal
and direct electricity is the most used here around. The problem is that
these systems are not that very environmentally friendly in the long run.
We also have other systems that use gas, solar radiation and earth heat.
Solar cells would practically work pretty well here during the summer
since we have a lot of sunlight during the day. But it is very expensive to
purchase and install. Earth heat has been tested and it is very effective
because the ground is warm enough already in a depth of three meters. But

75
yet again, the economy is also a problem here. In short you can say that
people in Kosovo overall cannot afford to buy and install a heating system.
Therefore they often buy a less expensive fireplace which is driven by coal
or wood.
5. What type of insulation is used and which parts is most commonly
insulated?
Answer: Styrofoam with a thickness of 50-120 mm is used most often in
the external walls. There is also mineral wool, but it’s not used that often as
the Styrofoam. When it comes to the ground, in many cases you never
insulate it since the ground is warm enough. The roof is something that I
personally always recommend to insulate, but people in Kosovo usually do
not do it because of the economy. They often strive to save some money,
and in their case the roof is always the one that has to suffer.
6. Is there a difference in how you build today and before the war (1999)?
Answer: Yes, there are huge differences. The technology has advanced
and everything is built faster and more carefully now. Before the war there
were a lot of inexperienced and uneducated people whom built houses. One
problem that we have is the availability of proper materials. Most of our
materials are imported from Slovenia, such as insulation and concrete.
Hopefully in the near future we will be able to provide a huge variety of
materials, but as of today we are unfortunately limited.
7. We have seen that the hollow bricks is practically used on every
building, why is that?
Answer: The answer is simple; because they are seen as the best option
with the following reasons:
Price – it is the less expensive option
Weight – Its weight is light and therefore easy to work with
Acoustics – Provides good acoustics in the house
Environmental – It has passed the environmental requirements
Strength – It is solid
8. What type of windows is most used?
Answer: Double glazed windows with a plastic frame are very common
here. We also have double glazed windows with wooden frames imported
from Slovenia. Triple glazed windows have recently been received and

76
very few have them since they are twice as expensive. They are as well
imported from Slovenia, and even Germany.
9. Kosovo strives to join the EU. There is a goal which says that all
buildings must consume 20% less energy by the end of 2020, what are
you opinions regarding that?
Answer: Every year we make calculations on how many kWh that are
needed to heat a single family house every year. But since many people
heat their own house with coal and wood, it is hard to estimate how much
is needed. People need to start using heating plants that pays off in the long
run, they also need to spend more money on insulation.

77
2 Floor plan
2.1 Poland

78
2.2 Kosovo

79
3 Givoni charts
3.1 Wroclaw
0
1000
2000
3000
4000
0 5 10 15 20 25 30 35 40 45
Va
po
ur
Pre
ssu
re (
Pa
)
Temperature (°C)
jan
feb
mar
apr
may
jun
jul
aug
sept
oct
nov
dec
100% 90% 80% 70% 60% 50%
40%
30%
20%
10%
C
V
I
DH
INV
EC
IG
H AC
AC: Cooling C: Comfort DH: Dehumidification EC: Evaporative Cooling H: Heating I: High Inertia IG: Internal Gains INV: High Inertia and Night Ventilation V: Ventilation

80
3.2 Pristina
0
1000
2000
3000
4000
0 5 10 15 20 25 30 35 40 45
Va
po
ur
Pre
ssu
re (
Pa
)
Temperature (°C)
jan
feb
mar
apr
may
jun
jul
aug
sept
oct
nov
dec
100% 90% 80% 70% 60% 50%
40%
30%
20%
10%
C
V
I
DH
INV
EC
IG
H AC
AC: Cooling C: Comfort DH: Dehumidification EC: Evaporative Cooling H: Heating I: High Inertia IG: Internal Gains INV: High Inertia and Night Ventilation V: Ventilation

81
4 Mahoney table
4.1 Wroclaw
General Recommenation
Layout
0–10 X
Orientation north and south (long axis east–west)
11–12
5–12
0–4 Compact courtyard planning
Spacing
11–12 Open spacing for breeze penetration
2–10 As above, but protection from hot and cold wind
0–1 X Compact layout of estates
Air movement
3–12
Rooms single banked, permanent provision for air movement
1–2 0–5
6–12
X Rooms double banked, temporary provision for air movement
0
2–12
0–1 No air movement requirement
Openings
0–1 0 Large openings, 40–80%
11–12 0–1 Very small openings, 10–20%
Any other conditions X Medium openings, 20–40%
Walls
0–2 X Light walls, short time-lag
3–12 Heavy external and internal walls
Roofs
0–5 X Light, insulated roofs
6–12 Heavy roofs, over 8h time-lag
Outdoor sleeping
2–12 Space for outdoor sleeping required
Rain protection
3–12 Protection from heavy rain necessary
Detailed recommendations
Size of opening
0–1 0 Large openings, 40–80%
1–12
X Medium openings, 25–40%
2–5
6– Small openings, 15–25%

82
10
11–12
0–3 Very small openings, 10–20%
4–12 Medium openings, 25–40%
Position of openings
3–12
In north and south walls at body height on windward side
1–2
0–5
6–12
X As above, openings also in internal walls
0
2–12
Protection of openings
0–2 Exclude direct sunlight
2–12 Provide protection from rain
Walls and floors
0–2 X Light, low thermal capacity
3–12 Heavy, over 8h time-lag
Roofs
10–12
0–2 Light, reflective surface, cavity
3–12 X Light, well insulated
0–9
0–5
6–12 Heavy, over 8h time-lag
External features
1–12 Space for outdoor sleeping
1–12 Adequate rainwater drainage

83
4.2 Pristina
General recommendations
Layout
0–10 X
Orientation north and south (long axis east–west)
11–12
5–12
0–4 Compact courtyard planning
Spacing
11–12 Open spacing for breeze penetration
2–10 As above, but protection from hot and cold wind
0–1 X Compact layout of estates
Air movement
3–12
Rooms single banked, permanent provision for air movement
1–2 0–5
6–12
Rooms double banked, temporary provision for air movement
0
2–12
0–1 X No air movement requirement
Openings
0–1 0 Large openings, 40–80%
11–12 0–1 Very small openings, 10–20%
Any other conditions X Medium openings, 20–40%
Walls
0–2 Light walls, short time-lag
3–12 X Heavy external and internal walls
Roofs
0–5 X Light, insulated roofs
6–12 Heavy roofs, over 8h time-lag
Outdoor sleeping
2–12 Space for outdoor sleeping required
Rain protection
3–12 Protection from heavy rain necessary
Detailed recommendations
Size of opening
0–1 0 Large openings, 40–80%
1–12
X Medium openings, 25–40%
2–5
6–10 Small openings, 15–25%
11– 0–3 Very small openings, 10–20%
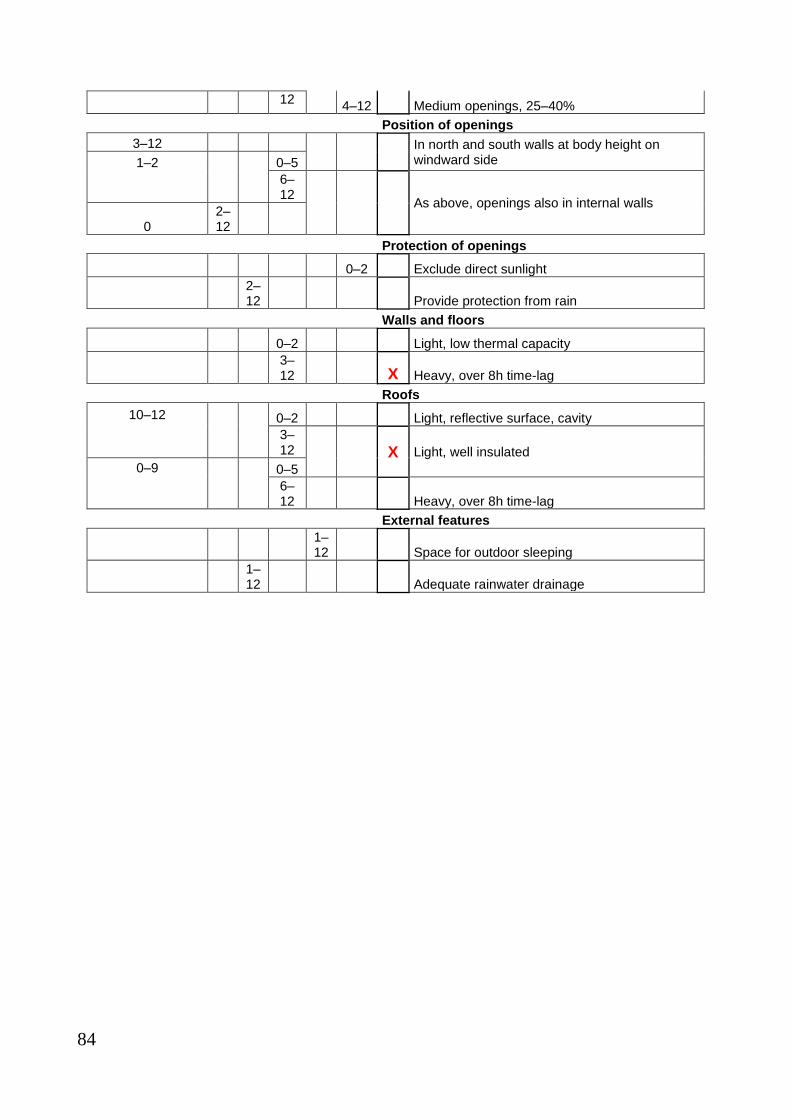
84
12 4–12 Medium openings, 25–40%
Position of openings
3–12
In north and south walls at body height on windward side
1–2
0–5
6–12
As above, openings also in internal walls
0
2–12
Protection of openings
0–2 Exclude direct sunlight
2–12 Provide protection from rain
Walls and floors
0–2 Light, low thermal capacity
3–12 X Heavy, over 8h time-lag
Roofs
10–12
0–2 Light, reflective surface, cavity
3–12 X Light, well insulated
0–9
0–5
6–12 Heavy, over 8h time-lag
External features
1–12 Space for outdoor sleeping
1–12 Adequate rainwater drainage