Improving Customer Compatibility with Operational Transparency Files/20... · credit cards. Each...
43
Improving Customer Compatibility with Operational Transparency Ryan W. Buell MoonSoo Choi Working Paper 20-013
Transcript of Improving Customer Compatibility with Operational Transparency Files/20... · credit cards. Each...

Improving Customer Compatibility with Operational Transparency Ryan W. Buell MoonSoo Choi
Working Paper 20-013

Working Paper 20-013
Copyright © 2019 by Ryan W. Buell and MoonSoo Choi
Working papers are in draft form. This working paper is distributed for purposes of comment and discussion only. It may not be reproduced without permission of the copyright holder. Copies of working papers are available from the author.
Funding for this research, apart from the costs Commonwealth Bank of Australia internally incurred to support the experiment, was provided by Harvard Business School. Ryan Buell has received compensation from Commonwealth Bank of Australia in the past for executive education teaching
Improving Customer Compatibility with Operational Transparency
Ryan W. Buell Harvard Business School
MoonSoo Choi Harvard Business School

1
Improving Customer Compatibility with Operational Transparency
Ryan W. Buell and MoonSoo Choi
Harvard Business School, Harvard University, Boston, Massachusetts 02163 [[email protected], [email protected]]
Abstract:
Through a large-scale field experiment with 389,611 customers considering opening a credit card account with a nationwide retail bank, we investigate how providing transparency into an offering’s tradeoffs affects subsequent rates of customer acquisition and long-run engagement. Although we find transparency to have an insignificant effect on acquisition rates, customers who were shown each offering’s tradeoffs selected different products than those who were not. Moreover, prospective customers who experienced transparency and subsequently chose to open an account went on to exhibit higher quality service relationships over time. Monthly spending was 9.9% higher and cancellation rates were 20.5% lower among those who experienced transparency into each offering’s tradeoffs. Increased product usage and retention accrued disproportionately to customers with prior category experience – more experienced customers who were provided transparency spent 19.2% more on a monthly basis and were 33.7% less likely to defect after nine months. Importantly, we find that these gains in engagement and retention do not come at the expense of customers’ financial wellbeing – the probability of making late payments was reduced among customers who experienced transparency. We further find that the positive effects of transparency on engagement and retention were attenuated in the presence of a promotion that provided financial incentives to choose particular offerings. Taken together, these results suggest that providing transparency into an offering’s tradeoffs may be an effective strategy for informing customer choices, leading to better outcomes for customers and firms alike. [Keywords: Behavioral operations, operational transparency, customer compatibility, customer behavior] 1. Introduction
It is a common practice that when service firms market to prospective customers, they emphasize the
advantages of their offerings and downplay the tradeoffs. This strategy seems quite rational to the extent its
objective is to convert browsers into buyers, as accentuating the downsides of an offering might drive some
customers away. However, since value arises from the long-term engagement and retention of satisfied
customers, marketing messages that provide transparency into a service offering’s hidden tradeoffs may
help customers make better-informed choices, facilitating the acquisition of more compatible customers,
and improving long-run outcomes for customers and firms alike. Although this proposition may have
intuitive appeal, the effect of providing prospective customers with such transparency has never been
empirically investigated, which is the objective of this paper.
In a manufacturing context, inputs to the process are carefully sourced by the manufacturer to ensure
fit with its operation, reducing variability, improving productivity, and boosting performance. Service
operations are fundamentally different in that customers, who have heterogeneous needs (Frei 2006), and
who provide key inputs to the process (Roels 2014, Sampson and Froehle 2006), have to choose the

2
operation with which they engage. This selection process is fraught with information asymmetry (Buell et
al. 2016, Schmidt and Buell 2017), such that services have been classified as “experience goods,” in that
customers are rarely able to assess them prospectively (Israel 2005). Yet service outcomes, like satisfaction
and profitability, have been shown to hinge largely on customer compatibility – the degree of fit between
the customer’s individual needs, and the capabilities of the operation that serves them (Buell et al. 2018).
Hence, investments that reduce information asymmetries between a service business and its prospective
customers may help those customers make more well-informed decisions, improving customer
compatibility, and leading to better long-term outcomes for all involved.
For this paper, we collaborated with Commonwealth Bank of Australia (CBA), a nationwide retail
bank in Australia, which is the largest bank in the southern hemisphere (Buell and John 2018), to conduct
a large-scale field experiment with 389,611 customers who were considering applying for bank-issued
credit cards. Each customer was randomly assigned to either a control condition, in which they received
traditional messaging that emphasized the advantages of each credit card (e.g., our lowest interest rate on
purchases, $0 annual fee in the first year, etc.), or a treatment condition, in which they received messaging
that emphasized the same advantages, while also providing transparency into each card’s tradeoffs (e.g.,
does not earn awards points, does not include travel insurance, etc.). We subsequently tracked the
progression of customers in both conditions through the acquisition funnel and documented the engagement
of those who chose to open accounts for nine months after activation, to assess the impact of this
transparency on service performance.
Although we find that providing transparency into the tradeoffs of service offerings has no impact on
overall rates of acquisition, our results suggest that doing so can influence customers’ choices, usage, and
retention. Holding constant other factors, customers who experienced transparency selected a different mix
of cards, spent 9.9% more on a monthly basis, and after nine months, were 20.5% less likely to cancel their
accounts. Importantly, this increased engagement does not come at the expense of customers’ financial
wellbeing – the probability of making late payments declines 10.8% in the initial six months of the service
relationship among those who experienced transparency. We further find evidence that customers’ prior
experience with the service category moderates the impact of transparency on subsequent engagement.
Providing transparency to below median age prospects, who had limited, if any, previous experience with
credit cards, had a de minimis effect on usage and retention. In contrast, providing transparency to older,
more experienced customers, led to significantly higher levels of engagement – increasing monthly
spending by 19.2% and decreasing the probability of cancellation after nine months by 33.7%. Finally, we
observe that the effects of transparency on subsequent usage and retention are attenuated among customers
who experienced transparency in the midst of a promotion. Midway through the experimental period, the

3
bank introduced a financial incentive for customers who opened specific types of credit cards, and
customers who opened accounts during this promotion period exhibited a statistically indistinguishable
response to the treatment. The results are consistent with the idea that customers who organically seek out
an offering are more likely to consider and benefit from tradeoff transparency than those who are attracted
or influenced by a promotion. By examining both the short-term marketing impact and the longer-run
operational impact of providing prospective customers with operational transparency into a service
offering’s tradeoffs, the present study lends support to prior research calling for an integrated approach to
marketing and operations (Ho and Zheng 2004). Moreover, it builds on a growing literature that
demonstrates how voluntarily revealing facets of an operation that are traditionally kept hidden can improve
outcomes for customers and service providers alike (Buell et al. 2017, Mohan et al. 2018).
2. Tradeoff transparency, customer acquisition, and engagement
In an effort to improve customer acquisition, managers may be inclined to present their firms’ service
offerings in the most favorable light – accentuating the positive attributes and deemphasizing the negative
ones. However, doing so may cause customers to make less-informed decisions, reducing the degree of fit
between their needs and their chosen firm’s operating capabilities, and undermining prospects for
satisfaction and profitable long-term engagement (Buell et al. 2016, Guajardo and Cohen 2017). In this
section, we explore literature that informs how providing prospective customers with transparency into the
tradeoffs inherent in a firm’s offerings affects customer acquisition and long-term engagement.
2.1 Tradeoff Transparency and Customer Acquisition
Research has highlighted how the revelation of unflattering information about a company’s service
offerings, such as poor quality or high prices, can reduce consumer demand. For example, research
conducted in online platforms found that the first bad review posted about a firm’s offerings can cost a
company up to 13% of its revenue (Cabral et al. 2010) and that a one-star increase on Yelp can boost a
company’s revenue by 9% on average (Luca 2016). Chetty et al. (2009) found that making taxes salient in
a retail context – that is, posting sales taxes along with the prices of goods – increases consumers’
perceptions of the prices charged by the retailer, and reduces demand by 8%. Similarly, Finkelstein (2009)
found that drivers who pay tolls electronically are substantially less aware of, and less sensitive to, toll rate
increases, and Blake et al. (2017) illustrated that shrouding service fees on an online ticketing platform can
substantially raise revenues. To the extent that disclosing sensitive information can adversely affect demand,
these results suggest that firms intent on acquiring new customers may have powerful incentives to hide
negative information from prospective buyers.

4
On the other hand, an extensive array of research in psychology and marketing has demonstrated the
benefits of self-disclosure in fostering intimacy. Interpersonally, self-disclosure has been shown to be
critical in developing social relationships (Jourard 1971) and in forging a heightened level of trust
(Wheeless and Grotz 1977). People disclose in intimate relationships (Derlega 1984), as self-disclosure
allows parties to gain knowledge about one another while reducing ambiguity about the other’s intentions
(Laurenceau et al. 1998, Perlman and Fehr 1987). Similar effects have been documented in non-
interpersonal contexts. For example, research has shown how people become more attracted to, and more
willing to engage with, computers that self-disclose sensitive information. If a computer shares that its
“abilities are really limited…” in that it can “do word processing and spreadsheets, but it cannot do any
kind of physical activity, like play sports or walk down the street,” people report a higher level of attraction
to it, and are more likely to disclose to it things they hate about themselves (Moon 2000). Similarly, when
companies self-disclose their costs of producing goods and services – a practice which implicitly reveals
their profit margins – consumers report trusting the firm more, are more willing to engage with it, and sales
increase (Mohan et al. 2018).
Furthermore, research on operational transparency has demonstrated how disclosing facets of the
operation that are typically hidden from view – such as the work being performed behind the scenes – can
enhance consumers’ appreciation for the firm and their perceptions of the value it creates (Buell et al. 2017,
Buell and Norton 2011). Moreover, such transparency can bolster trust in and engagement with the firm,
even when it reveals imperfect performance (Buell et al. 2018b, Kalkanci et al. 2015). Common across all
of these examples, however, is the notion of voluntary self-disclosure. Indeed, trust and engagement are not
engendered when the revelation is involuntary (Hoffman-Graff 1977, Mohan et al. 2018). Taken together,
the net effects on acquisition rates of a firm providing transparency into the tradeoffs inherent in its offerings
are equivocal. The revelation of unflattering information may suppress demand, but voluntary self-
disclosure may engender higher levels of trust and brand attraction. Due to these offsetting effects, we
formulate the following hypothesis in null form:
Hypothesis 1 (H1): Providing prospective customers with transparency into the tradeoffs inherent in a
firm’s offering will have no effect on the firm’s rate of customer acquisition.
2.2 Tradeoff Transparency and Customer Engagement
It is well established that customer satisfaction plays a key role in a firm’s long-term performance.
Research has demonstrated that highly-satisfied customers are more loyal and more profitable over time
(Anderson 1994, Anderson et al. 1994, Heskett et al. 1997, LaBarbera and Mazursky 1983). Satisfaction
levels, in turn, are largely persistent between firms and individual customers, and are influenced in part by

5
customer compatibility – the degree of fit between the needs of the customer and the capabilities of the
operation (Buell et al. 2018a). Customer compatibility can be influenced through a firm’s segmentation
strategies, wherein offerings are designed around the shared needs of particular operating segments of
customers (Guajardo and Cohen 2017). However, the efficacy of such strategies is likely influenced by the
degree of transparency firms provide to prospective customers into how those offerings are designed.
Customers that are misaligned with a segmented service offering will be less satisfied with their experiences
(Buell et al. 2018a, 2016), and will impose more variability on the operation (Frei 2006) which, in turn,
will hinder the firm’s service performance (Karmarkar and Pitbladdo 1995, Chase and Tansik 1983).
Providing prospective customers with transparency into the tradeoffs inherent in a service offering could
improve customer compatibility in two ways: 1) by reducing Type I errors (false positives); and, 2) by
reducing Type II errors (false negatives). In the context of customers choosing among service offerings, a
Type I error occurs when a customer chooses an offering that is poorly aligned with his or her needs. When
firms communicate the positive attributes of their offerings and omit the negative attributes, research in
psychology has demonstrated that consumers often fill in the gaps in biased and overly favorable ways, and
are more likely to choose the offering (Kivetz and Simonson 2000). Since such customers enter a service
relationship with expectations that surpass the capabilities of the operation, the gap between their service
expectations and experiences will result in dissatisfaction over time (McDougall and Levesque 2000, Oliver
1993, Parasuraman et al. 1985, Tse and Wilton 1988). In contexts with high switching costs, dissatisfied
customers may remain with the firm (E. Anderson 1994, Buell et al. 2010, Yang and Peterson 2004), but
are likely to spend less money than more highly-satisfied customers and may be more difficult and costly
to serve (Coyles and Gokey 2005, Jones and Sasser 1995, Xue and Harker 2002). To the extent that
providing prospective customers with transparency into the tradeoffs inherent in a firm’s segmented
offering can help reduce Type I errors, it stands to reason that the customers who choose the offering will
be more aligned and satisfied with it, and in turn, will be more loyal and profitable to the firm.
On the other hand, in the context of customers choosing among service offerings, a Type II error occurs
when a customer fails to select an offering that is well-aligned with his or her needs. Services have been
characterized as “experience goods,” since empirical research has demonstrated how customers are unable
to fully assess them until after they have been delivered. Although providing consumers with incomplete
information can trigger a psychological bias causing them to assume the best (Kivetz and Simonson 2000),
when the lack of transparency is assumed to be volitional, people may assume the worst, undermining their
trust and engagement (John et al. 2016). In this way, transparency into the tradeoffs inherent in a service
offering may also result in fewer Type II errors, further promoting service relationships that are value
producing and satisfying for customers, and long-lived and highly profitable for firms (Heskett et al. 1997).

6
To the extent that the information afforded by the provision of transparency may help reduce Type I and
Type II errors, we hypothesize that customers exposed to transparency will make different choices when
selecting a service offering than those who are not:
Hypothesis 2 (H2): Providing prospective customers with transparency into the tradeoffs inherent in a
firm’s offerings will result in customers selecting different offerings than they would select in the
absence of such transparency.
Furthermore, if the provision of transparency reduces Type I and Type II errors, we would additionally
expect engagement to increase among customers who are exposed to transparent messaging when they are
choosing among service offerings. In particular, we hypothesize that product usage and retention will
increase among customers who receive transparency:
Hypothesis 3 (H3): Providing prospective customers with transparency into the tradeoffs inherent in a
firm’s offering will increase product usage among those who choose to select the offering, relative to
not providing such transparency.
Hypothesis 4 (H4): Providing prospective customers with transparency into the tradeoffs inherent in a
firm’s offering will increase product retention among those who choose to select the offering, relative
to not providing such transparency.
Although we anticipate the main effects on usage and retention described above, prior research in the
marketing domain has demonstrated that customers who are more familiar with a product category have
the capacity to learn more from technical advertising (R. Anderson and Jolson 1980), and that more
experienced consumers, by virtue of their familiarity, are better able to select information about attributes
that are more predictive of product performance, in turn leading to better decisions that are more aligned
with their needs (Johnson and Russo 1984). Hence, we predict that the long-run benefits of providing
prospective customers with transparency into the tradeoffs of a service offering will accrue
disproportionately to those with more prior category experience, who can learn from and make better use
of the information transparency affords. If transparency can be best leveraged by more experienced
customers to make choices that are better aligned with their needs, we would by extension predict that their
levels of engagement would be disproportionately impacted. Accordingly, we hypothesize:
Hypothesis 5 (H5): The positive effect of tradeoff transparency on product usage will be most acute for
customers who have more prior experience with the service category.
7
Hypothesis 6 (H6): The positive effect of tradeoff transparency on product retention will be most acute
for customers who have more prior experience with the service category.
Lastly, a rich theoretical literature in economics and operations has modelled how customers sort
among competing offerings, trading off price and service quality (Cachon and Harker 2002, Cohen and
Whang 1997, Gabszewicz and Thisse 1979, Gans 2002, Hall and Porteus 2000, Karmarkar and Pitbladdo
1997, Li and Lee 1994, Shaked and Sutton 1982, Sutton 1986, Tirole 1990, Tsay and Agarwal 2000).
Subsequent empirical work has documented that when service offerings are differentiated against the
competitive set on the basis of quality, they attract more quality-sensitive customers, who are more likely
to defect to higher-quality offerings. When offerings are instead differentiated on the basis of price, firms
attract price-sensitive customers, who are less sensitive to quality, and more likely to defect to lower-priced
offerings (Buell et al. 2016). Consistently, we predict that the effect of tradeoff transparency on customer
engagement and retention will be negatively influenced by the presence of a promotion. Customers
attracted to an offering on the basis of a discount or financial incentive may be less sensitive to the quality
of the service experience than they are to the incentive itself, and hence, the benefits of increased alignment
between their needs and the capabilities of the offering they select afforded by transparency are less likely
to accrue to them. Moreover, to the extent that conflicts arise between the offering that’s the best fit for a
customer, and the promotional incentives provided to select it, we would further expect the presence of a
promotion to diminish the impact of transparency on engagement and retention. For both reasons, we
hypothesize:
Hypothesis 7 (H7): The positive effect of tradeoff transparency on product usage will be diminished
among customers attracted to the offering by a promotion.
Hypothesis 8 (H8): The positive effect of tradeoff transparency on product retention will be diminished
among customers attracted to the offering by a promotion.
3. Presentation of field experiment
To conduct this research, we partnered with Commonwealth Bank of Australia (CBA), which at the time
of the experiment, had more than 1,000 branches, more than 45,000 employees, and more than 10 million
retail banking customers. CBA was the largest issuer of credit cards in its market, with over 3 million credit
card holders and annual transaction volume exceeding $50 billion USD. It offered nine types of personal
credit cards, spread across three different families – awards cards, low rate cards, and low fee cards (Figure
1). We focus our analysis on customers who shopped for personal credit cards.

8
Figure 1. Credit card offerings from CBA during the time of the experiment. The bank offered cards in three families: 1) low rate cards, 2) low fee cards, and 3) awards cards. Because the credit card offerings were designed to serve customers with varying needs and preferences, the value proposition of each credit card included both benefits and tradeoffs, making it more appropriate for some prospective customers and less appropriate for others.
Low Rate Cards Low Fee Cards Awards Cards
Low rate card
$59 annual fee 13.24% interest rate
21.24% cash advance interest rate
Low fee card
$0 annual fee first year $29 annual fee if spending<$1,000
19.74% interest rate 21.24% cash advance interest rate
Awards card
$59 annual fee first year 20.24% interest rate
21.24% cash advance interest rate Earn 1.5 points per dollar on purchases
Includes Master Card and American Express
Low rate gold card
$89 annual fee 13.24% interest rate
21.24% cash advance interest rate Includes international travel insurance
Low fee gold card
$0 annual fee first year $89 annual fee if spending<$10,000
19.74% interest rate 21.24% cash advance interest rate
Includes international travel insurance
Gold awards card $119 annual fee first year
20.24% interest rate 21.24% cash advance interest rate
Earn 2 points per dollar on purchases Includes travel insurance
Includes Master Card and American Express
Platinum awards card
$249 annual fee first year 20.24% interest rate
21.24% cash advance interest rate Earn 2.5 points per dollar on purchases
Includes travel insurance Includes Master Card and American Express
Student card
$0 annual fee first year $29 annual fee if spending<$1,000
19.74% interest rate 21.24% cash advance interest rate
Interest free for 55 days
Diamond awards card
$349 annual fee first year 20.24% interest rate
21.24% cash advance interest rate Earn 3 points per dollar on purchases
Includes travel insurance Includes lounge access
Includes Master Card and American Express

9
Benefits (included in treatment and control) Tradeoffs (included in the treatment only) Low Rate • Our lowest interest rate on purchases, currently 13.24%
p.a. • Minimum credit limit of $500 • Free additional card holder
• The annual fee of $59 is higher than our Low Fee credit card
• Does not earn awards points • Does not include travel insurance • International purchases may incur international
transaction fees Low Rate Gold
• Our lowest interest rate on purchases, currently 13.24% p.a.
• International travel insurance included • Minimum credit limit of $4,000 • Free additional card holder
• There’s an annual fee of $89 • Does not earn awards points • International purchases may incur international
transaction fees
Low Fee • $0 annual fee in the first year* and following years when you spend at least $1,000 in the previous year
• Free additional card holder
• Does not earn awards points • Does not include travel insurance • There’s an annual fee of $29 in the second and later
years if you spend less than $1,000* in the previous year • International purchases may incur international
transaction fees Low Fee Gold
• $0 annual fee in the first year* and following years when you spend at least $10,000 in the previous year
• International travel insurance included • Free additional card holder
• The purchase interest rate of 19.74% p.a. is higher than Low Rate credit cards
• Does not earn awards points • There’s an annual fee of $89 in the second and later
years if you spend less than $10,000* in the previous year
• International purchases may incur international transaction fees
Student • $0 annual fee in the first year** • Free additional card holder
• The purchase interest rate of 19.74% p.a. is higher than Low Rate credit cards
• Does not earn awards points • Does not include travel insurance • International purchases may incur international
transaction fees Awards • Earn up to 1.5 Awards points for every dollar you spend
• Access to the largest rewards program of any bank in Australia*
• The purchase interest rate of 20.24% p.a. is higher than Low Rate and Low Fee credit cards
• There’s an annual fee of $59 • Does not include travel insurance • International purchases may incur international
transaction fees • There’s a $10 p.a. additional cardholder fee
Gold Awards
• Earn up to 2 Awards points for every dollar you spend • Access to the largest rewards program of any bank in
Australia* • International travel insurance included when you activate
cover within [our online banking platform]
• The purchase interest rate of 20.24% p.a. is higher than Low Rate and Low Fee credit cards
• There’s an annual fee of $119 • International purchases may incur international
transaction fees • There’s a $10 p.a. additional cardholder fee
Platinum Awards
• Earn up to 2.5 Awards points for every dollar you spend • Access to the largest rewards program of any bank in
Australia* • International travel insurance included when you activate
cover within [our online banking platform] • No international transaction fees on overseas purchases
made in-store and online using your CommBank Platinum American Express card
• The purchase interest rate of 20.24% p.a. is higher than Low Rate and Low Fee credit cards
• There’s an annual fee of $249 • There's a $10 p.a. additional cardholder fee
Diamond Awards
• Earn up to 3 Awards points for every dollar you spend • Access to the largest rewards program of any bank in
Australia* • International travel insurance included when you activate
cover within [our online banking platform] • No international transaction fees on overseas purchases
made in-store and online using your CommBank Diamond American Express card
• The purchase interest rate of 20.24% p.a. is higher than Low Rate and Low Fee credit cards
• There’s an annual fee of $349 • There's a $10 p.a. additional cardholder fee
Figure 2. Website copy used in the treatment and control conditions for each card. Customers randomly assigned to the control condition only experienced the marketing of each credit card’s benefits, which is common practice in the industry. Customers randomly assigned to the treatment condition were additionally presented with transparency into the tradeoffs of each offering.

10
Control Condition
Only the benefits of each credit card are presented
Treatment Condition
The benefits and tradeoffs of each credit card are
presented
Figure 3. Example credit card product detail pages in the control and treatment conditions. The experimental manipulation involved more than 50 blocks of content on more than 20 pages of CBA’s public-facing and secure online banking websites, such that every credit card marketing webpage where the features and benefits of a credit card were described, so too were its tradeoffs for customers randomly assigned to the treatment.
3.1 Data and methods
3.1.1 Participants, design, and procedure. From September 6, 2017 through February 4, 2018, we
collaborated with CBA to conduct a field experiment on its website, engaging all customers who were
considering opening a new credit card with the bank. 466,322 customers were randomly assigned to one of
two experimental conditions.
Customers randomly assigned to the control condition, =0, observed a version of the website
that was consistent with the bank’s traditional marketing efforts – emphasizing the features and benefits of
each credit card in its primary copy. Customers randomly assigned to the treatment condition, =1, observed an augmented version of the website, in which the primary copy additionally revealed the
TREATi
TREATi
11
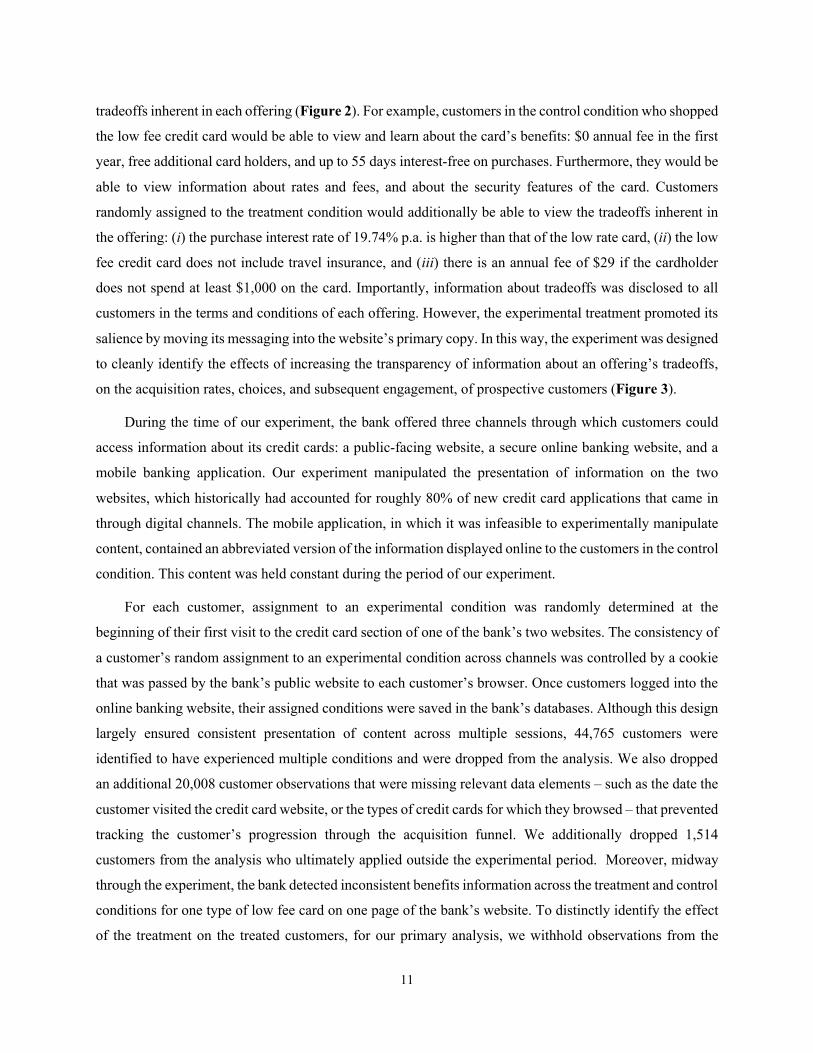
tradeoffs inherent in each offering (Figure 2). For example, customers in the control condition who shopped
the low fee credit card would be able to view and learn about the card’s benefits: $0 annual fee in the first
year, free additional card holders, and up to 55 days interest-free on purchases. Furthermore, they would be
able to view information about rates and fees, and about the security features of the card. Customers
randomly assigned to the treatment condition would additionally be able to view the tradeoffs inherent in
the offering: (i) the purchase interest rate of 19.74% p.a. is higher than that of the low rate card, (ii) the low
fee credit card does not include travel insurance, and (iii) there is an annual fee of $29 if the cardholder
does not spend at least $1,000 on the card. Importantly, information about tradeoffs was disclosed to all
customers in the terms and conditions of each offering. However, the experimental treatment promoted its
salience by moving its messaging into the website’s primary copy. In this way, the experiment was designed
to cleanly identify the effects of increasing the transparency of information about an offering’s tradeoffs,
on the acquisition rates, choices, and subsequent engagement, of prospective customers (Figure 3).
During the time of our experiment, the bank offered three channels through which customers could
access information about its credit cards: a public-facing website, a secure online banking website, and a
mobile banking application. Our experiment manipulated the presentation of information on the two
websites, which historically had accounted for roughly 80% of new credit card applications that came in
through digital channels. The mobile application, in which it was infeasible to experimentally manipulate
content, contained an abbreviated version of the information displayed online to the customers in the control
condition. This content was held constant during the period of our experiment.
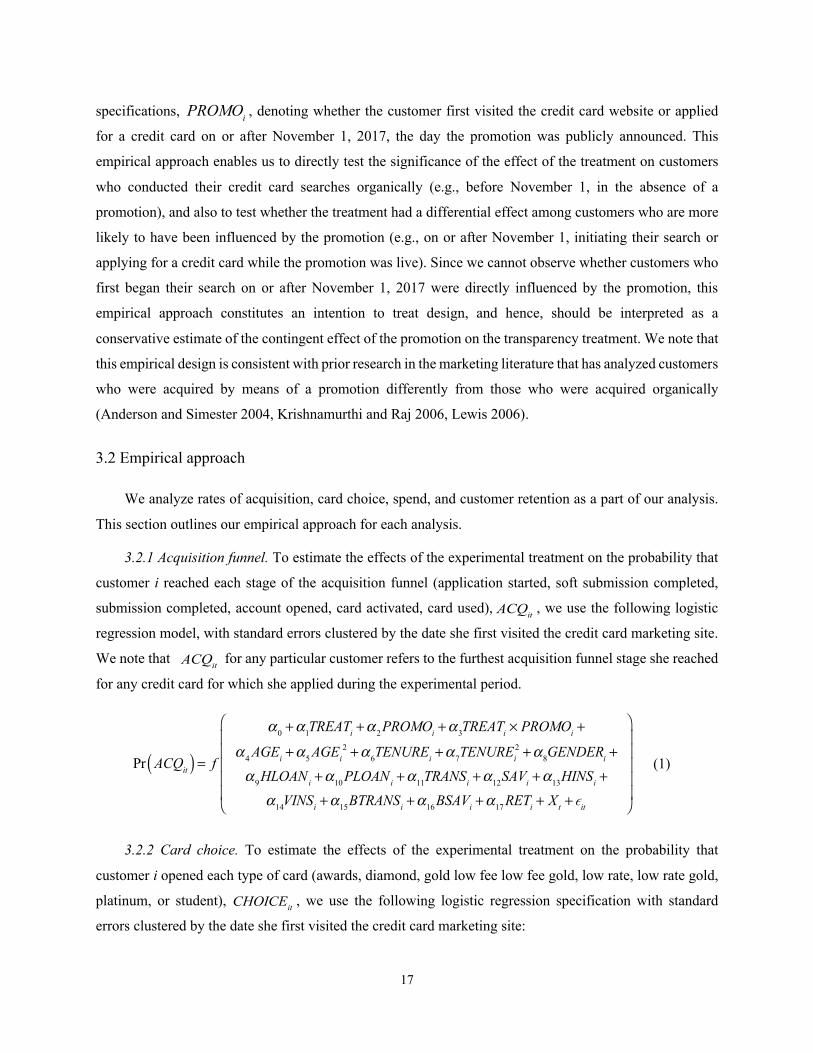
For each customer, assignment to an experimental condition was randomly determined at the
beginning of their first visit to the credit card section of one of the bank’s two websites. The consistency of
a customer’s random assignment to an experimental condition across channels was controlled by a cookie
that was passed by the bank’s public website to each customer’s browser. Once customers logged into the
online banking website, their assigned conditions were saved in the bank’s databases. Although this design
largely ensured consistent presentation of content across multiple sessions, 44,765 customers were
identified to have experienced multiple conditions and were dropped from the analysis. We also dropped
an additional 20,008 customer observations that were missing relevant data elements – such as the date the
customer visited the credit card website, or the types of credit cards for which they browsed – that prevented
tracking the customer’s progression through the acquisition funnel. We additionally dropped 1,514
customers from the analysis who ultimately applied outside the experimental period. Moreover, midway
through the experiment, the bank detected inconsistent benefits information across the treatment and control
conditions for one type of low fee card on one page of the bank’s website. To distinctly identify the effect
of the treatment on the treated customers, for our primary analysis, we withhold observations from the

12
10,424 customers in both conditions who visited this specific page, though we note in an analysis in the
online appendix that the results are substantively similar with these customers included. Our primary
analysis, therefore, includes observations from a total of 389,611 customers, 194,175 of whom were
randomly assigned to the control condition, and 195,436 of whom were randomly assigned to the treatment
condition (Table 1).
Table 1. Summary statistics for customers in the control and treatment conditions. Customer characteristics were captured as of the time of their first documented arrival on the credit card website, and thus, are unaffected by the experimental treatment. We control for all of these customer-level factors in our empirical models, though we note that customers in both conditions were quite well-balanced on these observable dimensions prior to their random assignment. Differing numbers of observations for different variables reflect missing data.
Furthermore, on November 1, 2017 (midway through our period of experimentation), the bank publicly
announced a promotion, offering $300 cash back to customers who opened a credit card in the Low Rate
family and spent $1,000 in purchases with the new card within the first 90 days of activation. The
announcement was broadly supported by advertising (e.g., television, radio, and print). Random assignment
to the experimental conditions proceeded during this promotional period, affording an opportunity to assess
whether providing customers with incentives to choose particular offerings moderates the effect of
presenting tradeoffs on customer acquisition and engagement. The promotional period ran from November
1 through the end of the experiment. We identified 143,845 customers who initially visited the credit card
website prior to the November 1 promotion announcement to not be treated with the promotion,
=0, and 245,766 customers who initially visited on November 1 or after to be treated with the promotion,
=1.
Diff.N Mean SD N Mean SD N Mean SD P)value
Arrived1during1the1promo1period 389,611 63.08% 0.48 194,175 62.95% 0.48 195,436 63.20% 0.48 0.11
Customer1demographicsCustomer1age 389,517 40.12 15.60 194,123 40.12 15.62 195,394 40.11 15.58 0.80Customer1tenure1(months) 388,936 198.49 138.63 193,832 198.34 138.74 195,104 198.65 138.52 0.49Male1indicator 389,440 45.08% 0.50 194,088 45.16% 0.50 195,352 45.00% 0.50 0.31
Product1indicatorsTransaction1product 389,451 89.72% 0.30 194,093 89.71% 0.30 195,358 89.72% 0.30 0.96Savings1product 389,451 67.71% 0.47 194,093 67.70% 0.47 195,358 67.72% 0.47 0.91Home1loan1product 389,451 21.99% 0.41 194,093 22.02% 0.41 195,358 21.96% 0.41 0.63Home1insurance1policy 389,451 11.47% 0.32 194,093 11.49% 0.32 195,358 11.45% 0.32 0.68Personal1loan1product 389,451 10.00% 0.30 194,093 9.96% 0.30 195,358 10.05% 0.30 0.32Retirement1product 389,451 4.74% 0.21 194,093 4.77% 0.21 195,358 4.71% 0.21 0.45Motor1insurance1policy 389,451 4.04% 0.20 194,093 4.01% 0.20 195,358 4.07% 0.20 0.38Term1deposit1product 389,451 3.89% 0.19 194,093 3.90% 0.19 195,358 3.87% 0.19 0.70
All Control Treatment
PROMOi
PROMOi

13
3.1.2 Acquisition measures. In order to assess the impact of providing transparency into the tradeoffs
of a service offering on rates of customer acquisition we tracked: (1) whether the customer progressed
through each stage of the acquisition funnel, , and (2) which types of credit card accounts
customers opened, . At the time of our study, the credit card acquisition funnel for our
partner bank had six stages. In order to gain a detailed understanding of how the experimental treatment
affected customer acquisition, we used six binary variables to instrument each customer’s progress through
the acquisition funnel. In particular, we coded each stage of the acquisition funnel to be 1 if the customer
passed the stage, and 0 if she did not.
The first stage of the acquisition funnel occurred when the customer started an application. During
the application process, customers of the partner bank answered a series of 10 to 40 questions, providing
their demographic information as well as their financial information (such as assets, liabilities, income, and
expenses). For the more than 95% of prospective customers who had existing accounts with the bank, this
stage of the process was streamlined considerably; by simply logging into their online banking accounts,
these customers would be able to transfer their information from their existing accounts to their credit card
applications. Answering these questions typically took customers 5-15 minutes, depending on how much
information was required to complete their financial profile.
Submitting the answers to these questions triggered the second stage of the acquisition funnel, which
was known as a soft submission. In this phase, the bank parsed through the information provided using an
automated process to conduct a risk assessment and determine whether the customer’s financial profile
warranted approval for the credit card for which she had applied, as well as her eligible credit limit. After
the results of this process were shared with the customer, the customer could choose to move on to the third
stage, providing a hard submission. The application submitted at this stage constituted a formal application
submission for a credit card; at this stage, customers provided verification documents required by the bank
to substantiate their income as well as financial holdings and obligations that resided outside the bank. This
stage could last two weeks or longer, depending on the amount of information provided by the customer
and the amount of time the customer took to provide all the necessary information.
If the bank’s process during the hard submission stage substantiated the information provided in the
application, the customer was then moved into the fourth stage, wherein her account was opened. Here, the
bank created and issued a new credit card for the customer and mailed it to her preferred address. This
process typically took about a week. To test whether providing transparency influenced customer choices,
we take a snapshot at this stage, comparing which types of card accounts were opened by customers
randomly assigned to the treatment and control conditions.
Pr ACQit( )Pr CHOICEit( )

14
In the fifth stage, the customer activated the card either by phone, online, through the mobile
application, or by inserting the card into one of the bank’s ATM machines. Finally, in the sixth stage, the
customer used the card to make her first purchase; customers that reached the final stage of the acquisition
funnel comprised 4.05% of all customers who shopped for a credit card. For our analyses, we denote a
customer to have reached this final stage if a purchase was made with the card within two billing cycles of
its activation. Imposing this constraint facilitates comparability among customers acquired early and late in
our experimental period, as failure to do so would afford those who opened their accounts early more time
to demonstrate usage. We note that 95.42% of all cards that were eventually used to make a purchase in
our dataset were used within two billing cycles of their initial activation, and that all results presented in
this manuscript are substantively similar if usage is instead defined by whether any transaction behavior is
ever observed in our data.
Customer progress through the acquisition funnel could stall during any of these six stages, as each
stage was comprised of different dynamics with respect to the customer’s experience and the bank’s
operating costs. Hence, analyzing each stage separately provides important insights about the costs and
benefits of providing prospective customers with transparency into the tradeoffs inherent in a service
offering.
3.1.3 Engagement measures. For customers who made it all the way through the acquisition funnel,
we tracked customer engagement with the card in two ways. First, we tracked product usage by examining
logged monthly spending during the first nine months the customer held the card, . Spend is a
relevant engagement metric, both because it is a direct measure of usage that is an important behavioral
indicator of a card’s utility for the customer, and because it is an important driver of profitability for the
bank. Bank-issued credit cards generate revenue through interest spreads (interest paid by customers who
don’t fully pay off their balances at the end of the month), interchange fees paid by merchants (small
percentages of each transaction), and customer fees (usage fees, service fees, and penalty fees). Customer
spend directly influences the bank’s first two revenue streams.
Second, we tracked customer retention, i.e., whether the customer closed the credit card account during
the first nine months it was open, . As with spend, retention is a relevant measure of customer
engagement, because loyalty is an important behavioral indicator of the card’s utility to the customer, and
because it is an important driver of profitability (Levesque and McDougall 1996). Previous research
conducted in banking demonstrated that reducing defections by just 5% can increase firm profitability by
as much as 100% (Reichheld and Sasser 1990).
ln SPENDit( )
Pr RETAINit( )

15
We note that these engagement measures were queried on August 28, 2018, which means that six full
months of account data are available for any customer who activated their credit cards before February 28,
2018, and nine full months of account data are available for any customer who activated their credit cards
before November 30, 2017. Importantly, all customers who were denoted to have used their cards in our
analysis had at least six months of available account data. Consistently, we track spend during any observed
month for which a credit card account was open and activated, and we track retention six and nine months
into the customer relationship.
3.1.4 Control measures. Although customers randomly assigned to the treatment and control
conditions appear quite well balanced on observable dimensions (Table 1), to get the cleanest possible
estimates of the effects of the experimental treatment on treated customers, we control for a vector of
customer-level factors which were observable prior to each customer’s random assignment. These factors
include the non-linear effect of the customer’s age, and , and tenure with the bank (in months),
, and , their gender , and indicators for whether they held a home loan
product, , a personal loan product, , a transaction product, , a savings product,
, a home insurance policy, , a vehicle insurance policy, , a business transaction,
, or savings product, , or a retirement product with the bank, . For the acquisition
analyses, we also include a vector of date indicator variables, , signifying the first week the customer
visited the credit card pages on the bank’s website, to control for time-varying factors that may have affected
each customer’s initial motivation for seeking a credit card. For the engagement analyses, we include a
similar vector of date indicator variables, , signifying the first week the customer activated their credit
card, to control for time-varying factors that may influence the way customers interact with the credit card
(e.g., a credit card activated before the holidays may be used more intensively than one activated after, etc.)
3.1.5 Category experience and financial incentives. Lastly, to test Hypotheses 5-8, that the effects of
providing transparency into the tradeoffs inherent in a service offering will have a greater effect on
customers with more experience with the product category (H5-H6), and on customers who were not
attracted by a financial incentive (H7-H8), we incorporate data on proxies for both factors into our analysis.
First, since we lack complete data on the degree of credit card experience for each prospective customer
(e.g., because not every customer provides their financial history, and many customers may have accounts
with financial institutions that are not our partner bank), we use the prospective customer’s age as the
primary proxy in our analysis. In the market where CBA operated during the time of our experiment, the
minimum age to apply for a credit card was 18. Data captured by CBA reveals that the probability a
prospective customer has at least one credit card increases concavely in age (Figure 4). As such, data on
the ages of credit card browsers and applicants during our study was right skewed. The average credit card
AGEi AGEi2
TENUREi TENUREi2 GENDERi
HLOANi PLOANi TRANSiSAVi HINSi VINSiBTRANSi BSAVi RETi
Xt
Xt

16
browser was 40.12 years old and the median browser was 37 years old. The average credit card applicant
was 31.27 years old, and the median applicant was 28 years old. To test hypotheses 5 and 6, that the effects
of providing prospective customers with transparency into the tradeoffs of each offering will have a
disproportionate effect on the product usage and retention of customers with more prior category experience,
we complement our analyses on the full sample of data with split sample analyses of customers who were
28 and younger (less experienced with credit cards), and customers who were older than 28 (more
experienced with credit cards). Using the median applicant age to conduct a split sample analysis yields a
comparable number of more-experienced and less-experienced customers. However, as we document in the
online appendix, our results are substantively similar with different cutoffs, for example, splitting the
bottom quartile of the credit card applicant data (24 and younger) from the top three quartiles.
Figure 4: The probability a prospective customer shopping for a credit card already has a credit card, as a function of their age (n=389,085). Predicted plots are based on a logistic regression of the probability of having a credit card as a function of indicator variables for the prospective customer’s age, regressed on the full sample of prospective customers aged 18-79 (within support of 99% of the data). A 95% confidence interval band is shown in light grey. For our primary analyses, we denote customers aged 28 and younger (the median age for a credit card applicant) as less experienced, and customers 28 and older to be more experienced with credit cards. This cutoff is shown with a red vertical line, and it demonstrates that the probability a 28-year old prospective customer had a credit card at the time of this study was 58.5%.
Second, to test whether our experimental treatment had differential effects for customers who were
motivated to shop for a credit card by a promotion, we include an interaction term in all of our empirical
0.2
5.5
.75
1Pr
obab
ility
of h
avin
g a
cred
it ca
rd
20 30 40 50 60 70 80Customer age
17
specifications, , denoting whether the customer first visited the credit card website or applied
for a credit card on or after November 1, 2017, the day the promotion was publicly announced. This
empirical approach enables us to directly test the significance of the effect of the treatment on customers
who conducted their credit card searches organically (e.g., before November 1, in the absence of a
promotion), and also to test whether the treatment had a differential effect among customers who are more
likely to have been influenced by the promotion (e.g., on or after November 1, initiating their search or
applying for a credit card while the promotion was live). Since we cannot observe whether customers who
first began their search on or after November 1, 2017 were directly influenced by the promotion, this
empirical approach constitutes an intention to treat design, and hence, should be interpreted as a
conservative estimate of the contingent effect of the promotion on the transparency treatment. We note that
this empirical design is consistent with prior research in the marketing literature that has analyzed customers
who were acquired by means of a promotion differently from those who were acquired organically
(Anderson and Simester 2004, Krishnamurthi and Raj 2006, Lewis 2006).
3.2 Empirical approach
We analyze rates of acquisition, card choice, spend, and customer retention as a part of our analysis.
This section outlines our empirical approach for each analysis.
3.2.1 Acquisition funnel. To estimate the effects of the experimental treatment on the probability that
customer i reached each stage of the acquisition funnel (application started, soft submission completed,
submission completed, account opened, card activated, card used), , we use the following logistic
regression model, with standard errors clustered by the date she first visited the credit card marketing site.
We note that for any particular customer refers to the furthest acquisition funnel stage she reached
for any credit card for which she applied during the experimental period.
(1)
3.2.2 Card choice. To estimate the effects of the experimental treatment on the probability that
customer i opened each type of card (awards, diamond, gold low fee low fee gold, low rate, low rate gold,
platinum, or student), , we use the following logistic regression specification with standard
errors clustered by the date she first visited the credit card marketing site:
PROMOi
ACQit
ACQit
Pr ACQit( ) = fα0 +α1TREATi +α 2PROMOi +α3TREATi × PROMOi +
α 4AGEi +α5AGEi2 +α6TENUREi +α7TENUREi
2 +α8GENDERi +α9HLOANi +α10PLOANi +α11TRANSi +α12SAVi +α13HINSi +
α14VINSi +α15BTRANSi +α16BSAVi +α17RETi + Xt + εit
⎛
⎝
⎜⎜⎜⎜⎜
⎞
⎠
⎟⎟⎟⎟⎟
CHOICEit

18
(2)
To account for time-varying differences in the motivation to pursue a credit card, which could affect
both persistence in the acquisition process, and one’s choice of credit card, we include a vector of indicator
variables, , in Models (1) and (2) denoting the week the customer first visited the marketing website.
3.2.3 Spend. To estimate the effects of the experimental treatment on the spend of customer i, in month
t, observed months when the credit card account was open and activated, we use the following fixed effects
panel model, with standard errors clustered by the date she activated the card.
(3)
3.2.4 Retention. To estimate the effects of the experimental treatment on the retention of customer i,
six and nine months after the activation of her card, we use the following logistic regression, with standard
errors clustered by the date she activated the card.
(4)
To account for time-varying differences in credit card usage in Models (3) and (4), we include a vector
of indicator variables, , denoting the calendar week in which the customer activated the card.
3.3 Analysis and results
3.2.1 Acquisition funnel (H1). Figure 5 graphically displays the marginal effects of the treatment on
the acquisition funnel of the treated customers. The results show three features of consequence. First, rates
of conversion were higher during the promotion period, likely owing to the efficacy of the promotion in
attracting interested customers to the website and in enhancing the appeal of the promoted products. Second,
Pr CHOICEit( ) = fβ0 + β1TREATi + β2PROMOi + β3TREATi × PROMOi +
β4AGEi + β5AGEi2 + β6TENUREi + β7TENUREi
2 + β8GENDERi +β9HLOANi + β10PLOANi + β11TRANSi + β12SAVi + β13HINSi +
β14VINSi + β15BTRANSi + β16BSAVi + β17RETi + Xt + εit
⎛
⎝
⎜⎜⎜⎜⎜
⎞
⎠
⎟⎟⎟⎟⎟
Xt
ln SPENDit( ) = fγ 0 + γ 1TREATi + γ 2PROMOi + γ 3TREATi × PROMOi +
γ 4AGEi + γ 5AGEi2 + γ 6TENUREi + γ 7TENUREi
2 + γ 8GENDERi +γ 9HLOANi + γ 10PLOANi + γ 11TRANSi + γ 12SAVi + γ 13HINSi +
γ 14VINSi + γ 15BTRANSi + γ 16BSAVi + γ 17RETi + Xt + εit
⎛
⎝
⎜⎜⎜⎜⎜
⎞
⎠
⎟⎟⎟⎟⎟
Pr RETAINit( ) = fδ0 +δ1TREATi +δ 2PROMOi +δ3TREATi × PROMOi +
δ 4AGEi +δ5AGEi2 +δ6TENUREi +δ7TENUREi
2 +δ8GENDERi +δ9HLOANi +δ10PLOANi +δ11TRANSi +δ12SAVi +δ13HINSi +
δ14VINSi +δ15BTRANSi +δ16BSAVi +δ17RETi + Xt + εit
⎛
⎝
⎜⎜⎜⎜⎜
⎞
⎠
⎟⎟⎟⎟⎟
Xt

19
during the promotion period, when offered transparency into the tradeoffs inherent in each credit card,
significantly fewer customers chose to start the application process (17.73% vs 17.38%, p<0.05) or soft
submit their application (14.49% vs 14.20%, p<0.05). Interestingly, these differences did not emerge among
customers who shopped for credit cards outside the promotion period. Finally, and most significantly,
during both periods, there were no significant differences in rates of conversion through the various phases
of the acquisition funnel during the submission phase and beyond. As we document in the online appendix,
we note that these patterns are substantively similar among customers with high and low experience levels
with credit cards. Taken together, these results suggest that, consistent with H1, from an acquisition
perspective, voluntarily providing prospective customers with transparency into the tradeoffs of the firm’s
offerings, had no effect on its overall rate of customer acquisition.
Figure 5: Acquisition funnel conversion percentages during the promotion and non-promotion periods. Marginal effects are from logistic regression models, estimated with robust standard errors clustered at the first website visit date level. *, **, and ***, signify significance at the 10%, 5%, and 1% levels respectively. The results indicate that conversion rates are significantly higher during the promotion period. Moreover, although fewer customers who are exposed to the treatment during the promotion period start or soft submit an application, the treatment ultimately had no effect on rates of customer acquisition, neither during the promotion nor the non-promotion periods, which is consistent with H1.
14.55%
11.66%
4.73%
3.53% 3.27% 2.98%
14.38%
11.47%
4.70%3.44% 3.25%
2.96%
17.38%
14.20%
7.07%
5.21% 4.97% 4.64%
17.73%
14.49%
7.10%
5.34% 5.09%4.73%
0%
2%
4%
6%
8%
10%
12%
14%
16%
18%
20%
Application Started Soft submission Submission Opened Activated Used
Perc
enta
ge o
f pro
spec
tive
cust
omer
s (%
)
Stage of acquistion funnel
Treatment/ no promotion Control / no promotion
Treatment/ promotion Control/ promotion**
**
20
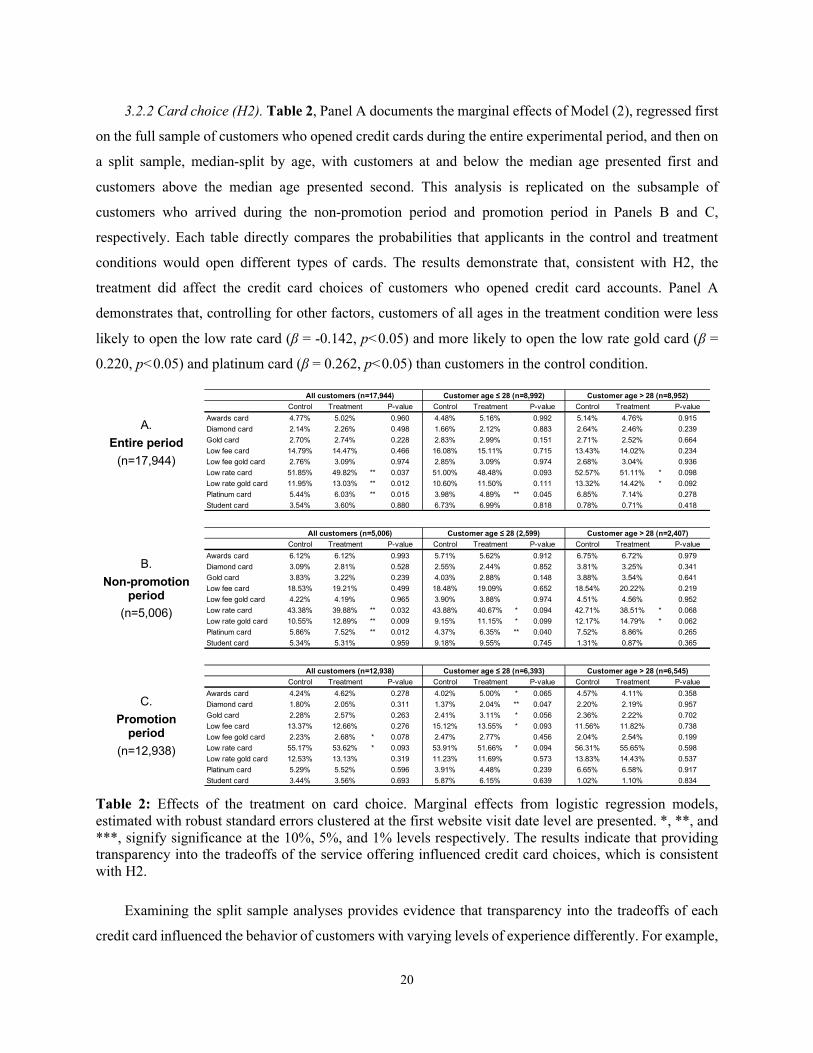
3.2.2 Card choice (H2). Table 2, Panel A documents the marginal effects of Model (2), regressed first
on the full sample of customers who opened credit cards during the entire experimental period, and then on
a split sample, median-split by age, with customers at and below the median age presented first and
customers above the median age presented second. This analysis is replicated on the subsample of
customers who arrived during the non-promotion period and promotion period in Panels B and C,
respectively. Each table directly compares the probabilities that applicants in the control and treatment
conditions would open different types of cards. The results demonstrate that, consistent with H2, the
treatment did affect the credit card choices of customers who opened credit card accounts. Panel A
demonstrates that, controlling for other factors, customers of all ages in the treatment condition were less
likely to open the low rate card (β = -0.142, p<0.05) and more likely to open the low rate gold card (β =
0.220, p<0.05) and platinum card (β = 0.262, p<0.05) than customers in the control condition.
A. Entire period
(n=17,944)
B. Non-promotion
period (n=5,006)
C. Promotion
period (n=12,938)
Table 2: Effects of the treatment on card choice. Marginal effects from logistic regression models, estimated with robust standard errors clustered at the first website visit date level are presented. *, **, and ***, signify significance at the 10%, 5%, and 1% levels respectively. The results indicate that providing transparency into the tradeoffs of the service offering influenced credit card choices, which is consistent with H2.
Examining the split sample analyses provides evidence that transparency into the tradeoffs of each
credit card influenced the behavior of customers with varying levels of experience differently. For example,
Control Treatment P-value Control Treatment P-value Control Treatment P-valueAwards card 4.77% 5.02% 0.960 4.48% 5.16% 0.992 5.14% 4.76% 0.915Diamond card 2.14% 2.26% 0.498 1.66% 2.12% 0.883 2.64% 2.46% 0.239Gold card 2.70% 2.74% 0.228 2.83% 2.99% 0.151 2.71% 2.52% 0.664Low fee card 14.79% 14.47% 0.466 16.08% 15.11% 0.715 13.43% 14.02% 0.234Low fee gold card 2.76% 3.09% 0.974 2.85% 3.09% 0.974 2.68% 3.04% 0.936Low rate card 51.85% 49.82% ** 0.037 51.00% 48.48% 0.093 52.57% 51.11% * 0.098Low rate gold card 11.95% 13.03% ** 0.012 10.60% 11.50% 0.111 13.32% 14.42% * 0.092Platinum card 5.44% 6.03% ** 0.015 3.98% 4.89% ** 0.045 6.85% 7.14% 0.278Student card 3.54% 3.60% 0.880 6.73% 6.99% 0.818 0.78% 0.71% 0.418
All customers (n=17,944) Customer age ≤ 28 (n=8,992) Customer age > 28 (n=8,952)
Control Treatment P-value Control Treatment P-value Control Treatment P-valueAwards card 6.12% 6.12% 0.993 5.71% 5.62% 0.912 6.75% 6.72% 0.979Diamond card 3.09% 2.81% 0.528 2.55% 2.44% 0.852 3.81% 3.25% 0.341Gold card 3.83% 3.22% 0.239 4.03% 2.88% 0.148 3.88% 3.54% 0.641Low fee card 18.53% 19.21% 0.499 18.48% 19.09% 0.652 18.54% 20.22% 0.219Low fee gold card 4.22% 4.19% 0.965 3.90% 3.88% 0.974 4.51% 4.56% 0.952Low rate card 43.38% 39.88% ** 0.032 43.88% 40.67% * 0.094 42.71% 38.51% * 0.068Low rate gold card 10.55% 12.89% ** 0.009 9.15% 11.15% * 0.099 12.17% 14.79% * 0.062Platinum card 5.86% 7.52% ** 0.012 4.37% 6.35% ** 0.040 7.52% 8.86% 0.265Student card 5.34% 5.31% 0.959 9.18% 9.55% 0.745 1.31% 0.87% 0.365
All customers (n=5,006) Customer age ≤ 28 (2,599) Customer age > 28 (n=2,407)
Control Treatment P-value Control Treatment P-value Control Treatment P-valueAwards card 4.24% 4.62% 0.278 4.02% 5.00% * 0.065 4.57% 4.11% 0.358Diamond card 1.80% 2.05% 0.311 1.37% 2.04% ** 0.047 2.20% 2.19% 0.957Gold card 2.28% 2.57% 0.263 2.41% 3.11% * 0.056 2.36% 2.22% 0.702Low fee card 13.37% 12.66% 0.276 15.12% 13.55% * 0.093 11.56% 11.82% 0.738Low fee gold card 2.23% 2.68% * 0.078 2.47% 2.77% 0.456 2.04% 2.54% 0.199Low rate card 55.17% 53.62% * 0.093 53.91% 51.66% * 0.094 56.31% 55.65% 0.598Low rate gold card 12.53% 13.13% 0.319 11.23% 11.69% 0.573 13.83% 14.43% 0.537Platinum card 5.29% 5.52% 0.596 3.91% 4.48% 0.239 6.65% 6.58% 0.917Student card 3.44% 3.56% 0.693 5.87% 6.15% 0.639 1.02% 1.10% 0.834
All customers (n=12,938) Customer age ≤ 28 (n=6,393) Customer age > 28 (n=6,545)

21
less experienced customers exposed to the treatment were more likely to open the platinum card (β = 0.393,
p<0.05). More experienced customers exposed to the treatment were less likely to open the low rate card
(β = -0.162, p<0.10), and were more likely to open the low rate gold card (β = 0.208, p<0.10). These
differences are interesting, since they suggest that different types of customers with different needs
evaluated the tradeoffs differently, which in turn, differentially affected their choices. Moreover, these
diverging effects of the treatment among customers with varying experience levels further suggest that the
results were not merely driven by tradeoff copy that made some credit cards appear clearly dominant to
others.
As additional evidence, it is revealing to consider the differential effects of the treatment on the choices
of customers who applied for credit cards in the absence and presence of a promotion, which are presented
in Panels B and C, respectively. During the non-promotion period, the patterns of results among all, less
experienced, and more experienced customers were consistent with those described above across the entire
experimental period, with the addition that less experienced customers were marginally less likely to select
the low rate card (β = -0.137, p<0.10), and were marginally more likely to select the low rate gold card (β
= 0.225, p<0.10) when provided transparency into each card’s tradeoffs. By contrast, during the promotion
period, which likely attracted customers with different needs and preferences, the treatment dissuaded less
experienced customers from the low rate (β = -0.092, p<0.10) and low fee cards (β = -0.129, p<0.10) , and
increased their interest in the awards (β = 0.229, p<0.10), diamond (β = 0.422, p<0.05), and gold cards (β
= 0.265, p<0.10). Interestingly, during the promotion period, the treatment exhibited no effect on the credit
card choices of more experienced customers. However, marginal effects emerge across the full sample of
customers during the promotion period; those exposed to transparency were less likely to select the low
rate card (β = -0.063, p<0.10) and were more likely to select the low fee gold card (β = 0.192, p<0.10). In
sum, these results suggest that, consistent with H2, transparency influenced customers’ credit card choices.
3.2.3 Product usage (H3, H5, H7). In Table 3, Columns 1-3, we analyze the average monthly spending
of all, less experienced, and more experienced customers. Average monthly spending captures the usage
behavior of customers in all months during which they held an active credit card, including months when
they had it, but didn’t use it (e.g., monthly spend is $0), and excluding months after which they may have
cancelled it (e.g., monthly spend is missing, because the customer no longer held the card). As such,
monthly spend, as it is estimated in Columns (1-3), is a direct measure of contemporary customer
engagement, in that it captures how the card was used while the card was held. Column (1) shows that the
treatment led to nominal, though insignificant, increase in average monthly spending (!=0.080, p=0.122),
that the promotion had no effect on spend (!=-0.104, p=0.314), and that there was an insignificant
interaction (!=-0.097, p=0.111), when the effects were considered across all customers.

22
Table 3: Effects of the treatment on monthly spend. Columns (1) – (3) show the results of panel data regression models for all customers as well as younger and older customers, with spend values for months after cancellation set to missing. Columns (4) – (6) show the same specifications with spend values for months after cancellation set to zero. All models include indicator variables for the week the credit card was activated, and are estimated with robust standard errors clustered by activation date. *, **, and *** signify significance at the 10%, 5%, and 1% levels respectively. Marginal effect estimates for monthly spend are provided for each condition. The results indicate that customers exposed to the treatment spent more on their cards, that these effects were stronger for more experienced customers, and that these effects were attenuated by the promotion, which is consistent with H3, H5, and H7.
(1) (2) (3) (4) (5) (6)Ln(Spend) Ln(Spend) Ln(Spend) Ln(Spend) Ln(Spend) Ln(Spend)
Treatment 0.080 0.035 0.138** 0.095* 0.033 0.176***(0.052) (0.085) (0.069) (0.054) (0.092) (0.062)
Promotion =0.104 0.019 =0.230 =0.371*** =0.150 =0.593***(0.103) (0.131) (0.151) (0.114) (0.125) (0.166)
Treatment>x>promotion =0.097 =0.054 =0.162** =0.109* =0.045 =0.199**(0.061) (0.103) (0.082) (0.064) (0.110) (0.080)
Customer>age 0.072*** 0.077 0.009 0.046*** 0.137 0.027(0.008) (0.129) (0.018) (0.009) (0.136) (0.019)
Customer>age² =0.001*** =0.001 =0.000 =0.001*** =0.002 =0.000(0.000) (0.003) (0.000) (0.000) (0.003) (0.000)
Customer>tenure 0.002*** 0.005*** =0.001 0.000 0.004*** =0.002***(0.000) (0.001) (0.001) (0.001) (0.001) (0.001)
Customer>tenure² =0.000 =0.000*** 0.000* 0.000 =0.000*** 0.000***(0.000) (0.000) (0.000) (0.000) (0.000) (0.000)
Male>indicator 0.050 0.100** 0.001 0.072** 0.106** 0.035(0.034) (0.046) (0.041) (0.034) (0.045) (0.044)
Retirement>product> 0.045 0.147 0.027 0.038 0.173 0.015(0.105) (0.160) (0.123) (0.108) (0.164) (0.122)
Home>loan>product =0.038 0.028 =0.045 =0.044 0.142 =0.090(0.076) (0.162) (0.088) (0.085) (0.172) (0.097)
Personal>loan>product 0.496*** 0.184 0.595*** 1.043*** 1.120*** 0.999***(0.105) (0.231) (0.121) (0.101) (0.228) (0.123)
Savings>product 0.198* 0.406** 0.072 =0.023 0.253 =0.170(0.120) (0.161) (0.154) (0.133) (0.189) (0.168)
Term>deposit>product 0.277*** 0.403*** 0.182*** 0.247*** 0.369*** 0.156***(0.040) (0.062) (0.050) (0.040) (0.062) (0.050)
Transaction>product =0.324*** =0.437*** =0.230*** =0.209*** =0.376*** =0.071(0.039) (0.063) (0.054) (0.043) (0.065) (0.057)
Home>insurance>policy 0.509*** 0.736*** 0.468*** 0.349*** 0.500*** 0.334***(0.049) (0.126) (0.059) (0.062) (0.141) (0.070)
Motor>insurance>policy 0.067 0.019 0.179** 0.105* 0.026 0.270***(0.058) (0.077) (0.087) (0.058) (0.078) (0.095)
Constant 3.348*** 3.060* 4.972*** 3.455*** 1.802 4.334***(0.212) (1.579) (0.403) (0.245) (1.644) (0.427)
Observations 121,679 61,231 60,448 126,658 63,237 63,421Customers 15,942 7,932 8,010 15,942 7,932 8,010Data>treatment>for>closed>accounts Missing Missing Missing Zero Zero> ZeroSample All Age≤28 Age>28 All Age≤28 Age>28R=squared 0.0321 0.0461 0.0256 0.0271 0.0363 0.0302Pred(Y):>Non=Promotion:>Control $196.64 $158.84 $245.45 $192.67 $151.58 $246.66Pred(Y):>Non=Promotion:>Treatment $212.98 $164.56 $281.63 $211.79 $156.60 $294.06Pred(Y):>Promotion:>Control $177.20 $161.89 $195.12 $132.91 $130.44 $136.26Pred(Y):>Promotion:>Treatment $174.20 $158.90 $190.30 $130.99 $128.84 $133.13
23
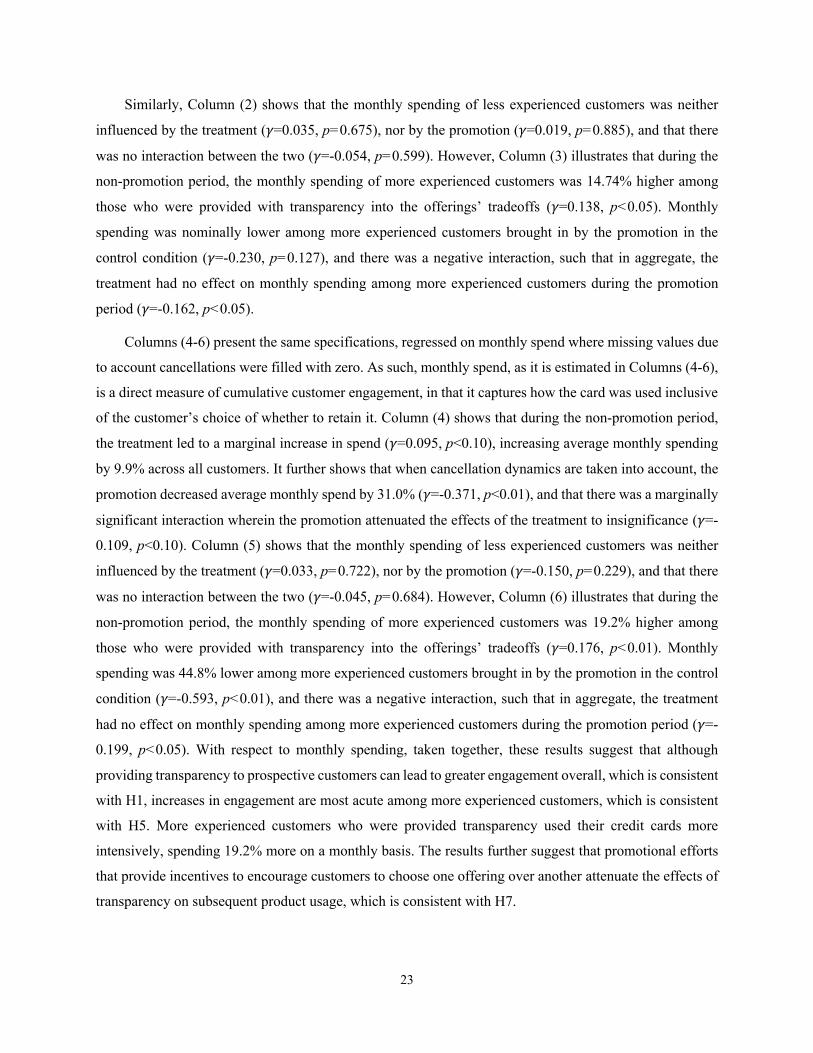
Similarly, Column (2) shows that the monthly spending of less experienced customers was neither
influenced by the treatment (!=0.035, p=0.675), nor by the promotion (!=0.019, p=0.885), and that there
was no interaction between the two (!=-0.054, p=0.599). However, Column (3) illustrates that during the
non-promotion period, the monthly spending of more experienced customers was 14.74% higher among
those who were provided with transparency into the offerings’ tradeoffs (!=0.138, p<0.05). Monthly
spending was nominally lower among more experienced customers brought in by the promotion in the
control condition (!=-0.230, p=0.127), and there was a negative interaction, such that in aggregate, the
treatment had no effect on monthly spending among more experienced customers during the promotion
period (!=-0.162, p<0.05).
Columns (4-6) present the same specifications, regressed on monthly spend where missing values due
to account cancellations were filled with zero. As such, monthly spend, as it is estimated in Columns (4-6),
is a direct measure of cumulative customer engagement, in that it captures how the card was used inclusive
of the customer’s choice of whether to retain it. Column (4) shows that during the non-promotion period,
the treatment led to a marginal increase in spend (!=0.095, p<0.10), increasing average monthly spending
by 9.9% across all customers. It further shows that when cancellation dynamics are taken into account, the
promotion decreased average monthly spend by 31.0% (!=-0.371, p<0.01), and that there was a marginally
significant interaction wherein the promotion attenuated the effects of the treatment to insignificance (!=-
0.109, p<0.10). Column (5) shows that the monthly spending of less experienced customers was neither
influenced by the treatment (!=0.033, p=0.722), nor by the promotion (!=-0.150, p=0.229), and that there
was no interaction between the two (!=-0.045, p=0.684). However, Column (6) illustrates that during the
non-promotion period, the monthly spending of more experienced customers was 19.2% higher among
those who were provided with transparency into the offerings’ tradeoffs (!=0.176, p<0.01). Monthly
spending was 44.8% lower among more experienced customers brought in by the promotion in the control
condition (!=-0.593, p<0.01), and there was a negative interaction, such that in aggregate, the treatment
had no effect on monthly spending among more experienced customers during the promotion period (!=-
0.199, p<0.05). With respect to monthly spending, taken together, these results suggest that although
providing transparency to prospective customers can lead to greater engagement overall, which is consistent
with H1, increases in engagement are most acute among more experienced customers, which is consistent
with H5. More experienced customers who were provided transparency used their credit cards more
intensively, spending 19.2% more on a monthly basis. The results further suggest that promotional efforts
that provide incentives to encourage customers to choose one offering over another attenuate the effects of
transparency on subsequent product usage, which is consistent with H7.
24
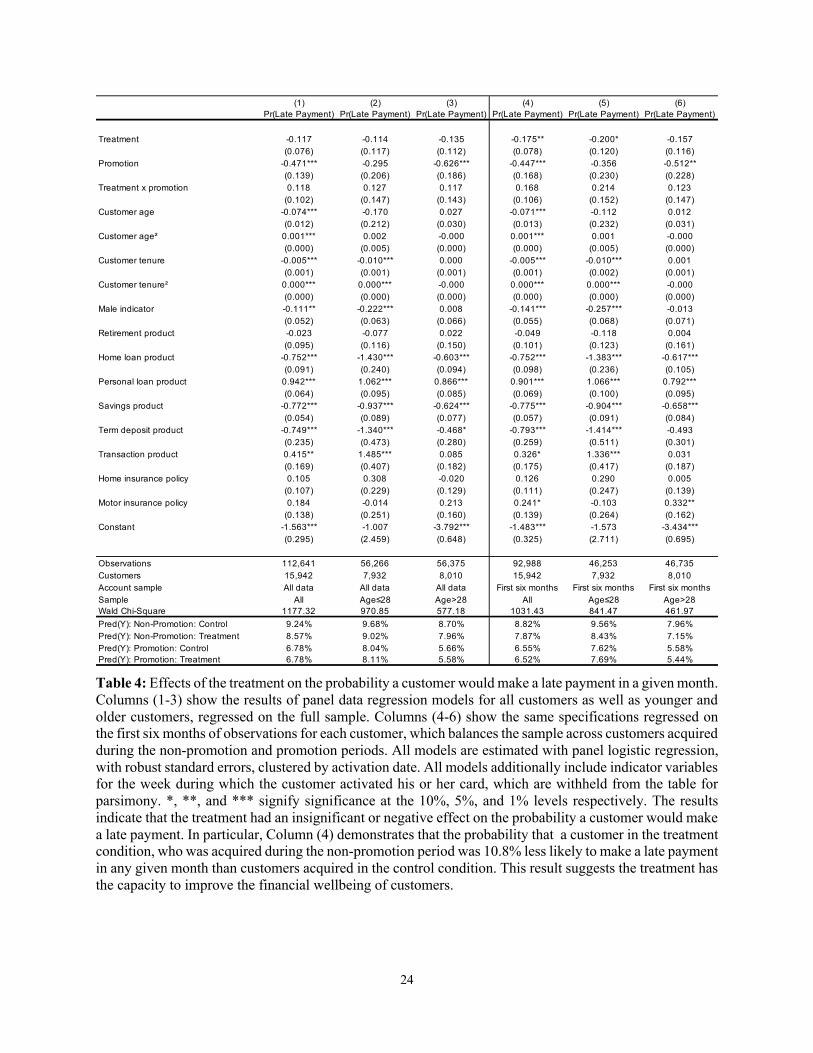
Table 4: Effects of the treatment on the probability a customer would make a late payment in a given month. Columns (1-3) show the results of panel data regression models for all customers as well as younger and older customers, regressed on the full sample. Columns (4-6) show the same specifications regressed on the first six months of observations for each customer, which balances the sample across customers acquired during the non-promotion and promotion periods. All models are estimated with panel logistic regression, with robust standard errors, clustered by activation date. All models additionally include indicator variables for the week during which the customer activated his or her card, which are withheld from the table for parsimony. *, **, and *** signify significance at the 10%, 5%, and 1% levels respectively. The results indicate that the treatment had an insignificant or negative effect on the probability a customer would make a late payment. In particular, Column (4) demonstrates that the probability that a customer in the treatment condition, who was acquired during the non-promotion period was 10.8% less likely to make a late payment in any given month than customers acquired in the control condition. This result suggests the treatment has the capacity to improve the financial wellbeing of customers.
(1) (2) (3) (4) (5) (6)Pr(Late/Payment) Pr(Late/Payment) Pr(Late/Payment) Pr(Late/Payment) Pr(Late/Payment) Pr(Late/Payment)
Treatment 40.117 40.114 40.135 40.175** 40.200* 40.157(0.076) (0.117) (0.112) (0.078) (0.120) (0.116)
Promotion 40.471*** 40.295 40.626*** 40.447*** 40.356 40.512**(0.139) (0.206) (0.186) (0.168) (0.230) (0.228)
Treatment/x/promotion 0.118 0.127 0.117 0.168 0.214 0.123(0.102) (0.147) (0.143) (0.106) (0.152) (0.147)
Customer/age 40.074*** 40.170 0.027 40.071*** 40.112 0.012(0.012) (0.212) (0.030) (0.013) (0.232) (0.031)
Customer/age² 0.001*** 0.002 40.000 0.001*** 0.001 40.000(0.000) (0.005) (0.000) (0.000) (0.005) (0.000)
Customer/tenure 40.005*** 40.010*** 0.000 40.005*** 40.010*** 0.001(0.001) (0.001) (0.001) (0.001) (0.002) (0.001)
Customer/tenure² 0.000*** 0.000*** 40.000 0.000*** 0.000*** 40.000(0.000) (0.000) (0.000) (0.000) (0.000) (0.000)
Male/indicator 40.111** 40.222*** 0.008 40.141*** 40.257*** 40.013(0.052) (0.063) (0.066) (0.055) (0.068) (0.071)
Retirement/product/ 40.023 40.077 0.022 40.049 40.118 0.004(0.095) (0.116) (0.150) (0.101) (0.123) (0.161)
Home/loan/product 40.752*** 41.430*** 40.603*** 40.752*** 41.383*** 40.617***(0.091) (0.240) (0.094) (0.098) (0.236) (0.105)
Personal/loan/product 0.942*** 1.062*** 0.866*** 0.901*** 1.066*** 0.792***(0.064) (0.095) (0.085) (0.069) (0.100) (0.095)
Savings/product 40.772*** 40.937*** 40.624*** 40.775*** 40.904*** 40.658***(0.054) (0.089) (0.077) (0.057) (0.091) (0.084)
Term/deposit/product 40.749*** 41.340*** 40.468* 40.793*** 41.414*** 40.493(0.235) (0.473) (0.280) (0.259) (0.511) (0.301)
Transaction/product 0.415** 1.485*** 0.085 0.326* 1.336*** 0.031(0.169) (0.407) (0.182) (0.175) (0.417) (0.187)
Home/insurance/policy 0.105 0.308 40.020 0.126 0.290 0.005(0.107) (0.229) (0.129) (0.111) (0.247) (0.139)
Motor/insurance/policy 0.184 40.014 0.213 0.241* 40.103 0.332**(0.138) (0.251) (0.160) (0.139) (0.264) (0.162)
Constant 41.563*** 41.007 43.792*** 41.483*** 41.573 43.434***(0.295) (2.459) (0.648) (0.325) (2.711) (0.695)
Observations 112,641 56,266 56,375 92,988 46,253 46,735Customers 15,942 7,932 8,010 15,942 7,932 8,010Account/sample All/data All/data All/data First/six/months First/six/months First/six/monthsSample All Age≤28 Age>28 All Age≤28 Age>28Wald/Chi4Square 1177.32 970.85 577.18 1031.43 841.47 461.97Pred(Y):/Non4Promotion:/Control 9.24% 9.68% 8.70% 8.82% 9.56% 7.96%Pred(Y):/Non4Promotion:/Treatment 8.57% 9.02% 7.96% 7.87% 8.43% 7.15%Pred(Y):/Promotion:/Control 6.78% 8.04% 5.66% 6.55% 7.62% 5.58%Pred(Y):/Promotion:/Treatment 6.78% 8.11% 5.58% 6.52% 7.69% 5.44%

25
Importantly, although it may be reflective of firm profitability, we note that increased credit card
spending, on its own, may not necessarily be emblematic of a better experience for customers. Indeed,
higher spending rates could be detrimental to customers, if they meant customers were spending beyond
their means. In a separate analysis, presented in Table 4, we analyze the probability that customers in
different experimental conditions made late payments from month to month – the state of not having met
the minimum required payment amount by the payment due date. Looking across the entire panel of data,
in Columns (1-3), we find that the treatment had no effect on the probability a customer made a late payment
– among all customers (!=-0.117, p=0.124), less experienced customers (!=-0.114, p=0.332), and more
experienced customers (!=-0.135, p=0.227). However, when in Columns (4-6) we consider the first six
months of data for each customer – which balances the number of monthly observations among customers
who opened accounts during the non-promotion (e.g., before November 1) and promotion (e.g., on or after
November 1) periods – we observe that the probability of making a late payment was 10.8% lower among
customers who were in the treatment condition (!=-0.175, p<0.05), which suggests that the increased levels
of engagement we observe do not come at the expense of customers’ financial wellbeing. In fact, the
evidence is supportive of the idea that providing transparency into the tradeoffs of various offerings can
improve the financial wellbeing of customers. In the next section, we examine the effects of transparency
on customer retention, another important measure of customer engagement, that is both emblematic of
customer experiences (e.g., customers who are having more favorable experiences with a service offering
are more likely to continue using it), and firm performance (e.g., customers who are retained are generally
more profitable than those who defect).
3.2.4 Retention (H4, H6, H8). In Table 5, Columns (1-3) and (4-6) show the effects of tradeoff
transparency on the retention of all customers, less experienced customers, and more experienced customers,
after six and nine months, respectively. Columns (1) and (4) provide evidence that, looking across all
customers, the treatment had an insignificant effect on retention after six months ("=0.259, p=0.198), but
that it increased retention after nine months ("=0.249, p<0.05). After nine months, cancellations among
customers in the treatment group were 20.5% lower, which is consistent with H4, and provides evidence
that revealing the hidden tradeoffs to prospective customers can have meaningful implications for the long
run trajectories of service relationships. Interestingly, Columns (2) and (5) reveal that, consistent with the
prior analysis on spend, the positive implications of the treatment for retention were less likely to accrue to
customers with less category experience. Less experienced customers in the treatment group were no more
nor less likely to be retained after six ("=0.099, p=0.771) or nine months ("=0.111, p=0.546). On the other
hand, Columns (3) and (6) demonstrate that more experienced customers who received the transparency

26
treatment were more likely to have been retained after six ("=0.437, p<0.10) and nine months ("=0.447,
p<0.01), which is consistent with H6.
Table 5: Effects of the treatment on customer retention rates. Columns (1) – (3) and columns (4) – (6) show the results of cross-sectional data regression models of all, younger, and older customers for retention six and nine months after card activation, respectively. All models include indicator variables for the week the credit card was activated, and are estimated with robust standard errors clustered by activation date. *, **, and *** signify significance at the 10%, 5%, and 1% levels respectively. The results indicate that transparency can lead to increased customer retention, which is consistent with H4, that the effects are strongest for more experienced customers, which is consistent with H6, and that the effects are dampened during the promotion, which is consistent with H8. Marginal effect estimates for retention after six and nine months are provided for each experimental condition.
(1) (2) (3) (4) (5) (6)Pr(Retain6) Pr(Retain6) Pr(Retain6) Pr(Retain9) Pr(Retain9) Pr(Retain9)
Treatment 0.259 0.099 0.437* 0.249** 0.111 0.447***(0.202) (0.340) (0.231) (0.115) (0.183) (0.163)
Promotion :1.736*** :1.693*** :1.758*** :1.344*** :0.882** :1.647***(0.256) (0.633) (0.275) (0.231) (0.422) (0.294)
Treatment;x;promotion :0.239 :0.055 :0.410 :0.223 0.114 :0.569**(0.220) (0.365) (0.258) (0.165) (0.258) (0.226)
Customer;age :0.219*** :0.038 0.060 :0.094** 0.469 0.010(0.038) (0.323) (0.044) (0.041) (0.320) (0.055)
Customer;age² 0.003*** :0.002 :0.000 0.001*** :0.011 0.000(0.001) (0.007) (0.001) (0.001) (0.007) (0.001)
Customer;tenure :0.009*** :0.011*** :0.009*** :0.005*** :0.007** :0.006***(0.001) (0.002) (0.001) (0.002) (0.003) (0.002)
Customer;tenure² 0.000*** 0.000*** 0.000*** 0.000*** 0.000* 0.000***(0.000) (0.000) (0.000) (0.000) (0.000) (0.000)
Male;indicator 0.046 0.011 0.065 0.078 0.039 0.118(0.074) (0.110) (0.095) (0.091) (0.100) (0.133)
Retirement;product; 0.245 0.110 0.414* :0.107 :0.255 0.036(0.154) (0.221) (0.229) (0.155) (0.176) (0.235)
Home;loan;product :0.595*** :0.775*** :0.539*** :0.564*** :0.545* :0.538***(0.105) (0.192) (0.124) (0.167) (0.278) (0.189)
Personal;loan;product 0.767*** 0.408** 1.025*** 0.246** :0.007 0.497***(0.110) (0.159) (0.164) (0.106) (0.171) (0.164)
Savings;product :0.188** :0.141 :0.188** :0.132 :0.070 :0.179(0.080) (0.165) (0.092) (0.096) (0.168) (0.119)
Term;deposit;product :0.617*** :0.574 :0.618*** :0.662*** :0.309 :0.796***(0.167) (0.352) (0.203) (0.235) (0.484) (0.294)
Transaction;product 1.603*** 2.235*** 1.312*** 1.402*** 2.034*** 1.074***(0.125) (0.269) (0.159) (0.222) (0.413) (0.282)
Home;insurance;policy 0.084 0.504 :0.012 :0.068 0.777 :0.233(0.154) (0.383) (0.162) (0.170) (0.668) (0.199)
Motor;insurance;policy 0.082 0.585 :0.045 0.027 0.744 :0.109(0.198) (0.492) (0.224) (0.202) (0.561) (0.235)
Constant 7.509*** 5.895 1.963** 3.739*** :2.343 1.345(0.711) (4.006) (0.914) (0.773) (3.835) (1.219)
Observations 15,942 7,864 8,010 6,314 3,231 3,083Customers All; Age≤28 Age>28 All; Age≤28 Age>28Pseudo;R2 0.0845 0.0916 0.0977 0.0551 0.0509 0.0948Pred(Y):;Non:Promotion:;Control 98.07% 98.32% 97.76% 93.40% 92.99% 93.38%Pred(Y):;Non:Promotion:;Treatment 98.50% 98.47% 98.53% 94.75% 93.66% 95.61%Pred(Y):;Promotion:;Control 90.50% 92.14% 88.99% 79.43% 84.98% 75.00%Pred(Y):;Promotion:;Treatment 90.67% 92.43% 89.23% 79.83% 87.54% 72.87%

27
The positive effect of tradeoff transparency on product retention was most acute for customers with
prior experience with the service category. Among these more experienced customers, nine months into
their service relationships, cancellation rates were 33.7% lower for those who had been randomly selected
to see the tradeoffs inherent in each service offering before they made their product choice. Finally, Column
(6) demonstrates an interaction, wherein the effect of the treatment on retention among more experienced
customers was negatively moderated after nine months for customers who were attracted by a promotion
("=-0.569, p<0.05). Similarly, the negative coefficients on the interaction terms reduce the positive and
significant effects of the treatment on retention to insignificance during the promotion period (#²s<0.53,
ps>0.469). These results are consistent with H8, in that they demonstrate how the positive effect of tradeoff
transparency on product retention can be diminished among customers attracted to an offering by a
promotion.
4. General discussion
Through a large-scale field experiment conducted with 389,611 customers of a nationwide retail bank, we
have investigated the impact of providing prospective customers with transparency into a service offering’s
tradeoffs on rates of acquisition, product choice, and subsequent long-term engagement. Our results suggest
that although providing prospective customers with this transparency has no net effect on overall rates of
acquisition, it can affect customers’ choices – causing them to select different offerings than they would in
the absence of transparency. Moreover, we find evidence that this transparency can lead to long-term
outcomes that are better for customers and firms alike. Customers who were provided transparency into the
tradeoffs of each service offering, and who chose to move forward by opening an account, exhibited higher
levels of engagement during their first nine months of service, and we find that the effects are strongest
among customers who have prior experience with the service category. Monthly spending was 9.9% higher,
and after nine months, cancellation rates were 20.5% lower, among all customers who received the
transparency treatment. For more experienced customers, monthly spending was 19.2% higher, and rates
of cancellation after nine months were 33.7% lower among those who received the transparency treatment.
Importantly, we find that increased engagement levels do not come at the expense of customers’ financial
wellbeing. During the initial six months of their relationships, customers who experienced transparency
into each offering’s tradeoffs were 10.8% less likely to make late payments on a monthly basis. These
results provide evidence that being more transparent with customers – not just about an offering’s strengths,
but also about its tradeoffs – can lead to better long-run outcomes for customers and firms alike. Finally,
we find that the effects of transparency on engagement and retention are attenuated in the presence of a
promotion. The results are consistent with the idea that customers who organically seek out an offering are
more likely to benefit from tradeoff transparency than those who are attracted or influenced by a promotion.

28
4.1 Managerial implications and opportunities for future research
Taken together, these results have important implications for managers, while also raising additional
questions that will serve as fruitful opportunities for future research.
4.1.1 Being more transparent with prospective customers may not harm acquisition rates. Although
research has shown how the revelation of unflattering information can harm demand, and conventional
wisdom has long suggested the fallacy of marketing an offering’s weaknesses, our results demonstrate that
voluntarily providing customers with transparency into an offering’s tradeoffs may not harm rates of
acquisition. These results are significant, because they suggest that the costs of being fully open with
prospective customers that many managers perceive (e.g., that prospective customers who are shown the
tradeoffs in an offering may seek service elsewhere) may be misplaced.
These results are consistent with prior research that has shown how the act of being voluntarily
transparent with information that customers perceive to be sensitive can engender higher levels of trust in
the firm and attraction to its offerings (Mohan et al. 2018). An opportunity for future research would be to
delve more deeply into the mechanisms that underlie these effects, exploring the conditions under which
transparency is more and less likely to engender trust, and how it affects the relationship with the firm more
holistically (e.g., does it affect peoples’ willingness to engage with other offerings). Likewise, future
research could explore whether the revelation of transparency is generally appealing, or if there are
individual differences among appetites for transparency, such that transparent organizations attract different
types of customers. Similarly, research on the psychology of choice has demonstrated how providing more
information that complicates a choice can lead a customer to opt out of choosing (Gourville and Soman
2005, Iyengar and Lepper 2000). Future research could investigate how tradeoffs could be most effectively
communicated to help customers make better-informed decisions as easily as possible.
4.1.2 Being transparent with customers may lead to better long-run outcomes for customers and firms.
Although the provision of transparency in our study had no effect on overall rates of customer acquisition,
we find that it caused customers to make different product choices than they would make in the absence of
transparency. Specifically, we observed that customers in different segments, who were given the same
tradeoff information, selected different credit cards. This pattern of results is consistent with the idea that
the revelation of information about a product’s tradeoffs can help shape their decisions. Furthermore, we
find that transparency improves customer engagement – both by increasing product usage and rates of
retention over the longer-term. Customers who were randomly-selected to experience transparency into
each offering’s tradeoffs, and who moved forward in opening an account, used their cards more intensively,
spending 9.9% more per month, and were 10.8% less likely to make late payments on a monthly basis.
Furthermore, customers who experienced transparency were 20.5% less likely to cancel their credit cards

29
during the first nine months of their relationships. To the extent that heightened engagement and retention
are behavioral indicators of a better customer experience, and a more profitable service relationship, these
results suggest that providing transparency to prospective customers may be mutually beneficial.
4.1.3 There may be a tradeoff between acquisition and retention-based strategies. Midway through
the experiment, our research partner launched a promotion in which they offered a financial incentive to
prospective customers who opened a credit card in the Low Rate family, and who spent $1,000 during the
first three months of their service relationships. From an acquisition perspective, the efficacy of this
promotional strategy is evident. Traffic to the credit card website increased, and the conversion rate of
browsers to buyers was enhanced, such that the number of new credit card accounts opened per day went
up by 47.3% during the promotion period. Furthermore, the probability a customer would open a promoted
credit card went up – during the promotion the probability of opening a low rate or low rate gold credit card
increased by 28.1% and 18.0%, respectively – highlighting the promotion’s capacity to increase sales and
influence customer choices. However, customers acquired during the promotion spent a third less on a
monthly basis, due in part to the fact that they were 3.8 times more likely to cancel their cards during the
initial months of their relationships than those who were not acquired through a promotion. These results
highlight a potential tradeoff for managers between marketing-based promotional strategies that are
optimized around increasing rates of customer acquisition, and operations-based transparency strategies
that are optimized around increasing customer compatibility and long-term engagement. Future research
could delve more deeply into this tradeoff – for example, by examining whether over a longer timeframe,
the gains in engagement and retention brought about by transparency might outweigh the improvement in
acquisition rates promotions can foster.
4.1.4 Transparency is especially effective for customers who have prior category experience.
Consistent with prior research, our results provide evidence that transparency may be particularly effective
for improving relationship quality and engagement among more experienced customers. In our experiment,
more experienced customers (operationalized as customers older than 28 years of age), who received the
transparency treatment, used the credit cards they chose more intensively, exhibiting cumulative spending
that was 19.2% higher after nine months, than those who did not experience transparency. They also were
33.7% less likely to cancel their credit cards during the first nine months of their relationship. These results
reveal the incredible promise of tradeoff transparency, for customers and companies alike, in helping
customers make more well-informed decisions. However, it’s interesting that less experienced customers
did not exhibit similar gains in subsequent engagement and retention. Less experienced customers (those
28 years of age and younger), who were treated with transparency, spent 3.3% more during a typical month,
and were 9.6% less likely to cancel their accounts after nine months – results that are statistically

30
indistinguishable from zero. These patterns highlight an opportunity to explore strategies for helping inform
less-experienced customers, who do not appear to benefit from tradeoff transparency as much as their more-
experienced counterparts.
4.1.5 Promotions may crowd-out the benefits of providing prospective customers with transparency.
Finally, our results suggest that the effects of providing prospective customers with transparency into an
offering’s tradeoffs may be attenuated by promotions, which themselves are designed to influence customer
choices. More experienced customers, in particular, who exhibited the greatest increases in product usage
and retention in response to transparency, also exhibited an interaction effect, wherein those gains were
mitigated, though not reversed, in the presence of a promotion. Importantly, in our experiment, the
promotion in question offered financial incentives for only one family of credit cards, which may have
created a conflict for some consumers between the card that offered a bonus and the card that best fit their
needs and preferences. Future research could more holistically disentangle whether promotions and
transparency are necessarily in conflict by treating every offering with the same promotion. Such a design
would afford a better understanding of the mechanisms that drive the crowding-out effect we observe –
whether it’s driven by the conflict between fit and financial incentives some customers may have
experienced, or whether it’s driven by promotions attracting customers who are less sensitive to the effects
of transparency. Owing to the demonstrated efficacy of promotions to attract new customers, and
transparency to foster decision making that boosts long-run engagement, innovations that achieve the best
of both worlds could enhance customer experiences while unlocking considerable value for firms.
4.2 Conclusion
Conventional wisdom and common practice dictate that service firms should emphasize the advantages
of their offerings and downplay the tradeoffs when marketing to prospective customers. We suggest that
taking a different approach – providing transparency into both an offering’s advantages and its tradeoffs,
in order to help customers make more well-informed decisions – can lead to better outcomes over the long
run for everyone involved. We hope that the present work will foster more research in this area, and
influence practice, in order to foster better customer experiences, and more engaging service relationships
among customers and the organizations that serve them.

31
References
Anderson, E.T. 1994. Cross-Category Variation in Customer Satisfaction and Retention . Mark. Lett. 5 19–30.
Anderson, E.T., D.I. Simester. 2004. Long-Run Effects of Promotion Depth on New Versus Established Customers: Three Field Studies. Mark. Sci.
Anderson, E.W., C. Fornell, D.R. Lehmann. 1994. Customer Satisfaction, Market Share, and Profitability: Findings from Sweden. J. Mark. 58 53–66.
Anderson, R.E., M.A. Jolson. 1980. Technical Wording in Advertising: Implications for Market Segmentation. J. Mark.
Blake, T., D. Coey, K. Sweeney, S. Tadelis. 2017. Price Salience and Product Choice, Working Paper. Buell, R.W., D. Campbell, F.X. Frei. 2018a. The customer may not always be right: Customer
compatibility and service performance (No. 16–091), Working Paper.
Buell, R.W., D. Campbell, F.X. Frei. 2016. How do customers respond to increased service quality competition? Manuf. Serv. Oper. Manag. 18.
Buell, R.W., D. Campbell, F.X. Frei. 2010. Are self-service customers satisfied or stuck? Prod. Oper. Manag. 12 679–697.
Buell, R.W., T. Kim, C.-J. Tsay. 2017. Creating reciprocal value through operational transparency. Manage. Sci. 63 1673–1695.
Buell, R.W., M.I. Norton. 2011. The labor illusion: How operational transparency increases perceived value. Manage. Sci. 57 1564–1579.
Buell, R.W., E. Porter, M.I. Norton. 2018b. Surfacing the submerged state: Operational transparency increases trust in and engagement with government. Working Paper.
Cabral, L.L., A. Hortacsu, A. Hortaçsu. 2010. The dynamics of seller reputation:Evidence from eBay. J. Ind. Econ. LVIII 54–78.
Cachon, G.P., P.T. Harker. 2002. Competition and outsourcing with scale economies. Manage. Sci. 48 1314–1333.
Chetty, R., A. Looney, K. Kroft. 2009. American Economic Association Salience and Taxation: Theory and Evidence. Am. Econ. Rev. 99 1145–1177.
Cohen, M.A., S. Whang. 1997. Competing in product and service: A product life-cycle model. Manage. Sci. 43 535–545.
Coyles, S., T. Gokey. 2005. Customer retention is not enough. J. Consum. Mark. 22 101–105. Derlega, V.J. 1984. Self-disclosure and intimate relationships, in: Communication, Intimacy, and Close
Relationships. p. 230.
Finkelstein, A. 2009. E-ZTAX: Tax salience and tax rates. Q. J. Econ. 124 969–1010. Frei, F.X. 2006. Breaking the trade-off between efficiency and service. Harv. Bus. Rev. 84 93–101.
Gabszewicz, J., J.-F. Thisse. 1979. Price competition, quality and income disparities. J. Econ. Theory 359 340–359.
Gans, N. 2002. Customer loyalty and supplier quality competition. Manage. Sci. 48 207. Gourville, J.T., D. Soman. 2005. Overchoice and Assortment Type: When and Why Variety Backfires.
Mark. Sci. 24 382–395.

32
Guajardo, J.A., M.A. Cohen. 2017. Service Differentiation and Operating Segments: A Framework and an Application to After-Sales Services. Manuf. Serv. Oper. Manag. Forthcoming 38.
Hall, J., E. Porteus. 2000. Customer service competition in capacitated systems. Manuf. Serv. Oper. Manag. 2 144.
Heskett, J., E. Sasser, L. Schlesinger. 1997. The Service Profit Chain. The Free Press, New York. Ho, T.-H., Y.S. Zheng. 2004. Setting customer expectation in service delivery: An integrated marketing-
operations perspective. Manage. Sci. 50 479–488.
Hoffman-Graff, M.A. 1977. Interviewer use of positive and negative self-disclosure and interviewer-subject sex pairing. J. Couns. Psychol. 24 184–190.
Israel, M. 2005. Services as experience goods : An empirical examination of consumer learning in automobile insurance. Am. Econ. Rev. 95 1444–1463.
Iyengar, S.S., M.R. Lepper. 2000. When choice is demotivating: Can one desire too much of a good thing? J. Pers. Soc. Psychol. 79 995–1006.
John, L.K., K. Barasz, M.I. Norton. 2016. Hiding personal information reveals the worst. Proc. Natl. Acad. Sci. 113 954–959.
Johnson, E.J., J.E. Russo. 1984. Product Familiarity and Learning New Information. J. Consum. Res.
Jones, T., E. Sasser. 1995. Why Satisfied Customers Defect. Harv. Bus. Rev. 73 88–99.
Jourard, S.M. 1971. Self-disclosure: An experimental analysis of the transparent self. John Wiley & Sons, Oxford, England.
Kalkanci, B., E. Ang, E. Plambeck. 2015. Measurement and Improvement of Social and Environmental Performance under Voluntary versus Mandatory Disclosure. Working Paper.
Karmarkar, U., R. Pitbladdo. 1995. Service Markets and Competition. J. Oper. Manag. 12 397–411. Karmarkar, U.S., R.C. Pitbladdo. 1997. Quality, class, and competition. Manage. Sci. 43 27–39.
Kivetz, R., I. Simonson. 2000. The Effects of Incomplete Information on Consumer Choice. J. Mark. Res. 37 427–448.
Krishnamurthi, L., S.P. Raj. 2006. The Effect of Advertising on Consumer Price Sensitivity. J. Mark. Res.
LaBarbera, P., D. Mazursky. 1983. A Longitudinal Assessment of Consumer Satisfaction / Dissatisfaction: The Dynamic Aspect of the Cognitive Process. J. Mark. Res. 20 393–404.
Laurenceau, J.P., L.F. Barrett, P.R. Pietromonaco. 1998. Intimacy as an Interpersonal Process: The Importance of Self-Disclosure, Partner Disclosure, and Perceived Partner Responsiveness in Interpersonal Exchanges. J. Pers. Soc. Psychol. 74 1238–1251.
Lewis, M. 2006. Customer Acquisition Promotions and Customer Asset Value. J. Mark. Res. 43 195-203. Li, L., Y.S. Lee. 1994. Pricing and delivery-time performance in a competitive environment. Manage. Sci.
40 633–646.
Luca, M. 2016. Reviews, Reputation, and Revenue: The Case of Yelp.com (No. 12–016), Working Paper. McDougall, G.H.G., T. Levesque. 2000. Customer satisfaction with services: Putting perceived value into
the equation. J. Serv. Mark. 14 392–410.
Mohan, B., R.W. Buell, L.K. John. 2018. Lifting the veil: The benefits of cost transparency (No. 15–017), Working Paper.
Moon, Y. 2000. Intimate Exchanges : Using Computers to Elicit Self-Disclosure from Consumers. J.
33
Consum. Res. 26 323–339. Oliver, R.L. 1993. Cognitive, affective, and attribute bases of the satisfaction response. J. Consum. Res.
20 418.
Parasuraman, A., V.A. Zeithaml, L.L. Berry. 1985. A conceptual model of service quality and its implications for future research. J. Mark. 49 41–50.
Perlman, D., B. Fehr. 1987. The development of intimate relationships, in: Intimate Relationships: Development, Dynamics, and Deterioration. pp. 13–42.
Reichheld, F., E. Sasser. 1990. Zero Defections: Quality Comes to Services. Harv. Bus. Rev. 68 105–111. Roels, G. 2014. Optimal Design of Coproductive Services: Interaction and Work Allocation. Manuf. Serv.
Oper. Manag. 16 578–594.
Sampson, S.E., C.M. Froehle. 2006. Foundations and Implications of a Proposed Unified Services Theory. Prod. Oper. Manag. 15 329–343.
Schmidt, W., R.W. Buell. 2017. Experimental Evidence of Pooling Outcomes Under Information Asymmetry. Manage. Sci. 63 1586–1605.
Shaked, A., J. Sutton. 1982. Relaxing price competition through product differentiation. Econ. Anal. 49 3–13.
Sutton, J. 1986. Vertical product differentiation: Some basic themes. Am. Econ. Rev. 76 393–398.
Tansik, D.A., R.B. Chase. 1983. The customer contact model for organization design. Manage. Sci. 29 1037–1050.
Tirole, J. 1990. The Theory of Industrial Organization, Fourth. ed. Massachusetts Institute of Technology.
Tsay, A.A., N. Agarwal. 2000. Channel dynamics under price and service competition. Manuf. Serv. Oper. Manag. 2 372–391.
Tse, D., P. Wilton. 1988. Models of consumer satisfaction formation: an extension. J. Mark. 25 204–212.
Wheeless, L.R., J. Grotz. 1977. The measurement of trust and its relationship to self disclosure. Hum. Commun. Res. 3 250–257.
Xue, M., P. Harker. 2002. Customer efficiency: Concept and its impact on e-business management. J. Serv. Res. JSR 4 253–268.
Yang, Z., R.T. Peterson. 2004. Customer Perceived Value, Satisfaction and Loyalty: The Role of Switching Costs. Psychol. Mark. 21 799–822.
Disclosure
Funding for this research, apart from the costs Commonwealth Bank of Australia internally incurred
to support the experiment, was provided by Harvard Business School. Ryan Buell has received
compensation from Commonwealth Bank of Australia in the past for executive education teaching.
Acknowledgements
We gratefully acknowledge and thank the Behavioural Economics team at Commonwealth Bank of
Australia for their partnership in designing and executing this field experiment, including Rafael Batista,
34
Nathan Damaj, Emily Daniels, Mohamed Khalil, Will Mailer, Jessica Min, and Nikhil Ravichandar. We
are also grateful to the many efforts of people throughout the organization whose time, consideration, and
care were essential to the project, including Elisa Barnard, Jenni Barnett, Grant Burrow, Ian Calbert, Keith
Callus, Tom Carr, Valentina Ciampi, Lauren Cox, Kate Crous, Amy Cunningham, Tina DeLorenzo,
Belinda Duff, Jennifer Excell, Zomi Frankcom, Beau Fraser, Ben Freeman, Sheffy Goyal, Ben Grauer,
Chris Hill, Nilesh Karunaratne, Emir Kazazic, Diane Loo, Lydia MacDonald, Rebecca Manly, Fiona Prater,
Katie Roch, David Singh, Mary Yang and Jade Young. We’re also grateful for the support and guidance of
Alain Bonacossa, Jean Cunningham, Chip Flowers, Robert Freeman, Catherine Nehring, and Christopher
Pringle, at Harvard University, who helped to make this research collaboration possible, as well as faculty
affiliates in the Harvard Sustainability Transparency and Accountability Research (STAR) Lab, including
John Beshears, Rebecca Henderson, Leslie John, David Laibson, Brigitte Madrian, Sendhil Mullainathan,
and Michael Norton, who supported this work in various ways. We are especially grateful to Michael
Hiscox, who directs the STAR Lab and brought us all together in the first place. Finally, we thank Sophie
Bick, Kim Jacobson, and Elizabeth Leh, for their support, and Melissa Ouellet, whose many contributions
were instrumental in our analysis. This research also benefited tremendously from seminar participants at
Cornell University and Harvard Business School, as well as participants in the Harvard Business School
TOM Unit Doctoral Seminar, the 2018 Winter Operations Conference, the 2018 MSOM Annual
Conference, the 2018 INFORMS Annual Conference, and the 2018 and 2019 POMS Annual Conferences,
whose constructive questions and suggestions influenced its development. All errors remain our own.

1 !
Online appendix for “Improving Customer Compatibility with Operational Transparency”
Figure A1: Acquisition funnel conversion percentages during the promotion and non-promotion periods for less experienced customers (28 years of age and younger). Marginal effects are from logistic regression models, estimated with robust standard errors clustered at the first website visit date level. *, **, and ***, signify significance at the 10%, 5%, and 1% levels respectively. The results indicate that, consistent with Figure 5, conversion rates are significantly higher during the promotion period. Moreover, although fewer customers start the application process in the treatment condition during the promotion period, the treatment ultimately had no effect on rates of customer acquisition, neither during the promotion nor the non-promotion periods, which is consistent with H1.
24.81%
20.57%
8.91%
6.69% 6.27% 5.72%
24.92%
20.54%
8.84%
6.54% 6.22%5.63%
27.72%
23.44%
12.26%
9.04% 8.64%7.97%
28.22%
23.67%
12.14%
9.12%8.67%
8.01%
0%
2%
4%
6%
8%
10%
12%
14%
16%
18%
20%
22%
24%
26%
28%
30%
Application6Started Soft6submission Submission Opened Activated Used
Percentage)of)prospective)custom
ers)(%)
Stage)of)acquistion)funnel
Treatment/6no6promotion Control6/6no6promotion
Treatment/6promotion Control/6promotion*

2 !
Figure A2: Acquisition funnel conversion percentages during the promotion and non-promotion periods for more experienced customers (over 28 years of age). Marginal effects are from logistic regression models, estimated with robust standard errors clustered at the first website visit date level. *, **, and ***, signify significance at the 10%, 5%, and 1% levels respectively. The results indicate that, consistent with Figure 5, conversion rates are significantly higher during the promotion period. Moreover, although fewer customers start the application process or soft submit their application in the treatment condition during the promotion period, the treatment ultimately had no effect on rates of customer acquisition, neither during the promotion nor the non-promotion periods, which is consistent with H1.
10.68%
8.31%
3.17%
2.34% 2.15% 1.95%
10.41%
8.05%
3.15%2.27% 2.14%
1.97%
13.22%
10.49%
4.98%
3.67% 3.49% 3.30%
13.50%
10.79%
5.07%
3.82% 3.66%3.42%
0%
2%
4%
6%
8%
10%
12%
14%
16%
Application6Started Soft6submission Submission Opened Activated Used
Percentage)of)prospective)custom
ers)(%)
Stage)of)acquistion)funnel
Treatment/6no6promotion Control6/6no6promotion
Treatment/6promotion Control/6promotion*
**
*
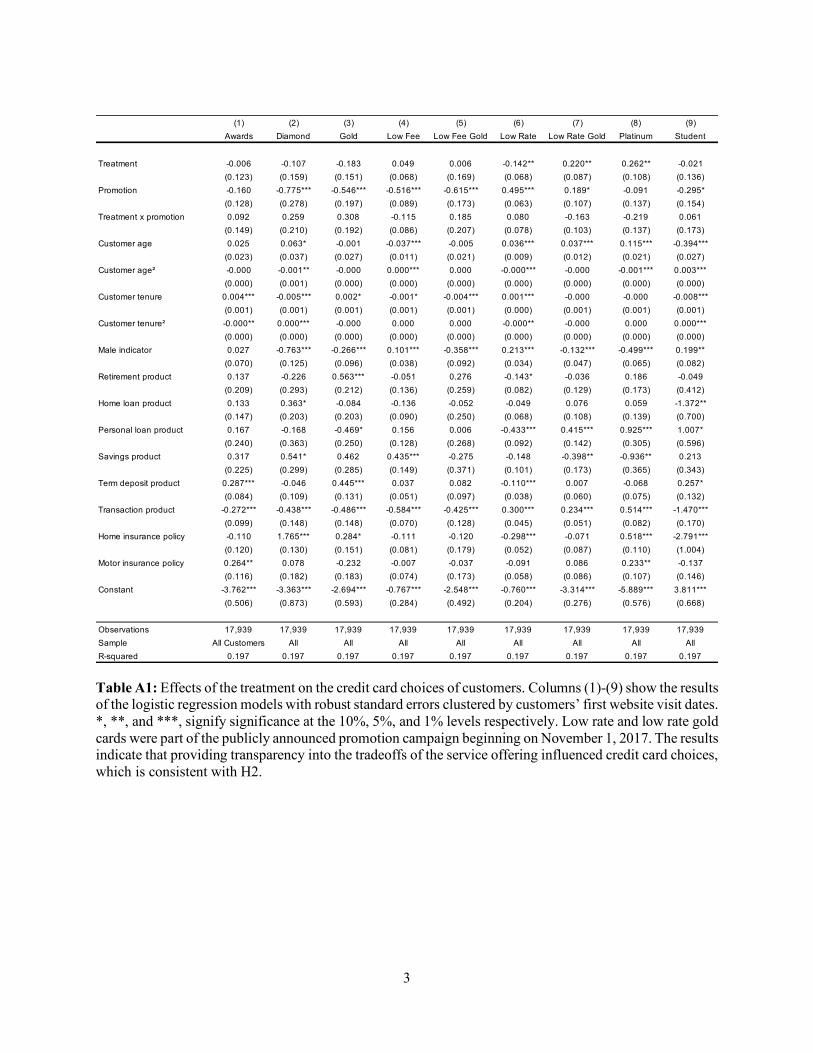
3 !
!
Table A1: Effects of the treatment on the credit card choices of customers. Columns (1)-(9) show the results of the logistic regression models with robust standard errors clustered by customers’ first website visit dates. *, **, and ***, signify significance at the 10%, 5%, and 1% levels respectively. Low rate and low rate gold cards were part of the publicly announced promotion campaign beginning on November 1, 2017. The results indicate that providing transparency into the tradeoffs of the service offering influenced credit card choices, which is consistent with H2.
(1) (2) (3) (4) (5) (6) (7) (8) (9)
Awards Diamond Gold Low:Fee Low:Fee:Gold Low:Rate Low:Rate:Gold Platinum Student
Treatment C0.006 C0.107 C0.183 0.049 0.006 C0.142** 0.220** 0.262** C0.021
(0.123) (0.159) (0.151) (0.068) (0.169) (0.068) (0.087) (0.108) (0.136)
Promotion C0.160 C0.775*** C0.546*** C0.516*** C0.615*** 0.495*** 0.189* C0.091 C0.295*
(0.128) (0.278) (0.197) (0.089) (0.173) (0.063) (0.107) (0.137) (0.154)
Treatment:x:promotion 0.092 0.259 0.308 C0.115 0.185 0.080 C0.163 C0.219 0.061
(0.149) (0.210) (0.192) (0.086) (0.207) (0.078) (0.103) (0.137) (0.173)
Customer:age 0.025 0.063* C0.001 C0.037*** C0.005 0.036*** 0.037*** 0.115*** C0.394***
(0.023) (0.037) (0.027) (0.011) (0.021) (0.009) (0.012) (0.021) (0.027)
Customer:age² C0.000 C0.001** C0.000 0.000*** 0.000 C0.000*** C0.000 C0.001*** 0.003***
(0.000) (0.001) (0.000) (0.000) (0.000) (0.000) (0.000) (0.000) (0.000)
Customer:tenure 0.004*** C0.005*** 0.002* C0.001* C0.004*** 0.001*** C0.000 C0.000 C0.008***
(0.001) (0.001) (0.001) (0.001) (0.001) (0.000) (0.001) (0.001) (0.001)
Customer:tenure² C0.000** 0.000*** C0.000 0.000 0.000 C0.000** C0.000 0.000 0.000***
(0.000) (0.000) (0.000) (0.000) (0.000) (0.000) (0.000) (0.000) (0.000)
Male:indicator 0.027 C0.763*** C0.266*** 0.101*** C0.358*** 0.213*** C0.132*** C0.499*** 0.199**
(0.070) (0.125) (0.096) (0.038) (0.092) (0.034) (0.047) (0.065) (0.082)
Retirement:product: 0.137 C0.226 0.563*** C0.051 0.276 C0.143* C0.036 0.186 C0.049
(0.209) (0.293) (0.212) (0.136) (0.259) (0.082) (0.129) (0.173) (0.412)
Home:loan:product 0.133 0.363* C0.084 C0.136 C0.052 C0.049 0.076 0.059 C1.372**
(0.147) (0.203) (0.203) (0.090) (0.250) (0.068) (0.108) (0.139) (0.700)
Personal:loan:product 0.167 C0.168 C0.469* 0.156 0.006 C0.433*** 0.415*** 0.925*** 1.007*
(0.240) (0.363) (0.250) (0.128) (0.268) (0.092) (0.142) (0.305) (0.596)
Savings:product 0.317 0.541* 0.462 0.435*** C0.275 C0.148 C0.398** C0.936** 0.213
(0.225) (0.299) (0.285) (0.149) (0.371) (0.101) (0.173) (0.365) (0.343)
Term:deposit:product 0.287*** C0.046 0.445*** 0.037 0.082 C0.110*** 0.007 C0.068 0.257*
(0.084) (0.109) (0.131) (0.051) (0.097) (0.038) (0.060) (0.075) (0.132)
Transaction:product C0.272*** C0.438*** C0.486*** C0.584*** C0.425*** 0.300*** 0.234*** 0.514*** C1.470***
(0.099) (0.148) (0.148) (0.070) (0.128) (0.045) (0.051) (0.082) (0.170)
Home:insurance:policy C0.110 1.765*** 0.284* C0.111 C0.120 C0.298*** C0.071 0.518*** C2.791***
(0.120) (0.130) (0.151) (0.081) (0.179) (0.052) (0.087) (0.110) (1.004)
Motor:insurance:policy 0.264** 0.078 C0.232 C0.007 C0.037 C0.091 0.086 0.233** C0.137
(0.116) (0.182) (0.183) (0.074) (0.173) (0.058) (0.086) (0.107) (0.146)
Constant C3.762*** C3.363*** C2.694*** C0.767*** C2.548*** C0.760*** C3.314*** C5.889*** 3.811***
(0.506) (0.873) (0.593) (0.284) (0.492) (0.204) (0.276) (0.576) (0.668)
Observations 17,939 17,939 17,939 17,939 17,939 17,939 17,939 17,939 17,939
Sample All:Customers All All All All All All All All
RCsquared 0.197 0.197 0.197 0.197 0.197 0.197 0.197 0.197 0.197

4 !
Table A2: Effects of the treatment on monthly spend with alternative age cutoff (24 years). Columns (1) – (3) show the results of panel data regression models for all customers as well as younger and older customers, with spend values for months after cancellation set to missing. Columns (4) – (6) show the same specifications with spend values for months after cancellation set to zero. All models include indicator variables for the week the credit card was activated, and are estimated with robust standard errors clustered by activation date. *, **, and *** signify significance at the 10%, 5%, and 1% levels respectively. Marginal effect estimates for monthly spending are provided for each condition. The results indicate that customers exposed to the treatment spent more on their cards, that these effects were stronger for more experienced customers, and that these effects were attenuated by the promotion, which is consistent with H3, H5, and H7.
(1) (2) (3) (4) (5) (6)Ln(Spend) Ln(Spend) Ln(Spend) Ln(Spend) Ln(Spend) Ln(Spend)
Treatment 0.080 70.008 0.128** 0.095* 0.007 0.149***(0.052) (0.138) (0.060) (0.054) (0.144) (0.057)
Promotion 70.104 0.209 70.251** 70.371*** 0.107 70.588***(0.103) (0.185) (0.118) (0.114) (0.172) (0.129)
Treatment>x>promotion 70.097 70.034 70.138* 70.109* 70.039 70.160**(0.061) (0.153) (0.071) (0.064) (0.158) (0.070)
Customer>age 0.072*** 0.556 0.050*** 0.046*** 0.646 0.042***(0.008) (0.408) (0.014) (0.009) (0.409) (0.014)
Customer>age² 70.001*** 70.012 70.001*** 70.001*** 70.014 70.000***(0.000) (0.010) (0.000) (0.000) (0.010) (0.000)
Customer>tenure 0.002*** 0.006*** 0.000 0.000 0.005*** 70.001**(0.000) (0.001) (0.001) (0.001) (0.001) (0.001)
Customer>tenure² 70.000 70.000*** 0.000 0.000 70.000** 0.000***(0.000) (0.000) (0.000) (0.000) (0.000) (0.000)
Male>indicator 0.050 0.069 0.031 0.072** 0.081 0.055(0.034) (0.058) (0.037) (0.034) (0.059) (0.039)
Retirement>product> 0.067 70.010 0.123 0.105* 70.003 0.182**(0.058) (0.095) (0.076) (0.058) (0.096) (0.077)
Home>loan>product 0.509*** 0.546** 0.516*** 0.349*** 0.209 0.370***(0.049) (0.219) (0.053) (0.062) (0.229) (0.063)
Personal>loan>product 70.324*** 70.365*** 70.308*** 70.209*** 70.369*** 70.151***(0.039) (0.082) (0.048) (0.043) (0.084) (0.052)
Savings>product 0.277*** 0.402*** 0.235*** 0.247*** 0.376*** 0.208***(0.040) (0.084) (0.043) (0.040) (0.080) (0.043)
Term>deposit>product 0.198* 0.558*** 0.100 70.023 0.503** 70.150(0.120) (0.196) (0.136) (0.133) (0.218) (0.151)
Transaction>product 0.496*** 0.105 0.527*** 1.043*** 0.990** 1.026***(0.105) (0.445) (0.111) (0.101) (0.455) (0.108)
Home>insurance>policy 70.038 0.158 70.044 70.044 0.332 70.070(0.076) (0.235) (0.080) (0.085) (0.235) (0.091)
Motor>insurance>policy 0.045 0.189 0.044 0.038 0.151 0.045(0.105) (0.239) (0.114) (0.108) (0.245) (0.117)
Constant 3.348*** 72.057 4.010*** 3.455*** 73.696 3.843***(0.212) (4.371) (0.304) (0.245) (4.311) (0.331)
Observations 121,679 36,540 85,139 126,658 37,478 89,180Customers 15,942 4,686 11,256 15,942 4,686 11,256Data>treatment>for>closed>accounts Missing Missing Missing Zero Zero> ZeroSample All Age≤24 Age>24 All> Age≤24 Age>24R7squared 0.0321 0.0463 0.0277 0.0271 0.0403 0.0292Pred(Y):>Non7Promotion:>Control $196.64 $132.62 $235.76 $192.67 $124.92 $235.17Pred(Y):>Non7Promotion:>Treatment $212.98 $131.62 $268.03 $211.79 $125.79 $272.87Pred(Y):>Promotion:>Control $177.20 $163.51 $183.48 $132.91 $139.02 $130.63Pred(Y):>Promotion:>Treatment $174.20 $156.93 $181.69 $130.99 $134.57 $129.23

5 !
Table A3: Effects of the treatment on customer retention rates with alternative age cutoff (24 years). Effects of the treatment on customer retention rates. Columns (1) – (3) and columns (4) – (6) show the results of cross-sectional data regression models of all, younger, and older customers for retention six and nine months after card activation, respectively. All models include indicator variables for the week the credit card was activated, and are estimated with robust standard errors clustered by activation date. *, **, and *** signify significance at the 10%, 5%, and 1% levels respectively. The results indicate that transparency can lead to increased customer retention, which is consistent with H4, that the effects are strongest for more experienced customers, which is consistent with H6, and that the effects are dampened during the promotion, which is consistent with H8. Marginal effect estimates for retention after six and nine months are provided for each experimental condition.
(1) (2) (3) (4) (5) (6)Pr(Retain6) Pr(Retain6) Pr(Retain6) Pr(Retain9) Pr(Retain9) Pr(Retain9)
Treatment 0.259 0.234 0.314 0.249** 0.247 0.274**(0.202) (0.389) (0.208) (0.115) (0.212) (0.131)
Promotion :1.736*** :1.321* :1.807*** :1.344*** :0.277 :1.658***(0.256) (0.758) (0.248) (0.231) (0.490) (0.237)
Treatment;x;promotion :0.239 :0.115 :0.313 :0.223 :0.033 :0.306(0.220) (0.426) (0.229) (0.165) (0.293) (0.186)
Customer;age :0.219*** 0.634 :0.072* :0.094** :0.573 :0.065(0.038) (0.975) (0.042) (0.041) (1.078) (0.053)
Customer;age² 0.003*** :0.018 0.001** 0.001*** 0.015 0.001*(0.001) (0.023) (0.001) (0.001) (0.026) (0.001)
Customer;tenure :0.009*** :0.011*** :0.009*** :0.005*** :0.007 :0.005***(0.001) (0.004) (0.001) (0.002) (0.005) (0.002)
Customer;tenure² 0.000*** 0.000* 0.000*** 0.000*** 0.000 0.000**(0.000) (0.000) (0.000) (0.000) (0.000) (0.000)
Male;indicator 0.046 0.042 0.049 0.078 0.288* 0.005(0.074) (0.157) (0.080) (0.091) (0.168) (0.123)
Retirement;product; 0.245 0.131 0.284* :0.107 :0.418 0.036(0.154) (0.322) (0.162) (0.155) (0.258) (0.194)
Home;loan;product :0.595*** :1.322*** :0.556*** :0.564*** :1.118** :0.534***(0.105) (0.334) (0.111) (0.167) (0.464) (0.175)
Personal;loan;product 0.767*** :0.005 0.968*** 0.246** :0.250 0.425***(0.110) (0.205) (0.142) (0.106) (0.236) (0.145)
Savings;product :0.188** :0.173 :0.163** :0.132 0.160 :0.194*(0.080) (0.231) (0.078) (0.096) (0.203) (0.103)
Term;deposit;product :0.617*** :0.122 :0.658*** :0.662*** :0.383 :0.657**(0.167) (0.621) (0.181) (0.235) (0.637) (0.265)
Transaction;product 1.603*** 2.696*** 1.468*** 1.402*** 1.976*** 1.344***(0.125) (0.494) (0.133) (0.222) (0.641) (0.254)
Home;insurance;policy 0.084 1.709* 0.012 :0.068 :0.206(0.154) (1.035) (0.162) (0.170) (0.179)
Motor;insurance;policy 0.082 0.103 0.087 0.027 0.504 0.058(0.198) (0.630) (0.209) (0.202) (0.932) (0.222)
Constant 7.509*** :2.371 4.791*** 3.739*** 7.499 3.145***(0.711) (10.550) (0.809) (0.773) (11.368) (1.068)
Observations 15,942 4,278 11,256 6,314 1,924 4,357Customers All; Age≤24 Age>24 All Age≤24 Age>24Pseudo;R2 0.0845 0.0666 0.0883 0.0551 0.0462 0.0760Pred(Y):;Non:Promotion:;Control 98.07% 98.19% 97.90% 98.07% 98.19% 97.90%Pred(Y):;Non:Promotion:;Treatment 98.50% 98.56% 98.45% 98.50% 98.56% 98.45%Pred(Y):;Promotion:;Control 90.50% 93.87% 89.07% 90.50% 93.87% 89.07%Pred(Y):;Promotion:;Treatment 90.67% 94.49% 89.08% 90.67% 94.49% 89.08%
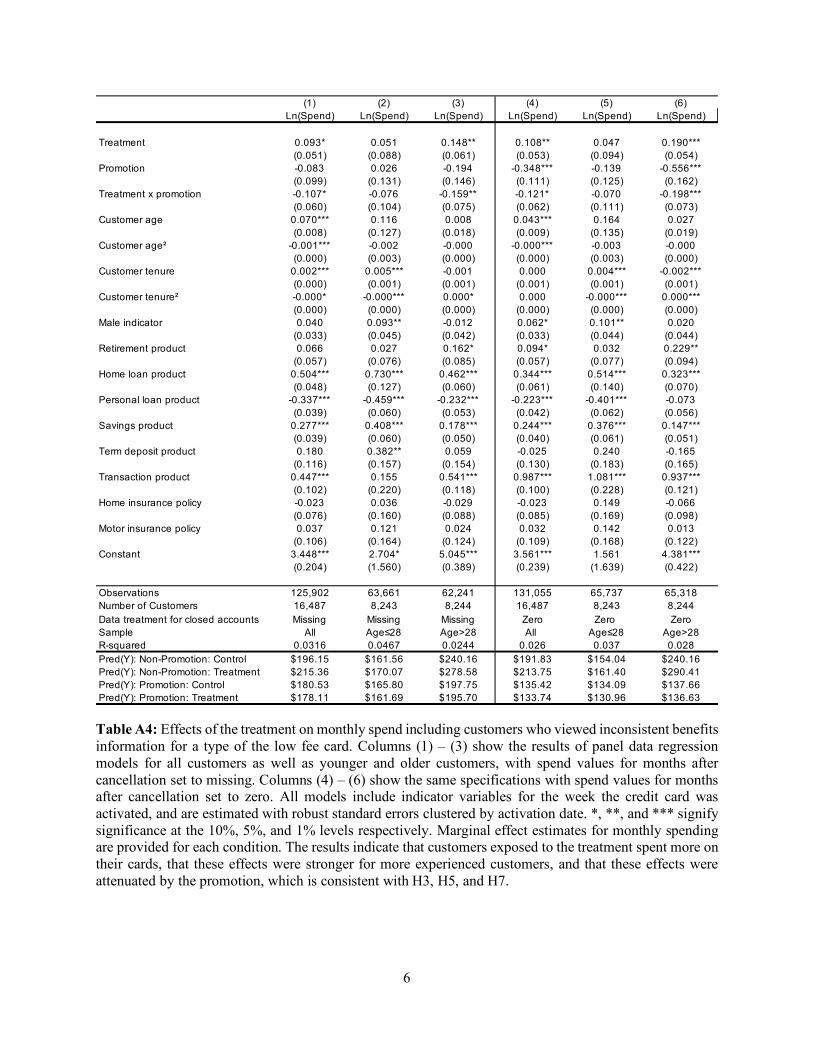
6 !
Table A4: Effects of the treatment on monthly spend including customers who viewed inconsistent benefits information for a type of the low fee card. Columns (1) – (3) show the results of panel data regression models for all customers as well as younger and older customers, with spend values for months after cancellation set to missing. Columns (4) – (6) show the same specifications with spend values for months after cancellation set to zero. All models include indicator variables for the week the credit card was activated, and are estimated with robust standard errors clustered by activation date. *, **, and *** signify significance at the 10%, 5%, and 1% levels respectively. Marginal effect estimates for monthly spending are provided for each condition. The results indicate that customers exposed to the treatment spent more on their cards, that these effects were stronger for more experienced customers, and that these effects were attenuated by the promotion, which is consistent with H3, H5, and H7.
(1) (2) (3) (4) (5) (6)Ln(Spend) Ln(Spend) Ln(Spend) Ln(Spend) Ln(Spend) Ln(Spend)
Treatment 0.093* 0.051 0.148** 0.108** 0.047 0.190***(0.051) (0.088) (0.061) (0.053) (0.094) (0.054)
Promotion =0.083 0.026 =0.194 =0.348*** =0.139 =0.556***(0.099) (0.131) (0.146) (0.111) (0.125) (0.162)
Treatment>x>promotion =0.107* =0.076 =0.159** =0.121* =0.070 =0.198***(0.060) (0.104) (0.075) (0.062) (0.111) (0.073)
Customer>age 0.070*** 0.116 0.008 0.043*** 0.164 0.027(0.008) (0.127) (0.018) (0.009) (0.135) (0.019)
Customer>age² =0.001*** =0.002 =0.000 =0.000*** =0.003 =0.000(0.000) (0.003) (0.000) (0.000) (0.003) (0.000)
Customer>tenure 0.002*** 0.005*** =0.001 0.000 0.004*** =0.002***(0.000) (0.001) (0.001) (0.001) (0.001) (0.001)
Customer>tenure² =0.000* =0.000*** 0.000* 0.000 =0.000*** 0.000***(0.000) (0.000) (0.000) (0.000) (0.000) (0.000)
Male>indicator 0.040 0.093** =0.012 0.062* 0.101** 0.020(0.033) (0.045) (0.042) (0.033) (0.044) (0.044)
Retirement>product> 0.066 0.027 0.162* 0.094* 0.032 0.229**(0.057) (0.076) (0.085) (0.057) (0.077) (0.094)
Home>loan>product 0.504*** 0.730*** 0.462*** 0.344*** 0.514*** 0.323***(0.048) (0.127) (0.060) (0.061) (0.140) (0.070)
Personal>loan>product =0.337*** =0.459*** =0.232*** =0.223*** =0.401*** =0.073(0.039) (0.060) (0.053) (0.042) (0.062) (0.056)
Savings>product 0.277*** 0.408*** 0.178*** 0.244*** 0.376*** 0.147***(0.039) (0.060) (0.050) (0.040) (0.061) (0.051)
Term>deposit>product 0.180 0.382** 0.059 =0.025 0.240 =0.165(0.116) (0.157) (0.154) (0.130) (0.183) (0.165)
Transaction>product 0.447*** 0.155 0.541*** 0.987*** 1.081*** 0.937***(0.102) (0.220) (0.118) (0.100) (0.228) (0.121)
Home>insurance>policy =0.023 0.036 =0.029 =0.023 0.149 =0.066(0.076) (0.160) (0.088) (0.085) (0.169) (0.098)
Motor>insurance>policy 0.037 0.121 0.024 0.032 0.142 0.013(0.106) (0.164) (0.124) (0.109) (0.168) (0.122)
Constant 3.448*** 2.704* 5.045*** 3.561*** 1.561 4.381***(0.204) (1.560) (0.389) (0.239) (1.639) (0.422)
Observations 125,902 63,661 62,241 131,055 65,737 65,318Number>of>Customers 16,487 8,243 8,244 16,487 8,243 8,244Data>treatment>for>closed>accounts Missing Missing Missing Zero Zero> ZeroSample All Age≤28 Age>28 All> Age≤28 Age>28R=squared 0.0316 0.0467 0.0244 0.026 0.037 0.028Pred(Y):>Non=Promotion:>Control $196.15 $161.56 $240.16 $191.83 $154.04 $240.16Pred(Y):>Non=Promotion:>Treatment $215.36 $170.07 $278.58 $213.75 $161.40 $290.41Pred(Y):>Promotion:>Control $180.53 $165.80 $197.75 $135.42 $134.09 $137.66Pred(Y):>Promotion:>Treatment $178.11 $161.69 $195.70 $133.74 $130.96 $136.63

7 !
Table A5: Effects of the treatment on customer retention rates including customers who viewed inconsistent benefits information for a type of the low fee card. Effects of the treatment on customer retention rates. Columns (1) – (3) and columns (4) – (6) show the results of cross-sectional data regression models of all, younger, and older customers for retention six and nine months after card activation, respectively. All models include indicator variables for the week the credit card was activated, and are estimated with robust standard errors clustered by activation date. *, **, and *** signify significance at the 10%, 5%, and 1% levels respectively. The results indicate that transparency can lead to increased customer retention, which is consistent with H4, that the effects are strongest for more experienced customers, which is consistent with H6, and that the effects are dampened during the promotion, which is consistent with H8. Marginal effect estimates for retention after six and nine months are provided for each experimental condition.
(1) (2) (3) (4) (5) (6)Pr(Retain6) Pr(Retain6) Pr(Retain6) Pr(Retain9) Pr(Retain9) Pr(Retain9)
Treatment 0.281 0.084 0.508** 0.234** 0.074 0.462***(0.190) (0.333) (0.215) (0.110) (0.180) (0.161)
Promotion :1.777*** :1.718*** :1.791*** :1.313*** :0.902** :1.566***(0.254) (0.628) (0.265) (0.231) (0.421) (0.318)
Treatment;x;promotion :0.269 :0.067 :0.483** :0.227 0.102 :0.577**(0.208) (0.356) (0.242) (0.158) (0.245) (0.226)
Customer;age :0.221*** :0.094 0.065 :0.100** 0.328 0.019(0.036) (0.328) (0.044) (0.040) (0.315) (0.056)
Customer;age² 0.003*** :0.001 :0.000 0.001*** :0.008 0.000(0.001) (0.007) (0.001) (0.001) (0.007) (0.001)
Customer;tenure :0.008*** :0.010*** :0.009*** :0.005*** :0.007** :0.006***(0.001) (0.002) (0.001) (0.002) (0.003) (0.002)
Customer;tenure² 0.000*** 0.000*** 0.000*** 0.000*** 0.000* 0.000***(0.000) (0.000) (0.000) (0.000) (0.000) (0.000)
Male;indicator 0.048 0.028 0.059 0.075 0.040 0.111(0.072) (0.109) (0.094) (0.089) (0.099) (0.136)
Retirement;product; 0.178 0.101 0.270 :0.106 :0.209 :0.027(0.141) (0.215) (0.208) (0.151) (0.178) (0.223)
Home;loan;product :0.617*** :0.754*** :0.575*** :0.550*** :0.439 :0.558***(0.106) (0.189) (0.125) (0.170) (0.281) (0.193)
Personal;loan;product 0.758*** 0.389** 1.022*** 0.249** 0.001 0.493***(0.109) (0.159) (0.162) (0.111) (0.166) (0.164)
Savings;product :0.201** :0.114 :0.221** :0.139 :0.078 :0.182(0.081) (0.167) (0.091) (0.095) (0.166) (0.117)
Term;deposit;product :0.569*** :0.547 :0.565*** :0.619*** :0.221 :0.776***(0.166) (0.358) (0.201) (0.236) (0.488) (0.288)
Transaction;product 1.581*** 2.239*** 1.284*** 1.326*** 1.852*** 1.034***(0.125) (0.261) (0.161) (0.224) (0.432) (0.283)
Home;insurance;policy 0.106 0.527 0.017 :0.046 0.736 :0.186(0.151) (0.380) (0.159) (0.173) (0.662) (0.204)
Motor;insurance;policy 0.101 0.597 :0.029 0.031 0.738 :0.120(0.194) (0.494) (0.221) (0.196) (0.559) (0.231)
Constant 7.519*** 6.340 1.907** 3.945*** :0.468 1.241(0.683) (4.068) (0.893) (0.775) (3.809) (1.229)
Observations 16,487 8,173 8,244 6,565 3,373 3,192Sample All Age≤28 Age>28 All Age≤28 Age>28Pseudo;R2 0.0823 0.0884 0.0965 0.0528 0.0461 0.0947Pred(Y):;Non:Promotion:;Control 98.11% 98.38% 97.75% 93.34% 93.11% 93.17%Pred(Y):;Non:Promotion:;Treatment 98.56% 98.50% 98.62% 94.64% 93.56% 95.53%Pred(Y):;Promotion:;Control 90.33% 92.22% 88.66% 79.73% 84.93% 75.75%Pred(Y):;Promotion:;Treatment 90.43% 92.34% 88.89% 79.84% 86.98% 73.78%