Improvement of District Heating in Kosovo - World...
136
Improvement of District Heating in Kosovo Final report Finanzielle Zusammenarbeit mit dem Kosovo Projekt: Verbesserung von Fernwärmesystemen Projekt-Nr. 26492/KfW Auftrag-Nr. 46743/KfW February 19, 2009 Energy & Utility Consulting Dr. Bernd Kalkum Muehltalstr. 82 69121 Heidelberg Germany
Transcript of Improvement of District Heating in Kosovo - World...

Improvement of District Heating in Kosovo Final report Finanzielle Zusammenarbeit mit dem Kosovo Projekt: Verbesserung von Fernwärmesystemen Projekt-Nr. 26492/KfW Auftrag-Nr. 46743/KfW
February 19, 2009
Energy & Utility Consulting
Dr. Bernd Kalkum
Muehltalstr. 82 69121 Heidelberg
Germany

Improvement of district Heating in Kosovo 2
TABLE OF CONTENT1.1 Technical assessment 6 1.2 Financial assessment 6 1.3 Institutional assessment 7 1.4 Assessment of the current heat demand and heat demand development 8 1.5 Combined heat and power 9 1.6 Investment programs 10 1.7 Financial forecast 12 1.8 Subsidies and social assistance programs 13 1.9 Recommended liabilities of the DH Companies 13 1.10 Technical assistance 14 3.1 Technical assessment 17
3.1.1 Customer Interface 17 3.1.2 Networks 18 3.1.3 Boilers 20 3.1.4 Human Resources 21 3.1.5 Internal organization 21
3.2 Financial assessment 23 3.2.1 Pristina 23 3.2.2 Gjakova 25 3.2.3 Mitrovica (North) 26
3.3 Institutional and legal assessment 27 3.3.1 Law on Public Enterprises 28 3.3.2 Law on Central Heating 28 3.3.3 Supply contracts 29 3.3.4 Ownership issues 30 3.3.5 Tariff calculation 31 3.3.6 Subsidies 35
4.1 Pristina 39 4.1.1 Peak Load Estimate 39 4.1.2 Impact of Disconnections 39 4.1.3 Degree-day Adjustment 39 4.1.4 Other Adjustments 39 4.1.5 Energy Balance 39
4.2 Gjakova 41 4.2.1 Peak Load Estimate 41 4.2.2 Impact of Disconnections 41 4.2.3 Degree-day Adjustment 41 4.2.4 Other Adjustments 41 4.2.5 Energy Balance 41
4.3 Mitrovica 42 4.3.1 Peak Load Estimate 42 4.3.2 Impact of Disconnections 42 4.3.3 Degree-day Adjustment 43 4.3.4 Other Adjustments 43 4.3.5 Energy Balance 43
5.1 Pristina 45 5.1.1 Reconnections and new connections 45 5.1.2 Demand forecast with business as usual 47 5.1.3 Demand forecast with consumption based billing (DSM) 48
5.2 Gjakova 48 5.2.1 Disconnections 48 5.2.2 Expansions 49 5.2.3 Demand forecast with business as usual 49 5.2.4 Demand forecast with consumption based billing (DSM) 49
5.3 Mitrovica North 50 5.3.1 Disconnections 50 5.3.2 Opportunities for DH Expansions in the North 50 5.3.3 Expansion in the south 51
5.4 Mitrovica South 51

Improvement of district Heating in Kosovo 3
7.1 Longer-term strategy for the development of the heating system 55 7.1.1 Converting supply driven DH systems to demand driven ones 55 7.1.2 Load dispatch 56 7.1.3 Reserve Capacity 57 7.1.4 Designing and sizing of the heat network 58 7.1.5 Addressing water losses and quality 58 7.1.6 Preventive maintenance 58 7.1.7 Combined and separate heat and power production 59 7.1.8 DH Strategy 65
7.2 Priority investment program 67 7.2.1 Prices of investment goods 67 7.2.2 Input prices 67 7.2.3 Benefits 67 7.2.4 Phasing the investment program 68 7.2.5 Pristina 69 7.2.6 Gjakova 76 7.2.7 Mitrovica – North 81 7.2.8 Mitrovica – South 84 7.2.9 Summary of investment programs 87
8.1 Model description and assumptions 89 8.1.1 Physical Inputs 89 8.1.2 Development of input prices and costs 90 8.1.3 Benefits 92 8.1.4 Heat tariffs 92 8.1.5 Financial data 92 8.1.6 Service lifetime and depreciation rates 93 8.1.7 Financing 93
8.2 Risks 94 8.2.1 Fuel prices 94 8.2.2 Collection rates 94 8.2.3 New connections 94
8.3 Results 94 8.3.1 Pristina 94 8.3.2 Gjakova 96 8.3.3 Mitrovica North 98 8.3.4 Mitrovica South 98 8.3.5 Affordability 98 8.3.6 CO2 emissions 100
9.1 Project Management Capacities 102 9.2 Regulation 102 9.3 Organizational requirements 103 9.4 Institutional requirements 103 10.1 Technical assistance for installation works 105 10.2 Technical assistance for maintenance and operation 105 10.3 Technical assistance for managing a DH Company 105 10.4 Technical Assistance for secondary legislation and ERO 106 10.5 Organization of technical training 106 11.1 Annex – Cost-benefit analysis Pristina 107 11.2 Annex – Cost-benefit analysis Gjakova 111 11.3 Annex – Cost-benefit analysis Mitrovica North 115 11.4 Annex – Cost-benefit analysis Mitrovica South 116 11.5 Annex - Calculation of CO2 emissions 118 11.6 Annex – Financial effects of accelerated investment in pipe replacement 121 11.7 Annex - Financial Statement TERMOKOS 2008 123 11.8 Annex – Financial Statement DH Company Gjakova 125 11.9 Financial Statement STANDARD Company Mitrovica 127 11.10 Annex – Performance indicators 129 11.11 Average costs 132 11.12 Cash flow 133

Improvement of district Heating in Kosovo 4 Explanations - All tables contain numbers from 2008 if not indicated differently.
- Network length means the length of the network (double pipes, i.e., supply and return pipes), if not indicated differently.
- Two part tariff means a price that is composed by two components. In the context of this reports it is composed by an energy charge (€/kWh) and capacity charge (€/kW).

Abbreviations CEO Chief executive Officer
CHP Combined heat and power (cogeneration)
DH District heating
DHC District heating company
DSM Demand Side Measures
ERO Energy Regulatory Office
EPS Serbian Electricity Company
HOB Heat-only boiler
KEK Electric Power Company of Kosovo
MW(el) Megawatt electric
MW(the) Megawatt thermal
n.a. Not available
POE Public owned enterprise
SHP Separate heat and power
RSD Serbian Dinar (For conversion an exchange rate of 89 Dinar per € has been applied
TPP Thermal power plant
Definitions
Collection rate The collection arte is the collected bill amount in a year divided by the issued bills in the same year. Collected bill amount comprises also payments that are due for bills issued in former years.
The tables with financial indicators use a second definition of collection rate, which takes only the collected bill amount into account that refers to bills issued in the same year.
Current ratio Current ratio: current assets by current liabilities
Expenditures Expenditures comprises all costs in compliance with profit and loss statement
This study was conducted in the period May 2009 - Sept. 2009 and has been done by an independent consultant based on his own professional judgment. The Consultant does not act in the name of KfW. The report is based on information that was available by the end of August 2009. Only newer information about charging for electricity in Mitrovica North has been added in the executive summery.

Improvement of district Heating in Kosovo 6
1 Executive summary
1.1 Technical assessment (1) The main problems of the DH systems in the three cities are (i) the high
dependency on imported and expensive fossil fuel, (ii) higher water losses leading to fast corrosion of the system components, (ii) frequent damages, and (iv) high staff numbers.
(2) The three DH Companies use almost exclusively mazut, typically of bad quality. In the near future, price hikes of fossil fuels have to be taken into account, which directly affect the heating costs in the cities.
(3) High water losses are suffered by all three DHC, which is an indication that the water quality may not be always of the required quality. Low quality water is causing corrosion of pipes and armatures and is blocking of heat exchangers.
(4) Frequent damages in the networks are an indication of both poor water quality and old pipes. With a good quality of water, pipelines could stand longer than the designed lifetime.
(5) High staff numbers in the new situation to come, where substations and boilers start to be automated and remote monitored, and the office operations be computerized.
(6) Mainly ad-hoc based maintenance practices have resulted in repairing damages in networks, substations and boilers after the damages have occurred, and often with delays. The delayed repairs have caused both direct and indirect costs being higher than if having had done on preventive basis. Modern preventive maintenance practices would be based on a database, often a computerized but a manual database can be workable as well, and on systematic planning of measures and monitoring of maintenance.
(7) In all three cities, comprehensive investment programs for the rehabilitation and modernization have been already implemented. Large parts of the boilers, networks, and substations have already been replaced. Nevertheless, they still need further investments to develop a sustainable DH service.
(8) The systems are still supply driven. To address the above-mentioned problems, they have to be converted to demand driven systems, where final consumers have the opportunity to control and regulate their individual heat demand. This will provide higher comfort for consumers and save energy and costs. Such systems are common in EU including now the new EU member states.
1.2 Financial assessment (9) The main financial problem is collection rates. All three DH Companies have big
collection problems, particularly with residential customers. Accordingly, they are also suffering from big amounts of bad debts.
(10) Low household incomes are alleged to be the main reason for the low collection rates. There is no doubt, that a certain (but unknown) percentage of the consumers has serious affordability problems and can hardly pay for heating services. On the other hand, it is well known that a significant fraction of consumers can afford, but does not pay for different reasons.

Improvement of district Heating in Kosovo 7
(11) For the average household, DH costs are relatively low (approx. 7.5% while it is typically assumed to be approx. 15%) and in average the expenditures for DH are lower than the costs for communication, alcohol and cigarettes. The main difference is, that communication and supply of alcohol and cigarettes will immediately discontinue if bills are not paid. This is difficult to practice in case of DH, but a consequent collection policy would allow much higher collection rates.999
(12) As tariffs are not cost covering, general subsidies are needed. The regulatory office justifies this by socio-economic reasons. Nevertheless, despite high subsidies DH Companies generate losses.
1.3 Institutional assessment (13) The ownership of DH Companies of Pristina and Gjakova has been
transferred to the local municipalities in 2009. The relationship between both parties is regulated by the Law “on Public Owned Enterprises”. A board of directors supervises the companies. According to the Law on Public Owned Enterprises, the board has to be composed by 5 members, which have to be selected by rules prescribed in the law and who have to comply with certain qualifications. The law does not request that any member should come from a specific public entity (such as Government).
(14) The Law on Public Owned Enterprises stipulates, amongst other issues, the rules and procedures for the establishment of a board of the DH Companies. The board has to be composed by 5 members for a term of three years.
(15) The Law on Central Heating came into force in Nov. 2008. The Law aims at setting conditions for the developing a sustainable and competitive heat market, for a safe, reliable, and efficient heat supply, and to ensure a certain quality of heat supply services, and billing and collecting (including disconnections). 9Moreover, it opens the heat market for independent heat producers and sets some basic rules for the use of waste heat and renewable energies.
(16) The Law is an umbrella law, which has to be supplemented by secondary legislations and codes to be drafted by the DH Company.
(17) ERO is the regulator for DH tariffs. The agency has developed a sound methodology for calculating two-part tariffs both for metered and non-metered consumers. The two-part tariff consists of an energy charge and a capacity charge.
(18) The so-called allowed revenues constitute the basis for tariff calculation. Allowed tariffs consists of allowed operational costs, depreciation, and profit on the Regulated Asset base. All three elements are assessed and approved by ERO- In addition a “Reconciliation value” will be determined that may increase or reduce the allowed revenues. This reconciliation value reflects the unforeseen cost increases or decreases of the foregone heating period.
(19) According to this methodology, DH tariffs should cover all justified costs excluding mainly bad debts and interest payments. A rate of return of currently 11.6% has been approved to be applied to the regulatory assets, which are all fixed assets needed for operation.
(20) However, the rate of return may hardly offset the losses stemming from bad debts. Fortunately, bad debts have been considerably reduced recently in Pristina and Gjakova, but are still tangible.

Improvement of district Heating in Kosovo 8
(21) To cushion the effect of increasing energy prices, the Central Government has provided fuel subsidies covering up to 70% in the last years. Such subsidies reduce the “allowed revenues” that constitute the basis for tariff calculation.
(22) A requirement to install meters and using them for billing is included in the licenses. However, given the tough financial situation of the companies, so far ERO has not yet issued a deadline for the installation of the meters. Nevertheless, the need for this installation was communicated to the regulated companies in several meetings and occasions. There is also a provision in the Law on District Heating, which obliges the companies to install meters. Article 32 of the Law on District Heating obliges the distributor to install meters on all customers connected to the district heating system within one year from the approval of the law.
(23) Metering at the building level the consumption and applying consumption based billing is prescribed by ERO to be implemented latest in 2011, but DH Companies will likely not achieve the deadline. The Law on Central Heating even requires the installation of meters at customer facilities latest one year after the Law came into force, i.e., by Nov. 2009. However, in face of the difficult financial situation of the DH Companies, ERO did so far not insist.
(24) The alleged reasons are lacking funds for meters, but it also seems that meters used not to be the most urgent priority of DH Companies. Provision of technical assistance for metering and corresponding billing methods is recommended for all three cities.
(25) It is a common practice that heat supply is metered at the building entrance. There are different approaches how to distribute the heating costs among the various parties in one building. In Western Europe, it is typically the responsibility of the condominium association. In countries where condominium or housing associations are weak or missing at all, the individual apartments are billed by the DH Company. Such approach could be a transitional solution for Kosovo, until robust housing associations have been created.
(26) CHP is a realistic option for Pristina, but so far, ERO did not issue regulations for pricing heat and electricity generated in CHP. Such regulation is urgently needed. To foster DH as requested by the Energy Strategy, (most) benefits of CHP should be allocated to heat. In this way, the tariffs for DH could be kept low and electric heating would be discouraged.
(27) Compares with other countries in Central and Eastern Europe, the DH Regulation is clear and transparent. Cost can be recovered. Cost-underabsorption in one year will be compensated by correspondingly increased allowed revenues. Replacing the current cost-plus regulation by an incentive regulation such as price cap would create incentives for the DH Companies to improve the efficiency and performance. However, even more important in the short term is a regulation for cost-allocation in CHP and feed-in tariffs.
1.4 Assessment of the current heat demand and heat demand development (28) All cities are affected by disconnections. There are only few disconnections
in Pristina, but more in the other two cities. In Mitrovica, all residential and commercial customers are disconnected.
(29) Reconnecting these customers is a challenge for all DH Companies, which will, amongst others, require the consequent implementation of consumption based billing. A two-part tariff system has already been developed by the

Improvement of district Heating in Kosovo 9
regulatory agency ERO and for all DH Companies such tariffs have been calculated and published. However, DH Companies are lagging behind with the installation of meters and implementation of consumption based billing.
(30) The situation in the northern part of Mitrovica is even more difficult, as electricity consumption is actually not charged by the Electricity Companies KEK and EPS. Only if the regular tariff will be charged, customers could become interested to reconnect to DH. According to updated information provided by STANDARD Company in Dec. 2009, EPS. According to latest information from Mitrovica, EPS will start charging consumers in Dec. 2009. Actual results will, however, also depend on collection practices.
(31) Consumption based billing in combination with automated substations, thermostatic valves and heat cost allocators results typically in energy savings of 20-30%. In view of the request of the regulatory to implement consumption based billing in the near future, savings of about 20% has been used for the demand forecast.
(32) Particularly in Gjakova and Pristina, many new buildings are under construction or have already received construction permits and are asking to be connected to DH. This requires larger investments in pipes and substations by the DH companies. Due to existing overcapacities, heat generation facilities will be sufficient for while, but after the project period (2010-2012) new capacities could eventually be required.
(33) The probability that the new buildings will be connected to DH is high due to lacking cost-effective alternative heating options. Electric heating, which is still used by many households, became more and more expensive, but connection to DH is hampered by high costs for installing the necessary indoor heating facilities (piping and radiators).
(34) Accordingly, the heat demand forecast shows a significant increase despite the effects of consumption-based billing and autonomous energy efficiency measures implemented by consumers. A heat demand forecast for the Southern part of Mitrovica has not been prepared, as there is actually no DH. DH could become an option, but requires a more detailed analysis.
1.5 Combined heat and power (35) CHP offers the unique opportunity to replace imported fuel (mazut) by
locally available fuel (lignite) and to save energy and reduce CO2 emissions at the same time. These advantages have to be paid with a small reduction of electricity generation. The amount of this reduction depends to a high extent on the design of steam (heat) extraction from the turbines.
(36) Using the existing TPP located in the vicinity of Pristine, is a feasible option for applying cogeneration. The distances between the existing TPPs Kosovo A and Kosovo B from the city of Pristine is about 10 km and the construction of a transmission line is technically feasible.
(37) Converting one block of TPP Kosovo B to cogeneration would be the most suitable option for cogeneration. TPP Kosovo A is closer to the city, but its future is uncertain. Moreover, it is unlikely that a future TPP Kosovo C could start operation within the coming 6-8 years. TPP Kosovo B is a reliably operating TPP, crucial for the stability of energy system of Kosovo, and could continue to be operated for a significant period.

Improvement of district Heating in Kosovo 10
(38) Converting one block of existing TPP Kosovo B into a cogeneration unit would ensure heating of the city of Pristine based on relatively inexpensive domestic lignite, and release TERMOKOS (and Kosovo) of the need to import expensive heavy fuel oil that is currently used for district heating of Pristine. The conversion to CHP will reduce electricity generation of the respective turbines by a few percent points, but this effect will be compensated by the conversion of electricity heating to district heating
(39) The capacity of cogeneration should not be larger than 50% of the maximum heat load, which is currently about 90 MW. This capacity should cover approx. 90% of the annual heat consumption. While the CHP plant would supply the base load, TERMOKOS would add heat produced by own heavy oil based boiler capacities.
(40) The cogeneration concept should be based on steam extraction from one block of TPP Kosovo B, construction of a heating station (heat exchangers and pumps), and a transmission pipeline consisting of two DN 350-450 preinsulated pipes. Despite the long distance, heat losses in preinsulated pipes would be low.
(41) Former studies proposed that steam would be extracted from the main steam pipeline located between the medium and low-pressure sections of the turbine. This solution is technically simple, but would result in relative high electricity losses. Alternatively, the turbine could be modified. Two extraction points would be added (by reconstruction of diaphragms), and steam should be extracted with temperatures of maximum 135 °C (or less). Such a solution would reduce electricity losses considerably.
(42) The optional size and design of the CHP facilities depend to a large extend on the heat demand and due to economies of scale, heat produced in TPP Kosovo B will be the cheaper the larger the heat demand. It is therefore recommended to perform a market analysis for district heating. This analysis should address the development of heat demand of existing buildings connected to DH, existing buildings not yet connected to DH, and new buildings particularly in new construction areas.
1.6 Investment programs (43) According to the Terms of Reference, the project will be implemented in two
phases. Phase 1 for the measures will be implemented in the short term after the pre-feasibility study has been completed. Phase 2 for the remaining funds will be implemented after a feasibility study to be financed from EU TA IPF has been realized.
(44) Separating the investment programs into two phases would be reasonable for:
- Pristina: A feasibility study has to be performed regarding the feasibility and viability of converting the thermal power plant Kosovo B to a CHP plant. Based on this study a recommendation can be given whether and to what extend to allocate the EU-KfW means to support the CHP plan or to invest more money into heat-only boilers as well as DH system expansion.
- Mitrovica South: a feasibility study has to be performed to analyze the options for a completely new DH system in the Southern part of the city.
(45) The investment program for Pristina for phase 1 consists of two main components, i.e., the rehabilitation of the existing system and the expansion to

Improvement of district Heating in Kosovo 11
new areas which are mostly under construction and which are expected to be connected within the period 2010-2012. There is also a need for rehabilitating existing boilers and for new boilers. These investments are mentioned, but have been allocated to phase 2.
(46) The viability of investing in the system expansion depends to a high degree of the actual construction activities and requests for connections. This should regularly be reviewed to update the investment plan if necessary.
(47) There are two alternative investment programs for phase 2. Option 1 is the connection to Kosovo B and conversion of the plant to a CHP plant. This could also be combined with DH expansion in Pristina. Option 2 would focus on heat-only boilers and DH expansion.
(48) In Gjakova, most of the money would go to rehabilitation and modernization measures. These are uncritical investments if the collection rate can be improved, particularly through consumption-based billing. About 40% of the proposed investment costs are caused by DH system expansion. Such measures should only be financed under the condition that consumption based metering will be mandatory for new buildings. Moreover, the additional customer base has to be reviewed before any procurement activities are undertaken. The projected new connections might be too optimistic and adjusting investment needs could avoid unnecessary investments.
(49) The situation in Mitrovica North is particularly complicated, because electricity, used not to be charged, bills will be consequently collected, and all residential and most commercial consumers are disconnected. Even if consumers will be charged with the regular tariff, competition with cost covering DH tariffs would be hard due to the high costs of DH. Subsidies will likely be needed for a couple of years. A pilot project for reconnecting the buildings should be implemented, if at least the regular tariff is charged. This would allow testing the willingness of consumers to reconnect.
(50) The DHC has sufficient heat generation capacity, sufficient to supply the reconnected consumers. The distribution network does currently not cause larger problems as the pressure is low due to low heat demand. With a growing heat demand, however, some main pipes need to be replaced.
(51) Mitrovica South is not served by district heating so far. A few buildings are physically connected to a pipe crossing the bridge to the Northern part of the city, but heat is not supplied. The DH Company, located in the Northern Part of the City, has larger overcapacities, which could be used to supply the south. The mayor agrees to be supplied from the North. However, the administration in the south has only some vague ideas about installing a DH system. A potential service area has been identified by the City Development Department, but potential consumers have not yet been informed, and the willingness to connect to DH is unknown.
(52) To initiate and foster the project, the city administration should:
- Establish a DH department or enterprise, which should contact the potential customers and sign preliminary agreements.
- If a reasonable number (at least 2/3 of the envisaged customers) of preliminary agreements have been collected, a feasibility and design study for the planned DH system should be performed. An alternative would be to agree with the developer of new construction areas to equip the buildings with centralized heating systems. However, such strategy can hardly be realized in short term due to long planning procedures for
Improvement of district Heating in Kosovo 12
new building areas, i.e. the corresponding results can likely not be achieved with the project period of three years. Another likely problem is, that the share of small one- and two family buildings will increase, which are not viable for district heating.
- Accordingly, the investment program could be implemented starting in the second year, i.e., likely in 2011.
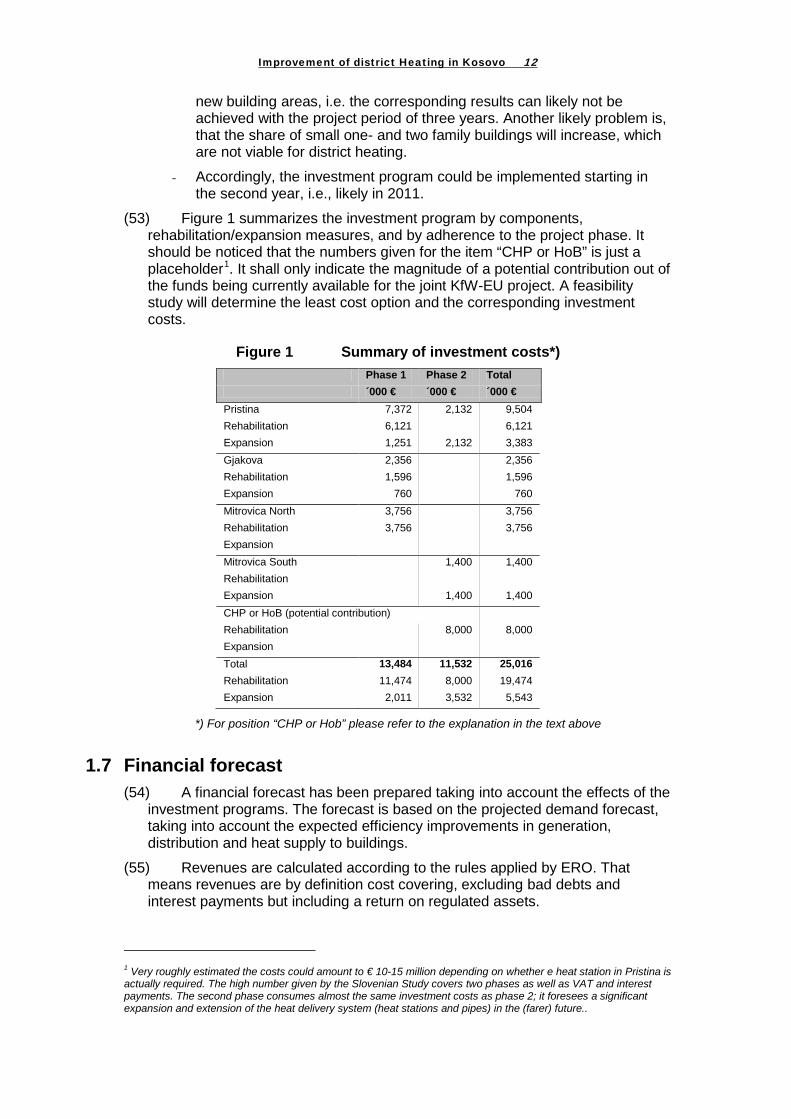
(53) Figure 1 summarizes the investment program by components, rehabilitation/expansion measures, and by adherence to the project phase. It should be noticed that the numbers given for the item “CHP or HoB” is just a placeholder1
Figure 1 Summary of investment costs*)
. It shall only indicate the magnitude of a potential contribution out of the funds being currently available for the joint KfW-EU project. A feasibility study will determine the least cost option and the corresponding investment costs.
Phase 1 Phase 2 Total ´000 € ´000 € ´000 €
Pristina 7,372 2,132 9,504 Rehabilitation 6,121 6,121 Expansion 1,251 2,132 3,383 Gjakova 2,356 2,356 Rehabilitation 1,596 1,596 Expansion 760 760 Mitrovica North 3,756 3,756 Rehabilitation 3,756 3,756 Expansion Mitrovica South 1,400 1,400 Rehabilitation Expansion 1,400 1,400 CHP or HoB (potential contribution) Rehabilitation 8,000 8,000 Expansion Total 13,484 11,532 25,016 Rehabilitation 11,474 8,000 19,474 Expansion 2,011 3,532 5,543
*) For position “CHP or Hob” please refer to the explanation in the text above
1.7 Financial forecast (54) A financial forecast has been prepared taking into account the effects of the
investment programs. The forecast is based on the projected demand forecast, taking into account the expected efficiency improvements in generation, distribution and heat supply to buildings.
(55) Revenues are calculated according to the rules applied by ERO. That means revenues are by definition cost covering, excluding bad debts and interest payments but including a return on regulated assets.
1 Very roughly estimated the costs could amount to € 10-15 million depending on whether e heat station in Pristina is actually required. The high number given by the Slovenian Study covers two phases as well as VAT and interest payments. The second phase consumes almost the same investment costs as phase 2; it foresees a significant expansion and extension of the heat delivery system (heat stations and pipes) in the (farer) future..

Improvement of district Heating in Kosovo 13
(56) The cash flow analysis takes into account the current collection rates but presumes that higher collection rates will be achieved in a couple of years, which has already been experienced by a number of Serbian DH Companies.
(57) The current staff numbers are high compared with DH Companies in EU and, correspondingly, productivity (in terms of MWh/cap) is extremely low. With rising salaries, personnel costs will become crucial for the financial situation of the Companies and the pressure to reduce these costs will increase. Therefore, the financial forecast is based on the assumption that the staff numbers will be reduced by two effects. First, the immediate impacts of the investment programs allow reducing the staff. Second, it is presumed that staff numbers can also be reduced by organizational measures.
(58) As the financial results will by definition (due to the tariff setting methodology) be always positive, the impact on affordability will be nevertheless important. Affordability is measured in terms of the share of heating costs in total disposable household income.
(59) In the new membership countries, the threshold for affordability has typically been set to be 15% (could even be increased to 25% to avoid too high social assistance programs). In average, the share of heating costs is much lower in Kosovo. Under the assumption that the general subsidies for DH will be eliminated, the highest share is 7.5% in 2009 and thereafter the number is successively going down.
(60) The average numbers do of course not allow showing the burden for low-income households. Households that have only 50% of the average income will spend up to 15% of the income for heating. Likely, there are many households earning even less. Targeted subsidies for low-income consumers should replace general subsidies and could be even more effective for low-income households while the total budget for subsidies could be lower.
1.8 Subsidies and social assistance programs (61) The Central Government used to provide fuel subsidies, which covered up
to 70% of the fuel costs of the DH Companies. In this way, the DH tariff could be kept low, as such subsidies reduce the allowed revenues that constitute the basis for tariff calculation.
(62) General subsidies as provided by the Central Government affect all customers, but richer customers will benefit more as they have typically larger apartments. Experience from other CEE countries as well economic theory shows that general subsidies tend to lead to waste of resources and prevent the optimal allocation of resources.
(63) Targeted subsidies would allow supporting particularly low-income households. In this way, budgets for fuel subsidies can be reduced or low-income households can receive higher subsidies. The transition from general subsidies to targeted subsidies should be implemented within a period of a few years.
1.9 Recommended liabilities of the DH Companies (64) DH Companies in Pristina and Gjakova shall regularly review the actual
development of the new building stock and update the investment programs for system expansion. This will avoid unnecessary and premature investments.

Improvement of district Heating in Kosovo 14
Retarded connections and low connection rates will cause high start-off costs, which can be avoided by prudent planning.
(65) All DH companies shall be obliged to apply consumption based billing, wherever meters are installed in the building substations or buildings. Technical assistance might be needed to implement an appropriate billing system.
(66) The DH Company in Mitrovica shall separate the accounts for DH and the other businesses.
(67) District heating companies should determine business plans. So far, not all DH Companies have business plans covering more than the coming heating period. The business plan shall also help to define reasonable performance indicators. The business plan should be approved by the board, which will also monitor the performance indicators. Technical assistance should be provided to support the DH Companies in preparing business plans.
(68) STANDARD Company, which is in charge of DH in Mitrovica, is supplying various utilities. To allow a clear and transparent DH business, DH should either be established as a separate (child) company or, at least, accounts should be unbundled.
(69) The city administration in Mitrovica shall establish a department or public enterprise being in charge of developing and operating the local DH business. Such entity has to start operation latest when a contract for financial support has been signed. This could allow starting with procurement and installation in the period of 2011-2012.
(70) All district heating companies shall adapt their organizations to the new operational philosophy, i.e., demand driven operation. This requires the establishment of a customer service department and program as well as organizational changes, such as a special marketing and sales department separated from the financial department.
1.10 Technical assistance (71) All companies need technical assistance addressing (i) installation,
maintenance and operation of modern DH components, (ii) hydraulic network analysis, (iii) operation and management of DH companies enabling them to adapt to the challenges of a demand driven DH system.
(72) Technical assistance should be provided to assist the DH Companies in adapting the internal organization to the requirements of a customer-oriented and demand-driven DH business.
(73) Technical assistance is also recommended for implementing consumption-based billing. This includes data processing from meter readings, billing, provision of alternative payment schedules (e.g., for advance payments and late payments). In addition, the cost distribution on the apartment level should be addressed. First, it has to be assessed whether this should be the responsibility of the DH Company or of the apartment owners (like in EU Countries). In the second case, the task is usually performed by specialized service companies. In any case, DH Companies should become familiar with the approaches and problems of cost distribution.
(74) Technical assistance should also be provided for a pilot project for cost distribution within buildings. The pilot project could be financed under the joint KfW-EU financial scheme.

Improvement of district Heating in Kosovo 15
(75) TA would be recommended for preparing DH development strategies, longer-term investment plans, and business plans and for defining and monitoring performance indicators. Performance indicators should comprise technical and financial criteria.
(76) TA might also be provided to ERO to develop a cost distribution methodology for CHP and for determining feed-in tariffs. This might also comprise assistance to replace eventually the current cost-plus tariff regulation by a price-cap regulation.
(77) Technical assistance should be provided for establishing the DH branch of STANDARD Company either as a separate child company or by unbundling the accounts and defining cost distribution keys for common costs.
(78) TA should also support the Municipality of Mitrovica to establish the entity that will be in charge of develop the DH System and to support its operation,

Improvement of district Heating in Kosovo 16
2 Objectives
The main objective of this project (the “study”) is to prepare a larger investment and institutional reform program (the “project”) for three cities in Kosovo.
The objectives of the proposed district heating project are: - Reduction of pollutants and greenhouse gas emissions by reducing the loss
of heat and water and increasing the energy efficiency - improvement of the supply for the consumers with heat from the district
heating network - Institutional strengthening of the district heat provider - Complementation of existing legislation (for example feed-in tariffs, law
enforcement)
KfW, in view of an envisaged cooperation with EC, assesses possible investments in district heating - possibly complemented by accompanying measures - of 25 million EUR tentatively (KfW-Loan: 5 million; KfW-Grant: possibly 6 million EUR; IPF grant: 14 million EUR) for the cities of Pristina, Gjakova and Mitrovica, if they qualify for the program. In addition, a financial contribution from the municipality of Pristine could be made available. The amounts are still to be negotiated.
The objectives of the study are: - To prepare a reasonable assessment of the current district final heating
demand and prepare an energy balance of the DH system allowing identifying losses and inefficiencies. In this way, a realistic basis for determining the investment needs will be created.
- To prepare a demand forecast: The demand forecast can also include reasonable new connections within the current service area.
- To prepare least cost analysis: The study will identify least cost options for the rehabilitation and modernization of the DH systems in the three cities.
- To prepare a study, which shall serve as a basis for determining potential grants and loan financing provided by KfW and the EC.? This includes the development of a short-term priority investment plan in compliance with a longer term prospective of the development of the respective DH system.
- To assess affordability: The assignment will assess the current and future affordability of DH services in the three cities
The assignment will also include an assessment of the institutional framework and the provisions of recommendation for institutional changes as a prerequisite for the successful implementation of the investment program. Institutional reforms shall particularly support improving the collection rates
The investment project will be divided into two phases. Phase 1 for the measures to be implemented in the short term after the pre-feasibility study – as described in the terms of reference – has been completed. Phase 2 for the remaining funds after a feasibility study to be financed from EU TA IPF has been realized.
Improvement of district Heating in Kosovo 17
3 Review of the current technical and financial status of the DH companies
3.1 Technical assessment The chapter will describe the technical status of the three DH systems, namely located in Pristina, Gjakova and Mitrovica, in terms of both technical performance indicators and already achieved technical rehabilitation rates. The description is divided to customer interface, networks, boilers and the human resources.
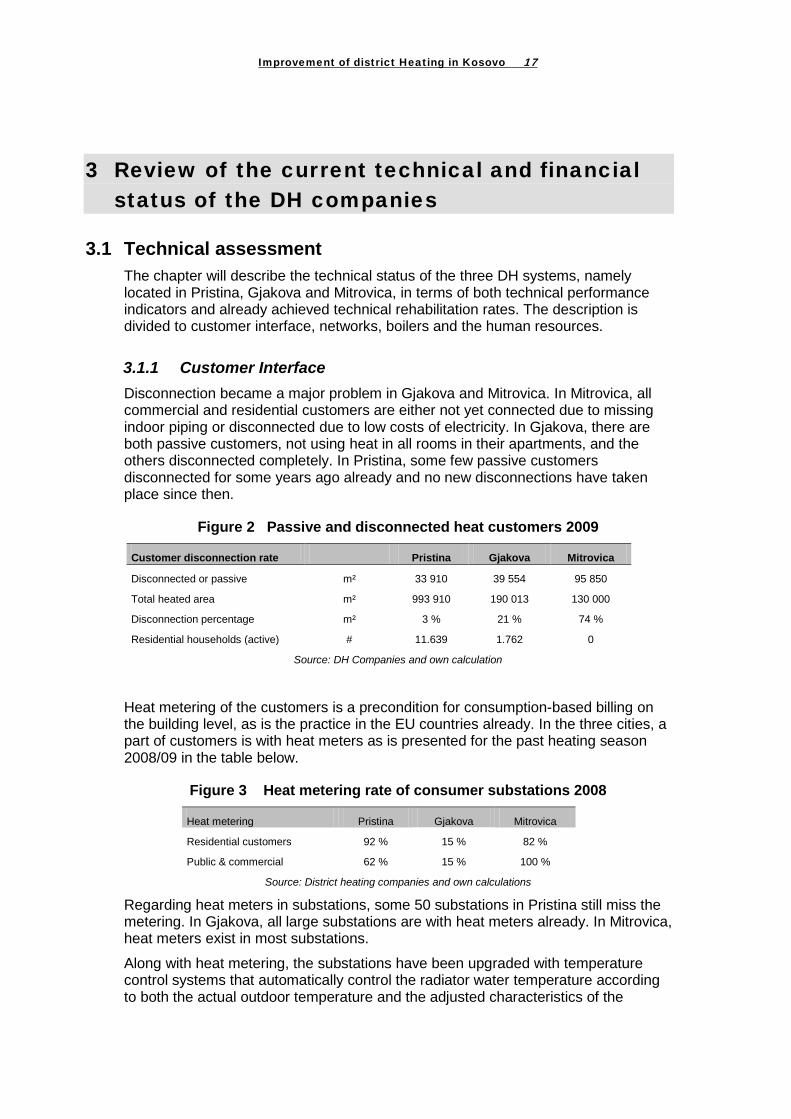
3.1.1 Customer Interface Disconnection became a major problem in Gjakova and Mitrovica. In Mitrovica, all commercial and residential customers are either not yet connected due to missing indoor piping or disconnected due to low costs of electricity. In Gjakova, there are both passive customers, not using heat in all rooms in their apartments, and the others disconnected completely. In Pristina, some few passive customers disconnected for some years ago already and no new disconnections have taken place since then.
Figure 2 Passive and disconnected heat customers 2009
Customer disconnection rate Pristina Gjakova Mitrovica
Disconnected or passive m² 33 910 39 554 95 850
Total heated area m² 993 910 190 013 130 000
Disconnection percentage m² 3 % 21 % 74 %
Residential households (active) # 11.639 1.762 0
Source: DH Companies and own calculation
Heat metering of the customers is a precondition for consumption-based billing on the building level, as is the practice in the EU countries already. In the three cities, a part of customers is with heat meters as is presented for the past heating season 2008/09 in the table below.
Figure 3 Heat metering rate of consumer substations 2008
Heat metering Pristina Gjakova Mitrovica
Residential customers 92 % 15 % 82 %
Public & commercial 62 % 15 % 100 %
Source: District heating companies and own calculations
Regarding heat meters in substations, some 50 substations in Pristina still miss the metering. In Gjakova, all large substations are with heat meters already. In Mitrovica, heat meters exist in most substations.
Along with heat metering, the substations have been upgraded with temperature control systems that automatically control the radiator water temperature according to both the actual outdoor temperature and the adjusted characteristics of the

Improvement of district Heating in Kosovo 18
particular building. Many of the substations are equipped with control systems, as presented in the below.
Figure 4 Substations equipped with temperature controllers and plate heat exchangers as indication of rehabilitation
Substation rehabilitation rate Pristina Gjakova Mitrovica
with new heat exchangers # 256 160 54
with heat metering and control 229 30 47
Total # 291 220 54
Source: District heating companies and own calculations
None of the substations in Kosovo is with remote monitoring, as presented in the table to follow. Remote monitoring enables the companies to identify abnormally functioning substations, to take correcting actions without delay, and to collect information on customer behavior for various statistical analyses. Such analyses can provide information for improving the quality of provided heating services.
Figure 5 Remote monitoring
Remote monitoring rate Pristina Gjakova Mitrovica
Substations with RM # 0 0 0
Substations in total # 291 180 54
RM rate % 0 % 0 % 0 %
Source: District heating companies and own calculations
3.1.2 Networks The average size of DH piping is relatively large in Pristina and Gjakova, whereas pipe diameters are usually smaller in other systems of similar size and type abroad (typically DN 125-DN150). With larger diameter of piping, the DH system can be extended to new customers at lower incremental network costs, which is relevant in both Pristina and Gjakova. On the other hand, higher capital and maintenance costs incur as long as the expected load has not been achieved.
Figure 6 Average rounded diameters (DN) of DH network piping 2008
Network piping Pristina Gjakova Mitrovica
Average diameter mm 220 200 150
Source: DH Companies and own calculation. Numbers are rounded
According to the information obtained, quite a share of networks is with modern preinsulated pipes already. Such a high share assumes there is not much to be replaced urgently, since the lifetime of the preinsulated pipes is 30 years or more. The newest ones are designed even for 50 years.
Figure 7 shows the length of the networks, length of preinsulated pipes, and the correspond share.

Improvement of district Heating in Kosovo 19
Figure 7 Network rehabilitation by means of preinsulated pipes (Double pipe length)
Network rehabilitation rate Pristina Gjakova Mitrovica
Rehabilitated or new Km 11,8 6,5 3,4
Total Km 31,2 11,0 6,2
Rehabilitation rate % 38 % 59 % 55 %
Source: District heating companies and own calculations
The water losses of the DH networks in Kosovo are high. The main reason for high losses is likely the poor condition of the remaining old networks, because most of the indoor water systems of buildings are separated with heat exchangers from the DH network.
High water losses speed up both corrosion and blocking, if the capacity of the water treatment system is insufficient to meet the need of large water flows, and cause energy losses, since the water had been heated from about 10oC to above 70oC.
A relative performance indicator, as presented in the table below, shows how many times the water volume of the network has been replaced during the heating season.
In modern DH systems, the number is much lower, around one revolution per year only.
Figure 8 Relative water losses
Water losses of network Pristina Gjakova Mitrovica
Volume revolutions per year 30 17 12
Source: District heating companies and own calculations
Regarding the water losses, one has to note that the heating season in the region is about 6 months whereas the networks in most other European countries are operated all year round. Therefore, the comparative values of the water losses of Pristina, Mitrovica and Gjakova are 60, 24 and 34 revolutions compared to 1 in Finland and Sweden, for instance.
In several Central European Countries, where comprehensive rehabilitation of district heating has been carried out since the early 1990ies, the water volume revolution values used typically to vary between 10 to 30 revolutions on the annual level compared with the 34 and 60 in Kosovo. This also indicates that the water loss is a substantial problem in the Kosovo systems.
The water losses in Pristina are rather constant during the day, which also indicates that the basic reason to losses is the leaking pipes and heat exchangers. If there would be a variation from hour to hour, one could think there could be some commercial application taking water illegally to their needs. However, this seems not to be the case. Since the heat exchangers in Pristina are mainly new, the remaining major reason for water losses is the old underground piping located in the city center.
In Mitrovica, there are no metered records of water losses but the personnel consider the losses of the network insignificant.

Improvement of district Heating in Kosovo 20
Figure 9 Frequency of network damages in heating networks
Network damages Pristina Gjakova Mitrovica
DH network #/km 3,8 2,7 0,1
Source: District heating companies and own calculations
The data of the table above is based on real data from Pristina but on estimates in the other cities, since no real statistics is systematically collected. Therefore, the accuracy of interviewed data remains uncertain. In Mitrovica, only one leakage has been observed and repaired in the past three years. Therefore, the value is very low: 0.1 repairs per km. One reason to this is that, due to comprehensive disconnections, the heat demand is low. Therefore, low pressures and water flows are used, which saves pipelines from damages.
The general problem in the region is the hardness of raw water. The softening plants in the boiler plants need be properly sized in order to prevent hard water entering the network.
Figure 10 Distribution efficiency of the networks as indication of thermal losses
Pristina Gjakova Mitrovica
Thermal efficiency of network % 85 % 90 % 70 %
Source: District heating companies and own calculations
The thermal losses of the networks are still relatively high, even though there is no summer time load and many of the pipes have been replaced. The problem stays with the old pipelines that are poorly insulated if at all. In Pristina, in particular, the problem is the external water frequently covering the poorly insulated pipelines. In Mitrovica, the high relative losses of the network, about 30%, are explained by the low heat delivery, less than 25% of the designed. The network is all time hot during the heating season regardless how much heat is delivered.
Heat losses of the state-of-the-art networks would range from 2 to 6%, depending on the relative length and average diameter of the pipelines. Therefore, there is a way to go for pipeline replacement and for optimizing the sizes while replacing old pipes and improving the distribution efficiency.
Figure 11 Electricity consumption of the DH systems
Electricity consumption Pristina Gjakova Mitrovica
Electricity MWh 4500 500 50
Heat sales GWh 133 20 2,8
Electricity cons./heat sales kWh/MWh 34 25 18
Source: District heating companies and own calculations
Electric applications, such as DH circulation and static pressure pumps, the pumps in substations and the fans at boiler plants are the main users of electric energy in DH. Using frequency control systems will substantially reduce electricity consumption.
3.1.3 Boilers Some rehabilitation has been realized in the tree DH systems in an EAR financed project. Such rehabilitation measures have covered new burners, water softening systems, and replacement of burner tubes.
Improvement of district Heating in Kosovo 21
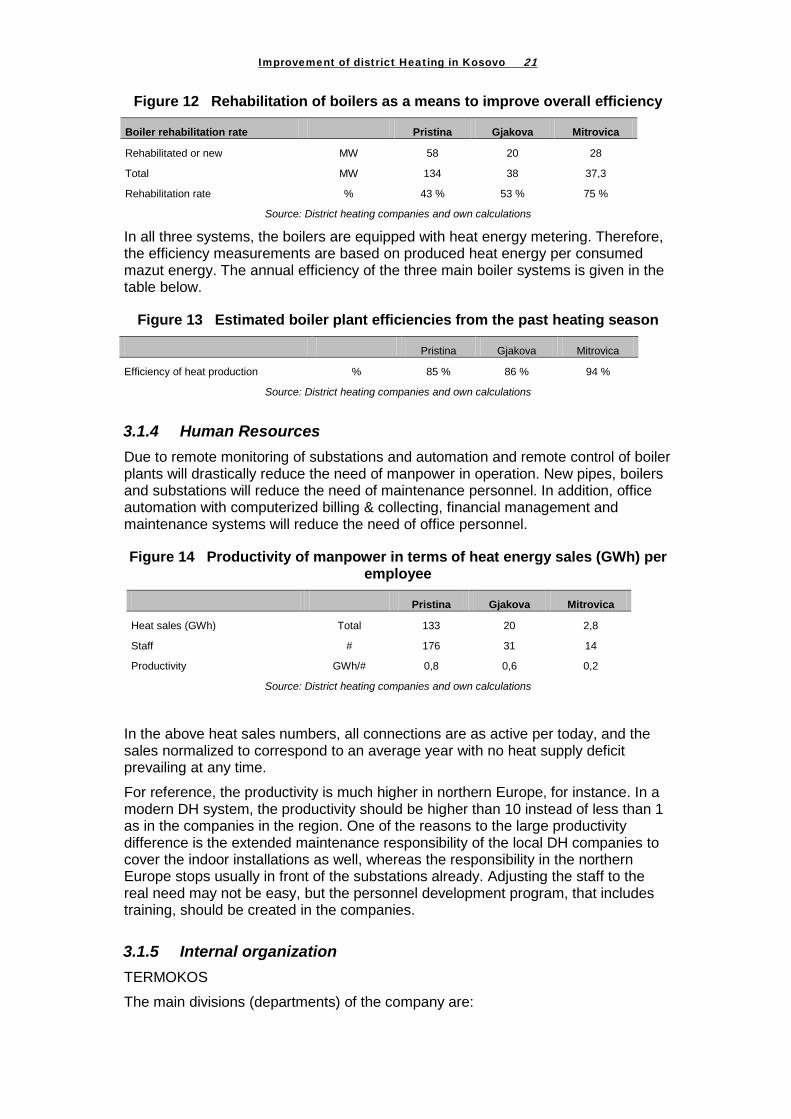
Figure 12 Rehabilitation of boilers as a means to improve overall efficiency
Boiler rehabilitation rate Pristina Gjakova Mitrovica
Rehabilitated or new MW 58 20 28
Total MW 134 38 37,3
Rehabilitation rate % 43 % 53 % 75 %
Source: District heating companies and own calculations
In all three systems, the boilers are equipped with heat energy metering. Therefore, the efficiency measurements are based on produced heat energy per consumed mazut energy. The annual efficiency of the three main boiler systems is given in the table below.
Figure 13 Estimated boiler plant efficiencies from the past heating season
Pristina Gjakova Mitrovica
Efficiency of heat production % 85 % 86 % 94 %
Source: District heating companies and own calculations
3.1.4 Human Resources Due to remote monitoring of substations and automation and remote control of boiler plants will drastically reduce the need of manpower in operation. New pipes, boilers and substations will reduce the need of maintenance personnel. In addition, office automation with computerized billing & collecting, financial management and maintenance systems will reduce the need of office personnel.
Figure 14 Productivity of manpower in terms of heat energy sales (GWh) per employee
Pristina Gjakova Mitrovica
Heat sales (GWh) Total 133 20 2,8
Staff # 176 31 14
Productivity GWh/# 0,8 0,6 0,2
Source: District heating companies and own calculations
In the above heat sales numbers, all connections are as active per today, and the sales normalized to correspond to an average year with no heat supply deficit prevailing at any time.
For reference, the productivity is much higher in northern Europe, for instance. In a modern DH system, the productivity should be higher than 10 instead of less than 1 as in the companies in the region. One of the reasons to the large productivity difference is the extended maintenance responsibility of the local DH companies to cover the indoor installations as well, whereas the responsibility in the northern Europe stops usually in front of the substations already. Adjusting the staff to the real need may not be easy, but the personnel development program, that includes training, should be created in the companies.
3.1.5 Internal organization TERMOKOS
The main divisions (departments) of the company are:

Improvement of district Heating in Kosovo 22
- Production Department with the departments for machinery, chemical treatment, electricity supply, and planning and development
- Distribution Department with the departments for distribution, measurements and planning and investments
- Department of Supply comprising departments for billing, payments, customers services, service for contest, and verification inspectors of new cases and complaints in the field
- Financial Department with the accounting department, financial Affairs and Verification of Reports, and verification of corrections in billing
- Administrative-Legal Department with the Human Resource Service, general services, and the legal assistant
- Internal Audit Office - Procurement Office - Office of Planning and Budget: - Support Office, which is, amongst other, in charge of Public relations and
coordination with ERO
Figure 15 Internal organization of TERMOKOS
Corporate Secretary / Administrative DirectorCorporate Secretary /
Administrative Director
Board of DirectorsBoard of Directors
Internal Audit OfficerInternal Audit Officer
Support OfficeSupport Office
Production DepartmentProduction Department Department of SupplyDepartment of SupplyDistribution Department Distribution Department
Main Official Finances & Treasury
Main Official Finances & Treasury
Procurement OfficeProcurement Office
Budget & Planning Office
Budget & Planning Office
CEOCEO
Operating OfficerOperating Officer
The organizational scheme does in general reflect the requirements of a modern DH company. The establishment of the “Supply Division” reflects adequately the increasing significance of customer relations. In future, more acquisition of new customers, service quality and consumption based billing will become more important. Furthermore, the technical departments for production and distribution could be subordinated under a Technical Division in order to optimize the coordination in the technical field. District Heating Company Gjakova Figure 16 shows the organizational scheme of the DH Company Gjakova. The organizational structure corresponds to the traditional organization of a utility that used to be responsible for operating and maintaining the system. There are two technical divisions, one for heat production and the other for heat distribution. All other functions are under the umbrella of the “Public Supply” division. Similarly like the DH system will convert from a supply driven to a demand driven system, the business will have to convert to a customer-oriented system and the organization

Improvement of district Heating in Kosovo 23
should reflect this change by establishing a sales division besides a financial division. The sales division should also include customer relations.
Figure 16 Organizational Scheme of the “District Heating Gjakova “ J.S.C. Gjakova
Central Heating Distribution ( 1+ 3 = 4 )
Central Heating Production
( 1+11 = 12 )
Public Supply (2+18=20)
Head of Finance (1)
Accountant (1)
Work Protection officer (1)
Mechanic (7)
Driver (1)
Cashier (2)
Officer for Consumers (1)
Yard Maintenance (1)
Distribution Engineer (1)
Cleaner (1)
Procurement officer (1)
Mechanic and welder (2)
Storage Officer (1)
Cashier (1)
Managing Director
Secretary (1)
Administrator (1)
Electrician (4)
Deputy Managing Dir.
Inner Audit Officer (1)
Head of Production (1)
Head of Distribution
( 1 )
Security (4 )
Mitrovica The DH division is part of STANDARD Company. For the time being, only 13-14 people work for DH. An official organizational chart is not available.
3.2 Financial assessment
3.2.1 Pristina Legal status of the company “NGROHTOREN E QYTETIT TERMOKOS SH.A” (District Heating TERMOKOS Joint Stock Company) is a public owned enterprise and is established as a joint stock company registered and headquartered in Pristina. The company is registered on the Kosovo Business Registry under No. 703253 dated Dec. 23, 2005 and used to be administrated by the Kosovo Trust Agency (KTA). The company is the legal successor of N.P.K. TERMOKOS, a public utility company. Since June 2009, the

Improvement of district Heating in Kosovo 24
Company is owned by and under supervision of the Municipality of Pristina in compliance with the Law “On Public Owned Utilities”2
.
Scope of business The Company undertakes only one single business that is district heating service comprising heat generation and distribution up to the final consumers.
Financial Situation The account receivable days decreased by almost 50% in the period 2006-2008, but are still high indicating larger collection problems. This is also illustrated by the fact that the collection rate for 2008 is very low indicating the late payment of consumers. However, TERMOKOST succeeded to collect money for bills of previous years. Accordingly the overall collection rate was 67.5% in 2007 and 88.4% in 2008. In 2008, the company did not charge consumers for two months, in which the DH system was not operated. Accordingly, a part of the fixed costs could not be covered, although even the lump sum tariff is composed by a fixed and a variable component.
Early in 2008, the combination of low collection rates and sharply increased heavy fuel oil prices caused the discontinuation of the heating supply for about two months, as TERMOKOS was not able to pay the fuel bills and the fuel supplier refused to deliver the fuel.
The accounts payable days are in compliance with good business practice and the current ratio is acceptable.
Losses amounted to 57% of total costs in 2006 due to high bad debts. In 2007 and 2008 losses have been reduced to 8%.
Figure 17 Key financial indices
Item Unit 2006 2007 2008
Accounts receivable days d/yr 304 284 157
Accounts payable days d/yr 41 19 57
Current ratio [-] 1.18 1.09 1.22
Collection rate
Residential consumers % 26.1% 22.2% 13.2%
Commercial and budgetary consumers % 87.9% 89.5% 58.4%
Average collection rate % 54.5% 52.8% 33.5%
Collection rates including bills of previous years % 63.4% 67.5% 88.4%
Loss as percentage of total costs % -57% -8% -8%
Source: Balance sheets of DH Companies and own calculations
For the time being, billing rates cannot reasonably be determined for the following reasons:
- Heat consumption of final consumers is not metered, neither in substations nor anywhere else in the connected buildings. That means, physical losses in the
2 For decomposition of the Board, see chapter 3.3.1 “Law on Public Enterprises”.

Improvement of district Heating in Kosovo 25
distribution system are actually not known and are typically estimated according to normative loss numbers or a combination of normative loss numbers and some assumption. Occasional measurements may improve the numbers, but could only to limited extent be extrapolated for a whole heating period.
- There is likely a significant percentage of non-registered heat consumption, either by illegal connections or by non-registered extension of the heated areas. These are typical problems in quickly growing cities like Pristina, where many new buildings are constructed or extended even within existing DH service areas. TERMOKOS detected many such cases, but it is hard to estimate the actual number of such connections.
3.2.2 Gjakova Legal status “NGROHTOREN E QYTETIT GJAKOVË SH.A.” (District Heating Gjakova Joint Stock Company) is the district heating company of the City of Gjakova. It is established as a joint stock company registered and headquartered in Gjakova. The company is registered on the Kosovo Business Registry in 2005 and used to be administrated by the Kosovo Trust Agency (KTA). Since June 2009, the Company is owned by and under supervision of the Municipality of Gjakova in compliance with the Law “On Public Owned Utilities””.
Scope of business The company’s sole business is supply of district heating services comprising heat generation and distribution up to the final consumers.
Financial status Account receivable days are high (204-268 days) and the company was not able to reduce them in the period 2006-2008. Accounts payable days reflect good business practice, but increased from 15 to 37 days. Average collection rates of bills of the current year were 30% in 2008. The overall collection rate was 30% in 2008.
The current ratio declined in the same period indicating again increasing problems of the company to fulfill its payment obligations. Losses became lower in 2008, but are still high amounting to 22% of the total costs.

Improvement of district Heating in Kosovo 26
Figure 18 Key financial indices
Item Unit 2006 2007 2008
Accounts receivable days d/yr 259 204 268
Accounts payable days d/yr 15 30 37
Current ratio [-] 1.97 0.95 0.71
Collection rate bills of current year
Residential consumers % 26% 22% 13%
Commercial and budgetary consumers % 88% 89% 58%
Average collection rate % 49% 49% 30%
Collection rate including bills of previous years % n.a. n.a. n.a.
Loss as percentage of total costs % -32% -33% -22%
Source: Financial statements of district heating companies and own calculations
3.2.3 Mitrovica (North) The district heating company “JKP STANDARD Kos. Mitrovica” is situated in the Northern (Serbian) part of the City. For the time being, the company operates only in this part of the city. The company is registered by UNMIK According to existing legislation the company should apply for a license to be issued by ERO. Moreover the ownership of the company should be transferred to the municipality of the City of Mitrovica. The company management considers the owner to be the Republic of Serbia and accordingly the Municipality is considered responsible for establishing the board and approving tariffs. This perception is not in accordance with the Constitution of the Republic of Kosovo and respective applicable laws.
Legal Status of the company According to STANNDARD management the company is considered to have the status of a Public Utility (Javna communal predate) in accordance with Serbia Legislation.
The board of the company is constituted by the municipality according to Serbian legislation. The stipulations of the “Law on Public Owned Enterprises” approved by the Kosovo Parliament in 2008 are currently not applied.
Scope of business The company is in charge of various utilities and its business comprises:
- district heating
- water supply
- market organization
All businesses are reported to one single accounting system, i.e., there are no separate accounts for the individual businesses. The Company can, however, separate the costs utilizing simple cost distribution keys; this has been done for the DH business but not all cost items had been considered.
Financial Situation

Improvement of district Heating in Kosovo 27
The biggest part (about ¾) of the total income comes as subsidies from central governmental budgetary sources. Thanks to this financial source, the current ratio is acceptable with a value of 1.92(2008) and 1.1 (2007) as well as the as the accounts payable days (45 and 69 days for 2008 and 2007). However, the company has big collection problems, although goods and services are heavily subsidized. Accounts receivables amount to 393 days (2008) and 261 days (2007).
STANDARD Company prepared a separate income statement for the DH business in 2008.Total expenditures amounted to about 21 million RSD (approx. €237.000)3
Figure 19 Breakdown of the income
, while total revenues amounted to 12.2 million RSD (approx. 138.000 €). Accordingly, the DH business generated a loss of 8.6 million RSD (approx. 97.000 €). The numbers do even not include depreciation. The biggest expenditures were for personnel (about 55% of total excluding depreciation) and for fuel (39%)
-
20,000
40,000
60,000
80,000
100,000
120,000
140,000
2008 2007
Other income
Income from subsidies etc.
Income from sales of goods andservcies
-Source: District heating companies and own calculations
The low collection rates have been explained by the electricity which used to be supplied free of charge by the Serbian Electricity Company EPS. Free of charge means that EPS did not bill the customers so far. However, it was stated that EPS would start reading the meters on Dec. 1, 2009, and start billing the customers on Dec.15, 2009.
The electricity price will play an important role for the financial development of the company. Only if customers will have to pay a realistic electricity price, consumers would be ready to reconnect to district heating. However, even then, collection rates might be very low for some time, as final consumers have been accustomed to get heating for free. On the other hand, if the DH Company would apply a stringent and consequent collection policy, the reconnection rate could be low. Eventually, the financial recovery of the DH business could become a difficult and time-consuming process and subsidies might be required for a number of years.
3.3 Institutional and legal assessment Three important laws affect the DH sector:
- Law on energy from April 2004, which provides – amongst others - the legal basis for regulating DH tariffs
3 The currency exchange rate was 88.6010 RSD/€ in December 2008 (Source: National Bank of Serbia)

Improvement of district Heating in Kosovo 28
- Law on Public Enterprises from June 2008
- Law on Central Heating, whereby central heating means district heating, from November 2008.
3.3.1 Law on Public Enterprises Based on this law the ownership of the DH Companies of Pristina and Gjakova was transferred to the local municipalities in 2009. It also provided a reasonable framework for the commercialization of the DH Companies. The Municipality as the owner is in charge of supervising the company, while ERO approves the tariffs. By separating both functions, the problems that occur in many CEE Countries could be eliminated or at least significantly reduced. If the ownership and tariff setting functions are in one hand, tariffs are typically affected by political deliberations rather than by economic and financial criteria. Moreover, by transferring the control functions to a supervisory board (board of directors), the direct link to the city assembly and council are separated. The board will consists of 5 members with a term of three years, from which at least two have to be proliferate in accountancy. Each member has to have at least 5 years experience in business management, corporate finance, treasury management, banking, business or industry consultancy, or any other related experience. Members have to be independent and the law defines a number of cases that could constitute a conflict of interest.
The law on Public Owned Enterprises determines also the rules for establishing the company’s board. The board of directors of a Local Public Owned Enterprise (POE) shall consist of five directors, from which four shall be elected at a shareholders meeting and each shall have a term of three years. A “Municipal Shareholder Committee” shall represent the municipality at such meeting and such committee shall exercise the municipality’s voting. The other director shall be the POE’s CEO, who shall be selected by the POE’s board of directors. The Municipal Shareholders Committee shall ensure that at least two elected directors are proficient in, or at least have an adequate knowledge of, accountancy. No person may be nominated or elected to a director position unless he meets the eligibility, independence and professional suitability criteria.
The Board of Directors of a POE shall exercise continuous and rigorous oversight in particular over the conduct of the POE’s officers. If the performance of the POE deviates from the targets set in the business plan of the relevant financial year, the Board of Directors shall request a report by the CEO setting out the reasons explaining the underperformance, and shall take any appropriate immediate action. In any event, if the POE fails to meet its performance targets over two consecutive financial years, the Board of Directors shall have an obligation to consider removing and replacing the CEO.
3.3.2 Law on Central Heating The Law aims at setting conditions for the developing a sustainable and competitive heat market, for a safe, reliable, and efficient heat supply, and to ensure a certain quality of heat supply services, and billing and collecting (including disconnections). Moreover, it opens the heat market for independent heat producers and sets some basic rules for the use of waste heat and renewable energies.
Apart from the new market conditions for independent producers there is nothing that would tangibly change the conditions for a normal, commercial DH business. There is only one exemption, which could have some harmful effects. Article 6 stipulates, that

Improvement of district Heating in Kosovo 29
“Vertically integrated enterprises shall perform generation, distribution, and supply activities in a functionally separate manner. Transfers of information between such separate activities shall be prohibited to the extent that is required to perform the tasks of the public supply. So far, neither TERMOKOS nor DH Company Gjakova have undertaken any steps to implement this requirement.
This section shall likely prevent unfair conditions for independent suppliers. However, to optimize the operation in a modern DH system, exchange of all technical and economic-financial departments is absolutely necessary. This, for example, is also an inherent objective of a Management Information System for DH Companies. However, as the law is relatively new, it is hard to predict any practical consequences.
The Law is an umbrella law for the DH sector, which needs to be supplemented by a corresponding secondary legislation. This refers, but is not necessarily limited, to:
- Penalties for illegal connections (Art. 24.3)
- Supply contracts (Art. 22.1 “Heat enterprises may conclude commercial contracts with its customer for installation, service, maintenance, and extension of the secondary network downstream to the delivery point
In accordance with the Law DH Companies will have an important task to develop the technical codes.
- Elaboration and approval of codes (“Art. 3.1.: “Codes means the… documents issued by the heat enterprises and approved by the ERO”.).
- Procedures and rules for metering (Arti.20,,1…the published metering code determining the requirements for installing, operating, maintaining and replacing metering devices”).
- Point of delivery (Art. 30.2 “Heat … shall be metered … at the delivery point). In this context the question has to be raised how to deal with apartment-wise heat meters. “)
- Technical codes (Art. 31.1 “ The Codes… shall contain technical rules establishing minimum technical design, operational requirements and standards for heat and connection..., structure of heat delivery stations…, management of heat system.., maintenance and development…”).
TA should be provided to support the HD Companies in preparing the codes.
3.3.3 Supply contracts The “Rules on General Conditions of Energy Supply” issued by ERO on June 2006 deal with the supply condition for energy in general and DH in special. According to these rules, the supplier shall
...bill and collect payments from the customers;”
“...draft the offers, contracts, bills, statements and notices addressed to the customers;”
“Establish department responsible for protecting and providing information, support, and advice to the customers (including customer service, …, bill enquiries, …, etc);
Supply contracts have to be prepared by the Supplier and approved by ERO.
The Rules also address in detail connection charges. New connection can be charged with an “appropriate proportion of the costs, Cost contributions for

Improvement of district Heating in Kosovo 30
reinforcement of the existing network can only be levied if the new load requirements exceed 3% of the existing effective capacity at the relevant points of the network.
The General Conditions specify also the contract partner in case of DH services. Article 17 stipulated:
17.1 In district heating, the customer – contracting party is considered the owner or authorized user of facility equipped with the substation and secondary internal heat network.
17.2 In case of multi-flat buildings consisting of several (numerous) individually owned apartments, which are the end-users of the heat, the customer – contracting party to the supplier – shall be considered any legal entity performing duties of the housing administration (e.g. administrator, housing association etc.) that will be established in the future.
17.3 Until the establishment of housing administration in multi flat buildings, each owner of the apartment shall be considered as the customer – contacting party to the supplier.
TERMOKOS applies a supply contract, which specifies in detail powers and liabilities of the supplier (TERMOKOS) and final consumers. It also addresses service quality, but does not offer compensation in case of service interruptions. The supply contract is, however, only applied for customers, charged according to meter readings. There are no written contracts for non-metered consumption.
Once consumption-based billing will be comprehensively applied, TERMOKOS will conclude contracts with all individual customers, as long as the corresponding legal representatives have not been established. TERMOKOS intends to implement consumption-based billing in 2011.
The requirement to install meters and using them for billing is stipulated in the licenses. However, given the tough financial situation of the companies, so far ERO has not yet issued a deadline for the installation of the meters. Nevertheless, the need for this installation was communicated to the regulated companies in several meetings and occasions. There is also a provision in the Law on District Heating that obliges the companies to install meters. Article 32 of the Law on District Heating obliges the distributor to install meters on all customers connected to the district heating system within one year from the approval of the law.
3.3.4 Ownership issues In theory, the property border between DHC and customer is clearly defined:
- The primary side of a substation is owned by the DHC. The primary part is defined as starting at the first valves inside the substation and ending at the heat exchanger. Therefore, the primary side includes section valves, heat meters, control valves, strainers, temperature and pressure measuring and regulating devices.
- The secondary part is the property of the customer. It includes the equipment starting at and including the heat exchanger, water collectors, supply pumps, and piping in the substation that supplies the heat for the dwelling. It is the customer’s responsibility to maintain this equipment. However, in practice there is no building administration established in residential buildings yet being responsible for the secondary installations in collective building. Although it is not the responsibility of the DH Company

Improvement of district Heating in Kosovo 31
the companies have to maintaining these installations in the substation to keep the system running.
- For commercials and institutional building, the heat is clearly defined as the dividing point between DH Company and customer. Maintenance of the secondary installations is the task of the customer.
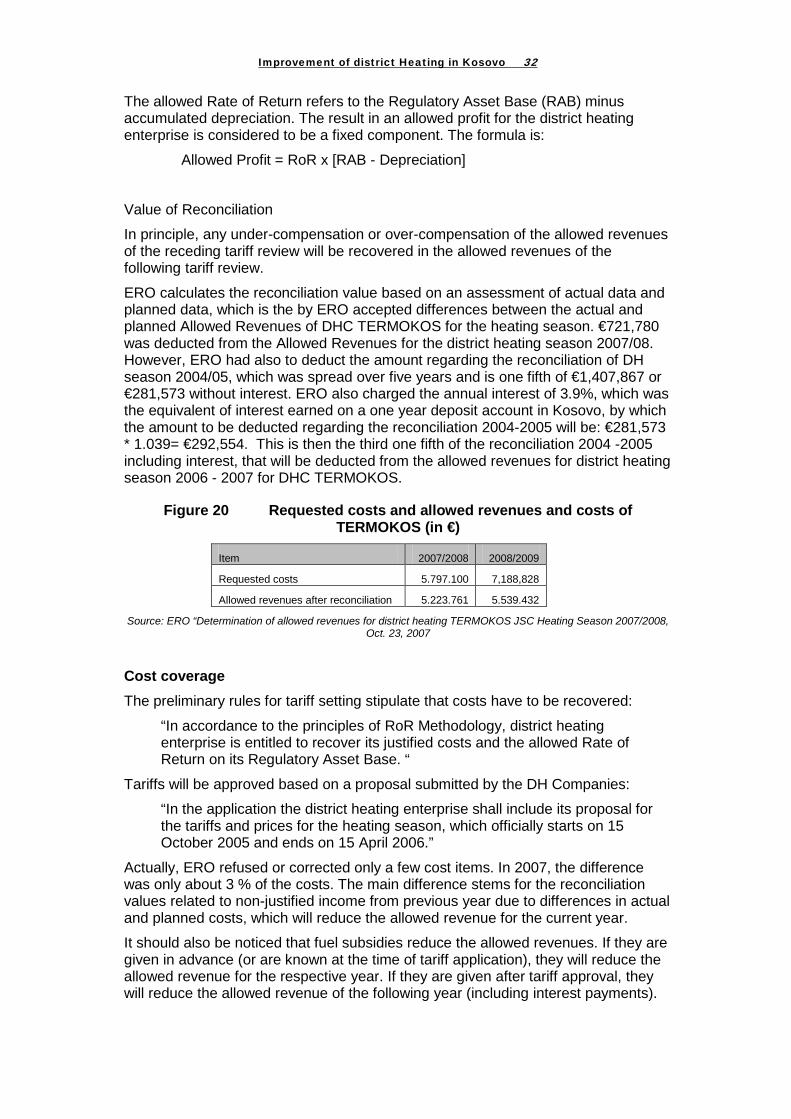
3.3.5 Tariff calculation The tariff calculation methodology can be characterized by the determination of “Allowed Revenues”. Allowed revenues represent the annual cost of the company and consist of i) “justifiable” operational costs, ii) annual depreciation, iii) allowed return on Regulatory Asset Base, (iv) the reconciliation value.
R = OC + D + (RoR x CRAB) +/- VoR
Where:
R Total Allowed Revenues
OC Total Operational Cost
D Depreciation for the respective year
RoR Allowed Rate of Return (%) on Closing Regulatory Asset Base
CRAB Closing Regulatory Asset Base
(RoR x CRAB) Allowed Return or Allowed profit (value)
VoR Value of Reconciliation
Operational costs
The DH Company prepares a projection for the coming heating season, which covers basically all operational cost items shown by the income statement. However, bad debts are not allowed to be included.
In addition, allowed operational costs shall not include:
- subsidies,
- costs rejected by tax authorities4
- costs of setting aside and releasing reserves,
,
- lease payments for the value of items which are not kept in the bookkeeping record,
- financial and other extraordinary costs.
The allowed operational costs comprise the fixed part and the variable part according to the formula:
OC = OCF + OCV
Where:
OCF Fix part of Operational Costs
OCV Variable part of Operational Costs
Profit
4 These are costs that are determined case by case
Improvement of district Heating in Kosovo 32
The allowed Rate of Return refers to the Regulatory Asset Base (RAB) minus accumulated depreciation. The result in an allowed profit for the district heating enterprise is considered to be a fixed component. The formula is:
Allowed Profit = RoR x [RAB - Depreciation]
Value of Reconciliation
In principle, any under-compensation or over-compensation of the allowed revenues of the receding tariff review will be recovered in the allowed revenues of the following tariff review.
ERO calculates the reconciliation value based on an assessment of actual data and planned data, which is the by ERO accepted differences between the actual and planned Allowed Revenues of DHC TERMOKOS for the heating season. €721,780 was deducted from the Allowed Revenues for the district heating season 2007/08. However, ERO had also to deduct the amount regarding the reconciliation of DH season 2004/05, which was spread over five years and is one fifth of €1,407,867 or €281,573 without interest. ERO also charged the annual interest of 3.9%, which was the equivalent of interest earned on a one year deposit account in Kosovo, by which the amount to be deducted regarding the reconciliation 2004-2005 will be: €281,573 * 1.039= €292,554. This is then the third one fifth of the reconciliation 2004 -2005 including interest, that will be deducted from the allowed revenues for district heating season 2006 - 2007 for DHC TERMOKOS.
Figure 20 Requested costs and allowed revenues and costs of TERMOKOS (in €)
Item 2007/2008 2008/2009
Requested costs 5.797.100 7,188,828
Allowed revenues after reconciliation 5.223.761 5.539.432
Source: ERO “Determination of allowed revenues for district heating TERMOKOS JSC Heating Season 2007/2008, Oct. 23, 2007
Cost coverage The preliminary rules for tariff setting stipulate that costs have to be recovered:
“In accordance to the principles of RoR Methodology, district heating enterprise is entitled to recover its justified costs and the allowed Rate of Return on its Regulatory Asset Base. “
Tariffs will be approved based on a proposal submitted by the DH Companies:
“In the application the district heating enterprise shall include its proposal for the tariffs and prices for the heating season, which officially starts on 15 October 2005 and ends on 15 April 2006.”
Actually, ERO refused or corrected only a few cost items. In 2007, the difference was only about 3 % of the costs. The main difference stems for the reconciliation values related to non-justified income from previous year due to differences in actual and planned costs, which will reduce the allowed revenue for the current year.
It should also be noticed that fuel subsidies reduce the allowed revenues. If they are given in advance (or are known at the time of tariff application), they will reduce the allowed revenue for the respective year. If they are given after tariff approval, they will reduce the allowed revenue of the following year (including interest payments).

Improvement of district Heating in Kosovo 33
Subsidies are obviously not given to fill the gap between approved tariffs and actual costs, but to reduce tariffs. The amount of subsidies used to be based on a political decision of the central government. How this will be handled after municipalization of the DH Companies has to be watched.
Figure 21 shows the costs presented by TERMOKOS and approved by ERO for the heating season 2007/2008.
Major differences refer to:
- Costs of mazut: ERO argued that both the consumption and the projected fuel price were too high. ERO reduced the mazut price to 289 €/tonne. However, the actual price was 312 €/tonne according to financial statement of TERMOKOS and information given on Mazut consumption)
- Staff costs: Differences refer mostly to the division amongst fixed and variable costs, but in total costs have been approved.
The profit was reduced, as ERO did not accept the proposed value of the Regulatory Asset Base presented by TERMOKOS. ERO reduced the number from € 9.98 million to 9.37 million. This difference referred to the book value of existing fixed assets and the validation of new assets (that would be installed in the coming heating season)
An interesting aspect is that ERO accepted bad debts in contrast to the stipulations of the rules for tariff calculation, although ERO emphasizes that this will be accepted only under certain conditions:
- if the sum corresponding to bad debts is included in the revenues
- If such debts are written off from the bookkeeping as void
- If exists adequate evidence of essential unsuccessful efforts for collection of debts.
In total TERMOKOS was able to provoke this for a total amount of € 668.047 out of total debts shown in the expenditure statement of € 2.4 million shown in the expenditures statement.

Improvement of district Heating in Kosovo 34
Figure 21 Cost presentation by TERMOKOS and approved by ERO for the heating season 2007/2008

Improvement of district Heating in Kosovo 35
3.3.6 Subsidies Fuel subsidies have been provided by the Central Government. The subsidies covered a substantial part of the fuel costs (see Figure 22). Fuel subsidies have also been provided for 2009 and, according to TERMOKOS, have been promised for 2010.
Figure 22 Fuel subsidies (€/yr)
TERMOKOS Gjakova
2007 2008 2007 2008
Fuel subsidies 2,636,220 1,914,402 189,692 335,589
Total expenditures 7,597,525 5,845,567 1,354,143 1,164,327
Fuel costs 3,331,661 2,735,508 574,222 475,251
Subsidies per fuel costs 70% 70% 33% 70%
Source: DH Companies and own calculation
Direct subsidies tend to support wasting resources, as incentives to save energy are reduced and the subsidized prices do not reflect the true costs. From an economic point of view, replacing the direct subsidies by targeted subsidies for the low-income households would be more efficient. It is recommended that TA should be provided.
Tariff types and components The tariffs approved by ERO are maximum tariffs and the DH Companies are free to offer lower prices, which would be justified, for example, if a substation were owned by the building owner instead of the DH Company. There are also no special tariffs in case that individual (apartment-wise) heat metering would be applied.
There are two different tariffs:
- The tariff for non-metered customers (“normative tariff”), which is based on estimated heat consumption per square meter. This tariff applies to those customers who are connected to the delivery points (substations) where heat metering is not yet implemented;
- The tariff for metered customers (either at the building or apartment level), based on actual heat consumption measured at the delivery point. This tariff can apply to those customers who are connected to the delivery points (substations).
Each tariff contains two components:
- The fixed component related to the heat capacity – expressed in [€ / m²] for non-metered customers, and in [€ / kW] for metered customers. Fixed tariff component shall be calculated based on the fixed component of allowed revenues;
- The variable component related to the heat delivered to customers - expressed in [€ / m²] for non-metered customers, and in [€ / kWh] for metered customers. Variable tariff component shall be calculated based on the variable component of allowed revenues.
.

Improvement of district Heating in Kosovo 36
Tariffs and cost coverage in Pristina The various tariff components have been translated into an average tariff in the following table5. The numbers are based on the tariffs for metered customers6
Figure 23 Average tariffs in €/MWh
.
2005/06 2006/07 2008/2009
Average tariff 43.07 49.16 48.56
Source: ERO, District heating company and own calculations
The actual tariffs are below the real costs as illustrated by the next table, which is based on the financial statements of TERMOKOS. The table shows:
- Average costs (ERO): total cost that are accepted by the tariff regulation divided by total supplied heat
- Average costs (total): Total costs divided by supplied heat. The main difference to the previous item is that bad debts are included. Bad debts are not accepted by ERO as justified costs.
- Actual average revenue: revenues from heat sales divided by total supplied heat (average and by consumer group)
Figure 24 Costs and tariffs
2,006 2007 2008
Average allowed costs + return on capital*) €/MWh 55.01 68.97 86.25
Average total costs **) €/MWh 88.83 86.66 87.77
Actual average revenue ***) €/MWh 38.31 44.84 50.13
Residential consumers €/MWh 32.82 39.29 44.92
Non-residential consumers €/MWh 47.68 53.98 58.48 Source: District heating company and own calculations
Explanations: *) Average cost prices comprising operational costs plus depreciation and return on capital **) Average total costs: total costs excluding return on capital
***) Related to revenues from heat sales
Due to high costs of bad debts the allowed costs (i.e. cost determined in compliance with ERO rules, but excluding a reconciliation value) plus return on capital used to be far below the total costs. However, due to quick reduction of bad debts in the past years, the gap became smaller and in 2008 both numbers were very close.
It should be noticed that the first table (Figure 23) shows the tariffs by heating season, while the second one (Figure 24) shows numbers for the financial year starting on January 1. However, the big difference is caused by the subsidies, which are included in the tariffs but not in costs. Actual average revenues are closer to the numbers in Figure 23, but cannot directly be compared due to the different time period and due to the fact, that many customers are still charged by lump sum tariffs.
5 The average tariff was calculated as Energy Charge (€/kWh) + Fixed charge (€/kW)/)/(Load duration hours per
year)
6 Ideally, lump sum tariffs and tariffs for metered consumers should be equal. However, the actual heat demand is different and accordingly the actual heating costs per MWh can substantially differ from the tariff for metered consumers. Actual differences can only be determined through metering.

Improvement of district Heating in Kosovo 37
.
Tariffs and cost coverage in Gjakova The following table shows the average tariff per MWh. The average tariffs are based on the tariffs for metered customers.
Figure 25 Average tariffs in €/MWh
2005/06 2006/07 2008/2009
Average tariff 58.52 59.75 54.53
Source: District heating company and own calculations
The approved tariffs are far below real costs as illustrated by the next table, which is based on the financial statements of the DHC. Unlike in case of Pristina, a significant difference between average revenues and approved tariffs occurred. There are several reasons for the differences:
- Particularly the high bad debts, which are costs in the income statement, but are not costs that are accepted by the tariff regulation used to be very high.
- As the tariff is based on a forecast and the regulator my underestimate input price increases or the may try to cushion inflation by accepting only modest input price increases.
- In 2008, the average total costs are below average allowed costs plus return on capital, which shows that the return on capital would more than compensate losses for bad debts.
Figure 26 Costs and tariffs7
2006 2007 2008
Average allowed costs + return on capital*) €/MWh 81.73 103.28 91.51
Average total costs **) €/MWh 131.61 105.37 76.76
Actual average revenue ***) €/MWh 51.67 52.67 33.28
Residential consumers €/MWh 54.42 54.04 35.80
Non-residential consumers €/MWh 47.65 50.67 29.60 Source: District heating company (financial and physical numbers) and own calculations
Explanations: *) Average cost prices comprising operational costs plus depreciation and return on capital. As the regulated asset capital is high, the return is high too.
**) Average total costs: total costs excluding return on capital ***) Related to revenues from heat sales
Tariffs and cost coverage in Mitrovica STANDARD Company reported total direct operational expenditures8
7 The numbers, particularly for 2008, could be misleading. In 2008, the heat production increased, but fuel costs went down. This might be explained by fuel purchased in 2007 but consumed in 2008. However, precise num bers do not exist..
for DH of approx. 20.8 million RSD (approx. 235.000 €) excluding depreciations. Assuming that depreciations amount to 10%, total costs would amount to 22.9 million RSD (€ 258.000). With estimated heat sales of 2.8 GWh average costs would amount to
8 This number shows only those costs that have directly been allocated to DH. STANDARD does not allocate indirect costs.

Improvement of district Heating in Kosovo 38
about 92 €/MWh excluding indirect costs. Currently, 34.150 m² are supplied. Accordingly, the costs amount to 7.6 €.
Figure 27 shows the revenues. The bulk of revenues come from subsidies.
Figure 27 Revenues of STANDARD Company (in thousand Dinar) Total 2007 2008 Sales of goods 28,323 23,236 Income from premiums, subsidies, grants, regress, compensation and refund of tax duties
82,719 91,611
Income on the basis of donations 3,915 127 Income from rental of land income from membership fee Interest income% 1,749 Income from interest on accounts and deposits in banks and other financial organizations
1,749
Dividend income and participation in profit Total 114,957 118,472

Improvement of district Heating in Kosovo 39
4 Assessment of the current DH demand
4.1 Pristina
4.1.1 Peak Load Estimate The peak load estimate was created by using a sample of cold days that have prevailed in December 2008 – January 2009. This resulted in a heat load of 65 MW. However, TERMOKOS has not been able to cover the whole peak load but customers have suffered for deficit of heating services.
While comparing the initial peak load estimate of Pristina, which is 65 MW divided by the connected heated area, to the reference values of other DH systems in the Balkan region, the correction factor of 1,4 was used to multiply 65 MW to result in the real estimate of peak load being 98 MW.
4.1.2 Impact of Disconnections In Pristina, there are no substantial disconnections except some few commercial customers have remained disconnected for several years already. In total, some 2.7 % of the 1.010.000 m² have been disconnected.
4.1.3 Degree-day9
Average of the past 8 years is 2.875 degree days, which is12% higher than the degree days of the heating season of 2008/09 (2.556). Therefore, the factor 1.12 has been used to multiply the energy and fuel numbers for 2008/09 to correspond to the average year.
Adjustment
4.1.4 Other Adjustments In 2008/09 the heat energy has been provided to the customers at water temperatures lower than stipulated, and at low outdoor temperatures, the supply has not met the demand of heat. Moreover, two months of the heating season were without supply. While comparing the specific heat consumption values to the reference values the correction factor 1.4 became evident: 40% was added to the materialized heat production numbers.
4.1.5 Energy Balance Based on the real fuel consumptions, energy sales, adjustments due to heating deficit, degree days and reference values, the below energy balance for TERMOKOS heating in Pristina could be created (see Figure 28). The figure shows the normalized energy balance, i.e., it is based on normative heat consumption numbers as well as on normalized degree-days. The numbers deviate significantly from the actual figures of the last three years. The heat production decreased from 135 GWh/yr in 2006 to 83 GWh/yr to 2008, mostly due to fuel shortages.2006 is
9 Degree days are calculated as the difference between normative indoor temperature and actual average outdoor
temperature during heating season times annual operational hours

Improvement of district Heating in Kosovo 40
regarded to be a year without any significant fuel shortage problem and with relatively high degree days (above 3.000 days). Nevertheless, the heat production is 14% lower than the normative one, which could indicate that the normative heat consumption figures are too large. The high normative heat consumption could be caused by an extremely low design outside temperature of -18 oC that occurs only in for a few hours in a few years.
Figure 28 Energy Balance of the DH System of Pristina
Normal year Prishtina
Fuel173.9 GWh of which
Boiler plant losses 10.5 GWh light fuel oil15.0 % 26.1 GWh 163.4 GWh mazut
Heat production147.8 GWh
DH water network
Network losses Network losses12% 18.3 GWh 2% 0.18 GWh
DH sales120.6 GWh
Residential Hospital70.6 GWh 59% 8.8 GWh
Commercial and Public49.9 GWh 41%
Source: District heating company and own calculations
The energy balance above corresponds to
• the specific heat consumption of 132 kWh/m² , and
• the specific peak load of 97 W/m².
Both numbers refer to final consumption (apartment level).
The normative heat load is significantly bigger than the calculated one. TERMOKOS uses 100 W/m² for residential consumers and 140 W/m² for non-residential consumers, which amounts to a weighted average heat load of 126 W/m² instead of 97 W/m².
Figure 29 shows the number of customers by consumer group
Figure 29 Customer base of TERMOKOS
Source; Termokos 2010
Consumer group No. of Customers Residential customers 9,850 Commercial and budgetary customers 729 Disconnected 1,566 Total 12,145.00

Improvement of district Heating in Kosovo 41
4.2 Gjakova
4.2.1 Peak Load Estimate The current peak load has been reported to be some 5 MW only, partly due to disconnections and partly due to occasionally reduced quality of heating services.
Assuming an average specific maximum heat load of 108 W/m² 10, the total peak load would amount to 15.7 MW, which would be sufficient to cover the normative heat demand for a design outdoor temperature of -18 oC11
4.2.2 Impact of Disconnections
.
In Gjakova, some 39 500 m² out of the total of 185 000 m² is passive connections, which means that the customers either voluntarily heat only a part of their premises or that the DHC has disconnected the customer.
4.2.3 Degree-day Adjustment The climate in Gjakova is a little milder than the one in Pristina, but the same degree-day adjustment of adding 12% was considered justified here as well.
4.2.4 Other Adjustments No other adjustments were done to the heat load.
4.2.5 Energy Balance Figure 29 figure shows the calculated energy balance for the DH system of the City of Gjakova. All numbers are normalized, referring to the normative heat demand and a year with normal (average) degree-days. Moreover, it is assumed that only the currently active connections are supplied. Like in case of Pristina, the actual heat demand in 2008 was significantly below the normalized one, i.e. 15.8 GWh instead of 21.7 GWh. The reason was the same as in Pristina, i.e., fuel shortages.
10
This number is calculated as the weighted average of the specific heat load numbers for residential (100 W/m²)and non-residential customers (120 W/m²). These numbers are used by the DHC of the city of Gjakova.
11 Actually, temperature below -12 oC are achieved very seldom, typically only once or twice a year.
Likely, such low temperature occur also during the night. Therefore the question should be raised, whether a design outdoor temperature of -18 oC is still a reasonable basis for designing the heating system.
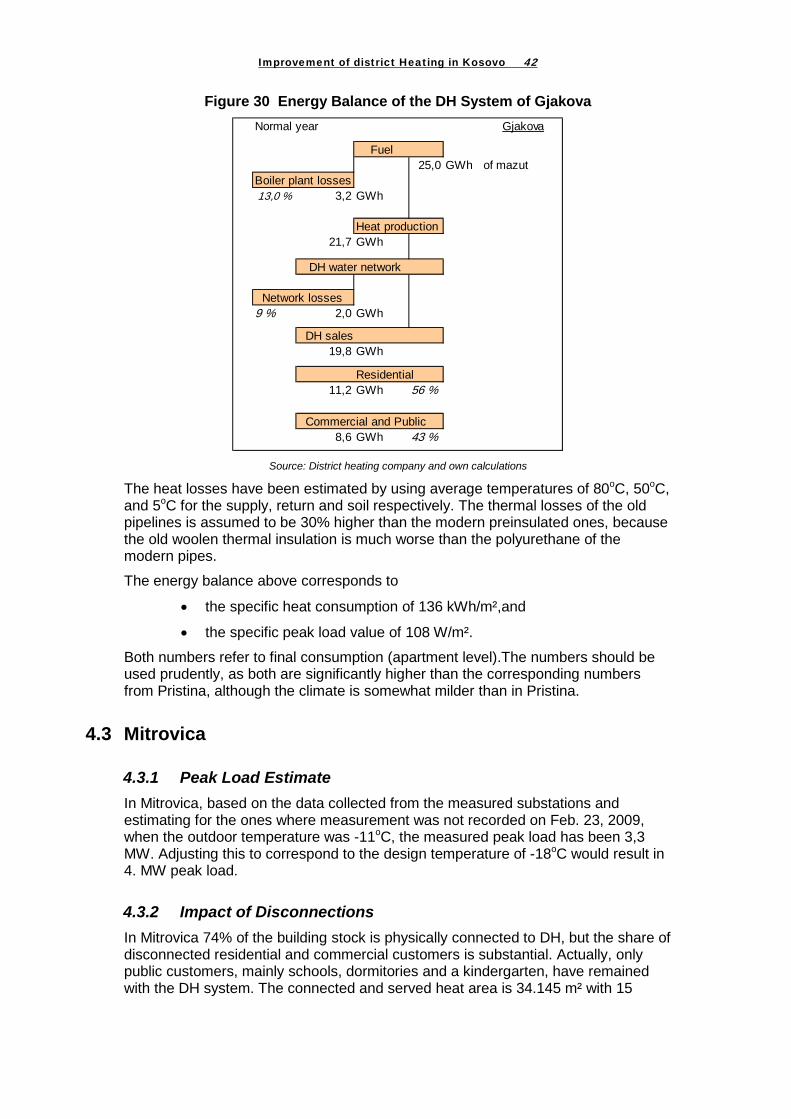
Improvement of district Heating in Kosovo 42
Figure 30 Energy Balance of the DH System of Gjakova Normal year Gjakova
Fuel25,0 GWh of mazut
Boiler plant losses13,0 % 3,2 GWh
Heat production21,7 GWh
DH water network
Network losses9 % 2,0 GWh
DH sales19,8 GWh
Residential11,2 GWh 56 %
Commercial and Public8,6 GWh 43 %
Source: District heating company and own calculations
The heat losses have been estimated by using average temperatures of 80oC, 50oC, and 5oC for the supply, return and soil respectively. The thermal losses of the old pipelines is assumed to be 30% higher than the modern preinsulated ones, because the old woolen thermal insulation is much worse than the polyurethane of the modern pipes.
The energy balance above corresponds to
• the specific heat consumption of 136 kWh/m²,and
• the specific peak load value of 108 W/m².
Both numbers refer to final consumption (apartment level).The numbers should be used prudently, as both are significantly higher than the corresponding numbers from Pristina, although the climate is somewhat milder than in Pristina.
4.3 Mitrovica
4.3.1 Peak Load Estimate In Mitrovica, based on the data collected from the measured substations and estimating for the ones where measurement was not recorded on Feb. 23, 2009, when the outdoor temperature was -11oC, the measured peak load has been 3,3 MW. Adjusting this to correspond to the design temperature of -18oC would result in 4. MW peak load.
4.3.2 Impact of Disconnections In Mitrovica 74% of the building stock is physically connected to DH, but the share of disconnected residential and commercial customers is substantial. Actually, only public customers, mainly schools, dormitories and a kindergarten, have remained with the DH system. The connected and served heat area is 34.145 m² with 15

Improvement of district Heating in Kosovo 43
substations of 54 in total. The total area of the building stock that is physically connected to the 54 substations amounts to about 130.000m² in total.
4.3.3 Degree-day Adjustment The past heating season was milder than the normal in terms of degree-days. Therefore, the reported heat production number has been increased by 12% to reflect the heat production of a normal year. The adjustment factor is same as in Pristina and Gjakova.
4.3.4 Other Adjustments The schools and kindergartens are left without heating during the weekends. In addition, the schools and dormitories are left without heating during the school holidays. Typically heat is supplied from 4 to 8 hours a day depending on the outdoor temperature. Therefore, the recorded specific energy consumption is low. In order to take that into account, 40% was added to the heat production of 2008 being then also on the same level as the previous year.
4.3.5 Energy Balance The boilers are new and modern with heat energy metering. Therefore, the real annual efficiency of the boilers is as high as 93% and 94%.
The heat loss estimate of the network is based on 184 days having the average supply/return/soil temperatures 70oC, 50oC and 5oC, respectively. The thermal losses of the old pipes are estimated to be 50% higher than the ones of the new preinsulated pipes, which a conservative assumption is given some of the old pipes are without any insulation, the main lines 3 and 4, for instance.
Consequently, the heat losses of the network are estimated as high as 30% of the currently produced heat energy. This is because less than 25% of the distribution capacity of the network is in use. The quantitative losses in terms of energy units are rather independent on the energy distributed, because the network is kept hot at all times of the heating season. The heat losses are proportional to the water temperatures of the network and the temperature of the surrounding soil, and regardless on the water flow inside the pipes.
The following figure shows the energy balance of the DH System of the City of Mitrovica. Numbers have been calculated for the active connections and normal degree-days.

Improvement of district Heating in Kosovo 44
Figure 31 Energy Balance of the DH System of Mitrovica
Normal year with disconnections Mitrovica
Fuel4.2 GWh of mazut
Boiler plant losses6.0 % 0.3 GWh
Heat production3.9 GWh
DH water network
Network losses30% 1.2 GWh
DH sales2.8 GWh
Residential0.0 GWh 0%
Commercial and Public2.8 GWh 100%
Source: District heating company and own calculations
The energy balance above corresponds to
• the specific heat consumption of 82 kWh/m² due to solely public customers with periodical heating; and
• the specific peak load value of 120 W/m².
Both numbers refer to final consumption (apartment level).The specific heat load seems to be realistic compared to the numbers in Pristina and Gjakova, as the connected buildings are apparently in a bad shape. However, the buildings require some comprehensive redevelopment measures, which eventually would significantly reduce the heat demand.
Improvement of district Heating in Kosovo 45
5 Heat demand development The heat demand forecast is based on two scenarios:
- Heat demand development with effective demand side measures
This scenario assumes that some demand side measures will be actually implemented. They would basically correspond to the regulatory requirements, which require heat metering and consumption based billing to be applied in the near future. In addition, automatic temperature control will be installed. Based on broad experience from a number of Central and Eastern European countries having had passed economic transition, there will be savings both in required production capacity and delivered heat energy.
Similar projects in Central and Eastern European Countries achieved some 25% savings. However, in accordance with the already relatively low heat consumption savings are prudently expected to be 10-18% in heat energy and 5-9% in capacity depending on the DH system.
- Heat demand development without demand side measures (Business as usual):
This scenario assumes that the implementation of consumption-based billing will be postponed to the far future and that the efficiency of heat supply will not be improved through automated temperature control.
Both scenarios also take into account the probability of reconnections and new connections, mostly to new buildings. For new buildings the same specific heat demand numbers are assumed, as for the time being improved building codes are not expected to come into force.
The heat demand forecast considers new connections only up to the year 2012. The reasons are:
- 2012 is likely the last year of the investment program and correspondingly, necessary investments for the new connections have to be included into the investment program.
- Building stock planning beyond 2012 would be extremely speculative under the current conditions.
5.1 Pristina
5.1.1 Reconnections and new connections Some 12 public and commercial customers since year 1999 and two more since 2004 have been disconnected amounting to 33 900 m² in total. This represents a low share of 3.6% of the total customer base of TERMOKOS. They are expected to remain disconnected to the near future.
In a relatively short period of time the population of Pristina has doubled from some 250.000 to 500.000 and the trend continues. At present, in the entire city, some 20% of the total building stock is connected to DH. In the city center comprising Qentra,

Improvement of district Heating in Kosovo 46
Ulpiana, Dardania and Sunny Hill districts, however, where the DH network exists, some 70% of the potential heated area is already connected to the DH.
The municipality is in process to prepare urban plans to districts in accordance with the city strategy ranging until year 2020. At present, only the urban plan for Dardania exists. The urban plan for Qentra is expected by the end of 2009, but the plans for Sunny Hill and Ulpiana (including Calabria) are in an initial stage.
During the next three years, 2010-2012, some 258.000 m² extension, which is 27% of the actual connected heat area of TERMOKOS, is expected to be connected to the DH system. This will comprise:
• 116.000 m² in Calabria, a residential area being a part of Ulpiana district, of 160 000 m² in total being under construction nearby the boiler plant. The half of the 12 buildings in total are in completion stage and the remaining ones will be completed by 2011.
• 14.000 m² elsewhere in Ulpiana,
• 14.000 m² in Dardania,
• 91.000 m² in the Qentra (center), which comprises the theater, business centers and other mainly public buildings, and
• 25.000 m² of residential load in Sunny Hill being currently under construction.
According to the plans of TERMOKOS, all these buildings will be connected to the existing network with short (50 m per building on average) connection branch pipelines. In view of lacking cost-effective alternative heating systems, the probability is high, that these buildings will actually be connected to DH.
Figure 32 shows the new connections envisaged by TERMOKOS for the period 2009-2012.
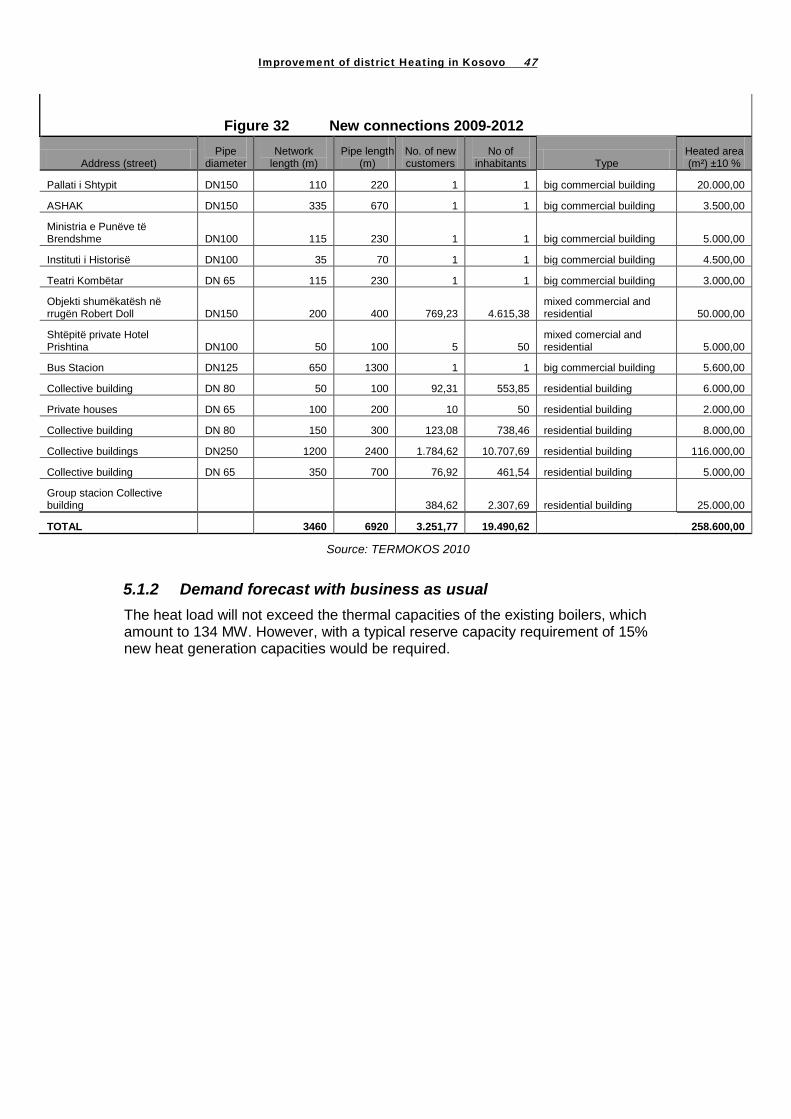
Improvement of district Heating in Kosovo 47
Source: TERMOKOS 2010
5.1.2 Demand forecast with business as usual The heat load will not exceed the thermal capacities of the existing boilers, which amount to 134 MW. However, with a typical reserve capacity requirement of 15% new heat generation capacities would be required.
Address (street) Pipe
diameter Network
length (m) Pipe length
(m) No. of new customers
No of inhabitants Type
Heated area (m²) ±10 %
Pallati i Shtypit DN150 110 220 1 1 big commercial building 20.000,00
ASHAK DN150 335 670 1 1 big commercial building 3.500,00
Ministria e Punëve të Brendshme DN100 115 230 1 1 big commercial building 5.000,00
Instituti i Historisë DN100 35 70 1 1 big commercial building 4.500,00
Teatri Kombëtar DN 65 115 230 1 1 big commercial building 3.000,00
Objekti shumëkatësh në rrugën Robert Doll DN150 200 400 769,23 4.615,38
mixed commercial and residential 50.000,00
Shtëpitë private Hotel Prishtina DN100 50 100 5 50
mixed comercial and residential 5.000,00
Bus Stacion DN125 650 1300 1 1 big commercial building 5.600,00
Collective building DN 80 50 100 92,31 553,85 residential building 6.000,00
Private houses DN 65 100 200 10 50 residential building 2.000,00
Collective building DN 80 150 300 123,08 738,46 residential building 8.000,00
Collective buildings DN250 1200 2400 1.784,62 10.707,69 residential building 116.000,00
Collective building DN 65 350 700 76,92 461,54 residential building 5.000,00
Group stacion Collective building 384,62 2.307,69 residential building 25.000,00
TOTAL 3460 6920 3.251,77 19.490,62 258.600,00
Figure 32 New connections 2009-2012

Improvement of district Heating in Kosovo 48
Figure 33 Heat demand forecast for Pristina without DSM
Gjakova - Forecast without DSM
0.0
20.0
40.0
60.0
80.0
100.0
120.0
140.0
160.0
180.0
2007 2008 2009 2010 2011 2012 2013 2014 2015 2016 2017
Heat sales GWh/yr
Heat load required from sources MW
Source: District heating company and own calculations
5.1.3 Demand forecast with consumption based billing (DSM) The heat load would not exceed the current available heat generation capacity, but reserve capacity would be low (only about 10 MW).
Figure 34 Heat demand forecast for Pristina with DSM
Gjakova - Forecast with DSM
0.0
20.0
40.0
60.0
80.0
100.0
120.0
140.0
160.0
2007 2008 2009 2010 2011 2012 2013 2014 2015 2016 2017
Heat sales GWh/yr
Heat load required from sources MW
Source: District heating company and own calculations
5.2 Gjakova
5.2.1 Disconnections In Gjakova, disconnections amount to 26.3% of the total customer stock connected to the district heating system. The DH Company believes that there is no reason to expect the disconnected customers be largely reconnected in the near future, say 3-5 years, because either they have constant affordability problems, due to high level

Improvement of district Heating in Kosovo 49
of unemployment and low salary levels in general, or they have an alternative heat source already. Representatives of the municipality, however, have a different opinion. They believe that the high disconnection rate is caused by lacking consumption-based billing. Therefore, the business-as-usual scenario assumes no reconnections, while the alternative scenarios assumes that 2/3 of the disconnected area will be reconnected until 2013. Reconnections will start once consumption based billing is applied, which is assumed to start in 2010/2011.
5.2.2 Expansions Along the existing network, there are some 400.000 m² of buildings either already existing or being under construction that can be connected in the next five years. Realistically, 60.000 m² per year in the years 2010-2014 is expected comprising 80% of residential and the balance of 20% of public customers. The potential customers are in the old downtown located on both banks of the river as well as east of the main pipeline heading south from the boiler plant.
In addition, a new Rezina area with the planned 300.000 m² is expected northeast of the boiler plant, but little or nothing is expected to DH by year 2014.
5.2.3 Demand forecast with business as usual In compliance with the projected development of the building stock within the coming 3 years, the connected area will more than double according to the estimate of the DH Company. However, DH might not be attractive without consumption-based billing. Therefore, there are some doubts whether the DH Company will actually be able to connect all these new buildings. The risks associated with the planned network expansion have prudently to be assessed.
Figure 35 Heat demand forecast for Gjakova without DSM
Gjakova - Forecast without DSM
0.0
5.0
10.0
15.0
20.0
25.0
30.0
35.0
40.0
45.0
50.0
2007 2008 2009 2010 2011 2012 2013 2014 2015 2016 2017
Heat sales GWh/yr
Heat load required from sources MW
Source: District heating company and own calculations
5.2.4 Demand forecast with consumption based billing (DSM) In addition to the assumption described above, it is assumed that starting with project implementation 80% of the passive consumers will reconnect successively within a period of three years. Moreover, it is assumed that all buildings that are under construction or are planned to be constructed within the coming three years, will actually be connected to the DH System. However, even if conditions are better

Improvement of district Heating in Kosovo 50
due to consumption-based billing, some building owners may refuse to be connected or connections develop slower than anticipated.
Figure 36 Heat demand forecast Gjakova with DSM
Gjakova - Forecast with DSM
10.0
15.0
20.0
25.0
30.0
35.0
40.0
45.0
2007 2008 2009 2010 2011 2012 2013 2014 2015 2016 2017
Heat sales GWh/yr
Heat load required from sources MW
Source: District heating company and own calculations
5.3 Mitrovica North
5.3.1 Disconnections All residential customers have disconnected, only 15 of 54 substations are in use, the pipeline to south part of Mitrovica is not in use at all, not even to the nearby buildings on the street. Of those 15 that operate 9 supply commercial customers and 6 supply public customers.
The breakdown of the 54 substation is as follows:
• Residential: 18 substations exist in residential buildings, but there is neither primary nor secondary connection piping to supply them heat from the network. Due to electricity free of charge, the customers are not connected even in cases the physical connection would exist.
• Commercial: 9 commercial substations operate
• Public: Of 27 substations in public premises, 6 operate but 21 are disconnected. Those 6 customers pay in kind: mainly by giving mazut against received heat.
The disconnections are most typical in line 2 of four lines in total. In line 2, some 80%of the customers are without secondary networks. In line 1, the main customer is the medical center situated at the end of the 1 km long pipeline, whereas most buildings near the pipeline are not connected.
5.3.2 Opportunities for DH Expansions in the North According to STANDARD Company, the heat load may expand, if the electricity price will substantially increase relative to price of mazut. The expansion would take place in the following ways:
• 60.000 m² based on the new constructions being under way in the city center;

Improvement of district Heating in Kosovo 51
• 20.000 m² in case the neighboring Zvecan city will be connected with a 1 km long pipeline. In the city, the DH system already exists but the heat source vanished in the down-sizing of the Strepa mining company; and,
• 90.000 m² in case the disconnected residential and commercial customers that already have substations will start reconnecting
5.3.3 Expansion in the south The possibility of supplying heat from the Standard boiler plant located in the north to the south part is technically possible for some 60.000 m² with the current pipeline. The south part, however, neither has outdoor nor indoor networks ready.
All possible extensions mentioned above together with the existing load, would amount to some 370.000 m², about 35 MW, which seems to exceed the existing production capacity of 28 MW. Some of the expansion opportunities, however, are more realistic than the others. In addition, the specific heat load of the customers may decline when consumption based billing will be introduced, based on the already existing heat meters in the substations.
5.4 Mitrovica South A heat demand forecast has not been prepared because this part of the city does not have a working DH system.

Improvement of district Heating in Kosovo 52
6 Centralized DH versus alternative heating options
In the long term, there may be natural gas available in Kosovo, since the pipeline from Skopje to Pristina already exists but has not been used in some 20 years. However, the world market prices of natural gas and mazut are strongly interlinked: sometimes gas is more expensive than mazut, at the other times vice-a-versa. Regarding Mitrovica, the nearest gas connection point is in Kraljevo, 150 km away and without pipeline now. Therefore, individual gas heating when coming afterwards to a district heating area, will not economically overrun mazut-fuelled district heating. Additionally, district heating has the unique advance to both use alternative fuels and be connected to CHP that individual gas heating does not have. Therefore, strategically individual gas heating would be a poor option while excluding alternatives in case either availability or price of gas becomes a problem.
In the short term, there is no alternative to district heating in urban areas other than electric heating, as now, and individual lignite/wood heating. The latter shall be deemed not to come due to environmental reasons: individual solid fuel firing in densely built urban areas would lead to disaster with bad air quality and serious health problems.
Under the prevailing tariff system, there are various options for private households. With a 2-rate meter consumption during day and night time is charged with different rates. A 1-rate meter does not distinguish between time of consumption and non-metered consumers have to pay a lump sum according to the estimated consumption. Accordingly, private households have to pay the fixed charge independently of whether they use electricity for heating and they will pay the lowest charge for their normal electricity consumption. If electricity is used for heating, most consumers will likely have to pay the higher tariff for consumption higher than 200 kWh/month. Assuming that ¾ of the consumption is during daytime, they have to pay at least 0.75 * 6.43 cts/kWh + 0.25 * 3.22 cts/kWh = 5.63 cts/kWh.
If total consumption exceeds 600 kWh/month, the additional consumption will be charged with the highest tariff.
Figure 37 Electricity tariffs (01/04/09)
2-rate meter 1-rate meter Lump sum
Day time Night time
Fixed charge €/yr 25.00
< 200 kWh cts/kWh 4.64 2.33 4.13 €/month 21.50
200-600 kWh cts/kWh 6.43 3.22 5.73 €/month 51.73
> 600 kWh cts/kWh 9.33 4.66 8.31 €/month 63.58
Source: ERO, Tariffs for 2 rate meters are only given for the high tariff season, which is from Oct.1 to March 31

Improvement of district Heating in Kosovo 53
Although tariffs have not substantially been raised in the past years 12
The following figure shows the results of a model calculation for electric heating. Since the price in the future is unknown, the price ranging is varied from 6 to 10 cts/kWh. In addition, the costs of heating devices have to be taken into account, which is estimated to amount to equipment costs of € 250 per apartment. Applying an annuity of 10% (covering interest rates and maintenance costs) the annual fixed costs would amount to € 25. The fixed charge of € 25.00 for electricity supply (see
customers started to look for alternatives, which is district heating. The costs of electric heating depend mostly on the price of electricity.
Figure 36) is not taken into account, as this charge does not represent incremental costs caused by electric heating (the fee have to be paid anyway for lightning etc.). Heat consumption is based on assuming an apartment area of 60 m² and a heat consumption of 0.145 kWh/m², yr and the size of the apartment is 50 m².
Figure 38 Costs of electric heating
0
2
4
6
8
10
12
14
16
50 60 70 80 90 100
electricity energy charge €/MWh
Hea
ting
cost
s €/
m²,y
r
There is a rule of thumb, based on a large number of heating cases in Europe and Asia, stating that the heat load densities higher than 3 MWh/km of heat sales per network length are sustainable for DH, whereas those being lower than 1 MWh/km are seldom. Pristina exceeds the value of 3, whereas the numbers in Gjakova and Mitrovica are very low. The low heat load numbers in Gjakova and Mitrovica are largely caused by buildings that are either disconnected from the DH system or that have never been connected to DH before, although there was an intention to connect them. After having those connected, the heat load density values would achieve the value of 3 MWh/km, which is the common rule of thumb for a sustainable DH system. Actually, expanding DH to areas with heat load density even lower than 1 MWh/km is under consideration in several countries in Europe.
To assess the competitiveness of DH in the longer term, some issues have to be taken into account:
12 In 2000, the tariff for residential consumers was 6.39 cts/kWh independent of the size of consumption.

Improvement of district Heating in Kosovo 54
- Current prices and (specific fixed) costs are distorted. Tariffs are highly subsidized and costs are burdened with the high rate of disconnections, particularly in case of Gjakova and Mitrovica.
- Final consumers make their decisions typically based on current prices rather than considering longer-term developments. That means they will look for the current subsidized prices. DH Companies will do the same, as long as the difference between actual costs and tariffs is covered by subsidies. Under the current conditions, there is a clear advantage for DH at least for new buildings. The figure below shows the costs for heating of domestic consumers in dependence of the energy charge (the so-called active energy charge. Even if DH tariffs would be increased to a cost covering level, there would be an advantage for DH. Current cost prices (i.e., total costs excluding bad debts divided by total heat supply) amount to about 77-88 €/MWh (but about 100 €/MWh in Mitrovica due to the currently low connection rare)13
- above and a current electricity charge of 6-7 cts/kWh total heating costs using electricity would amount to 9-11 cts/kWh. This is significantly higher than the current DH tariffs.
, which is below the electric heating option. These costs can significantly be reduced by the proposed investment programs and by fostering reconnections.
- Owners of existing and new buildings may have a different view about cost of electric heating. While owners of apartments in new buildings have to invest in electric heaters, those in the existing building stock are already equipped with them. These consumers will only compare the electricity tariff with the DH tariff. Nevertheless, the current DH tariffs are below 50 €/MWh, which is substantially below the electricity price.
- Increasing demand for electric heating would result in increasing electricity generation costs as additional plants have to be built or expensive electricity imports would be necessary
- From the point of view of energy security, it could be argued that electric heating would be advantageous as national resources are used. However, this argument is not reasonable as long as electricity has to be imported. Moreover, at least in case of Pristina, heat supply could be based on CHP in future and in this way, the national resources would be used.
- A disadvantage for DH is the lacking internal centralized heating system in many buildings. Costs for a corresponding reconstruction are estimated to be in the range from 15-22 €/m² 14
. Adding this to the proper DH costs, total costs would likely be still below the costs of electric heating
13 See Annex 11.11
14 This number is based on experiences of TERMOKOS and DHC Gjakova

Improvement of district Heating in Kosovo 55
7 Investment Strategy
7.1 Longer-term strategy for the development of the heating system
7.1.1 Converting supply driven DH systems to demand driven ones The main problems of the DH systems in the three cities are:
• High dependence on fossil mazut fuel. In the near future, price hikes of fossil fuels have to be taken into account, which directly affect the heating costs in the cities.
• High water losses are suffered by all three DHC, which is an indication that the water quality may not be always of the required quality. Low quality water is causing corrosion of pipes and armatures and blocking of heat exchangers.
• Frequent damages in the networks are an indication of both poor water quality and old pipes. With a good quality of water, pipelines could stand longer than the designed lifetime.
• High staff numbers in the new situation to come, where substations and boilers start to be automated and remote monitored, and the office operations be computerized.
• Mainly ad-hoc based maintenance practices have resulted in repairing damages in networks, substations and boilers after the damages have occurred, and often with delays. The delayed repairs have caused both direct and indirect costs being higher than if having had done on preventive basis. Modern preventive maintenance practices would be based on a database, often a computerized but a manual database can be workable as well, and on systematic planning of measures and monitoring of maintenance performance.
DH systems all over the world can be divided into two main categories: supply and demand driven systems. The main difference is in the system concept, which is designated either, ‘Supply driven’ used to be common to Central and Eastern Europe and most of northern Asia, or ‘Demand Driven’ typical to Western Europe and increasingly in the other parts of Europe. The differences can be further summarized as follows:
In Kosovo, as in most economies in transition, the DH system has been supply driven so far. This means that the heat production plant regulates the heat energy delivered to the customers. This results in an unbalance of the production and the real need of heating, because no or little metering information is available from the customers’ side and no/little control exists in buildings. Neither has the customer any other technical means to compensate the unbalance than ventilate the excess heat out from the windows or add personal clothing while the deficit of heat prevails.
In most EU member countries the DH systems are demand driven already. In a demand driven system the key is the consumer substation. The substation located in the basement of each building, as is the trend in Kosovo as well already, is equipped with a temperature controller. The controller automatically adjusts the supply temperature of the secondary network according to the prevailing outdoor temperature and the preset building specific heating needs. Therefore, the

Improvement of district Heating in Kosovo 56
substation takes heat from the network as much as needed, neither more nor less, thus providing the system with demand driven control. In the demand driven mode, the heat sources have to follow the actual needs caused by the individual substations continually and to adjust the heat production accordingly.
Figure 39 Consumer substation with a heat exchanger, heat meter, and temperature controller
Borders of substationOutdoortemperature
Supply T
from DH TFloorheatingelements orroomradiators
T
Pump Indoor piping
Return to DH T
Flow meter
The control valve!
Heat meter
Control unit
The above differences in operating philosophy result in a number of implications in four areas discussed further below with regard to (i) economies in transition and (ii) EU member countries. The main implications affect
- load dispatch
- reserve capacity
- sizing of the network
7.1.2 Load dispatch The heat transmission networks are operated in a radial mode in the transition economies and in a looped mode in EU member states. In the radial system, only one heat source is allowed to supply heat at any one time, as illustrated in the next Figure on the left. There is no load dispatch except at the heat source. The physically existing loops in the network are closed with valves. The customer obtains heat from one direction only and from a single heat source.
In the looped system typical in EU member states, there can be a number of different heat sources operating in a united network in parallel, thus allowing the free load dispatch to maximize economic benefits, as illustrated in next Figure on the right. The customer may get heat from various directions in a looped system, which improves reliability.

Improvement of district Heating in Kosovo 57
Figure 40 Operation with individual (left picture) and joint dispatch (right picture)
0
0,1
0,2
0,3
0,4
0,5
0,6
0,7
0,8
0,9
0 750 1500 2250 3000 3750 4500 5250 6000 6750 7500 8250
CHP Boiler 1 Boiler 2 Boiler 2
0
0,1
0,2
0,3
0,4
0,5
0,6
0,7
0,8
0,9
0 1000 2000 3000 4000 5000 6000 7000 8000
Hea
t Pro
duct
ion
CHP Boiler 1 Boiler 2 Boiler 2
In the figure the load curves for the various heat sources are shown assuming a DH system with various service areas. The left diagram shows the load curve for a system where each service area is supplied by its own heat source and the total load curve of the DH system is the sum of the individual load curves. The diagram on the right shows the same DH system, but the various heat sources supply the whole system (usually according to a merit order), i.e., the plant with the lowest heat price (or lowest costs, usually a CHP) supplies the base load, and the one with the highest price (or costs) the peak load.
7.1.3 Reserve Capacity In the radial system the reserve capacity has to be located at the same site where the main (single) heat source exists and sized at 50-100% of the real heat load. In case of network damages, the reserve capacity may not be more helpful than the operative capacity, if the critical transmission pipe is broken. In a city, there are typically a number of separate radial systems, each requiring their own reserve capacity. Therefore, the construction and maintenance costs of such a large reserve capacity are relatively high.
In the looped system the heat sources can be located all over the city and connected to one united network, thus supporting each other. Therefore, little excess reserve capacity, about 10% of the real heat load, is needed and the different locations are alternative ways to by-pass the damaged network section, provided there are several heat sources in the DH system. In this way the cost of reserve capacity remains modest in the modern and looped networks.

Improvement of district Heating in Kosovo 58
Figure 41 Examples of radial and looped networks
Radial Looped
7.1.4 Designing and sizing of the heat network The water flows in the radial systems are relatively big, because the cooling (difference of the supply and return water temperatures) is low. In the constant flow system, the radial type network and the tube heat exchangers with poor cooling properties cause big water flows, requiring large and expensive pipelines.
The water flows in the modern systems are reasonably small, because the cooling is high and networks are looped. Therefore, the pipelines are relatively small in diameter as well.
Therefore, to change the operating philosophy from supply to demand driven type systems, rehabilitation of substations is the key element. Nevertheless, the substation investments should be well coordinated with the possible investments in remote control systems, in order to obtain the expected benefits.
7.1.5 Addressing water losses and quality Due poorly insulated pipes and external water problems in Kosovo, the water losses are high, which is not only the cost of water but the heating energy used to warm it up, and most of all, the poor quality of water caused by insufficient water treatment capacity. Usually, the water treatment capacity has not been sized according to the excessive water losses.
In EU countries, and now in Kosovo as well, the customers are connected with heat exchangers, which effectively cuts off the water losses in the secondary network, and simultaneously improves the water quality. Therefore, the remaining problem is the leaking pipelines and old tube heat exchangers that need to be replaced with preinsulated pipelines and plate heat exchangers.
7.1.6 Preventive maintenance Regarding improved maintenance, the DHC should convert the maintenance practices from the current ad-hoc based to systematic and preventive maintenance ones, which would cover management of:
• both make-up(treated) and circulation water quality;
• technical performance of substations by means of analyzing the remote monitoring system provided data; and,
• running components: systematic replacement of consuming parts of the running components such as pumps, fans and valves when optimal. Each component should have a planned replacement/service interval, which should be followed. The

Improvement of district Heating in Kosovo 59
measures carried out as well as the visual observations done should be recorded for adjusting further the maintenance planning.
In order to face out corrosion, blocking and energy losses due to excess use of poorly treated water in large volumes, the below picture is to present the logical steps to proceed.
Figure 42 Logical framework of phasing out corrosion and blocking of DH systems
Objective
Measures
Indicators
Elimination of external
corrosion
Preinsulated pipes
Improved water quality
Preinsulated pipes
Plate heat exchangers
Improved capacity of
water softening
Oxygen removed from
water
Elimination of internal corrosion
Reduced water losses
7.1.7 Combined and separate heat and power production Combined heat and power (CHP) production or cogeneration means the simultaneous production of two types of useful energy from a single fuel source. In most CHP applications chemical energy in fuel is converted to both mechanical and thermal energy. The mechanical energy (rotation) is generally used to generate electricity, while the thermal energy is used to produce steam, hot water, or hot air.
The principal technical advantage of a CHP system is its ability to produce (“extract”) more useful energy from fuel compared to traditional (“separated”) energy systems (SHP) such as conventional power plants that only generate electricity and industrial/heating boiler systems that only produce steam or heat. By using fuel energy for both, power and heat production, a CHP system can be very energy efficient and have the potential to produce electricity or heat, or both, below the prices charged by local heat and electricity distribution companies for separate production. These two situations are illustrated and compared in Figure 41.

Improvement of district Heating in Kosovo 60
Figure 43 Comparison of energy efficiency of CHP and SHP
Thermal Power Plant
Efficiency η=30%
Heating Boiler Plant
Efficiency η=80%
CHP Plant
TPP Fuel
Boiler Fuel
CHP Fuel
Loss
es
Loss
esLo
sses
31
Electricity
52
Heat
Electricity
Heat
72
13
17
103 (=31/0.3)
65 (=52/0.8)
Total Efficiency = 49% (=31+52/103+65)
Total Efficiency = 83% (=31+52/100)
CHP: 5 MW Natural gas Combustion Turbine
100
Every CHP application involves the recovery of otherwise wasted thermal energy to produce useful heat. As CHP is highly efficient, and it reduces emission of air pollutants and carbon dioxide, the leading greenhouse gases associated with global climate change. Optimal conditions for implementing cogeneration occur when the price of electricity is relatively high and rising, and the price of fuel is low.
The disadvantage of cogeneration is that the time wise demand of heat and electricity of the customers can deviate strongly from each other, whereas heat and electricity are always generated at the same time.
To use cogeneration in the most efficient way, the heat demand is separated into base and peak load. Only the base load should be covered by CHP plant, while the peak load demand is provided by peak heat-only boilers. Additional heat storage systems are sometimes used to get longer utilization periods and higher efficiencies. The heat storage system can be a special hot water tank as well as the network that can be charged during the time of lower demand and discharged later on.
CHP and DH District heating (DH) is one of the three main applications of cogeneration. The heat provided by cogeneration is well suited to provide space heating and hot water for domestic, commercial or industrial use. A feature of cogeneration driven district heat is the option of fuel diversity to meet environmental, economic or strategic priorities. For example, DH systems are sometimes based on the incineration of municipal waste, and with adequate emission controls is a better environmental solution than disposing waste to landfill. DH systems are also able to use biomass.

Improvement of district Heating in Kosovo 61
The use of natural gas as a fuel gives added flexibility to district heating systems. Engines, providing electricity and heat, in combination with boilers, can introduce more cogeneration into existing DH networks.
The operation of a DH network faces a unique set of challenges. Modern distribution pipes have made it economic to transport heat over considerable distances but the costs are still pretty high. New networks require extensive civil works, and the appropriate permissions for planning and access are expensive and time consuming. Historically the costs of connecting building networks have been subsidized by local or national government but this type of funding is no longer as readily available as it has been in the past.
TPP KOSOVO B TPP KOSOVO B, shown in Figure 42, is a thermal power plant with two blocks of the same design (B1 and B2). The total nominal power capacity is 2x339 MW(el) and net nominal output is 618 MW(el). The plant is located about 10 km from Pristine by road. The plant uses lignite from the "Belacevac" mine.
Figure 44 TPP Kosovo B
Figure 43 shows the technical scheme of TPP Kosovo B. TPP Kosovo B is still a relatively modern subcritical plant with still actual parameters. The two blocks of TPP Kosovo B were, when constructed, the largest thermal blocks in former Yugoslavia.
Figure 45 Technical scheme of a block of TPP Kosovo B
E-1
E-3E-4
E-5
E-6
E-7
E-9 E-10 E-11 E-12 E-13E-14E-15
P-1
P-2P-5
P-7 P-9
P-11
P-12 P-13
E-16E-17
E-18
P-25
P-26P-27
P-28
E-19
P-30
Source: KEK

Improvement of district Heating in Kosovo 62
TPP Kosovo B uses five surface regenerative feed water heaters and a de-aerator. According to the turbine supplier, some of the regenerative heaters can be eliminated and such options were examined by IBE15
TPP Kosovo B is certainly the most important electric energy generating facility in Kosovo.
.
Figure 44 shows the relative production of electricity of TPP Kosovo B for the period 2004 – 2008. It is obvious that TPP Kosovo B participated during the whole period between 2004 and 2008 with more than 60% in total production, import and exchange of electrical energy in Kosovo. The peak was during 2005 when TPP Kosovo B participated with 73%. In later years the participation dropped to slightly over 60% because of the improvements of the reliability of TPP Kosovo A, increased import and deterioration of performances of TPP Kosovo B.
Figure 46 Participation of TPP Kosovo in total electricity supply
Source: KEK own calculations
According to information published by the Regulatory Office in their Annual Report for 2008, TPP Kosovo B1 operated with a capacity of 290/265 and TPP Kosovo B2 with 280/260 MW. The larger figures relate to generator, the lower to plant exit. The numbers are the consequence of deteriorated performance of the low-pressure cylinder and problems with last stages of the turbine blades. However, new LP turbine rotors (shaft + wheels) have been ordered from the turbine deliverer, and the previous performances will be restored.
In view of its capacity, reliability, and importance of TPP Kosovo B for energy stability of Kosovo, it is quite realistic to predict that TPP Kosovo will operate for longer period and once, when time comes, would experience regular lifetime extension procedure.
So, practically, because of the uncertain future of TPP Kosovo B, and the probably time consuming procedure to develop TPP Kosovo C, TPP Kosovo B is almost unique appropriate and available candidate for cogeneration.
Technical CHP concepts
Figure 45 shows the basic technical scheme of heat supply from TPP Kosovo B as proposed by two studies (IBE and the ESTAP16
15
IBE, Kosovo Combined Heat and Power Feasibility Study, Ljubljana, 2005
) study, The main components are the steam extraction from the turbine, heat exchangers, and a pump station located close to TPP Kosovo B, two pre-insulated pipes pipeline with a length 2 x 10.5 km
16 ESTAP, ENERGY SECTOR TECHNICAL ASSISTANCE PROJECT (ESTAP) KOSOVO, World Bank
Grant No. TF-027791, Module H “District Heating“ Final Report, 2002

Improvement of district Heating in Kosovo 63
and heat exchanger and pump station located in Pristine downtown (location of TERMOKOS).
Figure 47 Scheme of CHP supply to Pristina
TPP Kosovo B Termokos
HX and Pump Sttion
HX and Pump Station
Preinsulated pipeline
DH Network
P
F
T
The detailed study performed by IBE proposed that steam should be extracted from the main steam pipeline between medium pressure and low-pressure turbine cylinders, as it is schematically shown in figure 19. This solution is technically simple because it requires only cutting the main steam pipeline and installing a throttling valve. The extraction of steam would be regulated by opening and closing the throttling valve. However, such solution has an inherent disadvantage. This is related to fact that steam is extracted at pressure of 2 bar and temperature of 220 - 240 °C. This implies a technically unnecessary loss of exergy, because steam with high potential is used for producing low temperature heat for district heating. This has some essential practical and economical aspects. The practical aspect refers to the importance of TPP Kosovo B for electricity generation in Kosovo. Historically, TPP Kosovo has been contributing between 60 and 70% of the total electricity balance (including import and exchange) of Kosovo. Practically, each MWh is important, and consequently all viable possibilities for minimizing electricity losses caused by cogeneration should be considered. For the time being, such losses could only be substituted only by imported electricity. Moreover, due to the coincidence of electricity and heat demand, the price of imported electricity will be high during most part of the heating seasons.

Improvement of district Heating in Kosovo 64
Figure 48 Scheme of heat extraction proposed by former studies
Source: KEK
Both studies proposed a transmission pipeline with diameters of 2 x 450 mm. ESTAP proposed to utilize the existing aboveground pipeline installed during 90ies. IBE concluded in its study that this pipeline cannot be used anymore and proposed the construction of a new 450 mm underground line with pre-insulated pipes.
Sizing the CHP facilities The size of the cogeneration facilities depends on two main factors:
- the demand for DH
- the share of heat that shall be produced by the proper CHP facilities and peak boilers (HoB)
The “ESTAP” study proposed that the capacity of steam extraction and heat stations should be 90 MW(th). This capacity would exceed the heat load, when outside temperature is -13 °C that is the temperature IBE proposed to be used as design temperature. In their study IBE proposed a capacity of cogeneration of 58 MW(th), which represents, according to their estimate, 70% of the load at an outside temperature of -13 °C. If the average rate of new consumers to district heating in last a few years is taken into account, it becomes evident that both figures are too optimistic and overestimated.
The ESTAP study proposed that both units, B1 as well as B2, should be enabled for extraction of 90 MW(th). This should be understood as a means to improve the reliability of heat supply by using redundancy. It sounds reasonable, at first glance. However, in view of the fact that TPP Kosovo B operates very reliably, and that the

Improvement of district Heating in Kosovo 65
current capacity of TERMOKOS’ two main boilers is 2 x 58 MW(th) the redundancy appears to be excessive.
The study prepared by IBE is based on the assumption that domestic hot water could be supplied to DH customers. This is an interesting idea, but at the moment there are no technical possibilities for domestic hot water service offering in TERMOKOS. The current investment program prepared for TERMOKOS includes a small component for a DHW pilot project, but the DHW market would remain quite small in the coming years, particularly as the conversion of existing buildings will be difficult and expensive. For existing buildings, that shall be connected to DH and which need indoor piping the combined installation of space heating and domestic hot water could become a viable option.
A rule of thumb says that the base load produced by cogeneration should not exceed 50% of the total maximum load. In practice the least cost solution is typically in the range of 10% to 50%. A base load capacity of 50% would deliver about 90% of heat needs in the heating season.
Anyhow, careful analysis and optimization should are required to identify the best solution. As already mentioned, the least cost option and the optimal design of the CHP concept depend to a large extent on the heat demand for which the plant will be designed. A careful DH market study should determine the economically feasible DH market, which will constitute the base for determining the size of the CHP facilities and the diameter of the transmission pipeline. It also has to investigate whether and to what extent the new pipeline can use the route of the old one.
Recommendations for the next steps Converting CHP is a reasonable option, but the concept has to be updated and optimized. Therefore, alternative CHP concepts should be investigated, an alternative concept is that one turbine (either B1 or B2) would be modified by adding one or two extraction points at two different relatively low pressures/temperatures. The heat exchanger station could be designed modularly to supply 50%, so additional capacity of heat exchangers could be added, when it the heat demand will grow. The need of the large heat exchanger station has to be revisited, because the investment plan proposed in the study report at hand will convert the DH system of Pristina to a 16 bar system with heat exchangers in the building entrances anyway. Therefore, the large heat exchanger station may not be needed between the long transmission pipeline and TERMOKOS’ distribution network.
7.1.8 DH Strategy The proposed strategy can be broken down into several phases, which describe the conversion from the outdated supply-driven business model to a sustainable demand-driven one.

Improvement of district Heating in Kosovo 66
Figure 49 Phases of the DH Strategy Higher
efficiencyand
lower 6 Renewable fuelsemissions 5 Introduction of CHP
4 Introduction of centralised DHW3 Consumption based billing
2 Heat metering1 Substations with temperature control
Development steps
Two of the three cities (Pristina and Gjakova) are already taking the 3rd step in the above diagram.
Regarding the 4th step, the centralized DHW has suggested to be a pilot project in Pristina that would provide valuable experience to the whole country. CHP becomes more viable the longer the plant can operate in cogeneration mode. Space heating is only needed during the heating season, while DHW is needed all over the year.
There are some cities in Europe that did not have centralized DHW in the past. One of them is Krakow, Poland. The district heating company of Krakow, MPEC, started to introduce centralized DHW services to their customers about ten years ago, and by today, almost all customers are with DHW served by DH. As heat sources, there are two CHP plants, EC Skawina and EC Krakow, that sell heat to MPEC, which takes care of heat distribution and sales to the DH consumers in Krakow.
The centralized DHW, as is the common practice elsewhere in Europe, is integrated with DH supply. The same two pipes that are connected to the buildings provide hot water both for room space and DHW heating. The difference is in the substations: instead of having one heat exchanger for space heating, there are two heat exchangers in parallel, one for space heating and the other one for DHW. Both heat exchangers are equipped with separate control systems and circulation pumps, of course.
The increment investment costs of having one more heat exchanger in the substations are relatively low. There are no investments needs in networks, because DHW if delivered to the whole customer stock of the DHC, could increase the peak load by some 10% and the water flows in the network hardly at all, because the increased temperature difference, due to DHW production in substations, will keep the water flow at the level it used to be. So no additional investments in the networks are needed due to DHW introduction.
In order to phase out the economic impact of high summer time losses of centralized DHW, the heat energy should be a kind of waste heat that has little or no economic value. Such is the case very much with the heat produced by the CHP plant: there is no CHP electricity production if there is no place where to put the waste heat. District heating with DHW offers the desired and continuous need for such heat.
Supply of DHW also in the summer period could reasonable be combined with offering cooling services for selected larger commercial buildings. An absorption chiller installed in the customers` premises would use the DH as the energy source. Thereafter, residential consumers could successively be converted to DH supported DHW supply.

Improvement of district Heating in Kosovo 67
7.2 Priority investment program The priority investment program addresses, on the one hand, the most urgent investment needs and, on the other hand, integrates these investments with the longer-term strategy. In other words, the priority investment program shall not prevent the strategy from being followed. Therefore, a final decision about the construction of new boilers in Pristina should be based on the proposed CHP study and the final decision should only be taken after a decision about CHP as been taken.
The priority investment program covers a period of three years and is presumed to be implemented in the period from 2010 to 2012.
7.2.1 Prices of investment goods To the extent possible, prices have been taken from recent projects implemented in Kosovo and the Balkan region.
7.2.2 Input prices The main components of the priority investment programs are subject to cost benefit analyses. The price estimates presented in the table below have been used for the cost-benefit analysis.
Table 50 Input prices
Item Unit
Personnel costs €/cap, yr 6,000.00
Average electricity price €/MWh 80.00
Mazut price €/tonne 350.30
€/MWh 31.00
Light heating oil price €/l 0.70
€/MWh 60.00
7.2.3 Benefits Benefits accrue mostly from
- Heat and corresponding fuel savings
- Electricity savings
- Water savings
- Savings of personnel costs
- Accelerated investments in pipe replacement
Accelerated investments in pipe replacement refer to avoided excess investments in network rehabilitation.
There is no doubt that a larger fraction of the pipes is in a bad condition, which materializes in high heat and water losses. A DH Company has two pipeline replacement policies to choose:
a) Business as usual policy: replacing the pipes according to the (reduced) lifetime, which has the advantage of lower interest payment, but the

Improvement of district Heating in Kosovo 68
disadvantage that heat and water savings can only be realized gradually in compliance to the speed of replacement investments. In practice, at least a part of these investment costs could be covered by the depreciation charges and interest payment could then even be lower.
b) Accelerated replacement policy: replacing the (worst) pipes quickly, which has the advantage that heat and water losses go down immediately, but which has the disadvantage of high interest payment (assuming that the investment will be financed by a loan)
To assess both strategies, a sample calculation has been performed (see Annex 11.3) utilizing the data for the pipeline program in Pristina. The calculation shows that the accelerated investments option (b) has a small financial advantage compared with option a) (“business as usual”). The calculation does not take into account impacts on the other components of the DH system (such as boilers and substations), which will benefit by improved water quality and thus increase their service lifetime. Taking this into account would increase the advantage of the accelerated investment policy, because the corrosion and blocking of boilers and substations would stop much earlier and than in the business as usual case. Therefore, the accelerated investment policy instead of the business as usual has been chosen. On the other hand, as mentioned before, actual interest payment could be significantly lower than as assumed in the calculation.
7.2.4 Phasing the investment program According to the Terms of Reference the project will be implemented in two phases. Phase 1 for the measures will be implemented in the short term after the pre-feasibility study has been completed. Phase 2 for the remaining funds will be implemented after a feasibility study to be financed from EU TA IPF has been realized.
Separating the investment programs into two phases would be reasonable for:
- Pristina: A feasibility study has to be performed regarding the feasibility and viability of converting the thermal power plant Kosovo B to a CHP plant. Based on this study a recommendation can be given whether and to what extend to allocate the EU-KfW means to support the CHP plan or to invest more money into heat-only boilers as well as DH system expansion.
- Mitrovica South: a feasibility study has to be performed to analyze the construction of a completely new DH system in the Southern part of the city.
There is no need to split the investment programs for Gjakova and Mitrovica North. In case of Mitrovica North, however, the eventual start of the investment program depends on the electricity price.
Figure 49 shows a possible scenario for phasing the investment program
- Pristina:
- System rehabilitation can start in 2010 and would be finished in 2012
- System expansion program could partially start in 2010 and would continue in phase 2 after review the actual development of the building stock
- Program for building new generation capacities (CHP or HOB) could start on 2011, possibly together with a further system expansion. There might be the necessity to extend the program beyond 2012.
- Gjakova
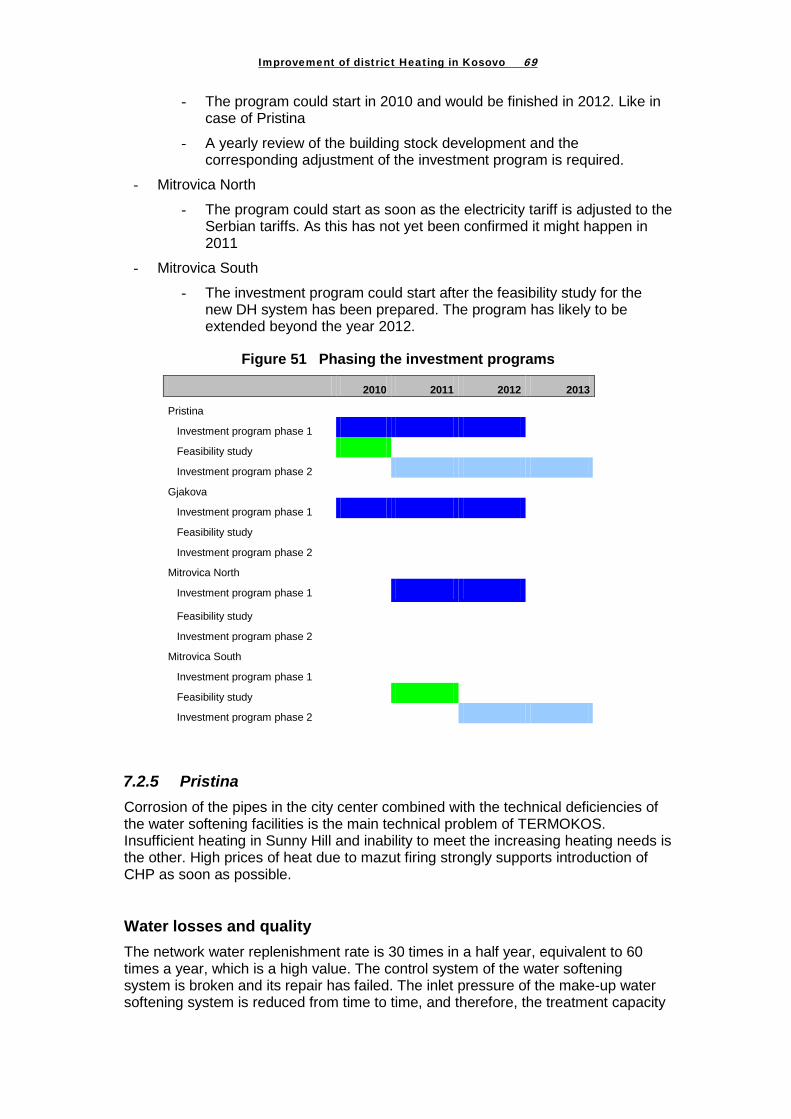
Improvement of district Heating in Kosovo 69
- The program could start in 2010 and would be finished in 2012. Like in case of Pristina
- A yearly review of the building stock development and the corresponding adjustment of the investment program is required.
- Mitrovica North
- The program could start as soon as the electricity tariff is adjusted to the Serbian tariffs. As this has not yet been confirmed it might happen in 2011
- Mitrovica South
- The investment program could start after the feasibility study for the new DH system has been prepared. The program has likely to be extended beyond the year 2012.
Figure 51 Phasing the investment programs
2010 2011 2012 2013
Pristina
Investment program phase 1
Feasibility study
Investment program phase 2
Gjakova
Investment program phase 1
Feasibility study
Investment program phase 2
Mitrovica North
Investment program phase 1
Feasibility study
Investment program phase 2
Mitrovica South
Investment program phase 1
Feasibility study
Investment program phase 2
7.2.5 Pristina Corrosion of the pipes in the city center combined with the technical deficiencies of the water softening facilities is the main technical problem of TERMOKOS. Insufficient heating in Sunny Hill and inability to meet the increasing heating needs is the other. High prices of heat due to mazut firing strongly supports introduction of CHP as soon as possible.
Water losses and quality The network water replenishment rate is 30 times in a half year, equivalent to 60 times a year, which is a high value. The control system of the water softening system is broken and its repair has failed. The inlet pressure of the make-up water softening system is reduced from time to time, and therefore, the treatment capacity

Improvement of district Heating in Kosovo 70
is reduced as well resulting in poor circulation water quality. Due to high water losses and technical treatment problems the water quality cannot be maintained at the required level. The fast corroding pipes in the city center and Dardania is the most serious technical problem in TERMOKOS. Insufficiency of treated make-up water corrodes the pipes inside. In the past some preinsulated pipes have collapsed in less than ten years due to serious corrosion while they should last more than 30, even 50 years. Water softening capacity is 27 tonnes per hour at 6 bar water pressure. The water pressure however constantly varies and goes as low as 2-3 bar, which reduced the capacity to 12-13 t/h. Sometimes there in no water supply at all and water from the reserve tank has to be fed to the DH system. In order to face out the problem, the steps are
- a booster pump prior to the softening system to keep the inlet pressure constant at 6 bar; and, a waste water treatment system to supply technical water to the existing softening system; and
- when the water losses have fallen to level of some 10 revolutions a year, oxygen removal system should be adopted.
Condition of heating network Some 38% of the 32 km of network is already with preinsulated pipes. Some 9 km, 27% % of the remaining old pipes are frequently covered by external water, which quickly destroys the pipes that are without water protection cover. High humidity with minerals in the water combined with high temperature and black iron, which prevail in the underground network parts, is an ideal environment for fast corrosion of iron pipes.
System Expansion 258 000 m² expansion in the heated area is expected by 2012 in various parts of the city center where the DH network already exists and the connection pipes of the new customers remain relatively short.
Operation In the coldest days TERMOKOS has started to supply heat 24 hours a day that has improved heating quality. Due to lacking remote monitoring there is no much information available at TERMOKOS at the moment: Therefore the problem identification and corrective actions are only based on customer complaints.
Fuel supply Sufficiency of fuel supply is sometimes critical in winter due to slippery roads from FYR Macedonia to transport fuel. Therefore, more fuel storage capacity could improve the reliability of heat supply.
Maintenance facilities The current facilities are poor both in the main workshop as well as in the four local workshops. Tools and equipment are urgently needed as a means to monitor and maintain the performance of the DH system. Small excavators are needed in order

Improvement of district Heating in Kosovo 71
to dig in the narrow lanes in the densely built city center. A maintenance vehicle equipped with pressurized air device, power aggregate, welding, etc. is needed as well. New welding equipment and a maintenance car, which contains the main facilities and which can function as an ad hoc repair shop on the field, are needed.
Boiler efficiency and availability Those two main boilers of 58 MW capacity originate from the years 1978 and 1985. The first of them was rehabilitated in 2004 by means of new tubes and burners, but the other one not yet. New frequency controlled supply side pumps are used by both boilers to supply hot water to the network. Based on the measurement of produced heat and used mazut, the average efficiency of the plant has been 85% in the past three years, which is considered modest for oil heating. Due to the high age of the boilers, some immediate measures are necessary to extend the lifetime of the boilers to meet the increasing heat demand from the current of about 100 MW. One of the two 58 MW boilers was rehabilitated a couple of years ago (financed by EAR), but the other one of 58 MW is still in rehabilitation need. In case the CHP introduction will still be postponed, the third boiler will become necessary in a couple of years both as back up and as supplier of the excess heat load.
Consumer substations and heat metering Some 10 large customers are disconnected for various reasons since several years ago already. Most substations are modern and equipped with heat meters, plate heat exchangers and temperature controllers. Billing based on heat metering of 11.000 apartments will need some time to prepare, and introduction of a computerized billing and collecting system is necessary to do it.
50 of 290 substations need still to be upgraded with heat meters and weather controllers. In most cases the current old and spacious tube heat exchangers shall be replaced by plate heat exchangers to reduce water leakage as well. Many substations in addition to those 50 need to be thermally insulated as well to save energy. After all this completed in the project, the substation part would be fully prepared for consumption-based billing.
Expansion TERMOKOS has to expand the DH system to connect the many new buildings being constructed and planned for the coming years. The current status is as follow:
- So far, TERMOKOS has contracted 70.000 m². Some of them are collective buildings nearby TERMOKOS headquarter, which are expected to be connected in three phases (because some of the buildings are still under construction).
- Until now under construction are 100.000 m². It is not yet clear, whether the buildings are going to be finalized for connection until the end of 2009.
- In Sunny Hill there are over 400 apartments with 22.500 m² to be connected.
- There are close to TERMOKOS buildings with 116.000 m² planned by the municipal urban planning department. They have already applied for DH. They are under construction.

Improvement of district Heating in Kosovo 72
- There are also other newly constructed collective buildings that are in the areas, which are difficult to connect in DH, because the supply pipe does not have spare capacity, and the heat source of DH is very far away.
Before building developers start to construct the building after getting the initial construction permit, they should ask TERMOKOS to ask they can be connected to DH. For all the buildings that are possible to be supplied with DH, TERMOKOS will provide the permit and starts the procedure for connection.
The investment program is based on the assumption that in average about 60.000 m² per year can be connected. Investment needs Therefore, TERMOKOS needs to
• invest in prevention of corrosion as first priority, which means replacing the worst pipes that are vulnerable to external water corrosion as well as improving facilities to supply well treated make-up water to the network;
• extend the DH system, mainly in Sunny Hill but in the downtown as well to connect new customers that are near to the existing pipelines already;
• support connection to the power plant in order to obtain waste heat of power generation to cover the base load of district heating in Pristina;
• complete the substation rehabilitation with heat metering and temperature controllers in order to improve energy efficiency and facilitate consumption based billing; and,
• Introduce computerized billing and collection, and consecutively financial planning and maintenance database systems.
There has been no hydraulic analysis of the network. Therefore, a hydraulic network analysis should be performed before any pipes will be ordered. The analysis may provide substantial savings both in investment and operation costs due to optimized diameters and routes of pipes.
Figure 50 summarizes the priority investment program for Pristina. Regarding Phase 2 two options are indicated. Option 1 refers to a future heat generation by Hob, while Options 2 related to a CHP solution. Costs for option 2 have still to be determined and even this of option1 could be revised in accordance with the results of the CHP study. Total investment costs of the CHP component depend to a large extent on the optimal capacity of the CHP facilities17
The turbines are owned by KEK and so it makes sense that the heat station (heat exchangers) would be the property of KEK. Transmission pipes could be owned either by KEK or by TERMOKOS. In case that KEK would be the owner, the company could commission TERMOKOS to operate and maintain the pipes.
. This will also determine the optimal diameter of the transmission line, but total costs can only be determined when the route has been fixed. Moreover, the cost of the needed turbine modification has to be analyzed.
17 According to mention CHP study, the total investment costs amount to about € 43 million. This number could, however, be misleading. First, it includes VAT and interest payments. Second, it covers 2 phases. The fist phase would allow supplying Pristina in the near future, while the second phase envisages an extensive expansion of the CHP supply system. Finally, the investment costs for the proper phase would amount to about € 19 million. By optimizing the system and applying a realistic heat demand forecast, this amount could likely be reduced.

Improvement of district Heating in Kosovo 73
Figure 52 Priority investment program Pristina (in 1.000€)
2010 2011 2012 2010-12PHASE 1 3,035 2,780 1,557 7,372
I DH substation rehabilitation 850 725 325 1,900 1 Substation upgrading 50 of 291 200 300 500 2 Civil works for substation rehabilitation 100 100 200 3 Remote monitoring of substations and index customers 100 150 150 400 4 Tools and equipment 250 250 5 Management information system including GIS 200 175 175 550 II DH network rehabilitation 1,741 1,611 869 4,221 6 Replacement of networks 11.6 km DN range 1,741 1,611 869 4,221
Center 4.0 km 150-450Dardania 2.6 km 100-600Ulpiana 2.4 km 100-500Sunny Hill 2.6 km 65-300
III DH system extension 444 444 364 1,251 7 Network extension 4.1 km DN 250 250 170 670
Center 1.0 km 65-150
Dardania 0.8 km 65-125Ulpiana and Calabria 1.7 km 65-250Sunny Hill 0.6 km and station
8 Substations 194 194 194 581 PHASE 2 - 1,432 700 2,132
Option 1 (Heat generatiuon by HoB) *)IV Boiler rehabilitation 982 450 1,432
9 Rehabilitation of Boiler 2 400 100 500 10 Burner replacement in Boiler 1 382 382 11 Construction of HFO tank 1000m3 250 250 12 Natural well water recovery system 200 100 300
V DH system extension 450 250 700 13 Boiler unit to Sunny Hill 12-14 MW 450 250 700 Option 2 (heat generation by CHP)
VI CHP14 Transmission line to Kosovo B n.a15 Turbine modification n.a.
VII DH system extension16 System expansion n.a..17 Domestic water supply project na.
Total Phase 1 and Phase 2 3,035 4,212 2,257 9,504
Investment items in Prishtina
In order to estimate the benefits of the investment plan above, the investment items have been allocated to three groups as presented in the table above.
The rationale and benefits of the investment groups can be stated as follows:
I DH network and substation rehabilitation Network and substation rehabilitation comprises completion of substations with plate heat exchangers, heat meters and temperature controllers, thus converting the whole DH network to demand driven operation mode and ready to consumption based billing.
Moreover, it includes a management information system (MIS) that comprises computerized billing and collecting with ledger, financial management, maintenance

Improvement of district Heating in Kosovo 74
as well as hydraulic analysis of the network. The maintenance and the hydraulic network analysis systems would be linked with geographical information system – GIS - to be procured as a part of the MIS as well. Such a MIS is vital for effective management of the heating business, and TERMOKOS in particular, is well prepared for introduction of such a computerized management environment already.
Tools include two small excavators to be used in the city center to replace pipes and install connection pipes in tight environment, water analysis laboratory equipment, facilities to the mechanical workshop.
The benefits of such DH system and substation rehabilitation accrue from reduced energy sales, since the customers will be motivated to reduce their heat consumption (18%) and the ordered capacity (9%) in order to keep the current heating conform. Moreover, the heat losses of the network are assumed to drop from 15% to 11% of the produced heat, equal to 6.5 GWh.
New pipelines replacing the old and leaking ones are expected to reduce 70% of the current water losses. All substations are with plate heat exchanger already, so the main reason for leaking water is the old network part. The remaining 30% of the purchased water will be converted to free-of-charge available wastewater that tat will be treated for DH make-up water. Thus, after the project, no water is needed to be purchased, but the reduced water consumption can be served by wastewater treatment.
Due to the automation of substation and modern pipelines as well as due to MIS implementation, conservatively some 20% of the current staff can be reduced in a few years to come, equal to 36 staff. The control of receivables will be on-line, thus expected to shorten the delay of receivables. The hydraulic analysis will optimize the new pipelines, which will reduce both investment and operation costs of the network. The maintenance system will reorganize the maintenance routines from expensive repairs done after the damage occurred towards preventive maintenance with lower costs and less damage.
The new pipelines will have a lifetime of 30 years at least whereas the old ones maximum 12 years. Replacing the old pipes quickly instead of being evenly distributed to the years to come provides accelerated investment benefits equal to € 0.09 million a year.
II Boiler rehabilitation The boiler rehabilitation is expected to raise the overall efficiency from 85% to 90% due to flue gas O2 content optimization, new burners and accessories.
The burners of boiler one, despite being some 7 years old only, seems to function badly. For instance, according to the director responsible for the boilers, the efficiency difference of the burners of the two boilers can be demonstrated as follows: With the same fuel flow to both boilers, the boiler 2 generates 60% and the boiler 1 the remaining 40 % of $the total heat production of the plant. Thus, assuming the efficiency of the boiler 2 is 95%, the efficiency of the boiler 1 would be only 70%, which seems incredibly low. Anyway, 5% increase in the overall efficiency is assumed realistic.

Improvement of district Heating in Kosovo 75
III DH system extension The DH system expansion with 258 000 m² is expected to provide new sales revenues in terms of both space heating energy and ordered capacity, whereas main operation costs are caused by the incremental fuel costs. Moreover, domestic hot water sales are planned in the pilot area, but no details are available so far.
TERMOKOS requests that customers will pay for the new substations, which are excluded from the investment plan18
The physical benefits of the component are expected as presented below.
. Requesting such investment cost contributions is a common practice of DH Companies. The costs of the connection pipes are already in the investment plan of TERMOKOS.
Figure 53 Benefits Pristina Item
Unit I Substation rehabilitation reduced energy sales of 10% equal to GWh/yr 15.9 reduced capacity savings of 5% equal to MW 5.6 reduced electricity consumption MWh/yr 450 reduced staff, estimate 7% of the actual persons 12 II DH network rehabilitation reduced water losses by 100% equal to k m³/yr 71
reduced heat losses in the network equal to GWh/yr 6.5 reduced staff, estimate 3% of the actual persons 6 accelerated investments in pipe replacement 000€/yr 90 III Boiler rehabilitation reduced fuel consumption, 3% GWh/yr 6.2 IV DH system extension increased energy sales for space heating GWh/yr 23.37 increased energy sales for domestic hot water GWh/yr 0.1 - incremental fuel consumption (boiler) GWh/yr 48.1 increased capacity sales MW 15.9 - incremental production capacity need MW 16.22
Cost-benefit analysis and internal rate of return The economic IRR of the Pristina project per component is shown in the table below. Components I-III has high internal rates of return.
The IRR for the system expansion component was calculated based on the rate of return as approved by the Regulatory Agency ERO.
Figure 54 IRR
Item I DH substation rehabilitation 12.9 % II DH network rehabilitation 13.1 % III Boiler rehabilitation 12.4 % IV System expansion 4.8 %
A detailed calculation of the IRR is shown in 11.1.
18
The request is in compliance with the ERO Rules 02/2004. Connection fees are regulated by „Temporary Instruction No. 02/2004 On the Terms and Procedure for New Connections to the District Heating Distribution Network

Improvement of district Heating in Kosovo 76
In addition, an IRR from the prospective of final consumers has been calculated, assuming that the alternative to district heating would be electric heating. This IRR amounts to 17 %. The IRR calculation does not include the investment cost difference between electric and district heating, as these costs are building specific. However a very estimate would result in a reduction of the IRR to 15 %.
7.2.6 Gjakova In Gjakova the main technical and economic problems of district heating are as follows:
• Main problems and bottlenecks: The circulation pumping capacity is insufficient to meet the heating needs, especially in the new branch. New circulation pumps are needed to supply more heat to the already rehabilitated southern branch of the network. The existing pumps may remain for the old branch, in which low-pressure levels can be used. The plan is to install new frequency controlled pump to supply the modern branch, and leave the existing pumps for the old branch where the pressure tolerance is restricted until the old pipelines have been replaced as well.
• Water losses and quality: The network water replenishment rate is 29 times in a half year, equivalent to 58 times a year, which is a high value. However, the water softening and oxygen removal seem not to be sufficient to the high level of water losses, and therefore, internal corrosion and sedimentation of the pipes is considered a major problem in Gjakova. The pressure level of the city water is sufficient during the heating season in order to provide reasonably well treated make-up water to the network. Urgent measures should be taken to reduce the water losses.
• DH network: Some 59% of the 11 km long network is already with modern preinsulated pipes, implemented by the EAR project. The condition of the remaining pipes, especially the consumer branches with tar paper and mineral wool insulated pipelines of 4 km length of 4.5 km in total, is considered bad due to high age and poor water quality. The pressure tolerance of the old ones has reduced, so reduced pressure level have to be used for that part of the network. The estimated repair frequency is 6 per km a year, which is extremely high, and also telling of the poor quality of the remaining old pipelines.
• Operation: Due to neither lacking remote monitoring there is neither much information available nor on-line nor real time at the DHC. Accordingly, the problem identification and corrective actions are only based on customer complaints. Heat is supplied during 12-15 hour periods during the whole heating season, which helped cut costs while applying lump-sum tariffs on the one hand, but required high heat loads to restart heating in the morning. With consumption based billing practice should be changed and adjusted to real consumer behavior.
• Maintenance facilities: The current facilities are poor in the technical workshop. Tools and equipment are urgently needed as a means to monitor and maintain the performance of the DH system. New welding equipment, for instance, is needed.
• Boiler efficiency and availability: There are two boilers of 18 and 20 MW capacity and commissioned in year 1981, one of which has been partly rehabilitated in 2004 by means of new tubes in the economizer but using still

Improvement of district Heating in Kosovo 77
old burners, but the other one not yet. Boiler condition is poor, the flue gas duct leaking and the second boiler with no rehabilitation. The efficiency of the old boiler plant is approximately only 87%, since the operation is fully manual and the equipment is old. The capacity of the DH circulation pumps is inadequate to boost the hot water to the end of the network at required pressure levels. The flue gas duct is leaking, which hampers the boiler operation.
• Consumer substations and heat metering: The number of substations is 224 of which 151 are small one-family house units with plate heat exchangers, 41 are institutional (public and commercial) and 32 are for residential blocks. Some 70% of the large substations of 73 are with old tube heat exchangers whereas 30% with modern plate ones. Only the large substations are equipped with temperature controllers and heat meters. The remaining 190 of 224 substations need upgrading with heat meters and weather controllers in order to be ready for consumption based billing. However, not all existing weather controllers function and need to be repaired. In some 50 cases the current old and spacious tube heat exchangers shall be replaced by small plate heat exchangers to reduce water leakage. Many substations need to be thermally insulated as well to save energy.
• System expansion: In the city area, which is with DH networks already, the city is expanding. About 180.000 m² is expected by the year 2012 to be connected. In addition, the city is expanding to north east where a new city area Rezina is under construction to inhabit the population of 20.000. Therefore, new pipes are needed but the current production capacity seems to be sufficient to meet the growing need.
Therefore, the DHC of Gjakova needs to invest in
• new DH circulation pumps to enable the supply of more heat to the already rehabilitated southern branch of the network. The existing pumps may remain temporarily for the old branch, in which low pressure levels have to be used;
• the old customer branch of the northern part that comprises old and corroded pipelines;
• new pipelines in order to serve the growing city, which is expanding to north east, where the settlement “Rezina” for 20.000 people is being built. The DHC intends to extend their networks to the new area that will be relatively densely built;
• invest in completion of the substation rehabilitation with heat metering and temperature controllers in order to improve energy efficiency and facilitate consumption based billing.
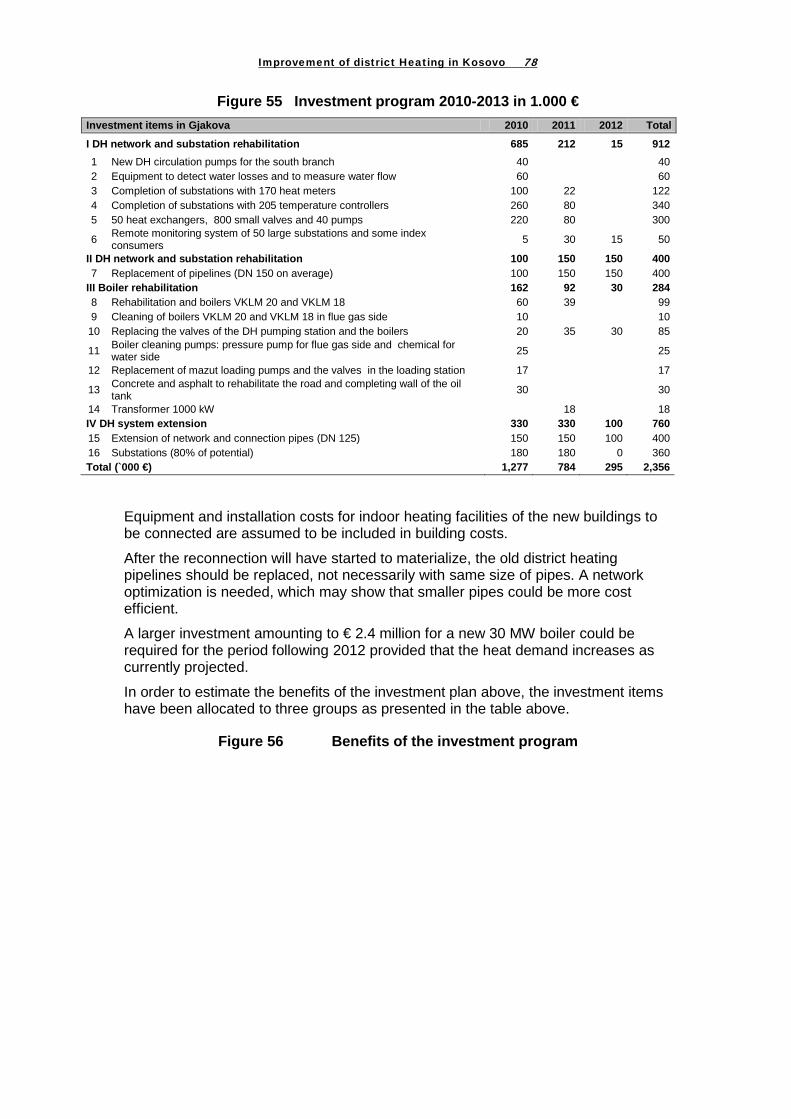
Improvement of district Heating in Kosovo 78
Figure 55 Investment program 2010-2013 in 1.000 € Investment items in Gjakova 2010 2011 2012 Total
I DH network and substation rehabilitation 685 212 15 912 1 New DH circulation pumps for the south branch 40 40 2 Equipment to detect water losses and to measure water flow 60 60 3 Completion of substations with 170 heat meters 100 22 122 4 Completion of substations with 205 temperature controllers 260 80 340 5 50 heat exchangers, 800 small valves and 40 pumps 220 80 300
6 Remote monitoring system of 50 large substations and some index consumers 5 30 15 50
II DH network and substation rehabilitation 100 150 150 400 7 Replacement of pipelines (DN 150 on average) 100 150 150 400
III Boiler rehabilitation 162 92 30 284 8 Rehabilitation and boilers VKLM 20 and VKLM 18 60 39 99 9 Cleaning of boilers VKLM 20 and VKLM 18 in flue gas side 10 10
10 Replacing the valves of the DH pumping station and the boilers 20 35 30 85
11 Boiler cleaning pumps: pressure pump for flue gas side and chemical for water side 25 25
12 Replacement of mazut loading pumps and the valves in the loading station 17 17
13 Concrete and asphalt to rehabilitate the road and completing wall of the oil tank 30 30
14 Transformer 1000 kW 18 18 IV DH system extension 330 330 100 760 15 Extension of network and connection pipes (DN 125) 150 150 100 400 16 Substations (80% of potential) 180 180 0 360 Total (`000 €) 1,277 784 295 2,356
Equipment and installation costs for indoor heating facilities of the new buildings to be connected are assumed to be included in building costs.
After the reconnection will have started to materialize, the old district heating pipelines should be replaced, not necessarily with same size of pipes. A network optimization is needed, which may show that smaller pipes could be more cost efficient.
A larger investment amounting to € 2.4 million for a new 30 MW boiler could be required for the period following 2012 provided that the heat demand increases as currently projected.
In order to estimate the benefits of the investment plan above, the investment items have been allocated to three groups as presented in the table above.
Figure 56 Benefits of the investment program
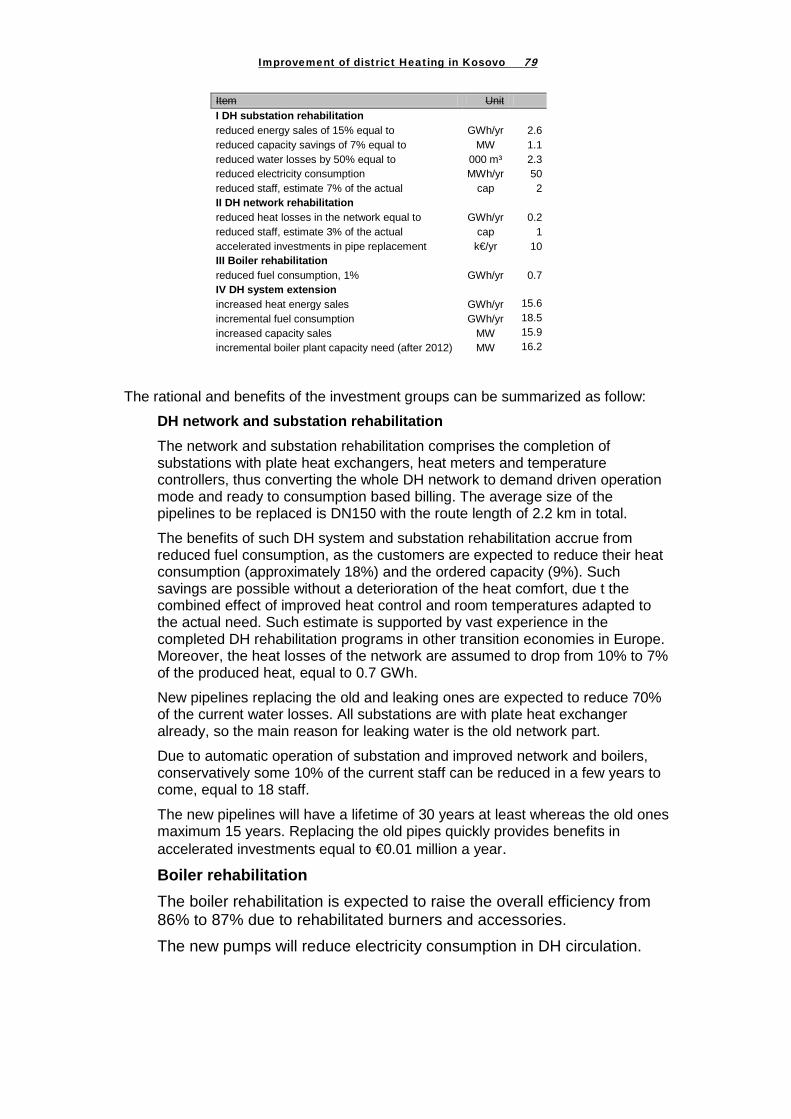
Improvement of district Heating in Kosovo 79
Item Unit I DH substation rehabilitation reduced energy sales of 15% equal to GWh/yr 2.6 reduced capacity savings of 7% equal to MW 1.1 reduced water losses by 50% equal to 000 m³ 2.3 reduced electricity consumption MWh/yr 50 reduced staff, estimate 7% of the actual cap 2 II DH network rehabilitation reduced heat losses in the network equal to GWh/yr 0.2 reduced staff, estimate 3% of the actual cap 1 accelerated investments in pipe replacement k€/yr 10 III Boiler rehabilitation reduced fuel consumption, 1% GWh/yr 0.7 IV DH system extension increased heat energy sales GWh/yr 15.6 incremental fuel consumption GWh/yr 18.5 increased capacity sales MW 15.9 incremental boiler plant capacity need (after 2012) MW 16.2
The rational and benefits of the investment groups can be summarized as follow:
DH network and substation rehabilitation The network and substation rehabilitation comprises the completion of substations with plate heat exchangers, heat meters and temperature controllers, thus converting the whole DH network to demand driven operation mode and ready to consumption based billing. The average size of the pipelines to be replaced is DN150 with the route length of 2.2 km in total.
The benefits of such DH system and substation rehabilitation accrue from reduced fuel consumption, as the customers are expected to reduce their heat consumption (approximately 18%) and the ordered capacity (9%). Such savings are possible without a deterioration of the heat comfort, due t the combined effect of improved heat control and room temperatures adapted to the actual need. Such estimate is supported by vast experience in the completed DH rehabilitation programs in other transition economies in Europe. Moreover, the heat losses of the network are assumed to drop from 10% to 7% of the produced heat, equal to 0.7 GWh.
New pipelines replacing the old and leaking ones are expected to reduce 70% of the current water losses. All substations are with plate heat exchanger already, so the main reason for leaking water is the old network part.
Due to automatic operation of substation and improved network and boilers, conservatively some 10% of the current staff can be reduced in a few years to come, equal to 18 staff.
The new pipelines will have a lifetime of 30 years at least whereas the old ones maximum 15 years. Replacing the old pipes quickly provides benefits in accelerated investments equal to €0.01 million a year. Boiler rehabilitation The boiler rehabilitation is expected to raise the overall efficiency from 86% to 87% due to rehabilitated burners and accessories. The new pumps will reduce electricity consumption in DH circulation.

Improvement of district Heating in Kosovo 80
DH system extension The DH system extension will provide additional heat sales revenues, whereas the main changes in the operation costs will be caused by the incremental fuel costs and depreciation charges. The existing boilers will be sufficient to increase the peak load from the current 15 MW to 32 MW due to 180.000 m² of new customers. Therefore, new boiler capacity is justified after year 2013 at earliest. The average size of the extension and connecting pipelines is approximately DN125 with the route length of 2.5 km in total. Benefits for the DH Company will only accrue from the rate of return on the regulated assets. The rate of return is determined by the Regulatory Agency ERO and amounts currently to about 11.6%. However, the company will only experience additional profits (or reduced losses) if the collection rates of the new consumers will be sufficiently high. This requires at least that all new buildings have to be equipped with meters and that consumption-based billing is applied. Ideally, the buildings should have horizontal heating pipes, which would allow switching off non paying apartment owners. A macro-economic advantage will accrue due to reduced fuel consumption and CO2 emissions, if electric heating would have to be applied instead of district heating.
Cost-benefit analysis and internal rate of return The IRR of the Gjakova project per component is shown in the table below. The network and boiler rehabilitation have low IRR. Both are typical replacement investments that have to be undertaken to avoid the breakdown of the system. Larger benefits of such equipment can only be expected if new technologies allow significant efficiency improvements and cost reductions.
The IRR for the system expansion component is calculated based on the rate of return as approved by the Regulatory Agency ERO.
Figure 57 IRR
Item I DH substation rehabilitation 10.3 % II DH network rehabilitation 3.8 % III Boiler rehabilitation 5.0 % IV System expansion 5.1 %
A detailed calculation of the IRR is shown in Annex11.2.
Improvement of district Heating in Kosovo 81
In addition, an IRR from the prospective of final consumers has been calculated assuming that the alternative to district heating would be electric heating. This IRR amounts to 10 %. The IRR calculation does not include the investment cost difference between electric and district heating, as these costs are building specific. However a very estimate would result in a reduction of the IRR to 8%-9% .
7.2.7 Mitrovica – North The main technical and economic problems and bottlenecks in the northern part of Mitrovica are as follows:
• Disconnected customers: Only 15 of 54 substations are operated in the heating season. The others are disconnected due to technical and financial reasons. Most of the residential substations are not even physically connected to the network but stand alone without any pipe connection in either primary or secondary side. Some others are physically connected but switched off due to non-payments of customers.
• Old and corroded pipelines in the remaining 2 km parts. The concrete channel pipelines are 30-35 years old and need replacement ac cording to the DHC. However, there has been only one leakage in past three years, which indicates that the replacement is not urgent. At low pressures, caused by the fact that only 25% or less of the heat distribution capacity is currently in use, the pipelines are expected to last next 5-10 years without urgent replacement need. The situation may change if the customers start extensively to reconnect to the system. In that case pressures have to be raised, which may cause bursts in the old and weakened pipes.
A minor but also important problem refers to the state of the preheater, which is located in the ground of the mazut storage tank, which has to be empty to allow access to the preheater. In Mitrovica North, there is not that much investment need in the DH system itself, as the boilers, most of the secondary network, and the substations are new already. Even the old pipes of 35 years of age work without problem at currently low pressure levels, which is possible due to the extremely low heat demand. Problems would, however occur with increasing heat demand.
Rationale for investing in the demand side The most urgent measure is to continue heat supply to the disconnected customers. In most cases customers remained physically connected, but in some cases a disconnection could even mean a physical disconnection either behind the substation or at the radiator. It is neither known to which extent the buildings and apartments are physically disconnected nor what repair works would be required. This can only be assessed case by case once the building owners wish to be reconnected.
In addition there is large, but unknown number of buildings that are located close to a DH pipe, but do not have centralized heating systems and are using electricity for heating. This has created big problems both for KEK and EPS, as electricity is not paid and consumption coincides typically with electricity peak times. STNDARD Company, however, expects that electricity will be charged latest end of 2009. According to research done by the company, the cost for the reconstruction would be about 12 €/m2, i.e., 600 € per typical apartment with 50 m2.
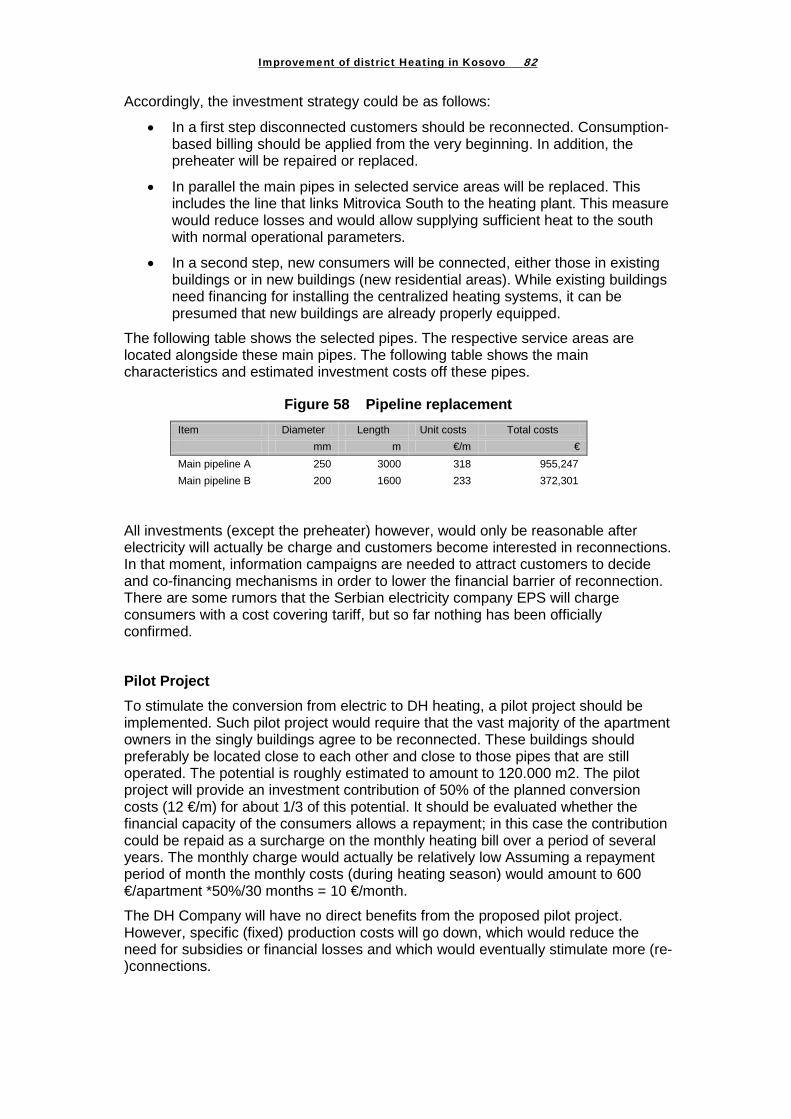
Improvement of district Heating in Kosovo 82
Accordingly, the investment strategy could be as follows:
• In a first step disconnected customers should be reconnected. Consumption-based billing should be applied from the very beginning. In addition, the preheater will be repaired or replaced.
• In parallel the main pipes in selected service areas will be replaced. This includes the line that links Mitrovica South to the heating plant. This measure would reduce losses and would allow supplying sufficient heat to the south with normal operational parameters.
• In a second step, new consumers will be connected, either those in existing buildings or in new buildings (new residential areas). While existing buildings need financing for installing the centralized heating systems, it can be presumed that new buildings are already properly equipped.
The following table shows the selected pipes. The respective service areas are located alongside these main pipes. The following table shows the main characteristics and estimated investment costs off these pipes.
Figure 58 Pipeline replacement Item Diameter Length Unit costs Total costs
mm m €/m € Main pipeline A 250 3000 318 955,247 Main pipeline B 200 1600 233 372,301
All investments (except the preheater) however, would only be reasonable after electricity will actually be charge and customers become interested in reconnections. In that moment, information campaigns are needed to attract customers to decide and co-financing mechanisms in order to lower the financial barrier of reconnection. There are some rumors that the Serbian electricity company EPS will charge consumers with a cost covering tariff, but so far nothing has been officially confirmed.
Pilot Project To stimulate the conversion from electric to DH heating, a pilot project should be implemented. Such pilot project would require that the vast majority of the apartment owners in the singly buildings agree to be reconnected. These buildings should preferably be located close to each other and close to those pipes that are still operated. The potential is roughly estimated to amount to 120.000 m2. The pilot project will provide an investment contribution of 50% of the planned conversion costs (12 €/m) for about 1/3 of this potential. It should be evaluated whether the financial capacity of the consumers allows a repayment; in this case the contribution could be repaid as a surcharge on the monthly heating bill over a period of several years. The monthly charge would actually be relatively low Assuming a repayment period of month the monthly costs (during heating season) would amount to 600 €/apartment *50%/30 months = 10 €/month.
The DH Company will have no direct benefits from the proposed pilot project. However, specific (fixed) production costs will go down, which would reduce the need for subsidies or financial losses and which would eventually stimulate more (re-)connections.
Improvement of district Heating in Kosovo 83
The most important effect on costs would be a significant increase of fuel consumption and a modest increase of electricity costs. Applying a two-part tariff would nevertheless allow covering these additional costs properly.
The staff seems to be more than sufficient to serve the reconnected customer base.
The addressees of the project are mostly the residential and commercial customers. In case that the Electricity Suppliers KEK and EPS would request their regular electricity prices and would actually charge the consumers. In case of EPS, the incremental costs for electricity would currently be about 5 cts if the demand is below 1.600 kWh per month. If the demand is higher, the additional electricity consumption will be charged with 9.6 cts per kWh. For the following discussion, it is assumed that the price is between 6 and 7 cts/kWh, which are equal to the assumption about the price in Kosovo in the chapter about least costs heating options.
The calculation in that chapter showed that total costs for electric heating would amount to about 10-11 cts/kWh including fixed costs for heating equipment. In case of Mitrovica, customers are likely already equipped with heating devices. Accordingly, DH has to compete against the (incremental) electricity price.
The heat production costs are estimated to be currently about 100 €/MWh. Specific production costs (€/MWh or €/m²) would significantly go down, when buildings will be reconnected, but these costs are hard to calculate. It is, however obvious that the current electricity prices are still too low to motivate many consumers to reconnect.
Institutional issues Legal or regulatory changes are needed to ensure reconnected customers to pay their heating and reconnection bills. Introduction of consumption based billing that is technically possible already due to heat metering of the substations could pay an important role in improving the payment discipline.
It should be a condition for financial support that STANDARD Company will (i) establish a proper cost accounting for the DH business and (ii) consumption-based billing with a two-part tariff system will be applied for all consumers.
Before investments in new pipes will be done, the electricity prices and actual collection policies of the distribution company will have to be checked to review the rationale for investments in DH. In case that the result of this analysis proves the competitiveness of DH, a deeper analysis for connecting and reconnecting the buildings to DH should be performed.
The pilot project will be started as soon as electric heating is charged by normal electricity tariffs. Under this pilot project, STANDARD Company will finance the reconnection and internal heating facilities under the condition that all apartment owners in the respective buildings agree. Moreover, the reconnected buildings will be charged according to the consumption. For this purpose, a two-part tariff has to be applied. The two-part tariff system may not lead to higher heating costs for normal heat consumption than the lump sum tariff.

Improvement of district Heating in Kosovo 84
Figure 59 Investment costs summary Item Diameter Length Unit costs Total costs
mm m €/m € Main pipeline A 250 3000 318 1,121,226 Main pipeline B 200 1600 233 436,991 Preheater *) 200,000 Demand side measures 240,000 Total 1,998,217
*) The cost of the proper preheater is estimated to be €20.000, but a lump sum of €200.000 has been assumed to cover other repairs that could be required once the storage is accessible. This has to be assessed in detail during project implementation. Figure 58 shows the internal rate of return. Due to lacking data an IRR cannot be calculated for the preheater. A preheater is, however, an indispensable technical prerequisite for the operation of a boiler using heavy oil. Costs for this measure could amount to some € 200.000. The preheater is below the oil tank. That means the oil should first be removed to get access to the preheater. This would allow assessing the technical state of the equipment. In other words, STANDARD only knows that there are problems (low reliability of the equipment). However, costs can only be specified once the preheater is accessible.
The main assumption for the pipeline component are (i) the existing pipes have a 50% higher heat loss than new pipes in concrete channels, and (ii) annual water losses would be 30 times the volume of the pipes when operated under normal pressure. These assumptions are only valid for a normal operation with normal supply temperatures and pressures. However, the IRR is low (5.4%), which is typical for proper replacement investments.
The internal rate of the DH network rehabilitation is shown in the following table. An IRR for the boiler rehabilitation component (preheater), , which constitutes only a small part of the total investment costs (less than 10%) cannot be calculated for the time being.
Figure 60 IRR Item I DH network rehabilitation 5.4% II Boiler rehabilitation ?
A detailed calculation of the IRR is shown in annex 11.3.
7.2.8 Mitrovica – South There is practically no DH network in Mitrovica South but a strong interest in building such a system in the city center. This would require conditions as follows:
• installation of secondary piping in to the buildings to be connected
• underground piping for DH
• heat source, either using the spare capacity of STANDARD Company’s boiler house or building a new one in the south.
The extension of the DH system in the southern part could proceed in three steps as follows:
In the 1st step, taking place possibly during 2011-2012, no changes would be made to the DH transport line of Standard but the existing distribution and

Improvement of district Heating in Kosovo 85
excess boiler capacity would be used to supply 5 MW through the bridge to the southern part.
At present, the pipes from the STANDARD boiler plant to the river crossing bridge are of size DN 200 but the last 200 m long section of DN 150. Therefore, using the common design parameters such as 1 bar pressure loss per km and 40 K temperature difference between the supply and return pipe at the -18 oC outdoor design temperature would allow about 5 MW to be supplied to the south part, where both underground and indoor piping as well as the building substations should be built.
This would allow some 15-20 buildings to be connected to the DH system depending on the specific heat consumption of the buildings. By presuming a heat load of 35 W/m³, the number would be 18 and the network would look like as presented in Figure 60 below.
The investment cost estimate of Phase 1 in M€ are given in the table below.
Figure 61 Investment costs in million €
Item Million €
DH network 0.2
Substations in buildings 0.2
Indoor piping, radiators and thermostatic valves 1.0
Total 1.4
In a second step, which would start after 2012, the 200 m network branch of DN 150 size of Standard entering the bridge could be complemented with a single DN 200 pipe to be added parallel to the existing one as a new supply pipe and the existing DN 150 double pipe would act as return pipe. In such a way, the distribution capacity could be doubled to some 10 MW.
In the third step, a new heat source would be built to extend the DH system toward the southern part of the city to supplement the heat supply from the Standard boiler plant located in the north. Thus heat would be supplied from two directions, from the north and the south.
The envisaged project (joint EU-KfW Project) would only finance step 1.

Improvement of district Heating in Kosovo 86
Figure 62 Initial plan for district heating construction in southern Mitrovica in three phases
Cost Benefit analysis Heat supply costs are currently difficult to estimate. Investment costs can only be roughly estimated and the price of heat to be delivered by STANDARD Company is neither determined nor can actual production costs reasonably be determined for the time being.
Concerning the return on capital of the new DH entity, the rules determined by ERO will apply, which allow a rate of return of 11.6% on regulated assets. From the point of view of customers, DH would likely be financially attractive in case of new buildings. In case of existing buildings where residents are already equipped with heating devices and DH tariffs would have to compete against the incremental electricity costs.
A rough cost calculation for the new DH system shows a tariff (excluding profits) of approx. 68.50 €/MWh (for details of the calculation see Annex 11.1). Heat purchase costs are calculated as if heat were produced in a new boiler (but with an efficiency of 85%). The costs include the installation of indoor heating faculties for 65.000 ² in existing buildings. The number is close to the current incremental electricity price but below the full costs of electric heating. The costs include also a calculated interest rate of 6% for all capital investments in order to test whether the investment would be viable under commercial conditions. Interest payments amount to about 10 €/MWh.
An internal rate of return has not been calculated assuming that there is no alternative heating option that could be implemented by the city administration.
An indicative IRR was calculated (see Annex 11.4) by assuming that the new DH construction will substitute current electric heating in the same buildings. In such estimation, the price of bulk heat purchase is crucial:

Improvement of district Heating in Kosovo 87
• at the full cost coverage tariff of 68.50 €/MWh as mentioned above, reflecting the financial IRR at the moment, the IRR would be only about 3%
• at the incremental fuel costs covering the flue gas and network losses as well as the investments of the new customers to STANDARD, reflecting the economic IRR, the IRR would be 28%.
Therefore, the project is economically sound, but its commercial viability vitally depends on the success of the commercial negotiations.
Institutional measures It is presumed that under the prevailing political conditions the DH service in Mitrovica South cannot be provided by STANDARD Company. In order to organize the installation and operation of the future DH system, the city administration should establish a department or public enterprise being in charge of DH. The main tasks of this entity would be:
- assess the willingness of apartment owners in the targeted buildings to connect to DH
- prepare and conclude preliminary connection contracts
- support the preparation of a feasibility study and design study
- assist the consultant in procurement
- conclude final connection contracts with targeted customers
- conclude a contract with STANDARD Company about heat delivery
- operate and manage the DH system.
7.2.9 Summary of investment programs
t

Improvement of district Heating in Kosovo 88
Figure 63 Summary of investment program in 1000 €*)
TotalHeat
gener-ation
Network Sub-stations
Demand side
Subtotal Heat gener-
ation
Network Sub-stations
Demand side
Subtotal Heat gener-
ation
Network Sub-stations
Demand side
Subtotal
Pristina 4,891 2,481 7,372 2,132 2,132 4,264 4,891 2,481 9,504Rehabilitation 4,221 1,900 6,121 2,132 4,221 1,900 6,121Expansion 670 581 1,251 2,132 2,132 2,132 670 581 3,383
Gjakova 284 800 1,272 2,356 284 800 1,272 2,356Rehabilitation 284 400 912 1,596 284 400 912 1,596Expansion 400 360 760 400 360 760
Kosovoska Mitrovia North 200 1,558 240 1,758 3,756 200 1,558 240 1,758 3,756Rehabilitation 200 1,558 240 1,758 3,756 200 1,558 240 1,758 3,756Expansion
Kosovoska Mitrovia South 200 200 1,000 1,400 200 200 1,000 1,400RehabilitationExpansion 200 200 1,000 1,400 200 200 1,000 1,400
CHP or HoB (potential contri 8,000 8,000 8,000 8,000Rehabilitation 8,000 8,000 8,000 8,000Expansion
Total 484 7,250 3,993 1,758 13,484 10,132 200 200 1,000 11,532 12,748 7,450 4,193 2,758 25,016Rehabilitation 484 6,180 3,052 1,758 11,474 8,000 8,000 10,616 6,180 3,052 1,758 19,474Expansion 1,070 941 2,011 2,132 200 200 1,000 3,532 2,132 1,270 1,141 1,000 5,543
Phase 1 Phase 2
*) Item “CHP or Hob” indicates only the magnitude of a potential contribution out of the funds being currently available for the joint KfW-EU project

8 Financial impacts of the investment programs and affordability
8.1 Model description and assumptions A spreadsheet model has been developed for the financial forecast.
8.1.1 Physical Inputs Heat Demand Forecast Heat sales are based on the development of heat demand. The heat demand development is based on the forecast presented in the chapter 5. The financial forecasts, however, takes into account the specific impacts of the investment program, such as specified fuel, water, and electricity savings.
Starting from 2010, the heat demand (both in terms of heat energy and load) is affected by various factors:
• Impacts of investment program
• Effects on metering and consumption based billing
• Energy saving measures implemented by consumers. These autonomous energy savings are estimated to reduce the final heat demand by 1% annually.
• Eventually, new consumers and disconnections
Fuel Demand The basis for calculating future fuel consumption is the current structure of fuel consumption and corresponding efficiencies. Because investments in heat generation will have impacts on capacity, applied fuel type, and on efficiencies, the numbers are adjusted in the spreadsheet correspondingly.
Electricity and water consumption The current electricity and water consumption is corrected by the impact of the investment program on electricity and water consumption.
Staff The staff number is affected by two factors:
- A personnel development plan, which reduces the typical overstaffing of the DH Companies without taking into account the investment program. These staff reductions will be achieved by organizational measures. It is assumed that the staff can be reduced gradually until 2015 in such way that productivity will be doubled (in terms of GWh/cap).
- Second, the investment program which usually allows reducing the operating staff. For each investment component the staff requirements have been estimated (see the cater on the priority investment program).
Service lifetime and depreciation
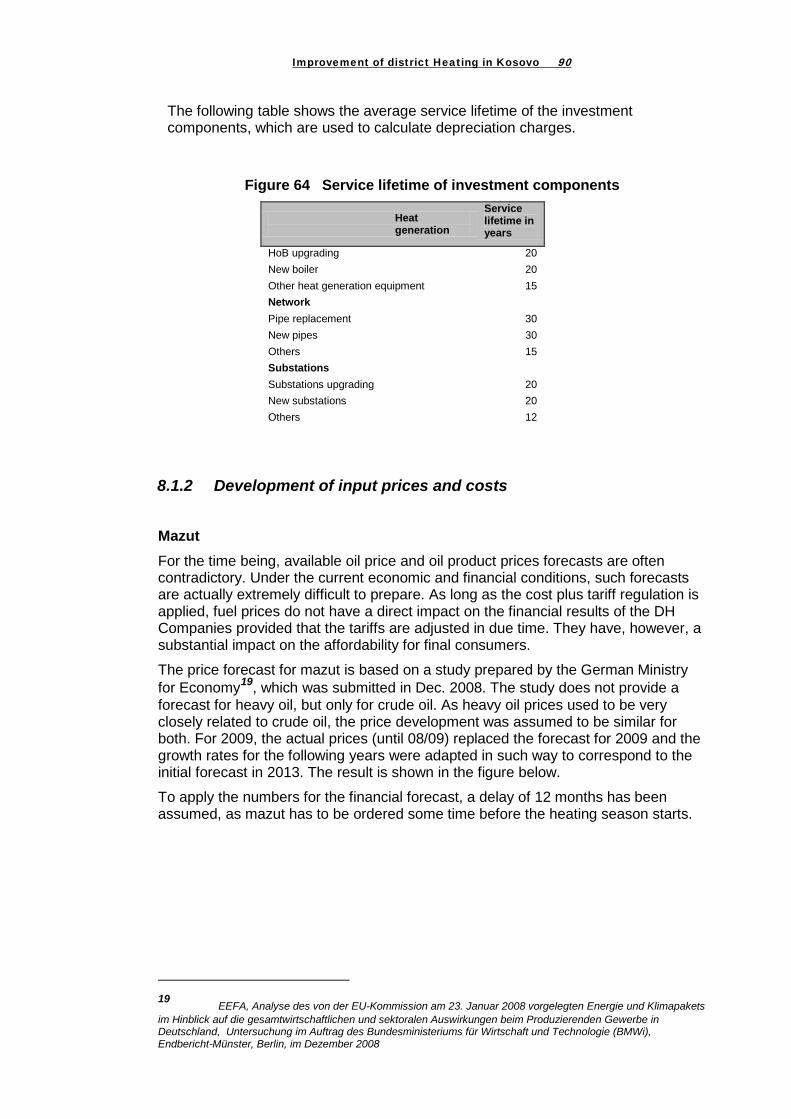
Improvement of district Heating in Kosovo 90
The following table shows the average service lifetime of the investment components, which are used to calculate depreciation charges.
Figure 64 Service lifetime of investment components
Heat generation
Service lifetime in years
HoB upgrading 20 New boiler 20 Other heat generation equipment 15 Network Pipe replacement 30 New pipes 30 Others 15 Substations Substations upgrading 20 New substations 20 Others 12
8.1.2 Development of input prices and costs Mazut For the time being, available oil price and oil product prices forecasts are often contradictory. Under the current economic and financial conditions, such forecasts are actually extremely difficult to prepare. As long as the cost plus tariff regulation is applied, fuel prices do not have a direct impact on the financial results of the DH Companies provided that the tariffs are adjusted in due time. They have, however, a substantial impact on the affordability for final consumers.
The price forecast for mazut is based on a study prepared by the German Ministry for Economy19
To apply the numbers for the financial forecast, a delay of 12 months has been assumed, as mazut has to be ordered some time before the heating season starts.
, which was submitted in Dec. 2008. The study does not provide a forecast for heavy oil, but only for crude oil. As heavy oil prices used to be very closely related to crude oil, the price development was assumed to be similar for both. For 2009, the actual prices (until 08/09) replaced the forecast for 2009 and the growth rates for the following years were adapted in such way to correspond to the initial forecast in 2013. The result is shown in the figure below.
19
EEFA, Analyse des von der EU-Kommission am 23. Januar 2008 vorgelegten Energie und Klimapakets im Hinblick auf die gesamtwirtschaftlichen und sektoralen Auswirkungen beim Produzierenden Gewerbe in Deutschland, Untersuchung im Auftrag des Bundesministeriums für Wirtschaft und Technologie (BMWi), Endbericht-Münster, Berlin, im Dezember 2008

Improvement of district Heating in Kosovo 91
Figure 65 Price index for heavy fuel oil (mazut) 2004-2020
-
0.50
1.00
1.50
2.00
2.50
3.00
2004 2005 2006 2007 2008 2009 2010 2011 2012 2013 2014 2015 2016 2017 2018 2019
Source: EU Oil Bulletin, EEFA, and own calculations
Electricity Electricity prices constitute currently about 15% of total costs. The prices are assumed to increase modestly in 2009 by 2.5%, 3% in 2010, and thereafter by 3.5%
Water Water prices increase by the same rate as the consumer price index.
Salaries and other personnel costs The projected growth rate for salaries and social fees corresponds to the growth rate of the consumer price index plus 1% point.
Consumer price index The consumer prices are assumed to increase by 0% in 2009, 1% in 2010, and thereafter by 2%.
Collection rates and bad debts Collection rates will go up in course of time towards 95% due to consumption based billing and consequent collection practices. Experience from other CEE Countries show that such results can be achieved within a few years. Consumption-based billing will support the achievement of higher collection rates, but is not a indispensable condition for high collection rates as shown by a number of Serbian DH Companies. It requires rather a consequent collection policy (including suing late customers). The DH Companies know very well that a large fraction of the non-payers are relatively well-off and could easily pay.
Bad debts will successively go down to achieve 3% in 2014. Example from DH Companies in other Countries operating under similar conditions show that such target can be achieved.

Improvement of district Heating in Kosovo 92
Figure 66 Average collection rate
0.00%
20.00%
40.00%
60.00%
80.00%
100.00%
120.00%
2009 2010 2011 2012 2013 2014 2015 2016 2017 2018 2019
Series1
Other costs items All costs other than mentioned before as well as financial costs and depreciation will grow with the same rate as the consumer price index.
8.1.3 Benefits The following benefits will be identified:
- direct and indirect fuel savings: direct fuel savings are due to boiler replacement or upgrading, while indirect fuel savings are due to loss reduction or reduction of final consumption
- electricity savings: mostly due to a reduction of electricity consumption of pumps
- water reduction: mostly due to replacement and upgrading of pipes and substations
- staff reduction; mostly due to automation and reduced maintenance.
In case of new connection the additional demand is calculated as a negative saving.
8.1.4 Heat tariffs Heat tariffs are calculated in accordance with the tariff regulation issued by ERO. In accordance with current practice, a rate of return of 11.6% is applied.
The model does not consider any general subsidies aiming at lowering the DH tariff. In other words, tariffs are calculated assuming that general subsidies have been phased out in 2009. This is unlikely for 2009, but the subsidy has not yet been determined. Moreover, the full cost covering tariff allows assessing the impacts of subsidy elimination on affordability.
8.1.5 Financial data The financial forecast starts from the financial data provided by the DH Companies for the years 2006-2008. Because of the insufficient database for STANDARD Company, a financial forecast has not been prepared. Moreover, in case of the Northern part of the city, the DHC would not be the direct beneficiary of the investments, but final consumers. Provided that heat tariff would be cost covering, the DHC could benefit from each reconnection thus improving its financial situation.
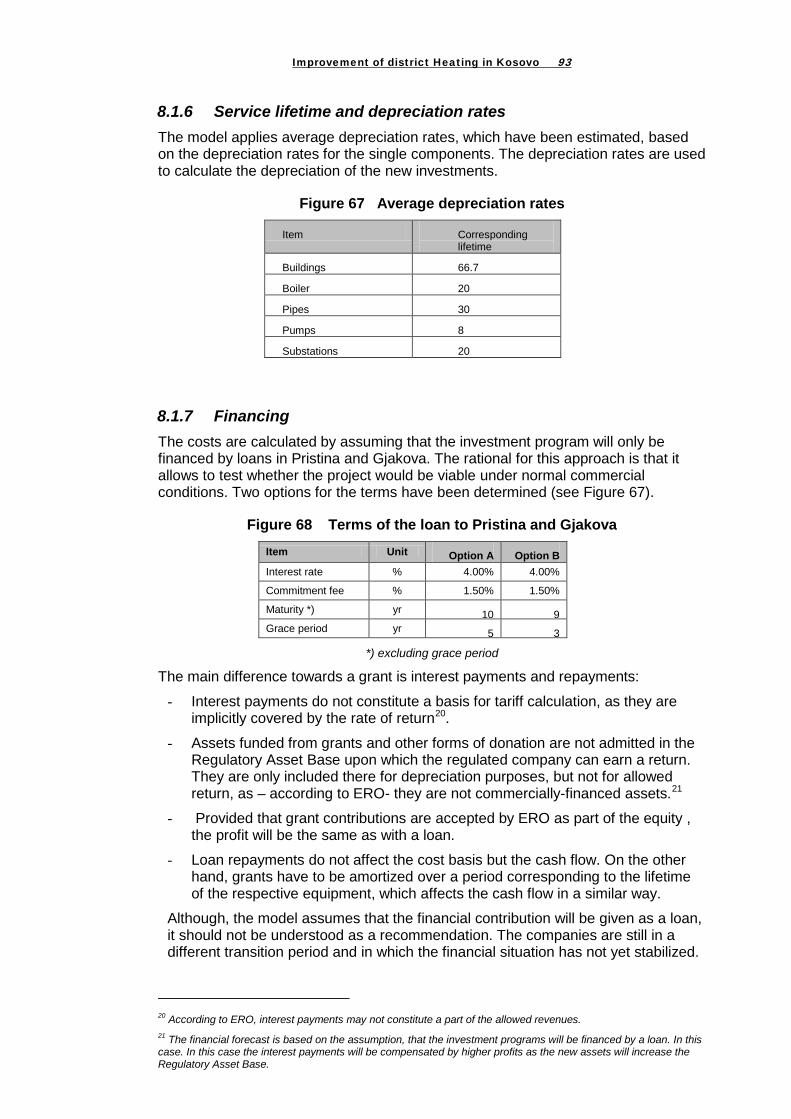
Improvement of district Heating in Kosovo 93
8.1.6 Service lifetime and depreciation rates The model applies average depreciation rates, which have been estimated, based on the depreciation rates for the single components. The depreciation rates are used to calculate the depreciation of the new investments.
Figure 67 Average depreciation rates
Item Corresponding lifetime
Buildings 66.7
Boiler 20
Pipes 30
Pumps 8
Substations 20
8.1.7 Financing The costs are calculated by assuming that the investment program will only be financed by loans in Pristina and Gjakova. The rational for this approach is that it allows to test whether the project would be viable under normal commercial conditions. Two options for the terms have been determined (see Figure 67).
Figure 68 Terms of the loan to Pristina and Gjakova
Item Unit Option A Option B Interest rate % 4.00% 4.00%
Commitment fee % 1.50% 1.50%
Maturity *) yr 10 9 Grace period yr 5 3
*) excluding grace period
The main difference towards a grant is interest payments and repayments:
- Interest payments do not constitute a basis for tariff calculation, as they are implicitly covered by the rate of return20
- Assets funded from grants and other forms of donation are not admitted in the Regulatory Asset Base upon which the regulated company can earn a return. They are only included there for depreciation purposes, but not for allowed return, as – according to ERO- they are not commercially-financed assets.
.
21
- Provided that grant contributions are accepted by ERO as part of the equity , the profit will be the same as with a loan.
- Loan repayments do not affect the cost basis but the cash flow. On the other hand, grants have to be amortized over a period corresponding to the lifetime of the respective equipment, which affects the cash flow in a similar way.
Although, the model assumes that the financial contribution will be given as a loan, it should not be understood as a recommendation. The companies are still in a different transition period and in which the financial situation has not yet stabilized.
20 According to ERO, interest payments may not constitute a part of the allowed revenues. 21 The financial forecast is based on the assumption, that the investment programs will be financed by a loan. In this case. In this case the interest payments will be compensated by higher profits as the new assets will increase the Regulatory Asset Base.

Improvement of district Heating in Kosovo 94
Providing the financial contribution as a grant would help to overcome the still prevailing financial problems.
8.2 Risks
8.2.1 Fuel prices Although the proposed investment program has a significant impact on the overall efficiency of the DH systems, fuel prices maintain a significant impact on the operational costs. As long as the tariffs are regularly and in due time reviewed and adjusted, DH companies can achieve full cost coverage. However, in practice, tariffs are only reviewed once a year and new tariffs do not necessarily cover past losses due to fuel prices increases occurred after the previous tariff review. However, the following tariff approval will compensate for these losses.
8.2.2 Collection rates Experience shows that consumption based billing will improve collection rates. However, there is the risk that collection rates go down with increasing tariffs, particularly when tariffs increase faster than the disposable income. Tariffs would go up substantially, when the general subsidies for DH will be reduced or even eliminated. Increasing tariffs to a cost covering level would require a system of targeted subsidies for low-income households. DH projects implemented in other Central and Eastern European Countries have demonstrated that collection rates can be significantly improved.
8.2.3 New connections All DH Companies assume a considerable increase of new connections for buildings that will be constructed according to city development plans. The main risks are:
- Plans will not be realized as projected either due to lacking financing or due to lower growth of population. Moreover, new buildings may require much less heat if more demanding building standards are applied.
- DH companies can no longer be sure that new building will be connected to DH, if alternative heat sources will be available.
The investment plans of the DH Companies therefore bear the risk of over-sizing and over-investing. It is therefore recommended to evaluate carefully and regularly the prospective for new connections.
8.3 Results The following chapters show the results of the financial forecasts.
8.3.1 Pristina The following figure shows the development of the costs. Numbers until 2008 are actual (reported) numbers, while those starting from 2009 are forecasted. Due to the presumed high average fuel price in 2009 costs will significantly go up and fall again in the following years. Thereafter fuel costs will gradually increase despite energy efficiency achievements in the whole DH system. This is caused on the one hand by new connections and on the other hand by increasing fuel prices.
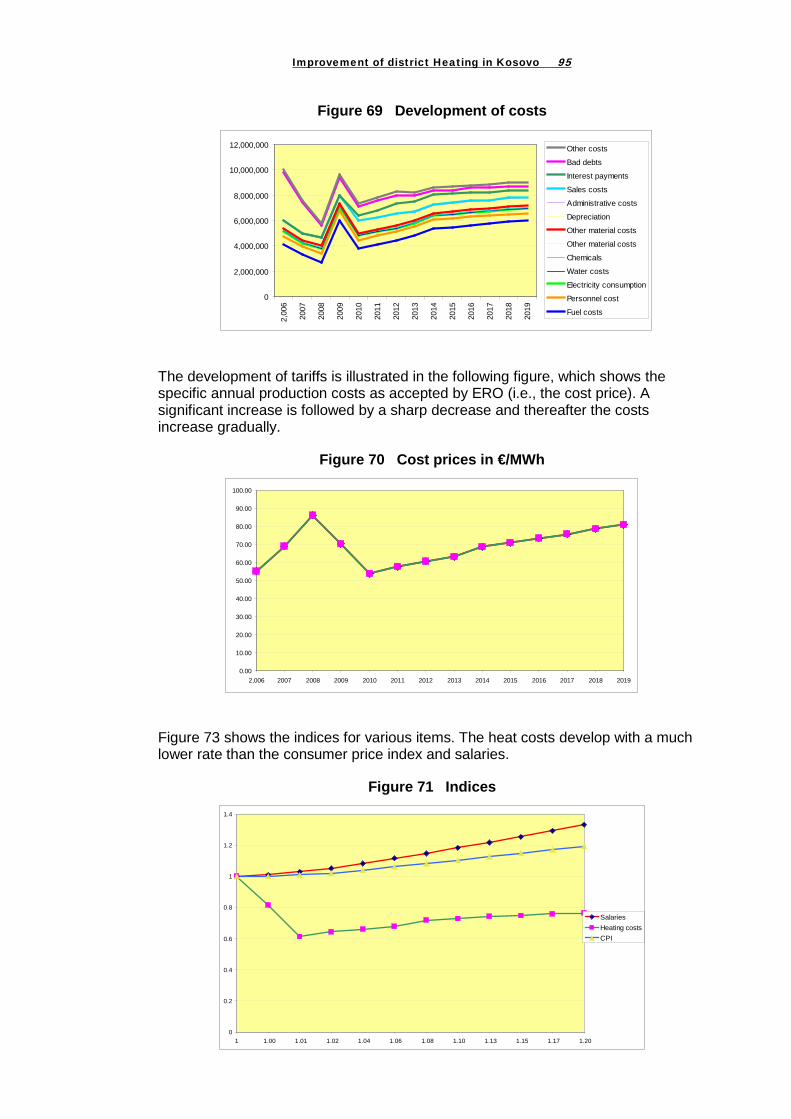
Improvement of district Heating in Kosovo 95
Figure 69 Development of costs
0
2,000,000
4,000,000
6,000,000
8,000,000
10,000,000
12,000,000
2,00
6
2007
2008
2009
2010
2011
2012
2013
2014
2015
2016
2017
2018
2019
Other costs
Bad debts
Interest payments
Sales costs
Administrative costs
Depreciation
Other material costs
Other material costs
Chemicals
Water costs
Electricity consumption
Personnel cost
Fuel costs
The development of tariffs is illustrated in the following figure, which shows the specific annual production costs as accepted by ERO (i.e., the cost price). A significant increase is followed by a sharp decrease and thereafter the costs increase gradually.
Figure 70 Cost prices in €/MWh
0.00
10.00
20.00
30.00
40.00
50.00
60.00
70.00
80.00
90.00
100.00
2,006 2007 2008 2009 2010 2011 2012 2013 2014 2015 2016 2017 2018 2019
Figure 73 shows the indices for various items. The heat costs develop with a much lower rate than the consumer price index and salaries.
Figure 71 Indices
0
0.2
0.4
0.6
0.8
1
1.2
1.4
1 1.00 1.01 1.02 1.04 1.06 1.08 1.10 1.13 1.15 1.17 1.20
SalariesHeating costsCPI
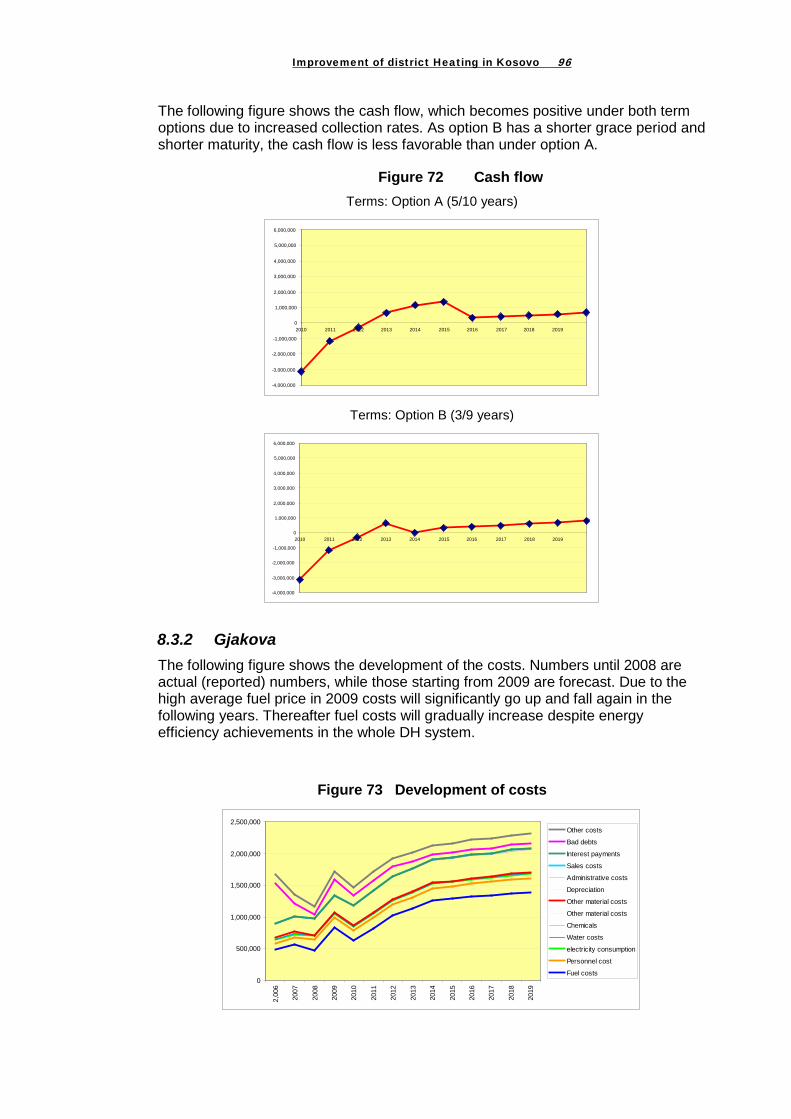
Improvement of district Heating in Kosovo 96
The following figure shows the cash flow, which becomes positive under both term options due to increased collection rates. As option B has a shorter grace period and shorter maturity, the cash flow is less favorable than under option A.
Figure 72 Cash flow Terms: Option A (5/10 years)
-4,000,000
-3,000,000
-2,000,000
-1,000,000
0
1,000,000
2,000,000
3,000,000
4,000,000
5,000,000
6,000,000
2010 2011 2012 2013 2014 2015 2016 2017 2018 2019
Terms: Option B (3/9 years)
-4,000,000
-3,000,000
-2,000,000
-1,000,000
0
1,000,000
2,000,000
3,000,000
4,000,000
5,000,000
6,000,000
2010 2011 2012 2013 2014 2015 2016 2017 2018 2019
8.3.2 Gjakova The following figure shows the development of the costs. Numbers until 2008 are actual (reported) numbers, while those starting from 2009 are forecast. Due to the high average fuel price in 2009 costs will significantly go up and fall again in the following years. Thereafter fuel costs will gradually increase despite energy efficiency achievements in the whole DH system.
Figure 73 Development of costs
0
500,000
1,000,000
1,500,000
2,000,000
2,500,000
2,00
6
2007
2008
2009
2010
2011
2012
2013
2014
2015
2016
2017
2018
2019
Other costs
Bad debts
Interest payments
Sales costs
Administrative costs
Depreciation
Other material costs
Other material costs
Chemicals
Water costs
electricity consumption
Personnel cost
Fuel costs

Improvement of district Heating in Kosovo 97
The development of tariffs is illustrated in the following figure, which shows the specific annual production costs as accepted by ERO (i.e., the cost price). A significant increase is followed by a sharp decrease and thereafter the costs increase gradually. At the end of the reference period (in 2019), the heat production costs will be lower than in Pristina. The main reason is that in Gjakova the DH network will be doubled and then most parts of system are new and equipped with modern technology will allow some cost reductions compare with the existing part.
Figure 74 Cost prices in €/MWh
0.00
20.00
40.00
60.00
80.00
100.00
120.00
2,006 2007 2008 2009 2010 2011 2012 2013 2014 2015 2016 2017 2018 2019
Figure 73 shows the indices for various items. The heat costs develop with a much lower rate than the consume price index and salaries.
Figure 75 Indices
0
0.2
0.4
0.6
0.8
1
1.2
1.4
2008 2009 2010 2011 2012 2013 2014 2015 2016 2017 2018 2019
Salaries
Heating costs
CPI
The following figure shows the cash flow. As option B has a shorter grace period and shorter maturity, the cash flow is less favorable than under option A. As option B has a shorter grace period and shorter maturity, the cash flow is less favorable than under option A.
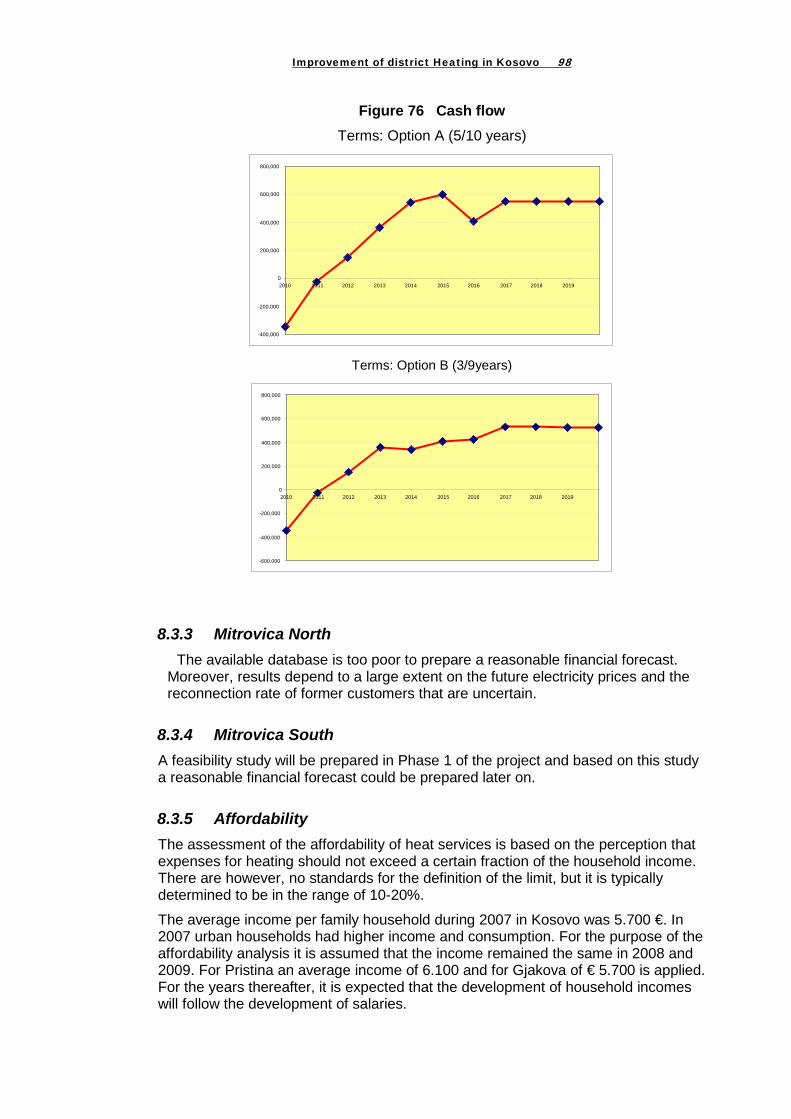
Improvement of district Heating in Kosovo 98
Figure 76 Cash flow Terms: Option A (5/10 years)
-400,000
-200,000
0
200,000
400,000
600,000
800,000
2010 2011 2012 2013 2014 2015 2016 2017 2018 2019
Terms: Option B (3/9years)
-600,000
-400,000
-200,000
0
200,000
400,000
600,000
800,000
2010 2011 2012 2013 2014 2015 2016 2017 2018 2019
8.3.3 Mitrovica North The available database is too poor to prepare a reasonable financial forecast.
Moreover, results depend to a large extent on the future electricity prices and the reconnection rate of former customers that are uncertain.
8.3.4 Mitrovica South A feasibility study will be prepared in Phase 1 of the project and based on this study a reasonable financial forecast could be prepared later on.
8.3.5 Affordability The assessment of the affordability of heat services is based on the perception that expenses for heating should not exceed a certain fraction of the household income. There are however, no standards for the definition of the limit, but it is typically determined to be in the range of 10-20%.
The average income per family household during 2007 in Kosovo was 5.700 €. In 2007 urban households had higher income and consumption. For the purpose of the affordability analysis it is assumed that the income remained the same in 2008 and 2009. For Pristina an average income of 6.100 and for Gjakova of € 5.700 is applied. For the years thereafter, it is expected that the development of household incomes will follow the development of salaries.

Improvement of district Heating in Kosovo 99
Figure 77 Total annual consumption of household in € (2003-2007)
Source: Statistical Office of Kosovo
Explanations: the terms elementary, secondary, and higher refer to education (school type)
The following figures show the share of heating costs in total household income. For the period 2006-2008 the heating bills are calculated based on the average revenue of the company, while for later years it is assumed that consumers will pay full cost covering tariffs. The limit of affordability is fixed at 15%,
The forecast shows that in average the burden is far below the threshold. There are however big differences, when the income distribution is taken into account. For pensioners, for example, the heating billing would likely require a big fraction of the income. As no numbers about income distribution were available, another group has been defined with 50% of the average income. Only in 2009 the group would achieve the limit due to the high fuel price prevailing in 2009. However, in reality the limit is not achieved as tariffs are still subsidized.
Anyway, the results do not show an extraordinary burden for final consumers. Numbers are similar to other CEE countries and cannot serve as a reasonable explanation or excuse for the low collection rates. The low collection rates are likely rather the results of an inconsequent collection policy. It is also worthwhile to compare these numbers with other expenses, such as communication (2-3) and tobacco and alcohol (3-4%).
Figure 78 Share of heating costs in household income (Pristina)
0%
2%
4%
6%
8%
10%
12%
14%
16%
2,006 2007 2008 2009 2010 2011 2012 2013 2014 2015 2016 2017 2018 2019
Threshold
Households with average income
Households with 50% of average income

Improvement of district Heating in Kosovo 100
Figure 79 Share of heating costs in household income (Gjakova)
0%
2%
4%
6%
8%
10%
12%
14%
16%
2,006 2007 2008 2009 2010 2011 2012 2013 2014 2015 2016 2017 2018 2019
ThresholdHouseholds with average incomeHouseholds with 50% of average income
8.3.6 CO2 emissions CO2 emissions are affected in two ways:
- The efficiency improvements that stem from the investment program, will lead to lower fuel consumption. The reduced CO2 emissions can be directly derived from the fuel consumption, which will exclusively be composed by mazut.
- The system expansions require additional heat production, which will come from heat-only boilers. DH will avoid electricity heating and replace the electricity produced in the coal-fired power plants.
- The calculation is based on the assumption that all heat produced in mazut fired boilers and all electricity in a TPP. Efficiency of electricity generation is 33% (Kosovo B) and assumed distribution losses are 10%.
Figure 78 summarizes the CO2 emission savings. Annex11.5 provides detail information for each city and subproject. A detailed calculation of CO2 savings is shown in annex 11.5.
Figure 80 CO2 emission savings
Total Supply building entrance
Heat gener-ation
Mazut consump-
tion
Coal consump-
tion CO2 emissions
Mazut Coal total MWh/yr MWh/yr MWh/yr MWh/yr tonnes/yr tonnes/yr tonnes/yr
System rehabilitation Energy savings by substation rehabilitation GWh/yr 20.4 20,423 23,208 27,303 7,667 7,667
Energy savings by pipe rehabilitation GWh/yr 71.6 71,625 84,264 23,661 23,661
Energy savings by boiler rehabilitation GWh/yr 6.8 6,830 1,918 1,918
Electricity savings *) MWh/yr 500.0 1,591 682 682 System expansion - Increased heat energy sales (-)/ reduced electricity consumption for heating (+)
GWh/yr - 42,242.4 -52,242 -52,029 -61,210 165,120 -17,188 70,738 53,550
Increased electricity consumption (pumping etc) MWh/yr 22.5 68 29 61
Total - 86,506
*) The reduced electricity consumption is due to electricity savings of pumps, boiler processes, substations, etc.

Improvement of district Heating in Kosovo 101

Improvement of district Heating in Kosovo 102
9 Regulatory and institutional measures and milestones required to support the investment programs
9.1 Project Management Capacities The project management capacities of the four parties can be briefly described as follows:
Gjakova Experience of the Company’s management in modern DH practices seems limited. The team noticed that from time to time the Gjakova management seeks advice from TERMOKOS. A project management unit, strongly supported by a consultant, would be needed.
Pristina The project management capacity is rather high, since the current staff is well experienced in DH rehabilitation based on the previous projects. The management has clear plans about what needs to be done in order to improve the overall economy of the DH system. A consultant should, however, be prepared to provide assistance and advice in specific issues as assist in procurement and supervision.
Mitrovica South There was no experience in DH system construction identified in the south part, since practically no DH exists there at the moment. The team suggests an organization unit will be created inside the municipality to start working on DH development in the south part of Mitrovica. Planning and implementation of the proposed DH system should be supported by a consultant
Mitrovica North The DH management is new and its experience in DH system rehabilitation remains to be demonstrated in practice. Visual inspection, however, allows assume that the maintenance management capacity regarding the DH system is of decent quality, since rather no technical problems have occurred neither in the network nor in the boiler plant, partly thanks to low pressure and temperature levels used to serve only a few connected customers. A consultant should be available to provide assistance and advice in specific issues as assist in procurement and supervision.
9.2 Regulation - The prevailing rules for tariff calculation constitute a sound basis for the
development of consumption based billing. However, the current cost-plus regulation should be replaced by an incentive regulation to foster technical energy and financial performance improvements. In practice, however, it would be reasonable, when general subsidies will be eliminated, as the Government will unlikely be ready to finance profits. The recommended incentive price regulation would be price cap regulation. Under this approach, a base line tariff is fixed which is valid for the whole regulatory period of usually 3-5 years. The actual tariff, however, is subject to the application of a price indexation formula that allows adjusting the tariff in accordance to input prices (such a fuel costs).

Improvement of district Heating in Kosovo 103
The opportunity to generate extra profits by improving the efficiency and performance provides incentives for the DH Companies
- Rules for allocating costs of electricity and heat produced in CHP and feed-in tariffs for electricity produced in CHP are still missing. Missing rules could constitute an obstacle for converting TPP Kosovo B to CHP.
- Although not included in the project, feed-tariffs for electricity produced by CHP with renewable energy are still missing. Such plants could supply heat to DH systems as well.
9.3 Organizational requirements - The conversion of supply driven to demand driven DH systems requires a new
business model, which has to address the client, i.e., final consumers.
- Final consumers mean not only existing consumers, but also potential new consumers. Each new consumer will contribute to the reduction of the specific fixed costs. The DH Companies have to approach this potential actively and develop incentive programs for new connections. Accelerating new connections would help to reduce start-off losses. This could even economically justify reduced or even no connection fees.
- A new organizational scheme has to correspond also to the new business model. Beside the technical and financial divisions, a sales division (on the same organizational level) should take care of the customer relationships. Activities comprising customer relationship will comprise (i) handling customer complaints, (ii) advice related to heating bills and equipment, (iii) information about opportunities for new connections, (iv) information about options for financing new connections and energy efficiency measures in buildings, and (v) information on maintenance breaks in advance.
9.4 Institutional requirements - All DH Companies: Consumption based billing has to be mandatory in those
buildings that will be equipped with meters.
- Individual (apartment-wise) heat metering and cost allocation should be the responsibility of the customers. This approach world correspond to the point of delivery and property border, which is usually the building entrance. Technical assistance should, however, be given for a pilot project that might be financed under this project.
- District heating companies should prepare longer term business plans. So far, all DH Companies do not have business plans covering more than the coming heating period. The business plan shall also help to define reasonable performance indicators. The business plan should be approved by the board, which will also monitor the performance indicators. Technical assistance should be provided to support the DH Companies in preparing business plans.
- Mitrovica: The municipality has to establish a new DH department or enterprise. The main tasks of this entity would be:
- assessing the willingness of apartment owners in the targeted buildings to connect to DH
- prepare and concluded preliminary connection contrast
- support the preparation of a feasibility study and design study
- assisting the consultant in procurement

Improvement of district Heating in Kosovo 104
- conclude final connection contracts with targeted customers
- conclude a contract with STANDARD Company about heat delivery
- operate and manage the DH system in Mitrovica South.
- It is recommended that the DH companies define performance indicators, which set certain targets to be achieved by the respective management. Annex 0 shows a sample. Numbers that are shown in the sample have been derived from the financial statements and various statistics. Some targets have been filled in, but determination of reasonable numbers requires intensive discussion within the company. This should be supported by the implementation consultant.

Improvement of district Heating in Kosovo 105
10 Requirements for technical assistance
10.1 Technical assistance for installation works - Training for the staff of the DH companies is needed to supervise the
installation of modern DH equipment
10.2 Technical assistance for maintenance and operation - Training for monitoring and commissioning works of the contractors. In order to
successfully complete supervision, the staff needs training for installation work documentation
- Technical assistance for maintenance an operation: The maintenance staff of the DH companies needs training in preventive maintenance as a way to reduce maintenance costs and to improve availability,
- The operation staff of the DH companies needs training (i) in hydraulic analysis of the networks that is tool for operational education as well and (ii) in demand driven operation of modern DH systems that can save fuel costs.
- Both operation and maintenance staff need training in the vital importance of maintaining the quality of the make-up and circulation water constantly on the required level. Good water quality is the key issue in eliminating internal corrosion of pipes and blocking of armatures.
10.3 Technical assistance for managing a DH Company - Training for business planning and financial forecasting: This TA intends to
provide training for business planning and financial forecasting. So far, the DH Companies have some ideas about the investment activities in the coming years, but neither financial nor organizational consequences are considered or planned.
- Business planning require, amongst other plans, the development of longer term investment plans and personnel development plans. Investment planning should also comprise consideration of alternative energy source, particularly renewable energy
- Technical assistance for implementing consumption based billing covering the whole area from meter reading, data processing, billing, and monitoring collections.
- Technical assistance would be needed to establish the DH activities undertaken by STANDARD Company/Mitrovica as a separate enterprise or to unbundle the accounts and determine appropriate cost distribution keys for common costs.
- Technical assistance for implementing a pilot project for cost distribution in multi-apartment buildings.
- Customer relationships: This TA component aims at providing training for building-up sound customer relationships. Activities should comprise:
o handling customer complaints,
o advice related to heating bills and alternative payment modes,

Improvement of district Heating in Kosovo 106
o information about opportunities for new connections and technical requirements
o information about options for financing new connections
o information about the rational use of heat energy
o information about options for improving the energy efficiency measures in apartments and buildings.
o Developing campaigns for new connections
o Information about planning, financing and managing building reconstruction measures to install centralized heating system to be connected to the DH system
o Computerizing the customer database
o Preparing a marketing plan
- In case of Mitrovica South, a comprehensive training for institution building (building up a new DH enterprise) is required. Such activity should involve participation and contributions from the other two DH Companies (Pristina and Gjakova), which could share their experience.
10.4 Technical Assistance for secondary legislation and ERO -
- Technical assistance for a eventual replacement of the current cost-plus price regulation by a price-cap regulation.
- Technical assistance for ERO particularly for defining the secondary legislation required by the new Central Heating Law.
- Technical assistance for the DH Company that have to develop a number of technical codes as stipulated by the Central Heating Law.
10.5 Organization of technical training Most training units can be done jointly for Pristina and Gjakova, as the problems are similar and both companies have good relations to each other. Most components of the training units can also be applied for Mitrovica North, but it cannot be done in together with the other two cities due to travel problems. The time being, Mitrovica South would probably not need the proper technical training (except on DH operational issues), but the training in financial issues and customer relations.

Improvement of district Heating in Kosovo 107
11 Annexes
11.1 Annex – Cost-benefit analysis Pristina Assumptions are explained in Chapter 8.1 and the details of the investment program have been described in chapter 7.2.5.
It should be noticed that “cost savings” under the header “Capacity” are investment costs savings for (avoided) boiler houses.
The following tables calculate the IRR from the prospective of the DH Company by comparing cost savings and expenditures for investments.
Maintenance cost savings for network rehabilitation have been calculated as benefits from accelerated pipeline replacement as shown in annex 11.6.
Figure 81 IRR Pristina – Substations
Item Unit 2010 2011 2012 2013 2014 2015 2020 2025 2030
Investment Component:I DH substation rehabilitationBenefits
HeatSubstation related losses
With the Project GWh/yr 5.6 3.1 1.0 0.0 0.0 0.0 0.0 0.0 0.0Without Project GWh/yr 5.6 5.6 5.6 5.6 5.6 5.6 5.6 5.6 5.6Savings in heat GWh/yr 0.0 2.5 4.6 5.6 5.6 5.6 5.6 5.6 5.6Savings in fuel GWh/yr 0.0 2.9 5.4 6.5 6.5 6.5 6.5 6.5 6.5
Price of fuel €/MWh 31.0 31.0 31.0 31.0 31.0 31.0 31.0 31.0 31.0Fuel savings 000 €/yr 0.0 89.6 166.0 200.2 200.2 200.2 200.2 200.2 200.2
WaterWith the Project 000 m³ 71.5 71.5 71.5 71.5 71.5 71.5 71.5 71.5 71.5Without Project 000 m³ 71.5 71.5 71.5 71.5 71.5 71.5 71.5 71.5 71.5Savings 000 m³ 0.0 0.0 0.0 0.0 0.0 0.0 0.0 0.0 0.0Unit costs €/m³ 1.0 1.0 1.0 1.0 1.0 1.0 1.0 1.0 1.0Cost savings 000 €/yr 0.0 0.0 0.0 0.0 0.0 0.0 0.0 0.0 0.0
ElectricityWith the Project MWh 4,500 4,433 4,365 4,298 4,230 4,163 4,050 4,050 4,050Without Project MWh 4,500 4,500 4,500 4,500 4,500 4,500 4,500 4,500 4,500Savings MWh 0 68 135 203 270 338 450 450 450Unit costs €/MWh 80 80 80 80 80 80 80 80 80Cost savings 000 €/yr 0.0 5.4 10.8 16.2 21.6 27.0 36.0 36.0 36.0
CapacityWith the Project MW 102.5 101.6 100.8 99.9 99.1 98.3 96.8 96.8 96.8Without Project MW 102.5 102.5 102.5 102.5 102.5 102.5 102.5 102.5 102.5Savings MW 0.0 0.8 1.7 2.5 3.4 4.2 5.6 5.6 5.6Unit costs €/kW 100.0 100.0 100.0 100.0 100.0 100.0 100.0 100.0 100.0Cost savings 000 €/yr 0.0 0.1 0.2 0.3 0.3 0.4 0.6 0.6 0.6
StaffWith the Project # 176 175 174 172 171 170 168 168 168Without Project # 176 176 176 176 176 176 176 176 176Savings # 0.0 1.2 2.4 3.6 4.8 6.0 8.0 8.0 8.0Unit costs €/yr, cap 6,000 6,000 6,000 6,000 6,000 6,000 6,000 6,000 6,000Cost savings 000 €/yr 0.0 7.2 14.4 21.6 28.8 36.0 48.0 48.0 48.0
MaintenanceCost savings 000 €/yr
Total savings 000 €/yr 0.0 102.2 191.3 238.3 250.9 263.6 284.8 284.8 284.8Investment costs 000 €/yr 850.0 725.0 325.0 0.0 0.0 0.0Net cash flow of Component 000 €/yr -850.0 -622.8 -133.7 238.3 250.9 263.6 284.8 284.8 284.8IRR of Component 12.9%

Improvement of district Heating in Kosovo 108
Figure 82 IRR Pristina – Network Item Unit 2010 2011 2012 2013 2014 2015 2020 2025 2030
Investment Component:II DH network rehabilitationBenefits
HeatNetwork losses
With the Project GWh/yr 14.3 11.9 9.7 8.6 8.6 8.6 8.6 8.6 8.6Without Project GWh/yr 14.3 19.8 19.8 19.8 19.8 19.8 19.8 19.8 19.8Savings in heat GWh/yr 0.0 7.9 10.1 11.3 11.3 11.3 11.3 11.3 11.3Savings in fuel GWh/yr 0.0 9.2 11.7 13.1 13.1 13.1 13.1 13.1 13.1
Price of fuel €/MWh 31.0 31.0 31.0 31.0 31.0 31.0 31.0 31.0 31.0Fuel savings 000 € 0.0 285.0 363.5 405.8 405.8 405.8 405.8 405.8 405.8
WaterWith the Project 000 km3 71.5 65.0 58.6 52.2 45.7 39.3 28.6 28.6 28.6Without Project 000 km3 71.5 71.5 71.5 71.5 71.5 71.5 71.5 71.5 71.5Savings 000 km3 0.0 6.4 12.9 19.3 25.7 32.2 42.9 42.9 42.9Unit costs €/m3 1.0 1.0 1.0 1.0 1.0 1.0 1.0 1.0 1.0Cost savings 000 € 0.0 6.4 12.9 19.3 25.7 32.2 42.9 42.9 42.9
ElectricityWith the Project MWh 4,500.0 4,486.5 4,473.0 4,459.5 4,446.0 4,432.5 4,410.0 4,410.0 4,410.0Without Project MWh 4,500.0 4,500.0 4,500.0 4,500.0 4,500.0 4,500.0 4,500.0 4,500.0 4,500.0Savings MWh 0.0 13.5 27.0 40.5 54.0 67.5 90.0 90.0 90.0Unit costs €/MWh 80.0 80.0 80.0 80.0 80.0 80.0 80.0 80.0 80.0Cost savings 000 € 0.0 1.1 2.2 3.2 4.3 5.4 7.2 7.2 7.2
StaffWith the Project # 176.0 175.4 174.8 174.2 173.6 173.0 172.0 172.0 172.0Without Project # 176.0 176.0 176.0 176.0 176.0 176.0 176.0 176.0 176.0Savings # 0.0 0.6 1.2 1.8 2.4 3.0 4.0 4.0 4.0Unit costs €/yr, cap 6,000.0 6,000.0 6,000.0 6,000.0 6,000.0 6,000.0 6,000.0 6,000.0 6,000.0Cost savings 000 € 0.0 3.6 7.2 10.8 14.4 18.0 24.0 24.0 24.0
Maintenance Maintenance 000 € 90.0 90.0 90.0 90.0 90.0 90.0 90.0 90.0 90.0
Total savings 000 € 90.0 386.1 475.7 529.1 540.2 551.3 569.8 569.8 569.8Investment costs 000 € 1,741.4 1,611.3 868.8 0.0 0.0 0.0 0.0 0.0Net cash flow of Component 000 € -1,651.4 -1,225.2 -393.1 529.1 540.2 551.3 569.8 569.8 569.8IRR of Component 13.1%

Improvement of district Heating in Kosovo 109
Figure 83 IRR Pristina – Heat generation and DH expansion
Investment Component:II DH network rehabilitationBenefits
HeatNetwork losses
With the Project GWh/yr 14.3 11.9 9.7 8.6 8.6 8.6 8.6 8.6 8.6Without Project GWh/yr 14.3 19.8 19.8 19.8 19.8 19.8 19.8 19.8 19.8Savings in heat GWh/yr 0.0 7.9 10.1 11.3 11.3 11.3 11.3 11.3 11.3Savings in fuel GWh/yr 0.0 9.2 11.7 13.1 13.1 13.1 13.1 13.1 13.1
Price of fuel €/MWh 31.0 31.0 31.0 31.0 31.0 31.0 31.0 31.0 31.0Fuel savings 000 € 0.0 285.0 363.5 405.8 405.8 405.8 405.8 405.8 405.8
WaterWith the Project 000 km3 71.5 65.0 58.6 52.2 45.7 39.3 28.6 28.6 28.6Without Project 000 km3 71.5 71.5 71.5 71.5 71.5 71.5 71.5 71.5 71.5Savings 000 km3 0.0 6.4 12.9 19.3 25.7 32.2 42.9 42.9 42.9Unit costs €/m3 1.0 1.0 1.0 1.0 1.0 1.0 1.0 1.0 1.0Cost savings 000 € 0.0 6.4 12.9 19.3 25.7 32.2 42.9 42.9 42.9
ElectricityWith the Project MWh 4,500.0 4,486.5 4,473.0 4,459.5 4,446.0 4,432.5 4,410.0 4,410.0 4,410.0Without Project MWh 4,500.0 4,500.0 4,500.0 4,500.0 4,500.0 4,500.0 4,500.0 4,500.0 4,500.0Savings MWh 0.0 13.5 27.0 40.5 54.0 67.5 90.0 90.0 90.0Unit costs €/MWh 80.0 80.0 80.0 80.0 80.0 80.0 80.0 80.0 80.0Cost savings 000 € 0.0 1.1 2.2 3.2 4.3 5.4 7.2 7.2 7.2
StaffWith the Project # 176.0 175.4 174.8 174.2 173.6 173.0 172.0 172.0 172.0Without Project # 176.0 176.0 176.0 176.0 176.0 176.0 176.0 176.0 176.0Savings # 0.0 0.6 1.2 1.8 2.4 3.0 4.0 4.0 4.0Unit costs €/yr, cap 6,000.0 6,000.0 6,000.0 6,000.0 6,000.0 6,000.0 6,000.0 6,000.0 6,000.0Cost savings 000 € 0.0 3.6 7.2 10.8 14.4 18.0 24.0 24.0 24.0
Maintenance Maintenance 000 € 90.0 90.0 90.0 90.0 90.0 90.0 90.0 90.0 90.0
Total savings 000 € 90.0 386.1 475.7 529.1 540.2 551.3 569.8 569.8 569.8Investment costs 000 € 1,741.4 1,611.3 868.8 0.0 0.0 0.0 0.0 0.0Net cash flow of Component 000 € -1,651.4 -1,225.2 -393.1 529.1 540.2 551.3 569.8 569.8 569.8IRR of Component 13.1%

Improvement of district Heating in Kosovo 110
The following table shows the IRR from the prospective of final consumers, which will replace electric heating by district heating and who will benefit from the differences in electricity and district heating tariffs. Investment costs are larger than above as they include investment costs for the indoor heating system.
Figure 84 IRR system expansion from consumer prospective Item Unit 2010 2011 2012 2013 2014 2015 2020 2030
nvestment Component:Added heated area 000 m3/yr 64.5 64.5 64.5Added capacity need MW/yr 5.7 5.7 5.7Added heat energy need GWh/yr 7.8 7.8 7.8
A. Costs of electric heatingEnergy GWh/yr 7.8 15.6 23.4 23.4 23.4 23.4 23.4 23.4Unit costs €/MWh 80 80 80 80 80 80 80 80Electricity costs 000 € 623 1246.49 1869.7 1869.7 1869.7 1869.7 1869.7 1869.734
B. Cost of district heatingEnergy GWh/yr 9.7 19.5 29.2 29.2 29.2 29.2 29.2 29.2Unit costs €/MWh 31 31 31 31 31 31 31 31DH tariff costs 000 € 301.626 603.251 904.88 904.88 904.88 904.88 904.88 904.8768
otal savings 000 € 322 643 965 965 965 965 965 965nvestment costs for DH 000 € 2,465 2,363 2,083et cash flow of Component 2,143 1,719 1,118 -965 -965 -965 -965 -965
RR of Component 15%

Improvement of district Heating in Kosovo 111
11.2 Annex – Cost-benefit analysis Gjakova Assumptions are explained in Chapter 7.2.1 ff and the details of the investment program have been described in chapter 7.2.6.
It should be noticed that “cost savings” under the header “Capacity” are investment costs savings for (avoided) boiler houses.
The following tables calculate the IRR from the prospective of the DH Company by comparing cost savings and expenditures for investments.
Maintenance cost savings for network rehabilitation have been calculated as benefits from accelerated pipeline replacement as shown in annex 11.6.
Figure 85 IRR Gjakova - Substations
Item Unit 2010 2011 2012 2013 2014 2015 2020 2030
Investment Component:I DH substation rehabilitationBenefits
HeatSubstation related losses
With the Project GWh 2.6 0.7 0.0 0.0 0.0 0.0 0.0 0.0Without Project GWh 2.6 2.6 2.6 2.6 2.6 2.6 2.6 2.6Savings in heat GWh 0.0 2.0 2.6 2.6 2.6 2.6 2.6 2.6Savings in fuel GWh 0.0 2.3 3.0 3.0 3.0 3.0 3.0 3.0
Price of fuel €/MWh 31.0 31.0 31.0 31.0 31.0 31.0 31.0 31.0Fuel savings 000 €/yr 0 71 93 95 95 95 95 95
WaterWith the Project 000 m3 7.8 7.5 7.1 6.8 6.5 6.1 5.6 5.6Without Project 000 m3 7.8 7.8 7.8 7.8 7.8 7.8 7.8 7.8Savings 000 m3 0.0 0.3 0.7 1.0 1.4 1.7 2.3 2.3Unit costs €/m3 1 1 1 1 1 1 1 1Cost savings 000 €/yr 0 0 1 1 1 2 2 2
ElectricityWith the Project MWh 500 492.5 485 477.5 470 462.5 450 450Without Project MWh 500 500 500 500 500 500 500 500Savings MWh 0 7.5 15 22.5 30 37.5 50 50Unit costs €/MWh 80 80 80 80 80 80 80 80Cost savings 000 €/yr 0 1 1 2 2 3 4 4
CapacityWith the Project MW 50 50 50 50 49 49 49 49Without Project MW 50 50 50 50 50 50 50 50Savings MW 0 0 0 0 1 1 1 1Unit costs €/kW 100 100 100 100 100 100 100 100Cost savings 000 €/yr 0 0 0 0 0 0 0 0
StaffWith the Project # 31 31 30 30 29 28 25 25Without Project # 31 31 31 31 31 31 31 31Savings # 0 0 0 1 1 1 1 1Unit costs €/cap,yr 6000 6000 6000 6000 6000 6000 6000 6000Cost savings 000 €/yr 0 1 2 4 5 6 8 8
MaintenanceCost savings 000 €/yr
Total savings 000 €/yr 0 73 97 101 103 105 109 109Investment costs 000 €/yr 685 212 15Net cash flow of Component 000 €/yr -685 -139 82 101 103 105 109 109IRR of Component 10.2%

Improvement of district Heating in Kosovo 112
Figure 86 IRR Gjakova - Network Item Unit 2010 2011 2012 2013 2014 2015 2020 2030 Investment Component: II DH network rehabilitation Benefits He
at
Network losses With the Project GWh 1.8 1.7 1.6 1.6 1.6 1.6 1.6 1.6 Without Project GWh 1.8 1.8 1.8 1.8 1.8 1.8 1.8 1.8 Savings in heat GWh 0.0 0.1 0.2 0.2 0.2 0.2 0.2 0.2 Savings in fuel GWh 0.0 0.1 0.2 0.2 0.2 0.2 0.2 0.2 Price of fuel €/MWh 31.0 31.0 31.0 31.0 31.0 31.0 31.0 31.0 Fuel savings 000 €/yr 0 2 6 6 6 6 6 6 Water With the Project 000 m3 7.8 7.5 7.1 6.8 6.5 6.1 5.6 5.6 Without Project 000 m3 7.8 7.8 7.8 7.8 7.8 7.8 7.8 7.8 Savings 000 m3 0.0 0.3 0.7 1.0 1.4 1.7 2.3 2.3 Unit costs €/m3 1 1 1 1 1 1 1 1 Cost savings 000 €/yr 0 0 1 1 1 2 2 2 Electricity With the Project MWh 500 498.5 497 495.5 494 492.5 490 490 Without Project MWh 500 500 500 500 500 500 500 500 Savings MWh 0 2 3 5 6 8 10 10 Unit costs €/MWh 80 80 80 80 80 80 80 80 Cost savings 000 €/yr 0 0 0 0 0 1 1 1 Sta
ff
With the Project # 31 31 31 31 31 31 30 30 Without Project # 31 31 31 31 31 31 31 31 Savings # 0 0 0 0 0 1 1 1 Unit costs €/cap,yr 6000 6000 6000 6000 6000 6000 6000 6000 Cost savings 000 €/yr 0 1 1 2 2 3 4 4 Maintenance Cost savings 000 €/yr 10 10 10 10 10 10 10 10 Total savings 000 €/yr 10 13 18 19 20 21 23 23 Investment costs 000 €/yr 100 150 150 Net cash flow of Component 000 €/yr -90 -137 -132 19 20 21 23 23 IRR of Component 3.8%

Improvement of district Heating in Kosovo 113
Figure 87 IRR Gjakova – Boiler houses and expansion Item Unit 2010 2011 2012 2013 2014 2015 2020 2030Investment Component:III Boiler rehabilitationBenefits
Fuel energy savingsWith the Project GWh 22.303 22.2 22.1 22.0 21.9 21.8 21.7 21.7Without Project GWh 22.303 22.303 22.303 22.303 22.303 22.303 22.303 22.3Savings in fuel GWh 0 0.1 0.2 0.3 0.4 0.5 0.7 0.7
Price of fuel €/MWh 31.0 31.0 31.0 31.0 31.0 31.0 31.0 31.0Fuel savings 000 €/yr 0 3 6 9 12 15 20 20
WaterWith the Project 000 m3 7.8 7.8 6.7 6.7 6.7 6.7 6.7 6.7Without Project 000 m3 7.8 7.8 7.8 7.8 7.8 7.8 7.8 7.8Savings 000 m3 0 0 1.1 1.1 1.1 1.1 1.1 1.1Unit costs €/m3 1 1 1 1 1 1 1 1Cost savings 000 €/yr 0 0 1 1 1 1 1 1
ElectricityWith the Project MWh 500 500 500 500 500 500 500 500Without Project MWh 500 500 500 500 500 500 500 500Savings MWh 0 0 0 0 0 0 0 0Unit costs €/MWh 80 80 80 80 80 80 80 80Cost savings 000 €/yr 0 0 0 0 0 0 0 0
StaffWith the Project # 31 31 31 31 31 31 31 31Without Project # 31 31 31 31 31 31 31 31Savings # 0 0 0 0 0 0 0 0Unit costs €/cap,yr 6000 6000 6000 6000 6000 6000 6000 6000Cost savings 000 €/yr 0 0 0 0 0 0 0 0
Maintenance Cost savings 000 €/yr 4 4 4 4 4
Total savings 000 €/yr 0 3 7 14 17 20 26 26Investment costs 000 €/yr 162 92 30Net cash flow of Component 000 €/yr -162 -89 -23 14 17 20 26 26IRR of Component 5.0%Item Unit 2010 2011 2012 2013 2014 2015 2020 2030Investment Component:III DH system extension
Added heated area 000 m2 60 60 0Added capacity need MW 5.7 5.7 0.0Added heat energy need GWh 7.8 7.8 0.0Regulated asset base 000 €/yr 330 634 703 673 642 612 460 156Return on asset base 000 €/yr 38 73 82 78 75 71 53 18
Investment costs 000 €/yr 330 330 100Net cash flow of Component 000 €/yr -292 -257 -18 78 75 71 53 18IRR of Component 5.1%
The following table shows the IRR from the prospective of final consumers, which will replace electric heating by district heating and who will benefit from the differences in electricity and district heating tariffs.
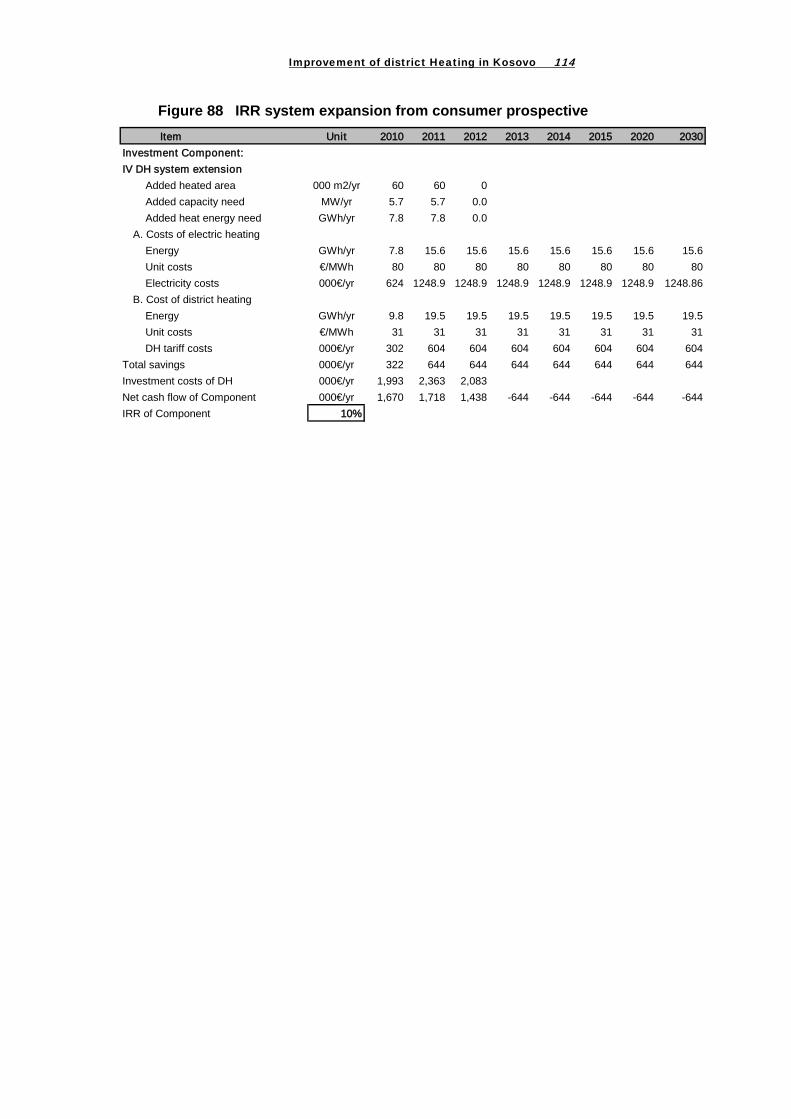
Improvement of district Heating in Kosovo 114
Figure 88 IRR system expansion from consumer prospective Item Unit 2010 2011 2012 2013 2014 2015 2020 2030
Investment Component:IV DH system extension
Added heated area 000 m2/yr 60 60 0Added capacity need MW/yr 5.7 5.7 0.0Added heat energy need GWh/yr 7.8 7.8 0.0
A. Costs of electric heatingEnergy GWh/yr 7.8 15.6 15.6 15.6 15.6 15.6 15.6 15.6Unit costs €/MWh 80 80 80 80 80 80 80 80Electricity costs 000€/yr 624 1248.9 1248.9 1248.9 1248.9 1248.9 1248.9 1248.86
B. Cost of district heatingEnergy GWh/yr 9.8 19.5 19.5 19.5 19.5 19.5 19.5 19.5Unit costs €/MWh 31 31 31 31 31 31 31 31DH tariff costs 000€/yr 302 604 604 604 604 604 604 604
Total savings 000€/yr 322 644 644 644 644 644 644 644Investment costs of DH 000€/yr 1,993 2,363 2,083Net cash flow of Component 000€/yr 1,670 1,718 1,438 -644 -644 -644 -644 -644IRR of Component 10%

Improvement of district Heating in Kosovo 115
11.3 Annex – Cost-benefit analysis Mitrovica North Assumptions are explained in Chapter 7.2.1 ff and the details of the investment program have been described in chapter 7.2.7.
The following tables calculates the IRR from the prospective of the DH Company by comparing cost savings and expenditures for investments.
Maintenance cost savings for network rehabilitation have been calculated as benefits from accelerated pipeline replacement as shown in annex 11.6.
Figure 89 IRR Mitrovica North Item Unit 2010 2011 2012 2013 2014 2015 2020 2030Investment Component:I DH Pipe rehabilitationBenefits
HeatNetwork losses
With the Project GWh/yr 3.0 2.1 1.1 1.1 1.1 1.1 1.1 1.1Without Project GWh/yr 3.0 3.0 3.0 3.0 3.0 3.0 3.0 3.0Savings in heat GWh/yr 0.0 1.0 1.9 1.9 1.9 1.9 1.9 1.9Savings in fuel GWh/yr 0.0 1.1 2.2 2.2 2.2 2.2 2.2 2.2Price of fuel €/MWh 31.0 31.0 31.0 31.0 31.0 31.0 31.0 31.0Fuel savings 000 €/yr 0.0 34.5 68.9 68.9 68.9 68.9 68.9 68.9
WaterWith the Project 000 m3 5.8 2.9 0.0 0.0 0.0 0.0 0.0 0.0Without Project 000 m3 5.8 5.8 5.8 5.8 5.8 5.8 5.8 5.8Savings 000 m3 0.0 0.5 0.9 1.4 1.8 2.3 42.9 42.9Unit costs €/m3 1.0 1.0 1.0 1.0 1.0 1.0 1.0 1.0Cost savings 000 €/yr 0.0 0.5 0.9 1.4 1.8 2.3 42.9 42.9
ElectricityWith the Project MWh 0.0 0.0 0.0 0.0 0.0 0.0 0.0 0.0Without Project MWh 0.0 0.0 0.0 0.0 0.0 0.0 0.0 0.0Savings MWh 0.0 0.0 0.0 0.0 0.0 0.0 0.0 0.0Unit costs €/MWh 0.0 0.0 0.0 0.0 0.0 0.0 0.0 0.0Cost savings 000 €/yr 0.0 0.0 0.0 0.0 0.0 0.0 0.0 0.0
StaffWith the Project # 3.0 1.5 0.0 0.0 0.0 0.0 0.0 0.0Without Project # 3.0 3.0 3.0 3.0 3.0 3.0 3.0 3.0Savings # 0.0 1.5 3.0 3.0 3.0 3.0 3.0 3.0Unit costs €/yr, cap 6,000.0 6,000.0 6,000.0 6,000.0 6,000.0 6,000.0 6,000.0 6,000.0Cost savings 000 €/yr 0.0 9.0 18.0 18.0 18.0 18.0 18.0 18.0
MaintenanceCost savings 000 €/yr 0.0 10.0 10.0 10.0 10.0 10.0 10.0 10.0
Total cost savings 000 €/yr 0.0 53.9 97.8 98.3 98.7 99.2 139.8 139.8Investment costs 000 €/yr 0.0 779.1 779.1 0.0 0.0 0.0 0.0 0.0Net cash flow of Component 000 €/yr 0.0 -725.2 -681.3 98.3 98.7 99.2 139.8 139.8IRR of Component 5.4%
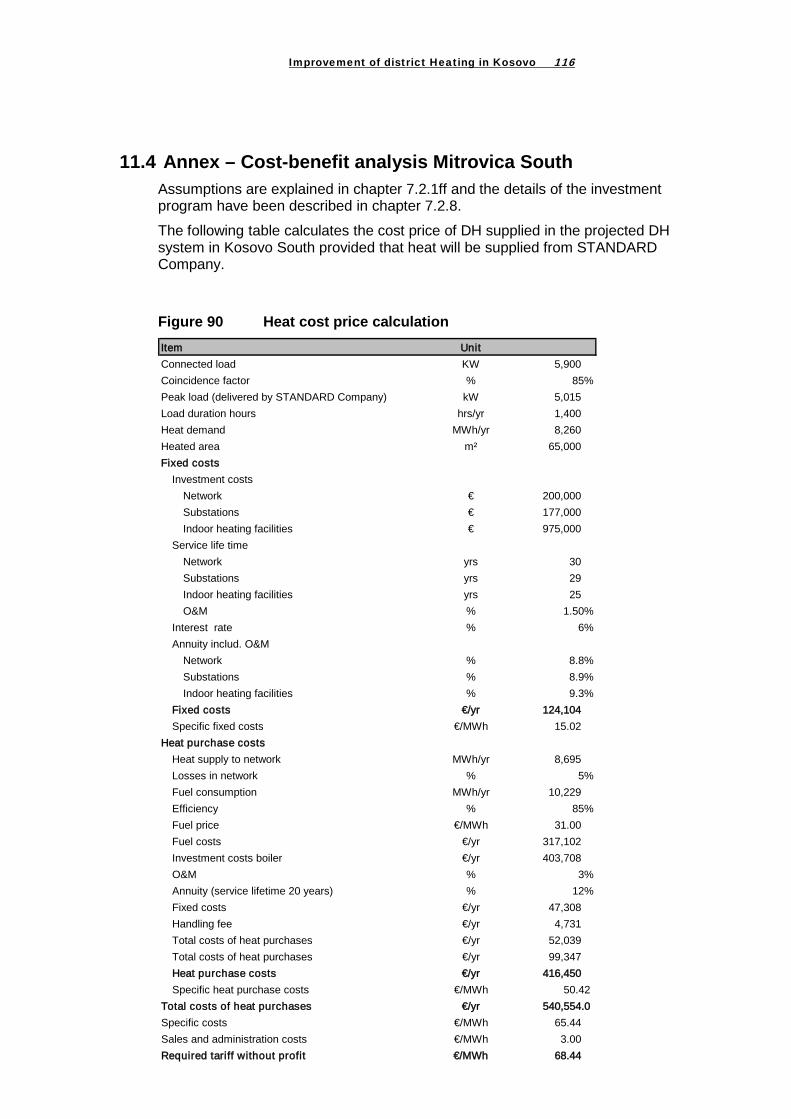
Improvement of district Heating in Kosovo 116
11.4 Annex – Cost-benefit analysis Mitrovica South Assumptions are explained in chapter 7.2.1ff and the details of the investment program have been described in chapter 7.2.8.
The following table calculates the cost price of DH supplied in the projected DH system in Kosovo South provided that heat will be supplied from STANDARD Company.
Figure 90 Heat cost price calculation Item UnitConnected load KW 5,900 Coincidence factor % 85%Peak load (delivered by STANDARD Company) kW 5,015 Load duration hours hrs/yr 1,400 Heat demand MWh/yr 8,260 Heated area m² 65,000 Fixed costs
Investment costsNetwork € 200,000 Substations € 177,000 Indoor heating facilities € 975,000
Service life timeNetwork yrs 30 Substations yrs 29 Indoor heating facilities yrs 25 O&M % 1.50%
Interest rate % 6%Annuity includ. O&M
Network % 8.8%Substations % 8.9%Indoor heating facilities % 9.3%
Fixed costs €/yr 124,104 Specific fixed costs €/MWh 15.02
Heat purchase costsHeat supply to network MWh/yr 8,695 Losses in network % 5%Fuel consumption MWh/yr 10,229 Efficiency % 85%Fuel price €/MWh 31.00 Fuel costs €/yr 317,102 Investment costs boiler €/yr 403,708 O&M % 3%Annuity (service lifetime 20 years) % 12%Fixed costs €/yr 47,308 Handling fee €/yr 4,731 Total costs of heat purchases €/yr 52,039 Total costs of heat purchases €/yr 99,347 Heat purchase costs €/yr 416,450 Specific heat purchase costs €/MWh 50.42
Total costs of heat purchases €/yr 540,554.0 Specific costs €/MWh 65.44 Sales and administration costs €/MWh 3.00 Required tariff without profit €/MWh 68.44

Improvement of district Heating in Kosovo 117
Figure 91 IRR Mitrovica South Item Unit 2010 2011 2012 2013 2014 2015 2020IRR calculation with fill cost covering STANDARD heat cost price
Added heated area 000 m²/yr 35 30Added capacity need MW/yr 3.2 2.7 0.0 0.0Added heat energy need GWh/yr 4.6 2.7 0.0 0.0
A. Costs of electric heatingEnergy GWh/yr 4.6 7.2 7.2 7.2 7.2 7.2 7.2Unit costs €/MWh 80 80 80 80 80 80 80Electricity costs 000 m²/yr 364 579 579 579 579 579 579
B. Cost of district heatingHeat energy GWh/yr 4.6 7.2 7.2 7.2 7.2 7.2 7.2Unit costs €/MWh 68.44 68.44 68.44 68.44 68.44 68.44 68.44DH costs 000 m²/yr 311 496 496 496 496 496 496
Investments in DH 000 m²/yr 700 700Total cost savings 000 m²/yr -53 -84 -84 -84 -84 -84 -84Net cash flow of Component 000 m²/yr 647 616 -84 -84 -84 -84 -84IRR of Component 3%IRR calculation with fuel price
Added heated area 000 m²/yr 35 30Added capacity need MW/yr 3.2 2.7 0.0 0.0Added heat energy need GWh/yr 4.6 2.7 0.0 0.0
A. Costs of electric heatingEnergy GWh/yr 4.6 7.2 7.2 7.2 7.2 7.2 7.2Unit costs €/MWh 80 80 80 80 80 80 80Electricity costs 000 m²/yr 364 579 579 579 579 579 579
B. Cost of district heatingHeat energy GWh/yr 5.7 9.1 9.1 9.1 9.1 9.1 9.1Unit costs €/MWh 30.97 30.97 30.97 30.97 30.97 30.97 30.97DH costs 000 m²/yr 176 280 280 280 280 280 280
Investments in DH 000 m²/yr 700 700Total cost savings 000 m²/yr -188 -299 -299 -299 -299 -299 -299
Net cash flow of Component 000 m²/yr 512 401 -299 -299 -299 -299 -299IRR of Component 28%

Improvement of district Heating in Kosovo 118
11.5 Annex - Calculation of CO2 emissions
Fuel consumption for electricity has been calculated based on the overall efficiency of 31.5% (overall efficiency of generation, transmission, and distribution of the KEK system).
The table calculates the CO2 savings stemming from the direct benefits of investment measures, i.e., fuel and electricity savings as well as benefits stemming from avoided electric heating.
In case of DH expansion, it is assumed that district heating will replace electric heating. Such assumption is justified as expansion refers mostly to new building, which can either use only DH or electricity.
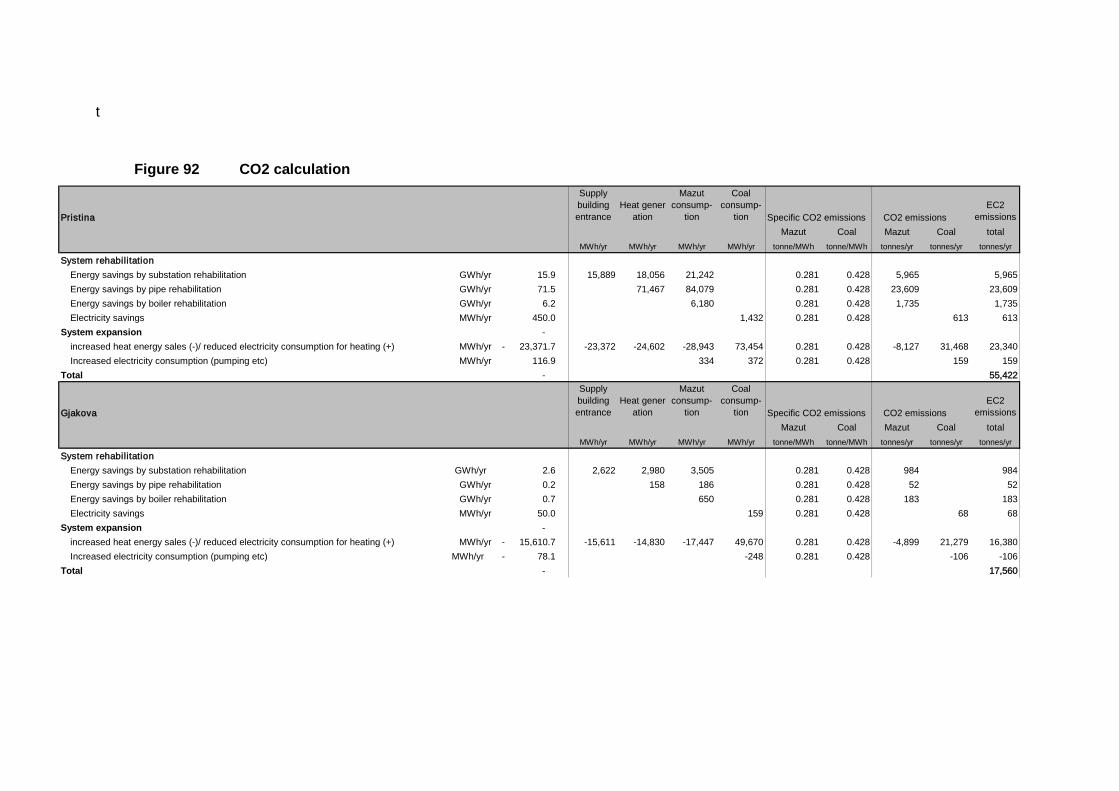
t
Figure 92 CO2 calculation
Pristina
Supply building entrance
Heat gener-ation
Mazut consump-
tion
Coal consump-
tion Specific CO2 emissions CO2 emissionsEC2
emissionsMazut Coal Mazut Coal total
MWh/yr MWh/yr MWh/yr MWh/yr tonne/MWh tonne/MWh tonnes/yr tonnes/yr tonnes/yr
System rehabilitationEnergy savings by substation rehabilitation GWh/yr 15.9 15,889 18,056 21,242 0.281 0.428 5,965 5,965Energy savings by pipe rehabilitation GWh/yr 71.5 71,467 84,079 0.281 0.428 23,609 23,609Energy savings by boiler rehabilitation GWh/yr 6.2 6,180 0.281 0.428 1,735 1,735Electricity savings MWh/yr 450.0 1,432 0.281 0.428 613 613
System expansion - increased heat energy sales (-)/ reduced electricity consumption for heating (+) MWh/yr 23,371.7 - -23,372 -24,602 -28,943 73,454 0.281 0.428 -8,127 31,468 23,340Increased electricity consumption (pumping etc) MWh/yr 116.9 334 372 0.281 0.428 159 159
Total - 55,422
Gjakova
Supply building entrance
Heat gener-ation
Mazut consump-
tion
Coal consump-
tion Specific CO2 emissions CO2 emissionsEC2
emissionsMazut Coal Mazut Coal total
MWh/yr MWh/yr MWh/yr MWh/yr tonne/MWh tonne/MWh tonnes/yr tonnes/yr tonnes/yr
System rehabilitationEnergy savings by substation rehabilitation GWh/yr 2.6 2,622 2,980 3,505 0.281 0.428 984 984Energy savings by pipe rehabilitation GWh/yr 0.2 158 186 0.281 0.428 52 52Energy savings by boiler rehabilitation GWh/yr 0.7 650 0.281 0.428 183 183Electricity savings MWh/yr 50.0 159 0.281 0.428 68 68
System expansion - increased heat energy sales (-)/ reduced electricity consumption for heating (+) MWh/yr 15,610.7 - -15,611 -14,830 -17,447 49,670 0.281 0.428 -4,899 21,279 16,380Increased electricity consumption (pumping etc) MWh/yr 78.1 - -248 0.281 0.428 -106 -106
Total - 17,560

Improvement of district Heating in Kosovo 120
CO2 calculation (continued)
Mitrovica North
Supply building entrance
Heat gener-ation
Mazut consump-
tion
Coal consump-
tion Specific CO2 emissions CO2 emissionsEC2
emissionsMazut Coal Mazut Coal total
MWh/yr MWh/yr MWh/yr MWh/yr tonne/MWh tonne/MWh tonnes/yr tonnes/yr tonnes/yr
System rehabilitationEnergy savings by substation rehabilitation GWh/yr 2 1,912 2,172 2,556 0.281 0.428 718 718Energy savings by pipe rehabilitation GWh/yr 0.281 0.428Energy savings by boiler rehabilitation GWh/yr 0.281 0.428Electricity savings MWh/yr 0.281 0.428
System expansion increased heat energy sales (-)/ reduced electricity consumption for heating (+) GWh/yr -5,000 -5,000 -4,750 -5,588 15,714 0.281 0.428 -1,569 6,732 5,163Increased electricity consumption (pumping etc) MWh/yr 25 76 0.281 0.428 32 32
Total 5,913
Mitrovica South
Supply building entrance
Heat gener-ation
Mazut consump-
tion
Coal consump-
tion Specific CO2 emissions CO2 emissionsEC2
emissionsMazut Coal Mazut Coal total
MWh/yr MWh/yr MWh/yr MWh/yr tonne/MWh tonne/MWh tonnes/yr tonnes/yr tonnes/yr
System rehabilitationEnergy savings by substation rehabilitation GWh/yr 0.281 0.428Energy savings by pipe rehabilitation GWh/yr 0.281 0.428Energy savings by boiler rehabilitation GWh/yr 0.281 0.428Electricity savings MWh/yr 0.281 0.428
System expansion increased heat energy sales (-)/ reduced electricity consumption for heating (+) GWh/yr -8 -8,260 -7,847 -9,232 26,282 0.281 0.428 -2,592 11,259 8,667Increased electricity consumption (pumping etc) MWh/yr -41 -131 0.281 0.428 -56 -56
Total 8,611
Total
pp y building entrance
Heat gener-ation
consump-
tion
consump-
tion Specific CO2 emissions CO2 emissionsEC2
emissionsMazut Coal Mazut Coal total
MWh/yr MWh/yr MWh/yr MWh/yr tonne/MWh tonne/MWh tonnes/yr tonnes/yr tonnes/yr
System rehabilitationEnergy savings by substation rehabilitation GWh/yr 20 20,423 23,208 27,303 0.281 0.428 7,667 7,667Energy savings by pipe rehabilitation GWh/yr 72 71,625 84,264 0.281 0.428 23,661 23,661Energy savings by boiler rehabilitation GWh/yr 7 6,830 0.281 0.428 1,918 1,918Electricity savings MWh/yr 500 1,591 0.281 0.428 682 682
System expansionincreased heat energy sales (-)/ reduced electricity consumption for heating (+) GWh/yr -43,991 -52,242 -52,029 -61,210 165,120 0.281 0.428 -17,188 70,738 53,550Increased electricity consumption (pumping etc) MWh/yr 23 68 0.281 0.428 29 29
Total 87,506

11.6 Annex – Financial effects of accelerated investment in pipe replacement The following table shows the costs and benefits of accelerated pipeline replacement investments. Such question arises if pipes have high water and heat losses, which cause high costs. These costs can be reduced be replacing the pipes before the end of the normal lifetime, but addition financial costs (mainly interest payments will incur. The sample assumes that pipes of a network length of 12.000 m have to be replaced22
Figure 93 Calculation of costs and benefits of accelerated pipe replacement
.
Length of network to be replaced m 12,000 Lifetime of new pipes yrs 30 Lifetime of old pipes yrs 12 Investment costs €/m 403.50 Interest rate (real) % 6% O&M old % 2% OM new % 1% Heat losses old MWh/m 0.676 Heat losses new MWh/m 0.190 Water losses m3 42,900 Fuel price €/MWh 30.00 Water price €/m³ 1.00
Item Unit Total Year 1 Year 2 Year 5 Year 10 2year 0 Year 30 Business as usual Pipe replacement m/yr 12,190 1,000 889 699 548 413 - All pipes (total existing network) m 12,000 12,000 12,000 12,000 12,000 12,000
New pipes (replacing old pipes) m 1,889 1,889 4,145 7,143 11,786 12,000 Old pipes (to be replaced) m 10,111 10,111 7,855 4,857 214 -
Lifetime of old pipes yrs 12 14 17 22 29 30 Investment costs (accumulated) € 39,034,287 403,500 762,167 1,672,363 2,882,028 4,755,455 4,918,605 Investment costs 403,500 358,667 282,028 221,180 166,627 - Loan € 403,500 762,167 1,446,937 1,671,403 965,153 (199,501) Repayment 108,859 266,085 215,816 50,012 O&M €/yr 92,805 89,218 80,116 68,020 49,285 49,186 O&M new €/yr 4,035 7,622 16,724 28,820 47,555 49,186 O&M old €/yr 88,770 81,597 63,393 39,199 1,731 - Heat losses MWh/yr 7,623 7,191 6,095 4,639 2,385 2,280 Heat losses new MWh/yr 190 359 788 1,357 2,240 2,280 Heat losses old MWh/yr 7,433 6,832 5,308 3,282 145 - Water losses M³/yr 39,325 36,147 28,083 17,365 767 29 New pipes M³/yr 0 0 0 0 0 29 Old pipes M³/yr 39,325 36,147 28,083 17,365 767 - Total costs €/yr 4,392,790 425,375 424,894 410,148 349,414 192,120 117,727 Fuel costs €/yr 2,288,415 269,035 253,799 215,132 163,744 84,159 80,482 Water costs €/yr 246,231 39,325 36,147 28,083 17,365 767 29 Interest payments €/yr 911,984 24,210 45,730 86,816 100,284 57,909 (11,970) O&M €/yr 946,159 92,805 89,218 80,116 68,020 49,285 49,186 Total costs excluding interest €/yr 401,165 379,164 323,332 249,129 134,211 129,698 NPV € 4,392,790
22 The lifetime of the existing old pipes increases gardually, as it can be assumed that the water quatlity improves..

Improvement of district Heating in Kosovo 122
Accelerated investment Pipe replacement m/yr
12,000
-
-
-
-
- All pipes m
12,000
12,000
12,000
12,000
12,000
12,000 New pipes m 12000
12,000
12,000
12,000
12,000
12,000 old pipes m
-
-
-
-
-
- Lifetime of old pipes yrs 12
30
30
30
30
30 Investment costs (accumulated) €
4,842,000
4,842,000
4,842,000
4,842,000
4,842,000
4,842,000 Investment costs
4,842,000
-
-
-
-
- Loan €
4,842,000
4,842,000
3,389,400
968,400
-
- Repayment
484,200
484,200
O&M €/yr 48,420
48,420
48,420
48,420
48,420
48,420
O&M new €/yr 48,420
48,420
48,420
48,420
48,420
48,420
O&M old €/yr -
-
-
-
-
-
Heat losses MWh/yr 2,280
2,280
2,280
2,280
2,280
2,280
Heat losses new MWh/yr 2,280
2,280
2,280
2,280
2,280
2,280
Heat losses old MWh/yr -
-
-
-
-
-
Water losses m³/yr -
-
-
6
26
46
New pipes m³/yr -
-
-
3
13
23
Old pipes m³/yr -
-
-
3
13
23
Total costs €/yr 3,254,444
419,422
419,422
332,266
187,012
128,928
128,948
Fuel costs €/yr 1,107,828
80,482
80,482
80,482
80,482
80,482
80,482
Water costs €/yr 156
-
-
-
6
26
46
Interest payments €/yr 1,479,968
290,520
290,520
203,364
58,104
-
-
O&M €/yr 666,493
48,420
48,420
48,420
48,420
48,420
48,420
Total costs excluding interest €/yr 128,902
128,902
128,902
128,908
128,928
128,948
NPV € 3,254,444
Average annual costs excluding interest Business as usual €/yr
108,481
210,691
Accelerated investment €/yr 36,928
128,921
Average savings €/yr 71,554
81,770
Average annual costs including interest Business as usual €/yr
266,938
Accelerated investment €/yr 191,867
Average savings €/yr 75,071
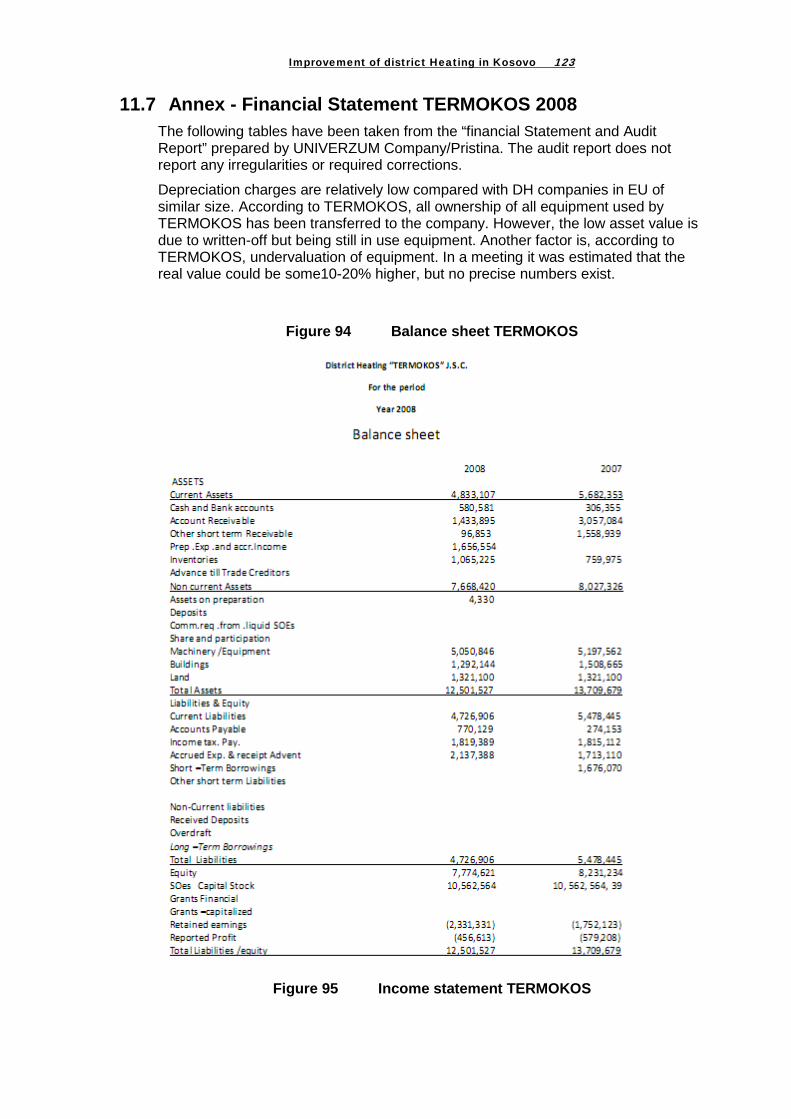
Improvement of district Heating in Kosovo 123
11.7 Annex - Financial Statement TERMOKOS 2008 The following tables have been taken from the “financial Statement and Audit Report” prepared by UNIVERZUM Company/Pristina. The audit report does not report any irregularities or required corrections.
Depreciation charges are relatively low compared with DH companies in EU of similar size. According to TERMOKOS, all ownership of all equipment used by TERMOKOS has been transferred to the company. However, the low asset value is due to written-off but being still in use equipment. Another factor is, according to TERMOKOS, undervaluation of equipment. In a meeting it was estimated that the real value could be some10-20% higher, but no precise numbers exist.
Figure 94 Balance sheet TERMOKOS
Figure 95 Income statement TERMOKOS

Improvement of district Heating in Kosovo 124
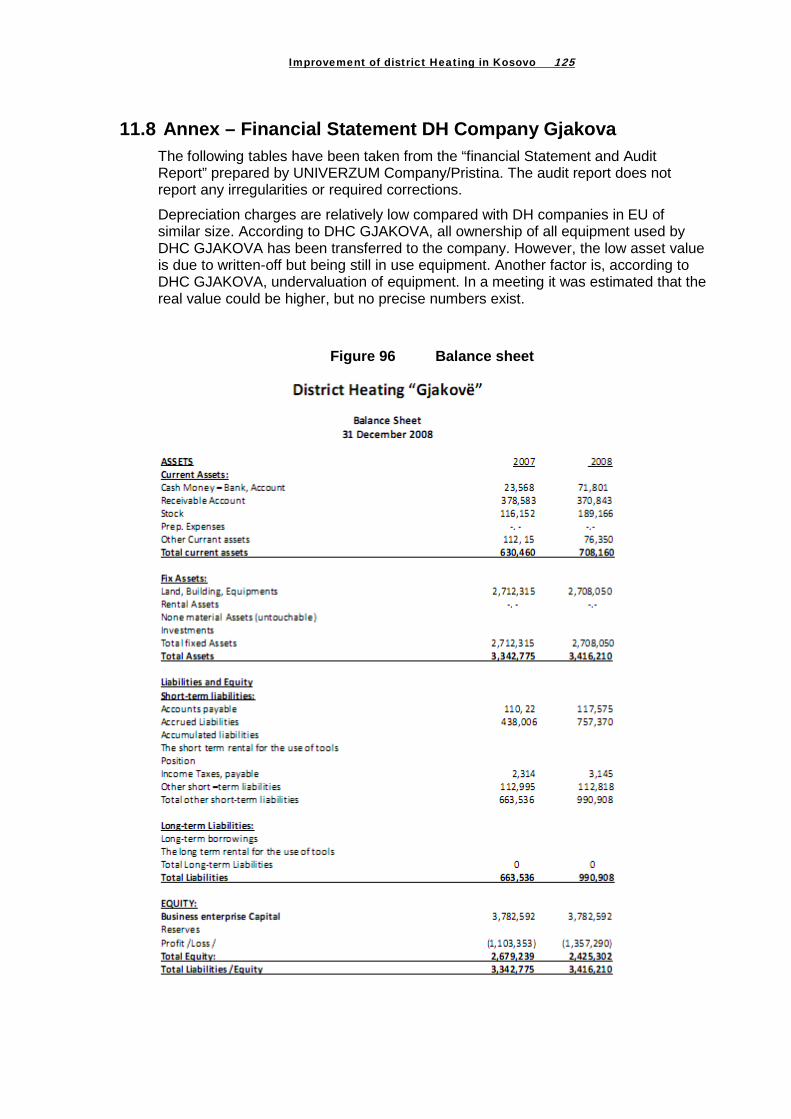
Improvement of district Heating in Kosovo 125
11.8 Annex – Financial Statement DH Company Gjakova The following tables have been taken from the “financial Statement and Audit Report” prepared by UNIVERZUM Company/Pristina. The audit report does not report any irregularities or required corrections.
Depreciation charges are relatively low compared with DH companies in EU of similar size. According to DHC GJAKOVA, all ownership of all equipment used by DHC GJAKOVA has been transferred to the company. However, the low asset value is due to written-off but being still in use equipment. Another factor is, according to DHC GJAKOVA, undervaluation of equipment. In a meeting it was estimated that the real value could be higher, but no precise numbers exist.
Figure 96 Balance sheet

Improvement of district Heating in Kosovo 126
Figure 97 Income Statement DH Company Gjakova

Improvement of district Heating in Kosovo 127
11.9 Financial Statement STANDARD Company Mitrovica The following tables show the balance sheets and income statements of STANDARD Company. Separate statements for the DH business are not available. A table of expenditures for DH was presented, but it shows only the direct costs, i.e. common costs have not been distributed to the various businesses. Accordingly, neither a balance sheet nor an income statement is available for the DH business.
Figure 98 Balance sheet
2,008 2,0075 6
íASSETS lA. Permanent PROPERTY (002 +0034-0044-005 +009) 15,532 13,661I Unpaid subscribed capitalII GOODWILLIII. Intangible INVESTMENTIV. REAL ESTATE, plant, EQUIPMENT l BIOLOGICAL ASSETS (006 +007 +008) 15,532 13,6611. Property, plant and equipment 15,532 13,6612. Investment Property3. Biological resourcesV. Long-term FINANSUSKI PLASMAN (010 +011)1 participation in capital2. Other long-term financial placementsB. Current assets (013 +014 +015) 25,636 21,164I. Cash 615 882II. Fixed assets intended for sale l BUSINESS ASSETS that stopsIII. SHORT-TERM demand, placement and CASH (016 +017 +018 +019 +020) 25,021 20,2821. Claims 8,752 8,8072. Claims for more tax paid on the profit3. Short-term financial placements 13,396 7,3504. Cash and cash equivalents 2,803 4,1255. Value added tax and the time between 70V. Deferred tax assetsG. BUSINESS PROPERTY (001 +012 +021) 41,168 34,825D. Loss above capital levelDj. TOTAL ASSETS (022 +023) 41,168 34,825E. VANBILANSNA ASSETS 2,293 2,474LIABILITIESA. CAPITAL 1 02 +1 03 +1 04 +1 05 +1 06-1 07 +1 08-1 09-1 1 0) 27,826 15,445I. Share capital 6,084 6,084II Unpaid subscribed capitalIII. ReservesV. Revaluation reserve 497 497V. NEREALIZOVANI Gains on the basis of value MARTYVI. NEREALIZOVANI LOSSES by MARTY of valueVII. Undistributed PROFIT 22,023 9,642VIII. LOSS 778 778IX. Redeemed shareholder ACTIONB. Long-term provisons and liabilities (112 +113 +116) 13,342 19,380I Long-term provisionsII. Long-term LIABILITIES (114 +115)1. Long-term loans2. Other long-term liabilitiesIII. OBLIGATION OF SHORT-TERM (117 +118 +119 +120 +121 +122) 13,342 19,3801. Short-term financial obligations2. Obligations on the basis of the funds for sales and business assets that stops3. Obligations from the business 651 8,4014. Other short-term obligations 9,463 10,9775. Obligations on the basis of the value added tax and other public revenues, and the time between the passive 3,228
6. Obligations under the taxV. Deferred tax burdenG. TOTAL LIABILITIES (101 +111 +123) 41,168 34,825D. VANBILANSNA LIABILITIES 2,293 2,474

Improvement of district Heating in Kosovo 128
Figure 99 Income statement
2008 2007
5 6
Operating income and expenesOperating income 114,974 114,957
Sales revenues 23,236 28,323
Own work capitalized
Increase in inventories
Decrease in inventories
Other operating income 91,738 86,634
Operating expenses 112,110 105,472
Expenses for merchandise sold
Cost of material 14,511 16,691
Wages, salaries, and other personal expenses 92,238 82,111
Depreciation and provisions 2,376 1,390
Other operating expenses 2,985 5,280
Operating profit 2,864 9,485
Operating lossFinancial income 1,749
Financial expensesOther income 7,993 581
Other expenses 225 424
Profit from ordinary activities 12,381 9,642Loss of business before tax
Net profit of business that stops
Net loss of business that stops
Profit of business before tax 12,381 9,642
Loss before taxation
Profit tax
Tax expense period 332 470
Deffered tax expenses
Deffered income etx
Paid personal income employer
Net profit 12,049 9,172Net loss
Net profit which belongs to minority investors
Net profits which belongs to owners MAT1CNOG legal entity
Earnings per share
Basic earnings per share
Decreasing (razvodnjena) Earnings per share

Improvement of district Heating in Kosovo 129
11.10 Annex – Performance indicators The following table defines a number of performance indicators, which could be used for internal control as well as by the Board for supervision and the Bank for supervision of the project. Numbers have been derived from financial statements as well as internal statistics. However, the various departments can use different numbers, which is partly due a lacking consistent management information system, but also due to different definitions. Therefore it would be recommended to review particularly the physical numbers and define them unambiguously to allow a common understanding of the performance indicators.
Another important issue is the definition of the indicators to be achieved in future, i.e. definition of targets. Such targets should be based on a business plan that is understood and accepted by the whole management.
The table below should b read as follow:
- Yellow-marked fields need inputs
- Grey marked field do not require any input
- All numbers for 2008 are actual numbers
- Numbers for 2009 an following years are proposals or estimates

Improvement of district Heating in Kosovo 130 Performance indicatorsStart year 2010
Financial indicators PristinaIndicator Unit 2008 actual 2009
actual2009 plan 2010
actual2010 plan Initial target
2013Current ratio = Current assets / Current liabilities / - / 1.22 >=1Quick ratio = (Current assets – Inventories) / Current liabilities / - /Accorunts receivable days = Accounts receivable / Annual credit sales * 365 days
d 157 <45
Accounts payable days = Accounts payable / Total expenditures * 365 days
d 57 <45
Debt ratio = Total liabilities / Total assets / - / 0.38 <1Debt to equity ratio = (Long-term debt + Value of leases) / Stockholders' equity
/ - / - <1
Debt service coverage ratio = Net operating income / Total debt service
/ - / Has to be defined
Gross Margin = {Revenue} - Cost of Goods Sold}/ Revenue % -8% 10%Work productivity = (Total revenues of DH business / Average number of employees engaged in DH business)
€/cap 30,619
Bad Debts Written Off per Revenue = Bad Debts Written Off / revenues
% 17% <=5%
Cost coverage = Revenues from DH business / (Total expenditures - bad debts - interest payments)
% 80% >=111%
1. Net operating income: Income after deducting for operating expenses but before deducting for income taxes and interest.
Market and Technical Performance indicatorsIndicator 2008 actual 2009
actual2009
plannedl2010 actual
2010 planned
Target 2013
Degree days 1) K*d 2,397 3,099 Connected load KW 98,000 130,000 Supplied heated area (exclduing disconnections) m² 1,010,331 1,250,000 Supplied heated area residential customers (excluding disconnections)
m² 614,075 845,000
Disconnected area m² 64,294 1,000 Disconnected area of residential consumers m² 20,600 800 Conversion of existing buildings to DH m² - Heat supplied to the networks MWh/yr 82,932 Heat supplied to the networks temperature corrected 3) MWh/yr 107,220 - - - - Fuel consumption 4) MWh/yr 97,756 Fuel consumption temperature corrected 5) MWh/yr 126,386 - - - - Heat generation efficiency 6) % 84.8% 85.0% 86.0% 89.0% 88.0% 89.0%Heat purchases 7) MWh/yrHeat purchases temperature corrected 8) MWh/yrLosses 9a) MWh/yrLosses percentage 9b) % 15% 0% 0% 0% 0% >=10%Service interruptions hours 10) hrs/yrDamages 11) No/km 3.8 3.8 1.0 Specific heat consumption of residential consumers 12) MWh/mˇ,yr >=0.100Staff capStaff productivity 13) cap/GWh - - - - - 1.00 Building connected NoBuildings connected and meters installed NoResidential buildings connected NoResidential buildings connected and meters installed NoMetering coverage I 14) % 0% 0% 0% 0% 0% >=1Metering coverage II 15) % 0% 0% 0% 0% 0% >=1Heat sold (total) MWh/yrHeat sold to residential consumers MWh/yrMetered consumption MWh/yrMetered consumption of residential consumers MWh/yrCoverage of consumption based billing % 0% 0% 0% 0% 0% 100%Coverage of consumption based billing of residential consumers % 0% 0% 0% 0% 0% 100%

Improvement of district Heating in Kosovo 131 1. Degree days = (Normative indoor temperature – average outside temperature during headings season) * heating days per year * heating hours per day 2. Measured or calculated at plant exit or point of delivery for purchased heat 3. Corrected heat supply = Actual heat supply * actual degree days/ normative degree days 4. Fuel consumption measured at plant entry 5. Fuel consumption temperature corrected = Actual fuel consumption * actual degree days/ normative degree days 6. Heat generation efficiency = actual heat supply / actual fuel consumption 7. Heat purchased measured at point of delivery 8. Heat purchased temperature-corrected = Actual heat purchased * actual degree days/ normative degree days 9a Losses = Heat produced and supplied + heat purchased - total heat sales 9b Losses percentage = Losses/heat supplied to the network 10. Total hours of service interruption in the distribution system 11. Number of damages occurred in the DH system per pipeline length (double pipe) 12. Specific heat consumption of residential consumers = total heat supplied to residential consumers / total heated area 13. Staff productivity – Total staff / total supplied heat 14. Meter coverage I = Number of heat meters for final consumption / number of buildings connected 15. Meter coverage II _ Number of meters of residential buildings / number of the residential buildings
Investments and planningIndicator 2008 actual 2009
actual2009
planne2010 actual
2010 planned
Investments ´000€Maintenance and repairs ´000€
Customer baseCustomer group 2008 actual 2009
actual2009
plannedl
2010 actual
2010 planned
Percentage change
Percentage chang
e
No No No MWh/yr MWh/yrA B C D E F =B/A G=D/
CResidential consumers 0.0% 0.0%Commercial consumers 0.0% 0.0%Budgetary consumers 0.0% 0.0%Industrial consumers (excl.. Steam) 0.0% 0.0%Steam consumers 0.0% 0.0%

Improvement of district Heating in Kosovo 132
11.11 Average costs The following table show the average costs of heat supply (production and distribution) for 2008. The financial numbers have been taken from the financisl statements and the heat production numbers have been provided by the company.
Figure 100 Pristina Gjakoba Heat consumption MWh 15,168 Total costs €/yr 1,164,327 Average costs €/MWh 76.76 Total expenditures plus return on capital and less bad debts and interest payments
€/yr 1,387,948
Average costs €/MWh 91.51
Figure 101 Gjakova Pristina Heat consumption MWh 66,602
Total costs €/yr 5,845,567 Average costs €/MWh 87.77 Total expenditures plus return on capital and less bad debts and interest payments
€/yr 5,744,528
Average costs €/MWh 86.25
Figure 102 Mitrovica North
Heat supply MWh/yr 2,800 Total costs RSD/yr 24,960,000 Average heat price RSD/MWh 8,914 Average heat price €/MWh 100.16
*) As STANDARD Company provided only direct costs for DH, a surcharge of 20% for indirect costs has been assumed.
I

Improvement of district Heating in Kosovo 133
11.12 Cash flow In accordance with the approach for the financial forecast the cash flow calculation is based on the assumption that from 2009, the DH Companies deliver a full heating service allover the whole heating seasn.
Negative cash flows are mostly due to low collection rates. The companies should consequently improve collections. Their management is, however, skeptical, to what extent such goal can be realized. They are aware that in the end they have to sue non-paying customers, but according to their experience, courts are reluctant and slow.
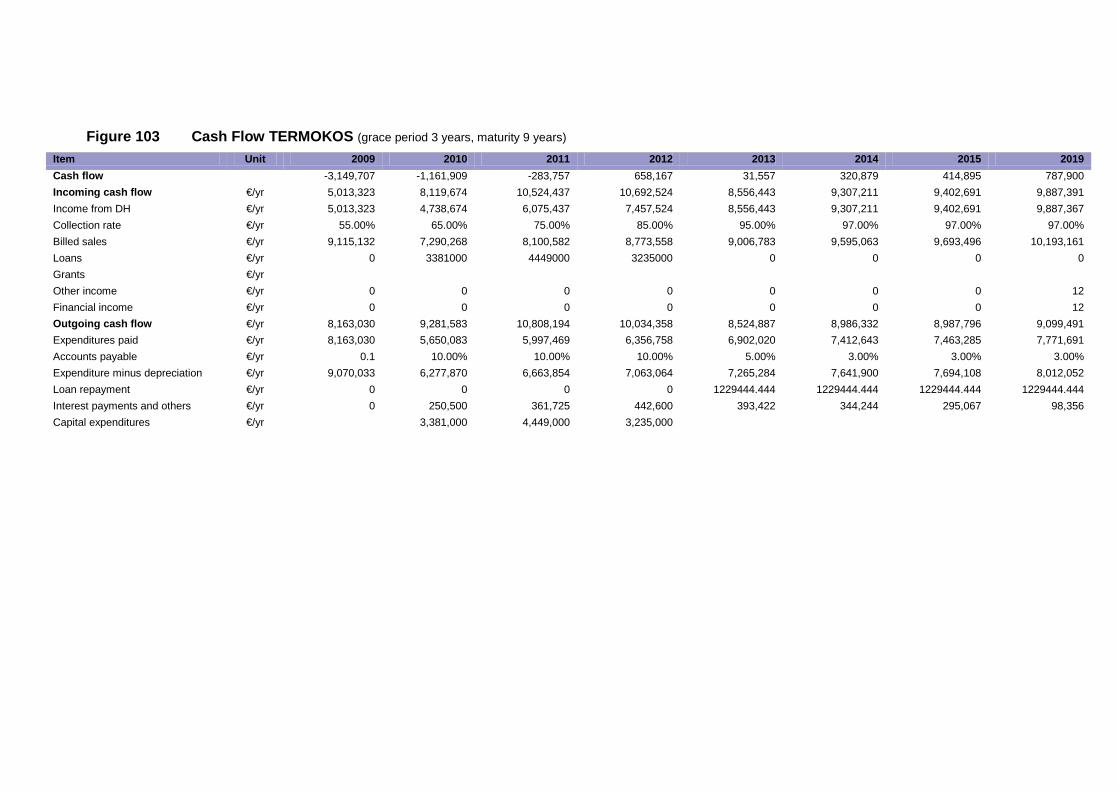
Figure 103 Cash Flow TERMOKOS (grace period 3 years, maturity 9 years) Item Unit 2009 2010 2011 2012 2013 2014 2015 2019 Cash flow -3,149,707 -1,161,909 -283,757 658,167 31,557 320,879 414,895 787,900 Incoming cash flow €/yr 5,013,323 8,119,674 10,524,437 10,692,524 8,556,443 9,307,211 9,402,691 9,887,391 Income from DH €/yr 5,013,323 4,738,674 6,075,437 7,457,524 8,556,443 9,307,211 9,402,691 9,887,367 Collection rate €/yr 55.00% 65.00% 75.00% 85.00% 95.00% 97.00% 97.00% 97.00% Billed sales €/yr 9,115,132 7,290,268 8,100,582 8,773,558 9,006,783 9,595,063 9,693,496 10,193,161 Loans €/yr 0 3381000 4449000 3235000 0 0 0 0 Grants €/yr Other income €/yr 0 0 0 0 0 0 0 12 Financial income €/yr 0 0 0 0 0 0 0 12 Outgoing cash flow €/yr 8,163,030 9,281,583 10,808,194 10,034,358 8,524,887 8,986,332 8,987,796 9,099,491 Expenditures paid €/yr 8,163,030 5,650,083 5,997,469 6,356,758 6,902,020 7,412,643 7,463,285 7,771,691 Accounts payable €/yr 0.1 10.00% 10.00% 10.00% 5.00% 3.00% 3.00% 3.00% Expenditure minus depreciation €/yr 9,070,033 6,277,870 6,663,854 7,063,064 7,265,284 7,641,900 7,694,108 8,012,052 Loan repayment €/yr 0 0 0 0 1229444.444 1229444.444 1229444.444 1229444.444 Interest payments and others €/yr 0 250,500 361,725 442,600 393,422 344,244 295,067 98,356 Capital expenditures €/yr 3,381,000 4,449,000 3,235,000
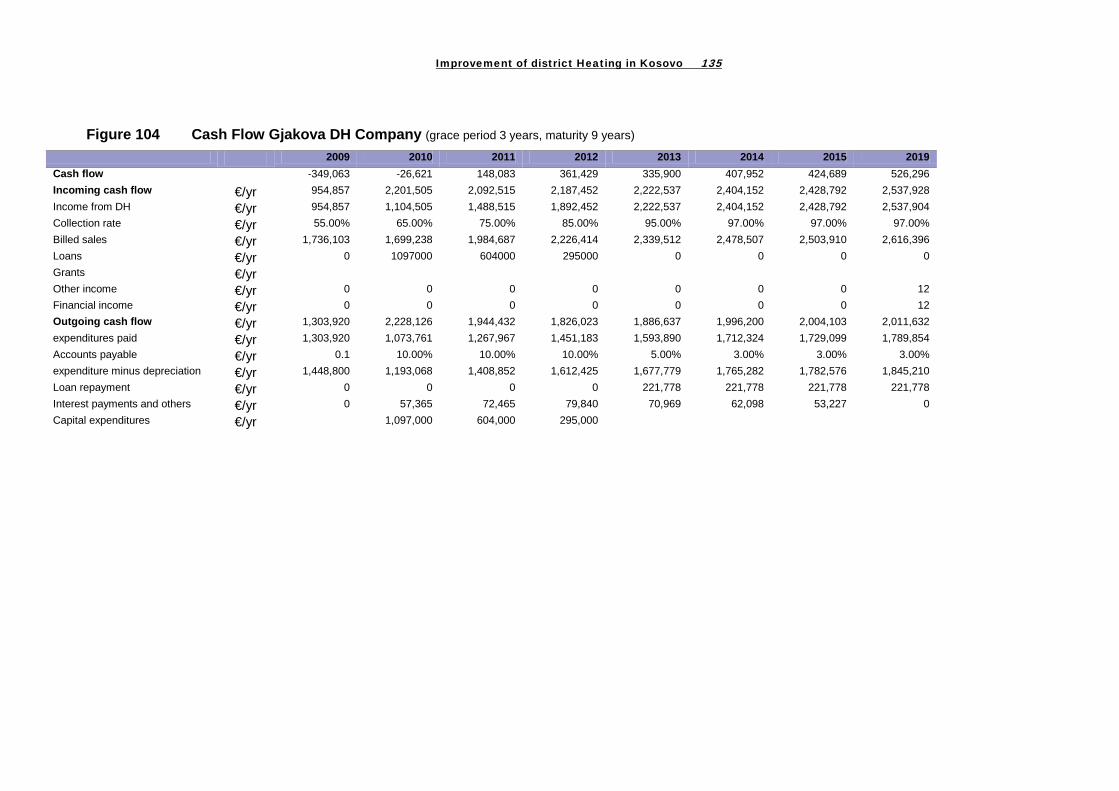
Improvement of district Heating in Kosovo 135
Figure 104 Cash Flow Gjakova DH Company (grace period 3 years, maturity 9 years)
2009 2010 2011 2012 2013 2014 2015 2019 Cash flow -349,063 -26,621 148,083 361,429 335,900 407,952 424,689 526,296 Incoming cash flow €/yr 954,857 2,201,505 2,092,515 2,187,452 2,222,537 2,404,152 2,428,792 2,537,928 Income from DH €/yr 954,857 1,104,505 1,488,515 1,892,452 2,222,537 2,404,152 2,428,792 2,537,904 Collection rate €/yr 55.00% 65.00% 75.00% 85.00% 95.00% 97.00% 97.00% 97.00% Billed sales €/yr 1,736,103 1,699,238 1,984,687 2,226,414 2,339,512 2,478,507 2,503,910 2,616,396 Loans €/yr 0 1097000 604000 295000 0 0 0 0 Grants €/yr Other income €/yr 0 0 0 0 0 0 0 12 Financial income €/yr 0 0 0 0 0 0 0 12 Outgoing cash flow €/yr 1,303,920 2,228,126 1,944,432 1,826,023 1,886,637 1,996,200 2,004,103 2,011,632 expenditures paid €/yr 1,303,920 1,073,761 1,267,967 1,451,183 1,593,890 1,712,324 1,729,099 1,789,854 Accounts payable €/yr 0.1 10.00% 10.00% 10.00% 5.00% 3.00% 3.00% 3.00% expenditure minus depreciation €/yr 1,448,800 1,193,068 1,408,852 1,612,425 1,677,779 1,765,282 1,782,576 1,845,210 Loan repayment €/yr 0 0 0 0 221,778 221,778 221,778 221,778 Interest payments and others €/yr 0 57,365 72,465 79,840 70,969 62,098 53,227 0 Capital expenditures €/yr 1,097,000 604,000 295,000