IMPROVEMENT OF CONVERSION EFFICIENCY OF CHARCOAL KILN ...
232
IMPROVEMENT OF CONVERSION EFFICIENCY OF CHARCOAL KILN USING A NUMERICAL METHOD (Higher Yield of Charcoal and Reduced Environmental Impacts) by Edwin Luwaya A thesis submitted in partial fulfilment of the requirements of the degree of Doctor of Philosophy in Mechanical Engineering. The University of Zambia 2015
Transcript of IMPROVEMENT OF CONVERSION EFFICIENCY OF CHARCOAL KILN ...

iv
IMPROVEMENT OF CONVERSION EFFICIENCY OF CHARCOAL KILN
USING A NUMERICAL METHOD
(Higher Yield of Charcoal and Reduced Environmental Impacts)
by
Edwin Luwaya
A thesis submitted in partial fulfilment of the requirements of the degree of Doctor of
Philosophy in Mechanical Engineering.
The University of Zambia
2015

v
© 2015 by Edwin Luwaya. All rights reserved.
vi
IMPROVEMENT OF CONVERSION EFFICIENCY OF CHARCOAL KILN
USING A NUMERICAL METHOD
(Higher Yield of Charcoal and Reduced Environmental Impacts)
by
Edwin Luwaya
A thesis submitted in partial fulfilment of the requirements of the degree of Doctor of
Philosophy in Mechanical Engineering.
The University of Zambia
August, 2015

vii

viii
DECLARATION
I Edwin Luwaya do declare that this dissertation is my own work, and that it has not
previously been submitted for a degree or other qualification at this or another
University.
Signature:......................................................................
Date:...............................................................................

ix
APPROVAL
This Thesis of Edwin Luwaya has been approved as fulfilment of the requirements
for the award of the degree of Doctor of Philosophy in Mechanical Engineering by the
University of Zambia.
NAME SIGNATURE DATE
_________________ ____________________ ______________
Supervisor
_________________ ____________________ ______________
Supervisor
_________________ ____________________ ______________
External Examiner
_________________ ____________________ ______________
Internal Examiner
_________________ ____________________ ______________
Internal Examiner
_________________ ____________________ ______________
Thesis Chairperson

iv
ABSTRACT
Today approximately one-and-half billion people around the world, especially in the
developing world, use biomass based source of energy for cooking and heating.
Conversion efficiency of the biomass in many cases is low resulting in unsustainable
use of the biomass resource and negative environmental impacts. In the earth charcoal-
making kiln widely used in the developing nations, the conversion efficiency is on
average as low as 6 - 10 percent on dry basis. The low conversion efficiency is a source
of greenhouse gases and causing deforestation around most African cities. However,
the earth charcoal-making kiln has been reported to have potential for improvement of
the kiln conversion efficiency.
This research work was about improving the conversion efficiency of the earth
charcoal-making kiln by applying a scientific approach using a numerical method. To
achieve this, a 3-Dimensional transient numerical model of the earth charcoal-making
kiln was developed. The CFD software code of PHOENICS was used to
mathematically model and simulate the major factors influencing carbonisation
processes in the kiln for their effect on the kiln conversion efficiency.
The results showed that several factors have some influence on the carbonisation
process and the kiln conversion efficiency. Low moisture content wood gave relative
conversion efficiency of 57.7 percent and fresh wood had 27.2 percent on a dry basis.
The smaller diameter logs gave 92.8 percent relative conversion efficiency and large
diameter logs 60 percent. The wood weight distribution of smaller diameter logs (5.0
- 20.0 cm) gave a relative conversion efficiency of 92.8 percent while distribution of
large diameter logs (35.0 - 50.0 cm) resulted in 16.2 percent relative conversion
efficiency. The crosswise type of wood Arrangement gave a relative conversion
efficiency of 49.1 percent as opposed to 41.2 percent for longitudinal loading. A kiln
of width 1.5 m resulted in a relative conversion efficiency of 3.6 percent while kilns
of width between 2.0-2.5 m had a relative conversion efficiency of up to 92.8 percent.
The kilns of length 3.5 m had relative conversion efficiency of 85.2 percent. The
thinner insulation thickness of 10.0 cm gave relative conversion efficiency of 48.2
percent. A thicker insulation layer of 40.0 cm had relative conversion efficiency of
28.4 percent. A crosswise loaded kiln carbonizing against the prevailing wind direction
had a relative conversion efficiency of 64.2 as opposed to 36.9 percent for one
carbonising along the prevailing wind direction. The relative conversion efficiency for
the longitudinal loaded kiln carbonising along the prevailing wind direction was 63.2
percent and 52.0 percent for similar kiln carbonising agaist the wind direction.
From the numerical model results, the optimised overall conversion efficiency and
charcoal yield for the crosswise loaded kiln were calculated to be 12.36 percent and
14.05 percent respectively, while for the longitudinally loaded kiln these figures were
18.50 percent and 21.02 percent respectively. In both cases, this is an improvement on
the reported unimproved earth charcoal making kilns average conversion efficiencies
of 6 – 10 percent. The figures also agree well with other researchers findings in the
field on related works.
Key Words: Conversion efficiency, Crosswise loading, Longitudinal loading,
Optimisation, Prevailing wind direction, Wood arrangement, Wood distribution.

v
To My Family
I thank sincerely my family in particular my wife Dyness Mulubwa and the children
Bennoni Kayombo, Sheerah Chipulu and Festus Chinyama, and also relatives and
friends who ever stood by me during the research period.
Overall, I am grateful to the Almighty Jehovah God who made everything possible
during this work.

vi
ACKNOWLEDGEMENTS
I would like to express my heartfelt gratitude and thanks to all members of staff of the
Department of Mechanical Engineering in particular and the School of Engineering in
general for their support, patience and encouragement they offered during my research
period. In particular, I express my gratitude and thanks to my supervisors Professor F.
D. Yamba and Co-Supervisor Dr. P. C. Chisale for their untiring professional guidance
throughout the research and production of this dissertation.
I also thank the then Head of Department Mechanical Engineering Dr. L. Siaminwe
for his tireless effort to make sure I had all the necessary requirements to carry out my
research work thereby making my academic life easier. Not to forget, thanks also go
to the departmental and school colleagues for the encouraging discussions we
randomly hard on my research directions.
I also thank the following for their insights and co-operation during my data collection
from offices and the forests: Department of Energy Ministry of Energy and Water
Development, District Forest offices Ministry of Tourism, Environment and Natural
Resources of Chibombo, Chingola, Chongwe, Kabwe, Kapiri Mposhi, Kitwe and
Mumbwa.
Great thanks go to my sponsors the Copperbelt University, Riverside Kitwe for their
supporting me financially during my research activities. Last but not list I would also
like to acknowledge Professor Spalding, Peter Spalding, Dr. Michael Malin
(Combustion and fluid flow specialist at CHAM) and their entire team at CHAM UK
in South East London for their unwavering technical support during development of
the numerical model and throughout the computations’ rigors period.

vii
CONTENTS
Page
CHAPTER 1 INTRODUCTION…………………………………………..1
1.1 The Energy Sector Statistics..……..…………………….…………………....1
1.2 The Research………………………………………………………………….5
1.2.1 Why this PhD Research is Important…………………………………5
1.2.2 Significance of this Research……………………………………........6
1.2.3 Why do this Research Topic now…………………………………….7
1.3 The Problem of Inefficient Charcoal Production……………………………..9
1.4 Purpose of the Study………………………………………………................11
1.5 Significance of Study……………………………………………….……….11
1.6 Objectives of the Research…………………………………………………..12
1.7 Theoretical Framework………………………...……………………………13
1.7.1 Introduction………………………………………………………….13
1.7.2 The physical process………………………………………………...13
1.7.3 The chemical process………………………………………………..13
1.7.4 Key parameters in modelling pyrolysis.……………………………..14
1.7.5 Approach to modelling……………………………………………....18
1.8 Definition of Terms…………………………..….…………………………..21
1.9 Assumptions…………….………………….………………………………..21
1.10 Scope of the Study…………….………….…………………………………21
1.11 Contributions of Research Findings………………………...........................23
1.12 Benefits of the research……………………………………………..............23
1.13 Brief Overview of Chapters………………………………………................23
1.14 Conclusion…………………………………………………………………..24
List of References……………………………………..……………………………24
CHAPTER 2 LITERATURE REVIEW…………………………….....…28
2.1 Introduction………………………………………………………………….28
2.2 History of Pyrolysis and Charcoal Making………………………………….28
2.2.1 Charcoal Making: World Overview…………………………………28
2.2.2 Charcoal Making: Southern Africa-CHAPOSA Project…………….29
2.2.3 Charcoal Making: Zambian Overview……..………………………..31

viii
2.3 Theory of Modelling of Wood Pyrolysis………………..…………………..31
2.3.1. Review of Models of Wood Pyrolysis.………………………….......31
2.3.2. Advances in Modelling and Simulation of Biomass Pyrolysis.……..33
2.3.3 Wood Pyrolysis Processes…………………………………………..36
2.3.4 Wood Drying During Pyrolysis……………………………………..37
2.3.5 Modelling Kinetics of Wood Pyrolysis.…………………………......45
2.3.6 The Solid Phase Modelling………………………………………….55
2.3.7 The Gas Phase Modelling…………………………………………...61
2.3.8 Radiation modelling in Pyrolysis……………………………............67
2.4 Technologies for Wood Pyrolysis...…………………………………............68
2.4.1 Basic Types of Charcoal-Making Systems………………………….68
2.4.2 Technologies for Biomass Pyrolysis.………………………………..70
2.4.3 Carbonization Processes in Charcoal Making.………………………74
2.4.4 Products of Carbonization and Environmental Concerns.………......77
2.4.5 Recovery of By-Products from Wood Carbonization……………….78
2.5 Mechanisms of Charcoal Making……………………………………….......79
2.5.1 Choices of Carbonization Systems..….………………………...…...79
2.5.2 Comparative Performance Indices of Carbonizing Equipment……...80
2.5.3 Charcoal Making Methods…………………………………………..80
2.5.4 Use of Steel in Kiln Construction…………………………………...81
2.5.5 Yield - Investment Interactions……………………………………...81
2.6 Earth Kilns for Charcoal making……………………………………………82
2.6.1 Charcoal Earth Kilning and Efficiency……………………………...82
2.6.2 Factors Affecting Charcoal Yield in Earth Kiln…………………….83
2.6.3 Traditional charcoal making methods……………………………….84
2.6.4 The clamps for charcoal production in Zambia……………..............88
2.6.5 Field Assessment of Earth-Kiln Charcoal Production
Method in Zambia…………………………………………………...89
2.7 Conclusion……………………………………………….………………….90
2.7.1 State of Modelling of Wood Pyrolysis in Charcoal Making
Kiln………………………………………………………………….90
2.7.2 Significance of Pyrolysis Modelling in Earth Kilns...........................92
2.7.3 Questions arising…………………………………………………….92
List of References…………………………………………………………………..93

ix
CHAPTER 3 MATERIALS AND METHOD ………………………….100
3.1 Introduction………………………………………………………………...100
3.2 Research Design…………………………………………………................101
3.3 Method…….…..……………….…………………………………………..101
3.3.1 Introduction………………………………………………………...103
3.3.2 Research Sites…………………………....…………..…………….102
3.3.3 Research Instruments………………………………………………102
3.3.4 Data Collection………………………………………….................105
3.3.5 Data Analysis……………………………………………................106
3.4 Mathematical Modelling……………….…………………………………..107
3.4.1 Basic Conservation Equations……………………………………..107
3.4.2 The State Equation of System……………………………………...110
3.5 Supporting Physical Models…………………………………….................111
3.5.1 Interphase momentum transfer model……………………………...111
3.5.2 Interphase heat transfer model…………………………..................111
3.5.3 Pyrolysis modelling………………………………………………..113
3.5.4 Wood drying…………………………………………….................114
3.5.5 Radiative-heat transfer model…………………………...................114
3.6 Optimisation of kiln and Conversion Efficiency…………………………..119
3.7 Limitations…………………………………………………………………123
3.8 Conclusion………………………………………………………………....124
List of References…………………………………………………………………124
CHAPTER 4 NUMERICAL OPTIMISATION OF KILN
CONVERSION EFFICIENCY …………………………......126
4.1 Introduction……………………………………………………...................126
4.2 Numerical Method ……………………………………………...................126
4.2.1 The discretisation scheme………………………………………….126
4.2.2 Pressure-velocity coupling…………………………………………129
4.2.3 Segregated solution method………………………………………..129
4.2.4 Convergence and Accuracy………………………………………..130
4.3 Numerical Experiments Design……….…………………………………...131
4.4 Numerical Setup of Earth Kiln…………………………………………….133
4.4.1 Creation of Kiln Geometry…………………………………….......133

x
4.4.2 Generation of kiln Grid……….……………………………………135
4.4.3 Selection of Physics and Material Properties.……………………...135
4.4.4 Initial and Boundary Conditions……………………………….......136
4.5 Simulations of Wood Pyrolysis……………………………….....................138
4.5.1 Wood drying.……………………………………………………….138
4.5.2 Wood-pyrolysis kinetics……….……………………………….......139
4.6 Optimisation of Major Factors Affecting Carbonisation…………………...139
4.6.1 Geometrical variation………………………………………………139
4.6.2 Wood characteristics variation………………………......................140
4.6.3 Wood arrangement variation……………………………………….140
4.6.4 Wood distribution variation…………………………......................141
4.6.5 Operating parameters variation……….……………………………144
4.6.6 Insulating earth wall thickness………………………......................144
4.6.7 Kiln Orientation to prevailing Wind Direction…………………….145
4.7 Optimisation of the Kiln Conversion Efficiency…………………………...145
4.7.1 Combining optimised major factors.……………………………….145
4.7.2 Optimisation of the Kiln…………………………………………....146
4.7.3 Kiln Efficiency Calculation………………………………………...146
List of References…………………………………………………………………147
CHAPTER 5 RESULTS AND DISCUSSIONS………………………...148
5.1 Computational Details……………………………………………………...149
5.1.1 Consistency………………………………………….......................150
5.1.2 Stability…………………………………………………………….150
5.1.3 Convergence……………………………………………………….150
5.1.4. Accuracy…………………………………………………………...151
5.1.5 Efficiency…………………………………………………………..151
5.2 Effect of Properties of Wood………………………………………………151
5.2.1 Density of wood..…………………………………………………..151
5.2.2 Diameter of wood log……………………………………………...153
5.2.3 Moisture Content of Wood logs.…………………………………...154
5.3 Effect of Kiln Design.……………………………… ……………………..156
5.3.1 Width of Kiln.……………………………………………………...156

xi
5.3.2 Length of Kiln……………………………………………………...157
5.3.3 Thickness of Insulating Wall………………………………………158
5.4 Effect of Log Diameter Size and Log Diameter Distribution.……………..160
5.4.1 Log Diameter Size Effect………………………………………......160
5.4.2 Log Diameter Size Distribution Effect.……………………………161
5.4.2.1 Uniform diameter log distribution effect...………………...162
5.4.2.2 Non- uniform diameter log distribution effect.…………….163
5.5 Effect of Direction of Prevailing Wind to
Direction of Carbonisation.………………………………………………...165
5.5.1 Effect of prevailing wind direction in
crosswise loaded kiln.………..…………………………………….165
5.5.2 Effect of prevailing wind direction in
longitudinal loaded kiln.…………………………………………....166
5.6 Spatial Distribution of Carbonisation Variables…………………………...167
5.7 Temporal Evolutions of Carbonisation Variables………………………….175
5.8 Optimised Charcoal Kiln Parameters……………………………………....179
5.8.1 The kiln optimised factors…………………………………………179
5.8.2 Conversion efficiency of kiln……………………………………....180
5.8.3 Charcoal yield of kiln………………………………………………181
List of References…………………………………………………………………182
CHAPTER 6 CONCLUSION AND RECOMMENDATIONS............................189
6.1 Summary of Findings………………………………………………………189
6.2 Conclusions………………………………………………………………...190
6.3 Summary of Contributions…………………………………………………192
6.4 Suggestions for Future Research…………………………………………...192
6.5 Recommendations for Implementation…………………………………….193

xii
APPENDICES
Appendix A: Main Characteristics of Various Categories
of Charcoal Kilns…………………………………………………..195
Appendix B: Challenges and opportunities for the successful
development of fundamental research……………………………..196
Appendix C: Summary of wood kinetic parameters and heat of pyrolysis………197
Appendix D: Biomass Conversion Technologies………………………………...199
Appendix E: Classification of Carbonisation Systems…………………………..200
Appendix F: Some Common Kiln Type for Carbonising………………..………201
Appendix G: A modern Retort for Carbonising Wood: the Lambiotte…………..202
Appendix H: Research Matrix…………………………………………………….203
Appendix I: Analytical Framework Matrix……………………………………….204
Appendix J: Tasks, Description, Methodology, Scope and Outcomes…………...205
Appendix K: Site Maps for some Charcoal Production Areas Sampled
[Copperbelt: (a) Chingola, and (b) Kalulushi]……………………..206
Appendix L: Site Maps for some Charcoal Production Areas Sampled
[Central: (a) Kapiri-Mposhi, and (b) Line of Rail:
Central/Copperbelt provinces]……………………………………..207
Appendix M: Tree Species Suitable for Charcoal Making in Zambia……………208
Appendix N: Nature of data collected for numerical model of
earth charcoal kiln………………………………………………….209
Appendix O: Summary of analysed field data for numerical simulations………..210
Appendix P: Overview of the transient SIMPLE solution procedure
in PHOENICS……………………………………………………...211
Appendix Q: Flowchart encapsulating the various flow physics in kiln………….212
Appendix R: Tables of results for Numerical Experiments………………………213

xiii
LIST OF TABLES
Table 1.1 Percentage distribution of energy consumption by type of
source (2004)………………………………………………………….3
Table 1.2 Percentage distributions of households by type of cooking energy…..3
Table 1.3 Charcoal consumption and wood used in charcoal
production in Zambia…………………………………………………4
Table 1.4 Typical Ultimate Analysis of Dry Wood by Weight (%)…..………...14
Table 1.5 Typical proximate Analysis of Dry Wood by Weight (%)……...…..14
Table 2.1 Summary of Eɑ; and ɑp at different degrees of i for
(a) isothermal and (b) non-isothermal based on
Eq. (2.25) and (2.26)………………………………………………...50
Table 2.2 Summary of Eɑ; and ɑp at different degrees of i for
non-isothermal based on Eq. (2.27) and (2.28) (Xc = 0.2)…………..51
Table 2.3 Simplified summary of wood carbonization in an earth kiln………..75
Table 2.4 Conversion efficiency of three kiln types……………………………82
Table 4.1 Ranges and Levels for Major Factors Simulations………………....132
Table 5.1 Computational Details.……………………………………………..149
Table 5.2 Relative Charcoal Fractions for Optimised Kiln Factors…..…………180

xiv
LIST OF FIGURES
Figure 1.1 The African Energy Distribution……...……………………………...2
Figure 1.2 The Direct Energy Efficiency……………………………………….10
Figure 2.1 Schematic of Wood Pyrolysis……………………………………….37
Figure 2.2 Heat and mass transfer in a pyrolysing piece of wood……………...56
Figure 2.3 Systematic diagram for gas phase boundary layer model…………...62
Figure 2.4 Internally heated charcoal kilns……………………………………..69
Figure 2.5 Externally heated charcoal kilns…………………………………….69
Figure 2.6 Recirculating heated gas systems charcoal kiln……………………..70
Figure 2.7 Fixed bed reactor concept for biomass pyrolysis……………………70
Figure 2.8 Auger/Screw pyrolysis reactor concept using heat carrier…………..71
Figure 2.9 Ablative biomass pyrolysis reactor concept………………………....71
Figure 2.10 Rotating cone reactor………………………………………………...72
Figure 2.11 Generalized diagram for fluidized bed reactors for
biomass pyrolysis……………………………………………………73
Figure 2.12 Schematic recirculating fluidized bed pyroliser……………………..73
Figure 2.13 Vacuum pyrolysis reactor…………………………………………....74
Figure 2.14 Carbonisation Process: (a) Combustion
(b) Dehydration (c) Exothermic (d) Cooling………………………...76
Figure 2.15 Earth Pit Kiln for Charcoal Making………………………………….85
Figure 2.16 Earth Mound Kiln for Charcoal Making……………………..............86
Figure 2.17 Mixed Kilns………………………………………………………….87
Figure 3.1 Major inputs and outputs of the mass balance……………………..120
Figure 3.2 Carbon in wood material and pure carbon in charcoal…………….122
Figure 4.1 A cell in three dimensions and neighbouring nodes……………….127
Figure 4.2 Kiln (a) Physical Domain and
(b) Computational Domain.………………………………………..134
Figure 4.3 Woodlogs Arrangement (a) Crosswise and
(b) Longitudinal.…………………………………………………...140
Figure 4.4 Cross Loading (a) Large logs at bottom (b) Large logs
at middle and (c) Large logs at top.………………………………..142
Figure 4.5 Longitudinal loading (a) Large logs at bottom
(b) Large logs at middle and (c) Large logs at top.………………..143
Figure 4.6 Insulating Earth Wall Thickness.………………………………….144
Figure 4.7 Kiln orientation (a) against wind direction and

xv
(b) Along wind direction…………………………………………...145
Figure 5.1 Grid mesh (a) Z-Y Plane (b) Z-X Plane……………………………149
Figure 5.2 Convergence monitor plot………………………………………….150
Figure 5.3 Relative charcoal fraction versus wood
density in an earth kiln.………………………………………….…152
Figure 5.4 Relative charcoal fraction versus diameter of wood log………...…154
Figure 5.5 Relative charcoal fraction versus moisture content of wood………155
Figure 5.6 Relative charcoal fraction versus kiln width...……………………..157
Figure 5.7 Relative charcoal fraction versus kiln length...…………………….158
Figure 5.8 Relative charcoal fraction versus insulation wall thickness……......159
Figure 5.9 Relative charcoal fraction versus diameter of wood log...…………160
Figure 5.10 Relative charcoal fraction versus logs arrangement
(uniform diameter)………………………………………………....162
Figure 5.11 Relative charcoal fraction versus logs arrangement
(non-uniform diameter)……………………………………………163
Figure 5.12 Relative charcoal fraction versus logs arrangement
(non-uniform diameter)……………………………………………164
Figure 5.13 Relative charcoal fraction versus wind direction (Crosswise)...…...165
6Figure 5.14 Relative charcoal fraction versus wind direction (Longitudinal)......166
Figure 5.15 Pressure contours along the kiln length…………………………….167
Figure 5.16 Velocity distributions along kiln length
(a) vectors and (b) contours………………………………………...168
Figure 5.17 Temperature distributions along kiln length………………………..169
Figure 5.18 Radiation energy distribution in the kiln length
(a) X-direction (b) Y-direction and (c) Z-direction…………………170
Figure 5.19 Gaseous phase distribution along kiln length
(a) air (b) water vapour and (c) volatiles……………………………172
Figure 5.20 Solid phase distribution along kiln length
(a) moisture (b) raw wood and (c) charcoal…………………………174
Figure 5.21 Temporal distribution of wood density and kiln temperature……...175
Figure 5.22 Temporal distributions of drying and pyrolysis rates……………...176
Figure 5.23 Temporal distributions of solid and gas phase temperatures………177
Figure 5.24 Temporal distributions of gas phase mass fractions……………….178
Figure 5.25 Temporal distributions of solid phase mass fractions……………...179
1
CHAPTER 1 INTRODUCTION
1.1 The Energy Sector Statistics
Energy is one of the important driving forces behind the development of an economy
as it cuts across most economic and social activities. The high rate of population
growth and rapid urbanisation in the developing world, coupled with high cost of non-
expanding modern energy sources, is putting pressure on biomass energy sources like
wood. Harvesting of wood establishes that there is a strong linkage between the forest
and energy sectors. The forest sector is on the supply side, and the energy sector is on
the consumptive side. The use of woodfuel which is seemingly affordable by low
income urban households is exacerbating deforestation in the developing world where
meeting energy demand for the growing populations is a daily challenge. In a Sub-
Saharan African country like Zambia, woodfuel is the principal source of energy.
Deforestation is mainly through the felling of trees for fire wood, charcoal production,
expansion and over-exploitation of agricultural land and timber. In Zambia the rate of
deforestation is estimated to be 250 000 to 300 000 hectares a year (ILUA, 2010,
Zambia, 2005-2008).
Figure 1.1 depicts the African energy sector in three distinct regions. The figure shows
that in Sub-Saharan African biomass supplies 81 percent of the energy needs. This
bears heavily on woody biomass used mainly as source of energy (Karekezi and
Dafrallah n.d.).

2
Source: Major Challenges Facing the African Energy Sector by Stephen Karekezi, FREPREN/FWD
and Touria Dafrallah;, ENDA-TM
Figure 1.1: The African Energy Distribution
In Zambia woodfuel, as a forest resource, currently accounts for 80 percent of the
country’s total energy consumption. The household sector is the largest consumer of
energy, mainly in the form of woodfuel for cooking and heating. In 2004, households
accounted for over 70 percent of the total national energy consumption of which
woodfuel consumption accounted for about 88 percent. According to figures within
the Ministry of Energy and Water Development 60.9 percent of households used
firewood for cooking and 24.3 percent used charcoal while only 13.8 percent used
electricity. The figures further showed that in rural areas, 87.7 percent use wood for
cooking, 9.5 percent used charcoal and only 1.5 percent used electricity (Department
of Energy, 2007b) as shown in Table 1.1. Firewood is plain wood used as fuel.

3
Table 1.1: Percentage distribution of energy consumption by type of source (2004)
`
Source: Ministry of Energy and Water Development, MEWD (NEP, 2007, p. 2).
Masiliso (2004) gave further information on the percentage distribution of households
by type of cooking energy as depicted in Tables 1.2. Woodfuel is comprised of
charcoal and wood used as fuel.
Table 1.2: Percentage distribution of households by type of cooking energy
Source: Energy Statistics, ‘The Case of Zambia’. By Masiliso Sooka (2004)
For Zambia then, the energy sector is largely dependent on the forest sector for supply
of energy to particularly the urban poor and those in rural areas. About 85 percent of
all urban households depended on charcoal for cooking and heating. Other than
Firewood
Charcoal
Electricity
All Zambia 60.9 24.3 13.8
Rural 87.7 9.5 1.5
60.9
24.3
13.8
87.7
9.51.5
0.0
20.0
40.0
60.0
80.0
100.0
Percentage
Woodfuel CoalKerosene/Paraffin/
GasElectricity Other
All Zambia 83.4 0 0.2 16.2 0.1
Rural 97.9 0 0.2 17 0.2
Urban 60.4 0 0.2 39.3 0
83.4
0 0.2
16.2
0.1
97.9
0 0.2
17
0.2
60.4
0 0.2
39.3
00.0
20.0
40.0
60.0
80.0
100.0
Percentage

4
charcoal, no other source of energy was easily accessible to these households
(Hibajene and Kalumiana, 1994). Today this figure is 70 percent as reported by Policy
Monitoring and Research Centre (PMRC) in 2013 on state of energy sector in Zambia.
Although there is no immediate woodfuel crisis in most parts of Zambia, woodfuel
consumption rates have surpassed sustainable yields partly due to inefficient
production of charcoal to meet the ever increasing energy demand. Given the very low
income levels and the abundance of wood resources (woodlands and forests cover 50
million hectares or 66 percent of Zambia total land area), it is foreseen that woodfuel
would continue to dominate Zambia’s energy consumption. If current trends of energy
consumption are to continue with the population growth, an "energy crisis" that will
affect the majority of the Zambian people is likely to occur in the near future
accompanied by environmental negative effect of desertification that destroys the
forests as is already threatening some parts of Zambia (Department of Energy, 2007b),
(Japanese International Cooperation Agency (JICA) 2007, CHAPOSA, 1999).
According to Chidumayo (1994) charcoal consumption per annum in Zambia has been
increasing since 1969 and shall keep increasing as shown in Table 1.3.
Table 1.3: Charcoal consumption and wood used in charcoal production in Zambia
Year
Charcoal
Consumption(million
tonnes)
Charcoal
Produced
(million tonnes)
Wood Used
(million
tonnes)
1969 0.330 0.340 1.479
1980 0.490 0.505 2.196
1990 0.685 0.706 3.070
2000 0.905 0.933 4.056
2010 1.211 1.248 5.428
Source: Inventory of Wood Used in Charcoal Production in Zambia, by E. N Chidumayo (1994)
The 2000 to 2010 figures in Table 1.3 were projections. The charcoal produced in
Zambia serves the country's major cities such as Lusaka and Kabwe in central
Zambia, Ndola and Kitwe in the northern mineral rich region because the majority of
residents in these cities cannot afford the cost of electricity in their homes (Masiliso,
2004 and Chipungu, 2000). This high usage of charcoal for cooking clearly shows that
there is high potential to shift to charcoal use while expanding and accelerating a
broader social transition to the use of clean and efficient modern fuels.

5
1.2 The Research
1.2.1 Why this PhD Research is Important.
Many efforts have been done on making thermochemical processes more efficient and
economically acceptable. A significant portion of these efforts over the past couple of
decades has focused on the development of numerical models of thermochemical
reactors (such as gasifiers, pyrolyzers, boilers, combustors, incinerators) that could
help to design and analyse the thermochemical process. Due to a combination of
increased computer efficacy and advanced numerical techniques, numerical simulation
techniques such as CFD (Computational Fluid Dynamics) became a reality and offer
an effective means of quantifying the physical and chemical process in the biomass
thermochemical reactors under various operating conditions within a virtual
environment. The resulting accurate simulations can help to optimize the system
design and operation and help understanding of the dynamic process inside the
reactors (Wang and Yan, 2008).
CFD is a design and analysis tool that uses computers to simulate fluid flow, heat and
mass transfer, chemical reactions, solid and fluid interaction and other related
phenomena. Compared to the physical experiment operation, CFD modelling is cost
effective, timely, safe and easy to scale-up. CFD codes turn computers into a virtual
laboratory and perform the equivalent “numerical experiments” conveniently
providing insight, foresight and return on investment (Wang and Yan, 2008).
This research work uses CFD studies for numerical modelling and simulations of the
charcoal earth kiln to improve the kiln design and conversion efficiency in order to
achieve higher yield of charcoal. In their current construction and associated field
practises, the traditional earth charcoal kilns consume a lot of wood to produce a
relatively small quantity of charcoal thereby contributing immensely to deforestation
and global warming through Green House Gases emissions. They have poor
conversion efficiency of 10-15 percent (Foley, 1986). Generally, studies have shown
that any charcoal making kiln with conversion efficiency of 25 percent or less has
potential for improvement (FAO, 1985). Therefore this research focuses on the
potential and means for raising the efficiency of the earth charcoal kiln.

6
1.2.2 Significance of this Research.
There is hardly any literature on the science and thermodynamics of wood
carbonisation processes taking place in the traditional earth charcoal kiln. The issue of
whether scope does exist for improving the efficiency of the earth charcoal kiln has
not received much attention particularly in Zambia. In short there may be no scientific
basis for the improved technology of the charcoal earth kiln.
A study undertaken in Zambia on the earth kiln charcoal production method assessed
the nature of process efficiency (yield), productivity and cost (Ranta and Makunka,
1986). The other study undertook the determination of the most important factors for
optimising charcoal production and their effects on charcoal quality (Hibajene and
Kalumiana, 1994). Both studies involved only empirical field observations of several
earth kilns for parameters likely to improve process efficiency and productivity. They
assessed the technique from the point of view of the nature of the process efficiency
(yield), productivity and cost (Ranta and Makunka, 1986, World Bank/ESMAP, 1990,
Chidumayo, 1991a).
Hibajene and Kalumiana (1994) only carried out a field assessment of the wood
pyrolysis of logs for traditional earth-kiln charcoal production method in Zambia. The
primary objective of their study was to determine the most important factors for
increasing or maximising the output of the earth clamp method of charcoal production
and their effects on charcoal quality. The study only involved empirical observations
of several earth kilns for effect of some important factors.
This research therefore provides the unique opportunity to do qualitative field
interviews and quantitative field observations and measurements and carry out
numerical modelling studies to optimise the kiln and processes. This research
endeavours to apply a unique CFD modelling technique to model, simulate and analyse
the performance of earth charcoal kiln by predicting not only fluid flow behaviour, but
also heat and mass transfer, and chemical reactions in the kiln.
The principal focus of the research is the study of technical parameters of wood
pyrolysis in an earth kiln on their effects on conversion efficiency. These parameters
are the wood characteristics (species, size, shape, and moisture content), kiln design
features (size, shape, wood arrangement and weight distribution, draught and flue gas

7
systems) and the kiln operating parameters (heating rate, wood drying rate, pyrolysis
rate, temperature cycles, heat transfer, residence time of volatiles and external
temperature and pressure). The developed mathematical model is used for optimisation
of wood carbonisation processes and kiln design improvement in general and
conversion efficiency in particular.
1.2.3 Why do this Research Topic now.
Consumption
The world energy demand is projected to grow significantly over the next couple of
decades due to economic growth, industrial expansion, high population growth, and
rapid urbanisation. In developing countries this will result in pressure on wood forest
resources (Amous, 2000). Globally woodfuel use has been growing in line with
population growth; the annual growth demand is between three and four percent
depending on the country (Amous, 2000).
Zambia’s indigenous energy sources include woodlands and forest for fuel wood,
hydro-power and coal. The energy consumption pattern in Zambia is dominated by
households and mining as reported in the Department of Energy report of 1990-2003.
The largest share of energy consumption by households is attributed to firewood,
which indicates the overall importance of firewood in the provision of energy in
Zambia. For example, in the National Energy Policy of 1994 for Zambia, it was
estimated that the use of firewood and charcoal would continue to increase at a rate of
2.4 percent and 4 percent per annum respectively up to the year 2010 (Department of
Energy, 1994.). Therefore, the Zambian government faces a crucial question of how
to provide energy service demanded by the growing population.
Production
The charcoal industry is thought to informally employ about 500,000 individuals
(Mwitwa and Makano, 2012). Wood fuel production is an economic activity estimated
to contribute at least 3 percent to the country’s GDP, and accounts for approximately
80 percent of the total energy household balance in the economy (Kalinda et al., 2008).
Charcoal production has far reaching socio-economic dimensions. In areas with
reasonable accessibility, charcoal is the main cash crop of the rural households.
Migration of people to charcoal producing areas is common. Charcoal production

8
requires neither formal education nor large capital investment although it is time
consuming and labour intensive, and the labour is usually drawn from household.
Therefore given the low education level required, the income is attractive to other
people to join the business, and thus more deforestation to the woodlands.
Generally, in Zambia, the increase in charcoal production is being propelled by the
high charcoal demand levels in the urbanized centers, particularly Lusaka district.
Charcoal production has been observed to have increased per capita income even when
other sectors are not doing well in rural areas. For example, the study of the
contribution of charcoal to per capita income revealed that it had increased from 65 to
83 percent (Chidumayo et al., 2001).
Deforestation
Estimates for average deforestation rates vary between 167,000 ha (0.33 percent) and
250,000-300,000 ha (0.50-0.60 percent) of total forest cover per annum (FAO, 2011)
and (Vinya et al., 2012). The country’s deforestation rate is estimated to be around 1.5
percent per annum and is internationally ranked among the countries with the highest
rate of deforestation in the world (Henry et al., 2011). The ILUA report found that
250,000 to 300,000 ha are deforested annually (ILUA, 2010). Even though the average
deforestation rate during 1965-2005 was 0.81 percent per province, variable trends in
deforestation occur during different periods (Chidumayo, 2012). The influences
behind such trends are socio-economic.
The main causes of deforestation and forest degradation are, charcoal (4.5 percent),
commercial firewood (1.4 percent), timber (16.8 percent), semi-permanent agriculture
(23.7 percent) and shifting agriculture (53.6 percent). The most significant
contribution to deforestation is agriculture (77.3 percent), followed by timber logging
(16.8 percent) and charcoal production and commercial firewood cutting (5.9 percent).
In terms of hectorage cover estimates, biomass stock cleared for agriculture,
settlements and others was 176,000, for charcoal production it was 88,048, and timber
logging was estimated at 44,028 hectares (ECZ, 2008).
Forest cover is expected to decrease from 48.2 million hectares to 38.9 million hectares
in 2035 based on an average deforestation rate of 365 thousand hectares per annum
representing 20 percent reduction over a period of 25 years (ILUA, 2005).

9
Deforestation not only releases significant volumes of methane (a greenhouse gas)
from charcoal production processes but also negatively affects this main source of
income for charcoal producers by depleting the wood feedstock used to make the
charcoal. As woodlands nearby deplete or when preferred species are exhausted,
charcoal producers move even further and take the burden of carrying charcoal loads
over longer distances to the roadside.
Today Zambia has sufficient supply of woodfuel and this situation will remain so even
by the year 2020 with supply being more than demand. Despite this apparent woodfuel
supply surplus, there is a growing problem of woodfuel deficit in some areas of the
country (location specific). Therefore, the greatest challenge for the forest/energy
woodfuel linkage is to ensure that the production, supply and use of woodfuel in a
manner that ensures sustained socio-economic development (Department of Energy,
2007c).
Despite the rise in demand for charcoal, the traditional charcoal making practise,
inefficient though it may be, is still increasingly employed today. It has an average
recovery of one tonne of charcoal from six tonnes of trees felled (12 percent recovery
efficiency). A tonne of charcoal produced translates into 0.1 hectares (100 m2) of forest
cover removed (Karekezi, 2001).
To mitigate these interrelated mechanisms of charcoal demand, production and
deforestation and meet some government energy policy goals, this research has its
expected key output as that of developing an improved charcoal kiln to conserve wood
forest resources whilst providing energy efficiently. This is achieved through better
carbonisation processes in the kiln under prevailing conditions using numerical
modelling and simulations for optimisation purposes.
1.3 The Problem of Inefficient Charcoal Production
When wood is converted to charcoal, over half of its energy value is lost during the
conversion processes in the kiln (FAO, 1983 and Foley, 1986). To gain efficiency
during wood-to-charcoal conversion, one requires improving the carbonisation
processes of wood in the kiln.

10
An ordinary earth charcoal kiln carbonises an average of 10 tonnes of air-dried wood
of 150 GJ energy equivalents to produce 1 tonne of charcoal of 28 GJ energy
equivalents. This translates to a loss of 122 GJ or 81.3 percent of energy during the
conversion process.
In contrast an improved earth charcoal kiln can produce 1 tonne of charcoal of 28 GJ
energy equivalents by conversion of 3.3 tonnes of air-dried wood of 49.5 GJ energy
equivalents. This translates into a loss of energy of 21.5 GJ or 43.4 percent during the
conversion process. An improved kiln then can reduce the energy losses by 50 percent.
During conversion of wood to charcoal in either an ordinary earth kiln or an improved
earth kiln there is loss of energy. However it is worth noting that an improved earth
kiln consumes less wood feedstock and has much less energy losses during the
conversion process; figure 1.2 illustrates this.
Source: The charcoal training manual.
Figure 1.2: The Direct Energy Efficiency
Part of the energy loss during the charcoal making process though is compensated for
during end use of charcoal in charcoal stoves because charcoal stoves have higher
average efficiencies of 30 percent compared to fuelwood stoves which have 10-15
percent of untended open fire or tripod (Tara, 1998).

11
The main reason for low production efficiencies is due to inadequate information on
the best practice. A lot of people educated or not educated join the charcoal industry
as producers, often with very little knowledge about charcoal production.
Consequently, this leads to a lot of wood resource wastage and accelerated
deforestation. Unfortunately lack of simple management skills of the kiln is
compounded by lack of or very little scientific understanding of the earth kiln charcoal
production system (Hibajene and Kalumiana, 2003b).
In conclusion, even though earth kilns are considered to be “wasteful and inefficient”,
it has also been reported that they are not necessarily as wasteful and inefficient as
perceived but instead their conversion efficiency can be improved through
fundamental research using scientific and systematic approach as is addressed in this
research.
1.4 Purpose of the Study
Purpose of this study is to improve the design of the earth charcoal kiln in general and
its conversion efficiency in particular by employing numerical modelling and
simulations using field data collected through interviews, observations and field
measurements. The major factors studied are the wood characteristics and kiln design
features.
1.5 Significance of Study
Most charcoal production methods have not changed for decades or even centuries.
However massive urbanisation has changed both the nature and the quantity of the
demand without a concomitant evolution of production technology (Paul, 1987).
Charcoal production has turned into a small national industry by the majority of the
poor people. Almost all the charcoal used as domestic fuel is produced using the
traditional earth kiln whose conversion efficiency is low therefore contributing to
deforestation and Green House Gas emissions thus posing economic, environmental
and health threats.
It therefore becomes significantly important that kiln design and conversion efficiency
of the commonly used traditional charcoal earth kilns be improved. A kiln with
improved conversion efficiency will result into the following benefits:

12
Reduced deforestation and land degradation due to use of lesser wood
feedstock in the improved kiln to produce same amount of charcoal.
Reduced Green House Gas emissions because an improved kilning process
translates into less gas emissions and reduced respiratory health problems.
Sustainable charcoal production industry.
Improve socio-economic status of the poor urban and rural charcoal producers.
Improving the conversion efficiency is in line with the policy measure and strategy of
the woodfuel sector of improving the technology of charcoal production through better
organisation and management of charcoal production using the traditional earth kiln
method (Department of Energy, 2007a).
1.6 Objectives of the Research
General Objective
The general objective is to improve earth kiln design and the conversion efficiency by
use of a numerical method and hence develop an improved kiln with higher yield of
charcoal. Such an improved kiln has reduced emissions into the environment due the
improved carbonisation processes.
Specific Objectives
The specific objectives are; first to develop a mathematical model of the earth kiln;
second to parametrically study the interactions of the major factors and their effects on
the conversion efficiency using numerical simulations in order to determine the factor
values which result into an optimum conversion efficiency; thirdly, based on these
optimum factors values establish an improved charcoal kiln. These major factors are:
Wood characteristics: species (woods suitable for charcoal making in
Zambia), physical properties (log diameter, log length, wood density),
wood moisture content).
Kiln design features: size (width, height and length of kiln), draught
systems (position of firing hole in relation to the prevailing wind direction),
insulation wall thickness (earth wall thickness for sides, ends and top),
wood weight distribution (large logs at bottom, in the middle and at upper
part of the wood pile) and wood arrangement (cross-wise or longitudinal,
loading).

13
1.7 Theoretical Framework
1.7.1 Introduction
The processes taking place in the charcoal earth kiln are based on pyrolysis theory.
Pyrolysis is a thermo-chemical process in which organic material is converted into a
carbon rich solid (char) and volatile matter (liquids and gases) by heating in the
absence of oxygen (Demirbas and Arin, 2002). Pyrolysis in wood is typically initiated
at 200 °C and lasts till 450-500 °C, depending on the species of wood.
Pyrolysis is a complex phenomenon, not well understood, which involves
mathematical equations governing heat transfer, drying, flows of liquids and gases,
anisotropy, surface recession and a large number of chemical reactions. A set of non-
linear algebraic partial differential equations is needed to describe pyrolysis in detail;
the solution of these equations requires substantial computational efforts. Scientists
resort to simplifying hypotheses to lighten the computational load (Bellais, 2007).
1.7.2 The physical process
The pyrolysis process involves physical and chemical aspects. The basic phenomena
that take place during pyrolysis are: heat transfer from a heat source leading to an
increase in temperature inside the fuel; initiation of pyrolysis reactions due to this
increased temperature leading to the release of volatiles and the formation of char;
flow of volatiles towards the ambient resulting in heat transfer between hot volatiles
and cooler unpyrolysed fuel; condensation of some of the volatiles in the cooler parts
of the fuel to produce tar; and auto-catalytic secondary pyrolysis reactions due to these
interactions (Demirbas, 2001).
1.7.3 The chemical process
The chemistry of pyrolysis is strongly influenced by the chemical composition of the
fuel. The elemental composition of the fuel may be obtained from ultimate analysis.
Table 1.4 lists the average values obtained from ultimate analysis of two broad classes
of wood (Krishna et al., 1985). A fair idea of the percentage of the major products of
pyrolysis (volatiles and char) is obtained from proximate analysis. Table 1.5 shows the
proximate analysis by percentage weight (Krishna. et al., 1985).

14
Table 1.4: Typical Ultimate Analysis of Dry Wood by Weight (%)
Type of
wood H C N O Ash
Hard wood 6.4 50.8 0.4 41.8 0.9
Soft wood 6.3 52.9 0.1 39.7 1.0
Table 1.5: Typical proximate Analysis of Dry Wood by Weight (%)
Type of
wood Volatile matter Fixed carbon Ash
Hard wood 77.3 19.4 3.2
Soft wood 77.2 22.0 1.6
The major constituents of wood are cellulose (a polymer glucosan), hemicellulose (a
polysaccharide producing wood sugars), and lignin (a multi-ring organic compound).
The reaction products of pyrolysis are a combination of the products expected from
the separate pyrolysis of each of the three major constituents. Pyrolysis of each
individual constituent is itself a complex process depending on many factors. A
process with a combination of all the three constituents is even more complex with
many more factors governing the rate of the numerous reactions leading to an
enormous range of possible products (Sinha et al., 2004).
1.7.4 Key parameters in modelling pyrolysis
Modelling of pyrolysis implies the representation of the chemical and physical
phenomena constituting pyrolysis in a mathematical form. This means pyrolysis is to
be represented as a system of equations which taken together can provide valuable
quantitative information about the process. Pyrolysis, chemically represented, is a
huge series of inter-linked reactions. Besides the sheer extent and range of pyrolysis
reactions, several other issues complicate the modelling of pyrolysis. More often than
not these issues are inter-linked making it extremely difficult to separate the influence
of one from another (Sinha et al., 2004).
Heating rate
The rate of heating influences the reaction pathway and hence, the final products.
Pyrolysis is classified into slow pyrolysis, with heating rates of the order of 10 °C/min,
and rapid/fast/flash pyrolysis, with heating rates approaching 1000 °C/min.

15
Experimental observation suggests that char yield is supported at low heating rates
whereas the yield of volatiles increases markedly at fast heating rates (Sinha et al.,
2004).
At low heating rates, particularly those involving large samples, the residence time of
all primary products within the pyrolyzing matrix would dominate, accounting for
large char yields.
With the slower heating rate experienced at the particle interior, any pressure-driven
flow rate is reduced, increasing the intra-particle residence time of volatiles and
increasing the opportunity for condensation and char formation reaction. The
discussion in this research later generally pertains to the slow heating rate kind.
Heat of reaction
The issue of whether pyrolysis reactions are endothermic or exothermic plays an
important role in modelling. Reported values of heat of pyrolysis of wood range from
–613 kJ/kg (Tang and Neill, 1964) to 1680 kJ/kg (Roberts and Clough, 1963b).
Generally, the reported values pertain to slow heating rates. Fire level fluxes have not
been investigated in most cases. In this regard the work of (Lee et al., 1976) seems to
be most conclusive. They have calculated the heat of reaction from experimental
observation of decomposition rates, solid temperatures and thermal properties,
pyrolysis gas compositions and pressures. They have shown that for an incident heat
flux of 3.192 × 10⁴
J/m2-s applied parallel to the grain direction, the pyrolysing region
can be divided into three zones: an endothermic primary decomposition zone at T <
250 °C; an exothermic partial zone at 250 °C < T < 340 °C; an endothermic surface
char zone at 340 °C < T < 520 °C. The overall mass weighted effective heat of reaction
is endothermic at -613.2 kJ/kg. It has been observed during experiments that the
overall heat of reaction at higher heat fluxes is exothermic, being greater when the
heating is perpendicular to the grain orientation than when it is parallel. This may be
explained as follows. For heating perpendicular to the grain orientation, pyrolysis
gases have a much higher residence time in the solid matrix leading to an increase in
secondary pyrolysis reactions, which are believed to be exothermic. Roberts (1971b)
remarks that exothermic behaviour is strongly influenced by lignin content.

16
Reaction Scheme
The overall reaction mechanism of pyrolysis is yet to be fully understood; but several
simplifying schemes have been suggested for the purpose of modelling. The pyrolysis
of a biomass such as wood consists of two types; namely, primary and secondary.
Primary pyrolysis refers to the decomposition of any of the three major constituents of
wood. Thus, primary reactions may proceed in parallel with the simultaneous
decomposition of lignin, cellulose and hemicellulose in different regions of the fuel
depending on the local temperature. The primary reactions depend only on the local
solid temperature. (Zaror and Pyle, 1984) suggest that they have a very low enthalpy
change. Secondary pyrolysis reactions involve the decomposition products of primary
reactions. The products of the primary reactions, mainly char and volatiles also
catalyse the secondary reactions. Such autocatalytic reactions are initiated when the
hot volatile, products come in physical contact with unpyrolysed fuel (Sinha et al.,
2004).
Auto-catalytic secondary pyrolysis reactions are difficult to model since experimental
information on the mechanism of these reactions and reaction rates is not available.
The dependency of such reactions on the residence time of volatiles inside the solid
matrix causes further complications in modelling. Even in modelling primary
reactions, many simplifications have been made. A one-step first order global reaction
scheme has been used by most of the earlier models (Bamford et al., 1946b,
Matsumoto et al., 1969, Kansa et al., 1977b, Fan et al., 1977, Maa and Bailie, 1973).
However, based on their experimental work (Lee et al., 1976) concluded that such a
simple scheme was unlikely to result in an accurate model. They suggested a multi-
step scheme with char catalysed decomposition reaction.
The char catalysed decomposition reaction would account for the apparent residence
time dependency of the exothermic pyrolysis reactions and secondary char formation.
Other researchers share this view of the inadequacy of a single-step scheme. Panton
and Rittman (1971) have suggested a similar scheme based on their investigation.
Similar schemes have also been suggested by (Murty and Blackshear Jr., 1967, Akita,
1959, and Broido and Nelson, 1975b).
Residence time of volatiles
The results of Lewellen et al. (1969) indicate that the residence time of volatile
products within the pyrolyzing cellulose matrix is extremely important in determining

17
conversion. Residence time decides the extent of secondary pyrolysis. Competitive
pathways such as escape from the matrix, inhibition of char formation and auto-
catalysis of secondary pyrolysis, may exist whose rates and extent depends upon
residence times of certain products within cellulose (Sinha et al., 2004).
Particle size
In large particles the fluid residence times are sufficiently long to result in secondary
reactions of the volatiles produced by primary reactions (Bamford et al., 1946a, Jalan
and Srivastava, 1999). Large particle size also implies large thermal gradient. If
moisture is present in a fuel particle, it escapes violently resulting in cracking of the
surface. Local condensation of volatiles and moisture may also take place in the fuel.
This aspect of pyrolysis remains to be investigated experimentally. Though the multi-
step reaction scheme models are able to predict the overall tar formation, they do not
predict the local condensation of volatiles to produce tar (Sinha et al., 2004).
Structural effects
Cracking of the wood surface during pyrolysis has been reported by many researchers
(Roberts, 1971b, Zaror and Pyle, 1984, Kansa et al., 1977a and Tinney, 1965a) while
working on wooden dowels heated in a furnace, reported that the pressure at the center
of the dowel rose to several psig and then dropped suddenly to zero before the center
temperature reached the furnace temperature. While the pressure was dropping, serious
structural failures, such as longitudinal channelling and surface cracking, occur. The
effect of surface cracking is to alter the heating characteristics. While the total heat
transfer remains the same, heat is transported more quickly to the interior due to the
presence of cracks on the surface. Internal failures result in changed local porosity and
permeability, affecting fluid flow inside (Sinha et al., 2004).
Moisture content
Moisture content in the fuel affects solid internal temperature history due to
endothermic evaporation. Zaror and Pyle (1984) and. Chan et al., (1985b) further
stressed the need to account for the above process in energy balance. Kelbon (1983)
verified that water evolution has a major effect on the intra-particle energy balance.
Chan et al. (1985a) noted that not accounting for moisture evaporation results in over-
prediction of temperature in the numerical solution.

18
Grain orientation
Grain orientation, in wood, needs to be taken into account due to anisotropicity
resulting from it. Roberts (1970a) mentions that permeability for flow along the grains
is 104times that across the grain. Similarly, thermal conductivity along the grains is
twice that across the grains. Thus, Roberts notes that secondary pyrolysis becomes
important in the case of flow across grains. Kansa et al. (1977a) and Kung (1972) used
Darcy’s law in the momentum equation to model for fluid flow in an anisotropic solid
matrix.
Material properties
Material properties are extremely important as parameters in modelling. In particular,
thermal conductivity and heat capacity are important properties directly affecting the
process of pyrolysis. Since particle density is easily measurable and calculated by most
model equations, heat and mass transfer properties are conveniently and typically
expressed as functions of density and/or temperature. In most models, the thermal
conductivity of the pyrolysing solid has been modelled as a linear function of values
for virgin wood and char, depending on the instantaneous value of density. Kung
(1972) has noted that the temperatures and mass loss predictions are quite sensitive to
the value assumed for the thermal conductivity of char. However, accurate
measurements of the thermal properties of wood and char at high temperatures have
not been made yet. The problems in this regard are the presence of attendant chemical
reactions at high temperatures as well as wide variation in properties based on species
and growth patterns of wood (Sinha et al., 2004).
1.7.5 Approach to modelling
Pyrolysis is mathematically described through a system of coupled equations. The
basic equations are those of chemical kinetics, heat transfer and mass transfer. The
equations are individually discussed as follows.
(i) Chemical kinetics model
The actual reaction scheme of pyrolysis of wood is extremely complex because of the
formation of over a hundred intermediate products. Pyrolysis of wood is, therefore,
generally modelled on the basis of apparent kinetics. Ideally, the chemical kinetics
model should account for primary decomposition reactions as well as secondary
reactions. The model should take the heating rate into account to determine the scheme

19
of reactions and should consider the possibility of autocatalysis of certain secondary
reactions depending on the residence time of volatiles. However, to date models have
generally accounted for primary reactions through apparent kinetics and in some cases,
some of the secondary reactions through multi-step reaction schemes. Other issues are
yet to be accounted for in the existing models (Sinha et al., 2004).
In view of the importance of kinetics in pyrolysis of a biomass it is necessary to know
the values of kinetic parameters of the biomass under a particular set of conditions.
However, difficulty arises in studying the thermal behaviour of biomass due to lack of
exact knowledge of the course of reactions and their degree of completion. Moreover,
the vast number of products resulting from the thermal degradation of biomass hinders
a thorough understanding of the process. Thus, several different values of the kinetic
reaction constants, the pre-exponential factor and the activation energy, have been
used in literature for numerical simulation using the models. Few researchers have
used the values of kinetic constants in their simulation that have been estimated from
the same wood sample that was used for experimental corroboration. This approach is
to be favoured since it enhances the reliability of the model validation (Sinha et al.,
2004).
Pyrolysis modelling requires inputs from kinetic model in order to analyse and solve
heat transfer models of single particle and pyrolysis bed. The primary objectives of these
models are to provide a diagnostic tool for evaluating the importance of the various system
parameters and to identify system characteristics useful to experimentalists. The
chemistry and complication of the process which involves hundreds of intermediates
have paved the way for development of numerous kinetic models in the past. The
models and parameters on the whole imply a perplexing portrait to the end user
(Prakash, 2008).
Approximately, the wood pyrolysis kinetics can be described as two stages relating to
primary reactions of virgin wood decomposition and secondary reactions of the
primary products. Significant effects of the primary and secondary reactions depend
on a temperature range of interest and wood components (Di Blasi, 1993). In general,
the wood kinetic models are segmented into three main groups: a single-step global
reaction, single-step multiple parallel reactions and multi-step reactions.

20
The wood degradation process is complex and the kinetic model used considers the
kinetic processes in both primary and secondary reactions (Di Blasi, 1993, Panton and
Rittmann, 1970, Panton and Rittmann, 1970, and Broido and Nelson, 1975a). The
model is a single-step three parallel independent reactions accounting for the main
components of wood (hemicellulose, cellulose, and lignin). The degradation processes
are described first by the virgin wood decomposing to primary pyrolysis products,
char, liquids and gas which then undergo secondary reactions.
A general scheme of kinetic models in this group is
(1.3) G,L,Cj
(1.2) RT/
jE
ej
Aj
kwhere
(1.1) ,G
kL
kC
kk,TARL
kCHAR
ck
GASG
kWOOD
The kG, kL and kC are reaction rate constants for the formation of gas, liquids and char
respectively. The k is the total reaction rate constant for the decomposition of wood.
Reactions orders different from 1 are difficult to give a true physical meaning (Di
Blasi, 1998); therefore a first order reaction mechanism is used here.

21
The formation of char, tar and gas and break down of wood can be expressed using
Equations 1.4 – 1.7 respectively, where:
(1.7) )t(W
mW
kdt
)t(W
dm
(1.6) )t(W
mG
kdt
)t(G
dm
(1.5) )t(W
mL
kdt
)t(L
dm
(1.4) )t(W
mC
kdt
)t(C
dm
Where: mc, mw, mL and mG are the weight of char, wood, tar and gas, respectively.
(ii) Heat transfer model
The heat transfer model determines the temperature profiles that serve as input to the
kinetics model. Hence, the detail of the heat transfer model often determines the
accuracy of prediction of the overall model. The ideal heat transfer model should
account for the following phenomena/issues: heat transfer to the surface of the fuel,
conduction to the interior, internal convection, effect of surface cracks on heat transfer,
effect of internal structural changes on fluid flow, heat of reaction, grain orientation
and changes in material properties during the course of pyrolysis. However, the
existing models consider only the following aspects: gross surface heat transfer,
conduction, internal convection excluding residence time and density governed
material properties (Sinha et al., 2004).
(iii) Mass transfer model
The ideal mass transfer model should consider the effect of particle size, grain
orientation and internal structure as well as packing on the residence time of pyrolysis
gases. The mass transfer model is heavily dependent on the extent of detailing in the
chemical kinetics model. This is so because it is the kinetics model that identifies the
various species that the mass transfer model must work with. Single step reaction
models predict only the lumped gas species and hence, the product distribution is

22
unaffected by a finite mass transfer rate. However, for more complex multi-step
reaction schemes, mass transfer does affect the secondary pyrolysis (Sinha et al.,
2004).
Experimental studies on this aspect show that mass transfer effects may be neglected
for the case of heating parallel to the grain orientation since the residence time is low
in this case (Chan, 1983). Effectively the mass transfer model is yet to be developed
since residence time is yet to be modelled. One of the reasons that a good mass transfer
model has not been developed is the lack of information on secondary pyrolysis
reactions.
1.8 Definition of Terms
The following terms are used in this work.
(i) Earth kiln: a kiln containing wood logs covered in a thick layer of earth
held together by grass roots and small shrubs.
(ii) Woodfuel: wood and charcoal used as fuel.
(iii) Woodlog: a piece of wood of average diameter of 0.05-0.5 m and
length of one to three metres.
(iv) Conversion Efficiency: The proportion of the carbon content of the
wood which is converted to charcoal.
(v) Charcoal yield: is defined as the ratio of the mass of charcoal produced
to the dry mass of the wood charge.
1.9 Assumptions
The following assumptions are applied to the simulation as they are close to reality for
the kiln:
(i) The earth covering is almost dry with moisture content of 20 percent.
(ii) The flow of air for partial combustion from the atmosphere and volatile
gases from carbonisation is laminar only.
(iii) The flow regime in the kiln is three-dimensional and unsteady.
1.10 Scope of the Study
The work is mainly on traditional earth charcoal production kilns operated by small
scale charcoalers as opposed to metal, brick or concrete charcoal production kilns
whose operations could extend to large commercial scale. The woodlogs studied are

23
species growing in Zambia and the Southern African region in general. Only the
carbonisation process, conversion efficiency and charcoal yield are studied.
The site locations for data collection were limited to the areas of high charcoal
production of Copperbelt, Central and Lusaka Provinces whose proximity is close to
the major charcoal consumer markets.
The naturally uncontrollable environmental factors are the ambient temperature and
pressure, wind speed and its direction.
1.11 Contribution of Research Findings
(i) Development of a general numerical model of charcoal making kiln able to
simulate the various conditions.
(ii) Knowledge of an improved charcoal making kiln design that optimally
controls carbonisation rate of wood for improved conversion efficiency and
higher yield of charcoal.
(iii) Development of best practice standards in terms of charcoal kiln design,
construction and operations.
(iv) Informed policy decision making on woodfuel energy conversion and
technology support requirements.
1.12 Benefits of the research
(i) Efficiently produced charcoal will lessen the strain on forest wood
resources by using lesser wood as a source of renewable energy and reduce
pressure on urban and rural household energy supply.
(ii) Efficiently produced charcoal will reduce environmental impacts on air,
land and water due to reduced deforestation and Green House Gases.
(iii) Efficient charcoal production method will enhance sustainable charcoal
production and hence provide employment and lift the social and economic
status of the charcoal producers in poor urban and rural areas.
1.13 Brief Overview of Chapters
Chapter Two deals with review of literature on numerical modelling of pyrolysis in
general and wood carbonisation in particular and charcoal making methods. Chapter
Three considers method and materials used in the research. That is research design,

24
data collection and analysis, modelling theory leading to optimisation of the earth kiln
method and conversion efficiency calculations. Chapter Four describes how the
mathematical modelling was formulated and actual simulations were carried out. The
chapter explains the Computational Fluid Dynamics setup of the earth kiln and the
numerical models used for wood drying and wood pyrolysis. Also setup and modelled
for the kiln are the boundary conditions of velocities at inlets and outlets and their
respective temperatures and densities and; sources like the pressure gradient and heat
sources. Also included in the chapter are the simulations leading to the optimisation of
key parameters of carbonisation process in the kiln for the wood drying and pyrolysis.
Chapter Five presents the numerical simulations or model results and discusses their
implications. The results of the effects of major factors influencing wood carbonisation
and hence charcoal conversion efficiency and yield are discussed. The major factors
are the wood characteristics, wood weight distribution and arrangement in the earth
kiln; kiln design features and prevailing wind direction. Chapter Six concludes the
research and gives the recommendations. The chapter summarises the research
findings and contributions, outlines the conclusions, suggests future research and
makes recommendations for implementations and future work.
1.14 Conclusion
Chapter One introduced the background to the research, the problem of charcoal
consumption, production and deforestation. Also considered are the purpose,
significance, justification and theoretical framework of the research. Lastly the terms
used in the research were defined and assumptions and scope of the study stated.
List of References
Akita, K. (1959). Report of Fire Research Institute. Japan. 9: 1-44, 51-54, 77-83, 95-96.
Amous, S. (2000). Review of Wood Energy Reports from ACP African Countries. Rome, EC-FAO
Partnership Programme working document.
Bamford, C. H., and Crank, J. (1946). The Combustion of Wood. Proceedings. Cambridge Philosophical
Society. Vol. 42. p. 166-182
Bellais, M. (2007). Modelling of the Pyrolysis of large Wood particles. Stockholm. Sweden. Ph.D.
Broido, A. and Nelson, M. A. (1975). "Char Yield on Pyrolysis of Cellulose." Combustion and Flame
24: p. 263-268.
Chan, W. C. R. (1983). Ph.D. Thesis. Department of chemical engineering. Washington University of
Washington. Ph.D.

25
Chan, W. R., and Kelbon, M. (1985). "Modelling and Experimental Verification of Physical and
Chemical Processes During Pyrolysis of Large Biomass Particle." Fuel 64: 1505-1513.
CHAPOSA (1999). Charcoal Potential in Southern Africa First Annual Report Covering the period
from 20 December 1998 to 20 December 1999.
Chidumayo, E. (1991a). ".Woody Biomass Structure and Utilization for Charcoal production in a
Zambian Miombo Woodland." Bioresource Technology 37: 43-52.
Chidumayo, E. N. (2012). Development of reference emission levels for Zambia. Lusaka, Zambia, FAO.
Chidumayo, E. N., and Masialeti, I. (2001). Charcoal potential in Southern Africa (CHAPOSA).
Stockholm, Stockholm Environment Institute.
Chipungu, J. (2000). Deforestation on the Increase In Zambia. Africa News Online
(www.africanews.org, Panafrican News Agency.
Demirbas, A. and Arin, G. (2002). "An Overview of Biomass Pyrolysis." Energy Sources 24: 471-482.
Department of Energy (1994.). Energy Policy for Zambia. Department of Energy. Lusaka, Zambia.
Department of Energy (2007). National Energy Policy (NEP). Republic of Zambia, Ministry of Energy
and Water Development: p. 2.
Department of Energy (2007). National Energy Policy (NEP). Lusaka, Republic of Zambia, Ministry of
Energy and Water Development: p. 11-14.
Department of Energy (2007). National Energy Policy (NEP). Lusaka, Republic of Zambia, Ministry of
Energy and Water Development: p. 3.
Di Blasi, C. (1993). "Modelling and Simulation of Combustion Processes of Charring aNon-Charring
Solid Fuels." Progress in Energy and Combustion Science, 19: 71-104.
Di Blasi, C. (1998). "Comparison of semi-global mechanisms for primary pyrolysis of lignocellulosic
fuels. ." Journal of Analytical and Applied Pyrolysis. Vol. 41: p. 4139-4150.
ECZ (2008). Inventory Study, Environmental Council of Zambia.
Fan, L. T., and Fan, L. S. (1977). Can. J. Chem Engg 55: 47-53.
FAO (1983). Simple Technologies for Charcoal Making. Rome. FAO Paper 41.
FAO (1985). Industrial Charcoal Making, Paper 63. Rome, FAO Forestry Department.
FAO (2011). State of the World’s Forests. Rome, Italy, FAO.
Foley, G. (1986). Charcoal Making in Developing Countries, Technical Report No. 5. Earthscan
London, International Institute for Environment and Development.
Henry, M., and Maniatis, D. (2011). Implementation of REDD+ in sub-Saharan Africa: state of
knowledge, challenges and opportunities. Environment and Development Economics. 16 381-404.
Hibajene, S. H. and Kalumiana, O. S. (1994). "Manual for Charcoal production in Earth kilns in
Zambia": p. 39.
Hibajene, S. H. and Kalumiana, O. S. (2003). Manual for Charcoal Production in Earth Kilns in Zambia.
D. o. Energy. Lusaka, Zambia: p. 15-19.
ILUA (2010). Integrated Land Use Assessment 2005 -2008. Forestry Department, Lusaka, Zambia.

26
Jalan, R. K. and Srivastava, V. K. (1999). "Studies on pyrolysis of a single biomass cylindrical pellet -
kinetic and heat transfer effects." Energy Conversion and Management 40: 467-494.
Japanese International Cooperation Agency (JICA) (2007). Rural Electrification Master Plan Study in
Zambia. Tokyo, The Tokyo Electric Power Company, Inc.: Chap. 1-3.
Kalinda, T., and Bwalya, S. (2008). Use of Integrated Land Use Assessment (ILUA) data for forestry
and agricultural policy review and analysis in Zambia. Lusaka, Ministry of Tourism, Environment and
Natural Resources.
Kansa, E. J., and Perlee, H.E. (1977). "Mathematical Model of Wood Pyrolysis Including Internal
Forced Convection." Combustion and Flame Vol. 29, : p. 311-324.
Karekezi, S. (2001). The Potential of Renewable Energy Technologies in Africa, AFREPREN/FWD.
Kelbon, M. (1983). Thesis University of Washington. M.S.
Krishna, P. and Sangen K., E. (1985). "Woodburning Cookstoves." Advances in Heat Transfer 17: 159-
310.
Kung, H. C. (1972). "A Mathematical Model of Wood Pyrolysis." Combustion and Flame 18: p. 185-
195.
Lee, C. K., and Chaiken, R. F. (1976). Charring Pyrolysis of Wood in Fires by Laser Simulation. 16th
Symposium (Intl.) on Combustion. Pitts, Combustion Institute: 1459-1470.
Lewellen, P. C., and Peters, W. A. (1969). Cellulose Pyrolysis, Kinetics and Char Formation
Mechanism. 12th Symposium on Combustion, , Pitts, The Combustion Institute.
Maa, P. S. and R. C. Bailie (1973). "Influence of Particle Sizes and Environmental Conditions on High
Temperature Pyrolysis of Cellulosic Material -I (Theoretical) " Combustion Science and Technology 7:
257-269.
Masiliso, S. (2004). "Energy Statistics, ‘The Case of Zambia’."
Matsumoto, T., and Fujiwara, T. (1969). Combustion, 12th Symposium on Combustion, Pitts, The
Combustion Institute.
MEWD (2007). National Energy Policy (NEP). D. o. Energy. Lusaka, Doe.
Murty, K. A. and Blackshear Jr. P. E. (1967). Pyrolysis Effects in the Transfer of Heat and Mass in
Thermally Decomposing Organic Solids. 11th Symposium (International) on Combustion, Pitts, The
Combustion Institute.
Mwitwa, J. and Makano, A. (2012). Charcoal Production, Demand and Supply in Eastern Province and
Peri-urban Areas of Lusaka. Lusaka USAID Report.
Panton, R. L. and Rittman, J. G. (1971). Pyrolysis of a Slab of Porous Material. 13th Symposium
(International on Combustion, The Combustion Institute.
Panton, R. L. and Rittmann, J. G. (1970). "Pyrolysis of A Slab of Porous Material." ThirteenSymposium
(International) on Combustion: 881-889.
Paul, A. R. (1987). Africa’s Charcoal Dilemma., IDRC Reports.
Prakash N. and Karunanithi, T. (2008). "Kinetic Modeling in Biomass Pyrolysis – A Review." Journal
of Applied Sciences Research © 2008, INSInet Publication 4(12): 1627-1636.
Ranta, J. and Makunka, J. (1986). Charcoal from Indigeneous and Exotic Species in Zambia. Forest
Department, Division of Forest Products Research. Technical Paper No. 29.

27
Roberts, A. F. (1971). Problems Associated with the Theoretical Analysis of the Burning of Wood. 16th
Int. Symposium on Combusion. Pitts, The Combustion Institute: 893-903.
Roberts, A. F. and Clough, G. (1963). Thermal Degradation of Wood in an Inert Atmosphere. 9th
Symposium (Intl.) on Combustion, Pitts, The Combustion Institute.
Sinha, S., and Jhalani, A. (2004). Modelling of Pyrolysis in Wood: A Review New Delhi - 110016,
India, Indian Institute of Technology, Hauz Khas, Department of Mechanical Engineering.
.
Karekezi S. and Dafrallah T. (n.d.). Major Challenges Facing The African Energy Sector ADB Finesse
Africa Program. ENDA-TM, AFREPREN/FWD.
Tang, W. K. and Neill, W. K. (1964). "In Thermal Analysis of High Polymers." J. Polymer Science
B.Ke (ed.) Part C (6): 65.
Tara, N. (1998). Charcoal and its Socio-Economic Importance in Asia: Prospects for Promotion
Regional Training on Charcoal Production, RWEDP. . Pontianak, Indonesia.
Tinney, E. R. (1965). The combustion of wood dowels in heated air. 10th Symposium (International)
on Combustion, The Combustion Institute.
Vinya, R., and Syampungani, S. (2012). Preliminary Study on the Drivers of Deforestation and Potential
for REDD+ in Zambia. FAO. Lusaka, Zambia, Ministry of Lands & Natural Resources.
Wang, Y. and Yan, L. (2008). "CFD Studies on Biomass Thermochemical Conversion " International
Journal of Heat and Mass Transfer Molecular Sciences ISSN 1422-0067 9( ): 1108-1130.
World Bank/ESMAP (1990). Zambia Household Energy Strateg Report. Washington D.C.
Zaror, C. A. and Pyle, D. L. (1984). Models for Low Temperature Pyrolysis of Wood. Thermochemical
Processing of Biomass. London., Butterworths & Co. Pub. Ltd.

28
CHAPTER 2 LITERATURE REVIEW
2.1 Introduction
In this chapter a brief history and theory of modelling of wood pyrolysis and the
approaches in wood carbonisation and mechanisms of charcoal making are reviewed
together with the earth kiln charcoal making method. It is important to know and
understand how wood pyrolysis has developed through the decades and in different
parts of the world. Such knowledge can enhance any new efforts towards improving
wood pyrolysis process. The Pyrolysis process starts first by drying the biomass
material prior to commencement of carbonisation. During carbonisation process
kinetic mechanisms in the wood take place in the solid and gas phases in the kiln.
Thermochemical conversion of biomass offers an efficient and economical process to
provide gaseous, liquid and solid fuels. Computational fluid dynamics (CFD)
modelling applications on biomass thermochemical processes help to optimize the
design and operation of thermochemical reactors. Recent progression in numerical
techniques and computing efficacy has advanced CFD as a widely used approach to
provide efficient design solutions in industry. The fundamentals underlying
development of a CFD solution in thermochemical systems and sub-models for
individual processes are the mathematical equations governing the fluid flow, heat and
mass transfer and chemical reactions (Wang and Yan, 2008).
2.2 History of Pyrolysis and Charcoal Making
2.2.1 Charcoal making: world overview
The traditional methods of making charcoal have surprisingly changed very little from
ancient times till now. There are many different types and sizes of kilns that have come
into use from time to time. The only new factors are that the simple methodologies
have been rationalised and that science has generally verified the basic processes
which take place during carbonisation and spelled out the quantitative and qualitative
laws which govern the processes in general.
However, in most developing countries, like Zambia, the traditional methods of
charcoal making have remained the only technology used. This has not been deliberate,
but it is due to the high capital and operating costs of advanced technology kilns often
used in the industrialised world.

29
The main characteristics of various categories of charcoal making kilns are shown in
Appendix A. The characteristics range from kiln type, production capacities, yield,
cost estimate and kiln usage. The earth mound kiln mainly used in developing
countries has a wide range of capacities and has the lowest cost and the lowest yield
putting it at a disadvantage.
Different kiln construction materials have also been used, often with no set design or
structure in mind. Good planning and designing, however, has resulted in kiln
structures that function well. Masonry blocks, various types of bricks, field stone, and
reinforced concrete are commonly used in construction of modern charcoal kilns.
Kiln production of charcoal is perhaps of greatest interest out of the numerous methods
because of its low plant investment and operational simplicity. The most popular kiln
type is of concrete or masonry blocks. Less common, but nevertheless important, are
the sheet-metal kilns and those of brick construction (Forest Service, 1961). In the
developing world, particularly Africa, charcoal kiln construction material has largely
remained earth or soil.
New pyrolysis technologies have only been developed in the past couple of decades
compared to more than 200 years for gasification, and more than 2000 years for
combustion. Opportunities for successful development of pyrolysis technologies
therefore requires fundamental research. As the technology and applications for the
products have developed, so has knowledge and awareness of the technical and
economic challenges to be addressed. Fundamental research therefore is key in aiding
successful commercialization of the pyrolysis products as shown in Appendix B
(Bellais, 2007).
2.2.2 Charcoal making: southern Africa-CHAPOSA project
In the Southern African region, one important project which basically studied the
production of charcoal is CHAPOSA (Charcoal Potential for Southern Africa). The
CHAPOSA project set out to establish a number of important facts about biomass use
in three major cities in Sub-Saharan African. These cities are Dar-es-Salaam
(Tanzania), Lusaka (Zambia) and Maputo (Mozambique). One fact of interest was the
identification of indicators of over-exploitation of biomass resources and finding

30
workable policy tools that would enable sustainable production of charcoal in the
medium term perspective (Chidumayo, 2002).
The results showed that around all three major cities, woodland cover had reduced
significantly during the study period of 1998 to 2002, due to charcoal production
amongst other causes. The reductions in woodlands cover were as follows: Lusaka
area from 32 to 24 percent of area covered (25 percent reduction), Dar-es-Salaam area
from 22 to 17 percent of area covered (22 percent reduction), and Maputo area from
3.8 to one percent of the area covered (74 percent reduction). The potential for charcoal
production from most of these areas is expected to substantially reduce in the year
2017 if no mitigation measures are implemented (Chidumayo, 2002).
The model developed in the CHAPOSA project focused on the effect of applying more
efficient production and consumption techniques of charcoal. The model showed that
such measures if introduced on large scale could substantially reduce charcoal
consumption thus allowing for charcoal use much longer into the future. The model
was calculated on the basis of wood prepared to be converted to charcoal. The charcoal
conversion efficiency, (Ek), was calculated on the basis of the following variables:
(i) Oven-dry mass of wood in the kiln (Mwk).
(ii) Mass of un-carbonized wood after carbonization (Muc).
(iii) Mass of charcoal bagged or recovered from the kiln (Mcr).
(iv) Mass of charcoal not recovered (Mcur), usually in form of fines in the kiln
soil.
These variables were applied in the charcoal conversion efficiency equation as
follows:
Ek (%) = [(Mcr + Mcur)/(Mwk – Muc)]100
During the dry season, the charcoal mass is assumed to represent oven-dry weight. But
under wet and humid conditions, charcoal absorbs moisture and its weight should
ideally be corrected for moisture content by a factor derived from oven-dry charcoal
samples.

31
CHAPOSA reported various conversion efficiencies of the kilns; for Dar-es-Salaam,
data from twenty-one kilns from four sites had mean kiln efficiency of 19 percent
ranging from 11-30 percent; for Maputo the traditional charcoal kiln yield varied from
14-20 percent due to several factors such as wood species, kiln covering material, log
arrangement within the kiln and experience and skills of the charcoal burners; for
Lusaka, from the Zambia ecological study one of the main conclusions drawn was that
conversion efficiency of wood to charcoal in earth kilns is relatively good (20 - 25
percent) on oven dried wood weight basis.
2.2.3 Charcoal making: Zambian overview
Producers from Angola first introduced charcoal as a household energy source in the
Copperbelt region of Zambia around 1947. By 1962 virtually all African households
in the Copperbelt and Lusaka provinces towns were using charcoal for cooking and
heating purposes. Naturally, the production methods were traditional earth kilns, a
practise that continues up to present day and has spread to other parts of the country
(Chidumayo, 2002). The earth clamp method is the most predominant for all the
charcoal produced in Zambia today (Hibajene and Kalumiana, 2003b).
Charcoal is an important energy source in Zambia today as it ranks second to firewood
in terms of primary energy supply. Recent data shows that Zambia is the biggest
charcoal consumer in the region. Thus charcoal production is likely to continue until
other sources of energy are identified. In the absence of this, the best that can be done
is to make the production and use of charcoal more sustainable. Identified as one way
to stimulate a more environmentally-friendly charcoal production process is the
introduction of improved charcoal kilns (Living Documents, 2005).
2.3 Theory of Modelling of Wood Pyrolysis
2.3.1 Review of Models of Wood Pyrolysis
The chemistry and complication of the pyrolysis process which involves hundreds of
intermediates have paved the way for the development of numerous kinetic models in
the past and in due course this has developed into a long history. The models and
parameters on the whole imply a perplexing portrait to the end user. Hence even today
it is difficult to develop a precise kinetic model taking into account all the parameters
concerned.

32
The following various pyrolysis modelling studies appearing in the literature either
present different versions or enrich the model suggested by Bamford et al. (1946a).
Bamford’s model combines the equation for heat conduction and heat generation in a
pyrolyzing solid while assuming a first order kinetics. However, the heat transfer
equation does not consider the effect of change of density as a function of time.
Fan (1977) developed a pyrolysis model which included heat and mass transfer in a
biomass particle. The reaction is considered to be first order with respect to initial
particle concentration, but the model cannot analyse product concentrations because
the secondary reactions are not considered. Miyanami et al. (1977) incorporated the
effect of heat of reaction in the model by Fan (1977).
The model developed by Bamford et al. (1946) was used by Tinney (1965b), Roberts
and Clough (1963a), Tang and Neil (1964), Shafizadeh (1978) and was modified by
Kung (1972) in order to incorporate the effects of internal convection and variable
transport properties (Bamford et al., 1946a). However, in all works reviewed no
specific kinetic mechanism was suggested to predict the concentration of the various
components produced during pyrolysis.
Kansa et al. (1977a) included the momentum equation for the motion of pyrolysis
gases within the solid. So far a suitable kinetic mechanism had not yet been utilized
and the solution to the heat and momentum balance equation was based on arbitrary
boundary conditions.
Studies have also been carried out on pyrolysis of biomass and other substances by
(Srivastava et al., 1996, Di Blasi, 1998, Demirbas, 2001, Boutin et al., 2002, Mastral
et al., 2002, and Bryden et al., 2002). Many of the above studies have not included the
secondary reactions in pyrolysis kinetics. Babu and Chaurasia (2002a) pointed out that
secondary reactions were essential for the numerical results to match fully the
experimental observations.
Keeping the above drawbacks of the existing models in view, Babu and Chaurasia
(2002b), presented the kinetic model, which considered the secondary reactions in
pyrolysis kinetics. They used this numerical model and developed it for pyrolysis of a
single biomass particle, which included kinetics and heat transfer effects in the particle.

33
The temperature profiles obtained by (for different operating conditions. The
simulated results obtained by Babu and Chaurasia (2002b), model was in excellent
agreement with the experimental data much better than the agreement with the models
proposed by Jalan and Srivastava (1998a) and Bamford et al., (1946a). Babu and
Chaurasia’s model is the model of choice for most current research in pyrolysis
because the model excellently matches with experimental data.
2.3.2 Advances in Modelling and Simulation of Biomass Pyrolysis
Revisiting the mechanisms for pyrolysis of biomass so far developed reveals a general
approach: virgin biomass as the raw material and with gas, volatiles, tar, and char as
the end products.
Prakash et al. (2008) in their work discuss the progress made in the kinetic modelling
front as far as biomass pyrolysis is concerned. They examined the chemistry, reaction
mechanisms, kinetic models and kinetic parameters involved in the pyrolysis process.
(i) One Step Global Models
One step global models were used during the initial stages of the modelling of
pyrolysis process; these models consider pyrolysis as a single step first order reaction.
These one-step models decompose the organic fuel into volatiles and coke with a fixed
char yield (Peters and Christian, 2003). One step global models do not represent the
real situation, hence, their use was sparingly found in literature.
(ii) Competing Models
The competing reaction model of Thurner et al. (1981) is the most classical model for
wood pyrolysis. It features a varying char yield. The model comprise of secondary
reactions lumped with primary reactions over a narrow temperature range by means of
three competitive reactions, their investigation was restricted to the determination of
the kinetic data of the primary reactions. This model is empirical and therefore was
kept as simple as possible. As there was no means to measure secondary reactions, the
cracking reactions are lumped into the primary reactions. This scheme has a varying
char yield.

34
(iii) Parallel Reaction Models
Alves and Figueiredo (1989) assumed a new reaction scheme and corresponding
kinetics were experimentally determined for very small samples of dry pine wood
sawdust, with negligible internal temperature gradients. Six independent reactions
were identified. This scheme has a fixed char yield and does not feature secondary
reactions
(iv) Models with Secondary Tar Cracking
Chemical processes of biomass pyrolysis are described through a primary and
secondary stage (Kashiwagi, 1979, Martin, 1964, Anthenien and Fernandez-Pello,
1998, Bilbao, 2001, Spearpoint, 1999) as follows: The competing reaction model of
Kashiwagi (1979), was added with tar cracking and depolymerisation, here, the tar
decomposes into lighter gases or polymerized into coke in exothermic reactions. Also,
primary reactions were assumed to be adequately represented as first order in the mass
of pyrolysable material and having an Arrhenius type of temperature dependence.
Secondary reactions were assumed to occur only in the gas/vapour phase within the
pores of the solid matrix and their rates are proportional to the concentration of tar
vapours (Spearpoint and Quintiere, 2000, Spearpoint and Quintiere, 2001).
Broido and Nelson (1975a) have showed that cellulose decomposes by a multistep
mechanism at low temperatures. Later Bradbury, Sakai and Shafizadeh simplified
Broido’s reaction work. This simplified reaction scheme, called the ‘Broido-
Shafizadeh model’, is generally accepted today with the kinetic parameters frequently
quoted and used in simulations. This mechanism accounts for the formation of an
active solid with a reduced degree of polymerization and two competing reaction
pathways: (a) intermolecular dehydration, predominating at low temperatures, leading
to char and gas and, in air to smouldering combustion; and (b) depolymerisation
reaction, predominating at high temperatures, leading to tar and, in air, to flaming
combustion. The reactions are endothermic and their rates are represented as first order
in the mass of pyrolysable material and with an Arrhenius type of temperature
dependence.
Koufopanos et al. (1991) attempted to correlate the pyrolysis rate of the biomass with
its composition. The pyrolysis rate of the biomass was considered to be the sum of the
rates of the main biomass components: cellulose, hemicellulose and lignin. The model

35
provides an initial reaction (reaction 1) which describes the overall results of the
reactions prevailing at lower pyrolysis temperatures (below 473 K). This first step is
considered to be of zero-order and is not associated with any weight loss. The
intermediate formed further decomposes through two competitive reactions, to char
(reaction 3) and to gaseous/volatile products (reaction 2). It is assumed that the
reactions follow the Arrhenius law. This model is relatively simple and can predict the
final char yield in different heating conditions.
Boutin et al. (2002) in his recent work on flash pyrolysis of cellulose pellets, developed
kinetic pathways derived from the model of Varhegyi (1994). This simplified pathway
implies only the phenomena occurring inside the solid and liquid phases and does not
include the process occurring in the gas phase.
Models with secondary tar cracking are more flexible since they include the
description of the primary degradation of the solid and the secondary degradation of
primary pyrolysis products and thus can be profitably applied to simulate thermal
conversion.
(v) Other Models
Branca et al. (2003). studied the kinetics of the isothermal degradation of wood in the
temperature range 528–708 K, and suggested a semi-global reaction mechanism The
reaction rates were assumed to be present in the usual Arrhenius dependence on
temperature and to be linearly dependent on the mass of the reactants, A, B and D.
Recently, Branca et al. (2003) also proposed a three step mechanism for non-
isothermal pyrolysis with wider heating rate (3-108 K/min) here the overall mass loss
rate is a linear combination of the single fraction rates.
Grioui (2006) developed a two-stage, semi-global multi-reaction kinetic model where
wood is subdivided into three pseudo-components A1, A2, A3; each of them
corresponding to a specific kinetic law and a mass fraction One step global models,
competing and parallel reaction models are weak when compared to models with
secondary tar cracking, as they assume a constant ratio of the char to volatiles yield.
The above simple correlation models cannot be extended to systems different from the
one on which they were based.

36
In order to account for wood variety and shrinkage factors, it is necessary to formulate
semi-global kinetic mechanisms to estimate reliable kinetic data and investigate the
dependence of physical properties on temperature and solid composition.
Conclusion
Among the reaction mechanisms, the secondary tar cracking schemes, particularly the
extended Koufopanos kinetic mechanism (Srivastava et al. 1996) is the most widely
used scheme which cover most of the possible aspects of pyrolysis reactions. The
scheme along with (Koufopanos et al., 1991) kinetic parameters can predict
reasonably accurate primary and secondary product distributions along with wide
heating rates and temperature range. Experimental works to produce reliable kinetic
data are very limited in biomass pyrolysis kinetic modelling. The overall kinetics of
the bed of particles has to be considered where, the effect of the size and shape of the
particle and the effect of the neighbouring particles should be accounted for. Preferably
it is necessary to develop generalized kinetic models which can be applied to any size
and shape of the particle. Most of the models are based on single particle. Also, the
development of kinetic models along with semi global kinetic mechanisms accounting
for generalization of wood variety is necessary.
2.3.3. Wood pyrolysis processes
Pyrolysis is essentially the thermal decomposition of organic matter under inert
atmospheric conditions or in a limited supply of air, leading to the release of volatiles
and formation of char. Pyrolysis in wood is typically initiated at 200 °C and lasts till
450-500 °C, depending on the species of wood.
Figure 2.1 shows the main processes involved in pyrolysis of a round wood exposed
to a heat flux qIN. Heat conduction into the wood raises the temperature locally,
initiating wood drying and subsequent reactions. The reaction front then moves
radially inward, leaving a porous char layer behind it. Tar and gas move outwards from
this front, finally escaping from the char layer surface. Since pyrolysis is endothermic,
this outward flow of volatiles constitutes a cooling convective heat flux which opposes
conduction. Other processes occurring during pyrolysis include; secondary reaction of
the products passing through the char layer, a build-up of pressure inside the wood to
overcome the flow resistance of the porous char, gas phase diffusion of different
product species, and shrinkage and/or splitting of the wood (Tuck and Hallett, 2005).

37
Figure 2. 1: Schematic of Wood Pyrolysis
The overall process of pyrolysis of wood is believed to proceed as follows: At around
160 °C the removal of all moisture (dehydration) is complete. Over the temperature
range 200 °C to 280 °C, all the hemicellulose decomposes, yielding predominantly
volatile products such as carbon dioxide, carbon monoxide and condensable vapours.
From 280 °C to 500 °C the decomposition of cellulose picks up and reaches a peak
around 320 °C. The products are again predominantly volatiles. The decomposition
rate of lignin increases rapidly at temperatures beyond 320 °C. This is accompanied
by a comparatively rapid increase in the carbon content of the char residual solid
material (Roberts, 1971b). A comprehensive review of the basic phenomena of
pyrolysis can be found elsewhere (Zaror and Pyle, 1982).
2.3.4. Wood Drying During Pyrolysis
Wood is divided, according to its botanical origin, into two kinds. The softwoods
(exotic) are lighter and of simple structure with density range of 350 kg/m³ to 700
kg/m³. They produce poor quality charcoal, e.g. from pinewood. The hardwoods
(natural woods) are harder and more complex in structure. Their density ranges from
450 kg/m³ to 1250 kg/m³. They produce high quality charcoal (e.g. from fruit-tree
wood, which is heavy). Both soft wood and hard wood consist of approximately 12
percent moisture content (Desch and Dinwoodie, 1996).
(i) Wood and moisture content
The water in wood logs is present in three physical states (Desch and Dinwoodie,
1996):

38
(i) Liquid water (or free water), which is much like pure liquid water,
contains some contaminants like chemicals, thus altering the drying
characteristics of wood.
(ii) Bound water or hygroscopic water is adsorbed in the cell wall and it
forms hydrogen bonds with the fibres.
(iii) Water vapour is water in cell lumina in the form of vapour and is normally
negligible at normal temperature and humidity.
Green (freshly cut) logs may have moisture content of as low as 30 percent in the hot
dry season to as high as 60 percent in the humid rainy season. Prior to pyrolysis for
charcoal formation, the moisture must be reduced to optimal levels of as low as 15-20
percent through wood drying. Energy (heat) must be supplied to evaporate moisture
from the wood (Skaar, 1988).
The water or moisture content (MC) of wood is expressed as the ratio of the weight of
water present in the wood (MH2O), to the weight of dry wood substance (Mwood).
(2.1) M
MMC
wood
OH2
The reason for drying wood during pyrolysis is to enable the wood to burn in order to
supply energy for the pyrolysis process. Moisture affects the burning process by
releasing unburnt hydrocarbons as gases. If a 50 percent wet log is burnt at high
temperature, about five percent of the energy of the log is wasted through heating and
evaporating the water vapour. For firing up the charcoal kiln, the key to burning the
wet wood is to burn it very hot, perhaps by starting the fire with dry wood (Bellais,
2007).
Wood drying has a dramatic complexity due to coupled heat, mass and momentum
transfer occurring during drying process. The drying process within wood can be
interpreted as simultaneous heat and mass transfer with local thermodynamic
equilibrium.
There are two commonly applied models for the simulation of the processes of wood
drying. There is a models based on transport processes and a model based on both
transport and physiological phenomena of wood in relation to drying of softwood. In

39
the transport-based drying models, wood is considered a hygroscopic porous material
for which the mass and energy conservation equations are established. By employing
Darcy’s law, the pressure gradient in the liquid phase, due to capillary action within
cell lumens, is taken as the driving force for liquid water flow, and vapour partial
pressure gradient within the lumens as the driving force for gas phase transfer. For
bound water transfer, various methods have also been developed by Bellais (2007).
The moisture content is an important parameter when considering wood as fuel.
Therefore it is interesting to study drying under thermal conversion conditions and to
include it in models for wood pyrolysis. However the drying process is complex to
model. Some authors have used industrial wood drying models in comprehensive
models for the pyrolysis of wet wood. On the other hand, authors more interested in
the thermal conversion of wood have used models based on strong simplifying
assumptions in order to decrease the computational load. There are models suitable for
describing drying under pyrolysis conditions based on the descriptive power of the
model, the difficulty of implementation and the extra cost in computing time.
(ii) Wood drying
Water in wood normally moves from zones of high to low moisture content (Walker
et al., 1993). Drying starts from the exterior of the wood and moves towards the centre.
Drying at the outside is necessary to expel moisture from the inner zones of the wood.
During pyrolysis, the wood subsequently starts charring after all moisture has been
driven out.
Heating the wood log during pyrolysis enhances the drying rate. An increase in
temperature augments the saturation pressure within the wood. It results in a higher
concentration of water vapour and a faster diffusion out of the wood log. If the pressure
of the water vapour becomes higher than the external pressure, then the water vapour
begins to move by convection. The resistance to mass transfer is then an important
parameter. If the resistance is high, then water vapour is hindered from flowing
through the wood log and the pressure increases. A subsequent increase in the
temperature occurs since the saturation pressure is a growing function of the
temperature. If the resistance is low, the water vapour moves almost instantaneously
out of the wood log and the saturation pressure remains almost constant.

40
The size of the drying zone is fixed by the resistance to the gas flow (a high resistance
enlarges the drying zone) and the temperature gradient. Low thermal gradients occur
at low heating rate. A large zone of the wood may then reach the boiling temperature.
This is typically the case in the middle of wood logs. The boiling temperature is
reached in a very thin zone wherein fast evaporation occurs. A drying front may then
be noticed moving toward the centre of the wood log. This is often the case close to
the surface of the log at high temperature drying (Bellais, 2007).
(iii) Mass Transfer in drying wood
Mass transfer of free and bound water
Gases, and water vapour, flow by diffusion and convection. There is also a mass
transfer for free and bound water. The model for the flows of free and bound water
and the equations presented in this section are taken from Gronli (1996). It originates
in the work of Perré and Degiovanni (1990) and Ouelhazi et al. (1992).
Flow of free water
The flow of free water is sometimes called the bulk flow (Siau, 1995). Free water
moves under the gradient of pressure in the liquid phase. The pressure in the liquid
phase, Pl, is equal to the pressure in the gas phase, P, corrected by the capillary
pressure, Pc.
Pl = P−Pc (2.2)
Capillary pressure may be higher than atmospheric pressure. The pressure in the liquid
phase is then negative and is better called tension in this case. Capillary pressure, Pc,
is a function of the temperature T and the liquid moisture content Ml:
Pc = 1.364 x 105*(128.0 – 0.185 T) x 10-3*(Ml + 1.2 x 10⁻⁴)-0.68 (Pa) (2.3)
Darcy’s law is used to model the flow of the liquid. However the gas and the liquid
compete for flowing inside the pores. The intrinsic permeabilities for the gas and for
the liquid (K) have to be modified by a relative permeability. The flow of liquid water
is expressed by:
(2.4) l
Prl
Kl
Kl
Q
l
l

41
The suffix l stands for liquid water. The intrinsic liquid permeability is assumed equal
to the permeability of wood to gases:
(2.5) K0
0KKK
zwood,
rwood,
woodl
With:
Kwood,r = 1.0 x 10⁻¹⁶ m2
Kwood,z = 1.0 x 10⁻¹⁴ m2
The relative liquid permeability is a function of the saturation S and is defined by:
(2.6) 8S0
03Srl
K
The saturation is the ratio quantity of liquid water to the maximum quantity of liquid
water that might be contained in the pores,
(2.7)
fspMsatM
fspM-M
S
(2.8) 11
Msat
wallwood
l
With, Mfsp being the Fibre Saturation Point (FSP). FSP is the moisture content
corresponding to the saturation of the cell wall by bound water. Above the Fibre
Saturation Point, water starts to fill the pores as liquid water. The FSP cannot be
measured exactly (Siau, 1995). It corresponds approximately to a moisture content of
30 percent at room temperature. The FSP is expressed in the model by:
Mfsp = (0.3 + 0.298) − 0.001 T (2.9)
The liquid moisture content Ml is then:
Ml = max (M − Mfsp, 0) (2.10)
Finally, the dynamic viscosity of liquid water is needed for Darcy’s law:

42
μl = 1.40 x 10⁻² − 7.30 x 10⁻⁵ T + 9.73 x 10⁻⁸ T2 kg m/s (2.11)
Darcy’s law for gases also has to be modified due to the presence of liquid water.
Similarly to the case of liquid water:
(2.12) PKK1
-v r
gg
mixt
Kg is the intrinsic gas permeability. Relative gas permeability is added:
(2.13)
S5-S410
0S3-2S1K
4
2
r
g
With, S the saturation as defined in Eq. (2.7).
The dynamic viscosity of water vapour has to be added when calculating the viscosity
of the mixture:
μv = −1.47 x 10⁻⁶ + 3.78 x 10⁻⁸ T kg.m/s (2.14)
Flow of bound water
The bulk and diffusive flows of bound water are important processes in low-
temperature drying and slow processes. Furthermore they are complex to model. The
effect of the bulk and diffusive flows on global drying rate is insignificant. Hence it is
safe to conclude that there is no reason to include the liquid bound flow in a model for
wood drying at high temperature such as pyrolysis process. Similar conclusions were
drawn by Di Blasi (1997) in one of her studies.
(vi) Heat Transfer in Drying Wood
Heat of evaporation and saturation pressure
Heat of vaporisation and saturation pressure of free water are assumed to be equal
to those of pure liquid water (Gronli, 1996).
(2.15) Pa)T
3545.46711201.24exp()T(Psat
l
Hl,vap = 3179 x 103 – 2500 T J/kg (2.16)

43
Bound water has a saturation pressure lower than that of liquid water because of the
hydrogen bonds with the fibres. The difference is modelled by adding a coefficient to
the saturation pressure of liquid water. The coefficient is a function of the moisture
content. It goes to zero when the moisture content decreases and to one when the
moisture content is near the FSP (Gronli, 1996).
(2.17) PaM
M-1-1xT)(P)M T,(P
T10x453.6
fsp
sat
b
sat
b
-3
The heat of evaporation of bound water is also higher since it requires breaking the
hydrogen bonds. It is defined by Gronli (1996) as the heat of evaporation of liquid
water plus a desorption term:
Hsorp = Hl,vap +Hsorp J/kg (2.18)
(2.19) J/kgM
M1H4.0H
2
fsp
bvapl,sorp
Energy conservation
The energy conservation equation for drying process must be re-written in order to
include the presence of water:
(2.20) HQHw-Hw-
.Q-TQcQcQcQc
cccc
sorpbvapv
i
ii
heatbbp,l
gas
p,lvvp,iip,
gas
bp,bp,llip,i
solid
ip,i
t
T
The specific heats of the three states of water are added to the Left Hand Side (LHS).
The flows of free, bound and vapour water are added to the convective term of the
Right Hand Side (RHS). The heat of vaporisation is included in the source term of the
RHS. The last term on the RHS corresponds to the transfer of energy by desorption-
adsorption during diffusion of bound water. Bound water must desorb before diffusion.
Energy is needed for this desorption. Bound water re-adsorbs after diffusion and the
heat of desorption is released. Hence there is a transfer of enthalpy due to the heat of

44
desorption during diffusion of bound water and it should be included in the energy-
conservation equation.
(v) Evaporation rate
The evaporation rate is the critical part of a drying model. Authors have used different
ways to model it during high-temperature drying. The models published in the
literature may be sorted into three different types: Heat sink model, first order kinetic
evaporation rate model and the equilibrium model. Here only the first order kinetic
evaporation rate model is briefly discussed due to its simplicity.
First order kinetic evaporation rate model
A first order kinetic equation has been proposed to model the evaporation rate (Chan
et al., 1985b, Bryden et al., 2002 and Peters et al., 2002). The pre-exponential factor
and the activation energy are calculated so that there is large increase in the drying rate
at 100°C. The water vapour pressure is not fixed by the saturation pressure and water
vapour is treated as an ordinary gas. The first order kinetic scheme does not describe
the condensation that might occur in the colder parts of the wood. The first order drying
rate is a model extremely easy to implement as it is sufficient to add water and its
vaporisation heat to the kinetic scheme.
2.3.5 Modelling Kinetics of Wood Pyrolysis
The chemistry and complication of the pyrolysis process which involves hundreds of
intermediates have paved the way for the development of numerous kinetic models in
the past. Pyrolysis modelling requires inputs from kinetic model in order to analyse
and solve heat transfer models of single particle and pyrolysis bed.
(i) Kinetic schemes of wood pyrolysis
Different models of kinetic schemes of wood pyrolysis have been developed and tested
over the years. The schemes are only described qualitatively. A comparison of the
predictions resulting from different models may be found in Di Blasi (1998b).
Schemes for wood constituents
Wood is mainly composed of cellulose (50 percent), hemicellulose (25 percent) and
lignin (25 percent). Schemes for wood constituents deal with these constituents
separately. These schemes usually come from TGA (Thermogravimetric Analysis)

45
experiments. As such, they deal only with primary reactions and leave out the
description of secondary reactions which are important when there is heat transfer
involved (Bellais, 2007).
Schemes for wood
Wood models are usually either based on a global decomposition of wood or a
decomposition of its constituents. Unlike cellulose, hemicellulose and lignin models,
wood pyrolysis models might be designed for large particles and include some
secondary reaction schemes. The most classical model for wood pyrolysis kinetically
models three competing reactions of wood to tar, wood to char, and wood to gases.
The secondary reactions are lumped with the primary reactions and the model features
a varying char yield (Bellais, 2007).
(ii) Reaction models
Generally, the wood kinetic reaction models are divided into three main groups
namely:
(i) Single-step global reaction model.
(ii) Single-step multiple parallel reactions model; and
(iii) Multi-step reactions model.
However the first two models are too simple to describe the complex wood degradation
processes.
Roughly, the kinetics of wood degradation processes can be well described by the
multi-step reactions model in two stages relating to primary reactions of virgin wood
decomposition and secondary reactions of the primary products (Broido and Nelson,
1975a and Di Blasi, 1997).
A general scheme of this multi-step reactions mechanism kinetic model is represented
here as used by Babu and Chaurasia (2003).
reactionsSecondary Products FinalProductsPrimary
reactionsPrimary ProductsPrimary Wood
2
1
k
k

46
The details of these reactions are
The model indicates that the biomass decomposes to volatiles and gases (reaction 1)
and char (reaction 2). The volatiles and gases may further react with char (reaction 3)
to produce different types of volatiles, gases, and char whose compositions can be
different. Therefore, the primary pyrolysis products participate in secondary
interactions (reaction 3), resulting in modified final product distribution. The pyrolysis
rate can therefore be simulated by two parallel primary reactions 1 and 2, and a third
secondary reaction 3 between the volatile and gaseous products and char.
The heat of reaction, also known as heat of pyrolysis, during devolatilisation is the
energy released from, or required to break the molecular bonds of the wood and is
important in modelling thermal effects during pyrolysis. For the large wood logs, it is
not practical to apply a positive or negative reaction enthalpy to the kinetic scheme
used. Researchers nevertheless seem to agree that the primary pyrolysis reactions are
endothermic for wood and its constituents (Gronli, 1996, Shafizadeh 1992,
Shafizadeh, 1992, Aldea et al., 1998, Capart et al., n.d.). The secondary charring
reactions are considered exothermic. This model is simple and accurate and is very
useful in the design of pyrolysis units.
(iii) Determination of Wood Kinetic Parameters
As the wood undergoes the pyrolysis process its total density (ρ) changes with time. A
continuum representation for decomposition considers the active wood with the char
in a fixed volume. Therefore the total wood density can conveniently be written as an
instantaneous mass conversion fraction (α) such that
22
c)(exothermi 3Reaction Secondary
3121
31
ic)(endotherm 2 ReactionPrimary
1
21
ic)(endotherm 1Reaction Primary
1
(Char)Gases)(Volatile n(Char)n Gases)(Volatile
decay)order(n(Char) decay)order(n BiomassVirgin
decay)order(nGases)(Volatiledecay)order(n BiomassVirgin

47
(2.21) ;wf
w
Thus, the remaining fractional wood density can be obtained as
(2.22)
fw
f-
-1
The value of α goes from zero to unity as the total wood density ρ goes from ρw, the
virgin wood density to ρf, the final density (i.e. char density). The rate of change of the
conversion factor can be expressed in a general differential equation form as
(2.23) ,Tkdt
d
f
Where f(α) is a reaction order function depending on the local conversion factor, and
k(T) is the rate constant which can be expressed as the Arrhenius rate equation:
(2.24) ,RT
E-expTk p
aa
Where ɑp is the pre-exponential factor, Eɑ is the activation energy, and R is the
universal gas constant.
The positive sign in Eq. (2.23) has the physical meaning as a production rate of α.
However, this production rate will be a destruction rate of the wood density (e.g. the
rate of change of ρ with respect to time is negative). A primary problem of determining
the rate of change of the conversion factor is how to obtain the f (α), ɑp and Eɑ.
Generally, there are two methods to determine ɑp and Eɑ.
(a) Differential method as considered by Flynn (1991).
(b) Integral methods as considered by Lyon (1997).
The differential method by Flynn gives
1mRE a (2.25)

48
Upon which the form of f (α), the pre-exponential factor, p, can be calculated such
that
(2.26) ,
αf
ea
1b
p
Where m1 and b1 are the slope and the ordinate intercept of the plot of ln[(d/dt)]
against 1/T() respectively.
The integral method by Lyon (1997) gives the activation energy at a particular
conversion factor αi as
(2.27) ,2TmR2T
T/1
ln-R)(E i2
i
i
d
da
Where m2 is a slope of the plot of ln β against 1/T (α).
The pre-exponential factor by Lyon, ɑp, is obtained as
(2.28)
RT
Eexp
RT
RT2EF
i
2
i
iip
aaa
Here ap depends on both the heating rate β, and the conversion factor αi (e.g. ap=ap(β,
αi)).
(iv) Application to wood pyrolysis
During wood pyrolysis process the virgin wood is heated and it pyrolyses to volatile
gas and residual char. Let ρa be the time-dependence of active wood density. Initially
its density is equal to the virgin wood ρw. As the decomposition process takes place,
the active wood gradually pyrolyses leaving only final char density, ρf. Thus at any
given time, t, the total density ρ could be written as
ρ (t) = (1 – Xc) ρa (t) + ρf (2.29)
Where Xc = ρf/ρw is the char fraction
Assuming the total wood density decomposes following a first-order Arrhenius
reaction rate, we can write the decomposition rate as

49
(2.30) RT/Eexp-k(T)dt
dp aaa a
The negative sign indicates that the total wood density decreases with time. From
definition of a in Eq. (2.21) we can write ρ in term of a as
ρa = (1 - a) ρw (2.31)
Upon differentiating and substitutions of the last equations with respect to time we
obtain
(2.32) dt
dX1
dt
dc
w
Substituting the definition d/dt from Eqn. (2.23)
(2.33) TkX1dt
dc
fw
Thus giving the form f() as
(2.34) X1
1
c
f
The expression of f() obtained above is a general form of a first order reaction
function. Integrating explicitly this expression gives the form of F() as
(2.35) 1
1lnX1F
0
c
Since 0 = 0, F() becomes
F() = (1-Xc) ln(1 - ) (2.36)
The expressions of f () and F() obtained above are based on the assumption that the
wood pyrolysis is a first-order Arrhenius reaction.
(v) Derivation of Activation Energy and Pre-exponential Factor
The activation energy Ea and the pre-exponential factor ap are determined based on
Eq. (2.25) and (2.26). This is done by plotting idtd /In against the reciprocal of

50
temperature, 1/T (i) for various degrees of i. for isothermal and non-isothermal TGA
processes.
The degree i of represents the percentage of char converting from the virgin wood.
A linear relation is obtained hence the slope of the straight lines represent –Eɑ/R and
the ordinate interceptions are In(f()ɑp). The Eɑ; and corresponding ɑp at different
degrees of i are then calculated from Eq. (2.25) and Eq. (.2.26). Table 2.1 presents
typical values.
Table 2.1: Summary of Eɑ; and ɑp at different degrees of i for (a) isothermal and (b)
non-isothermal based on Eq. (2.25) and (2.26) Isothermal (Xc = 0.2)
(a) Isothermal (Xc = 0.2)
i f(i) ɑp(s-1) Eɑ (kJ/mol)
0.25 0.9375 2.185 x 10⁴ 79
0.5 0.6250 3.837 x 10⁴ 84
0.75 0.3125 1.071 x 10³ 89
0.95 0.0625 5.167 x 10⁴ 87
(b) Non-isothermal (Xc = 0.2)
i f(i) ɑp(s-1) Eɑ (kJ/mol)
0.40 0.7500 3.575 x 10¹³ 194
0.80 0.2500 1.989 x 10¹³ 195
0.99 0.1250 2.244 x 10¹⁰ 209
Alternatively for non-isothermal data, we can estimate Eɑ; and ɑp based on Eq. (2.27)
and (2.28). A plot of Inβ against 1/T () for various i .can be done. From the slopes
of the linear lines, the Eɑ can be calculated from Eq. (2.27) and then ɑp from Eq. (2.28).
A summary of Eɑ; and ɑp is presented in Table 2.2.
Table 2.2: Summary of Eɑ; and ɑp at different degrees of i for non-isothermal based
on Eq. (2.27) and (2.28) (Xc = 0.2)
i f(i) ɑp(s-1) Eɑ (kJ/mol)
0.02 1.616 x 10⁻² 1.568 x 10⁴ 141
0.20 1.785 x 10⁻¹ 1.281 x 10⁷ 172
0.40 4.087 x 10⁻¹ 1.442 x 10⁸ 184
0.80 1.288 5.167 x 10⁸ 182
0.99 3.684 5.167 x 10¹⁰ 220

51
The Eɑ from isothermal is comparable to the value of 79.8 kJ/mol suggested by Kanury
(1972) while the Eɑ from non-isothermal is consistent with most of the other
literature’s values in Table 2.2.
(vi) Comparisons of Wood Kinetic Parameters
In a simulation of wood pyrolysis the wood kinetic parameters play an important role.
These parameters sometimes depend on kiln conditions, preparations of samples, types
of samples (e.g. wood species), as well as treatments of the kiln data. Consequently,
the kinetic parameters may vary from one particular kiln to another. A variety of
kinetic values are obtained as one searches through the literature; there is merit to
summarize them for comparison purposes.
The literature’s values for Ea, and ap summarized here are categorized mainly into two
groups:
(i) the values deduced from experimental studies; and
(ii) the estimated values that researchers employed to obtain best fit for their
overall wood degradation and combustion models.
In the first group in which Ea and ap are deduced from experiments, (Milosavljevic
and Suuberg, 1995 and Suuberg et al., 1994) conducted non-isothermal TGA, which
the samples were heating with a constant rate until they reached final pyrolysis
temperatures. They suggested that Ea and ap of wood depended on char yield, heating
rate, and a final pyrolysis temperature of interest.
Different values were obtained as slow or rapid heating rates were used. For low final
pyrolysis temperatures (<327 °C) with slow heating rate (6 ≈ β °C /min), they obtained
a relatively high Eɑ of 221 kJ/mol and a corresponding a of 1.13 x 10¹⁷s-1. For high
final pyrolysis temperature (>327 °C) with rapid heating rate (60 ≈ β °C /min), the Eɑ
would yield a value of 139 kJ/mol with ap of 9.1 x 10¹¹s-1.
Roberts (1970b) pointed out that with highly purified cellulose, the pyrolysis would
proceed with a high Eɑ of 235 kJ/mol when the pyrolysis was unaffected by
autocatalysis When autocatalytic effects took place, however, the pyrolysis would
yield a low Eɑ of 126 kJ/mol. Differences in sample size and heating rates were also
studied. A large sample with rapid heating rates would give a low Eɑ while a small
sample with slow heating rates yields a higher Ea.

52
Kanury (1972) employed a radiograph technique where a density changing of a
specimen was monitored continuously by a series of X-ray images. The sample was
heated with a constant heating rate until it reached a final pyrolysis temperature. With
a best linear fit to his data, he obtained Eɑ of 79.8 kJ/mol with p of 2.5 x 10 s.
Lewellen et al. (1976) deduced Eɑ and ɑp from the experimental data by assuming the
pyrolysis followed a single-step first order process. They suggested values of 140
kJ/mol for Eɑ and 6.79 x 10⁹ s-1 for ɑp.
Broido and Nelson (1975a) studied a decomposition process for a relatively large
cellulose sample (> 100 mg), and obtained an Eɑ of 74 kJ/mol. They proposed that the
cellulose pyrolysis could proceed with two different paths where the ratio of the rate
constant of these two paths remaining approximately constant. However, the Broido’s
pyrolysis mechanism was refuted by recent researchers (Antal, 1995 and Orfao, 1999)
due to the experimental conditions which were strongly in the heat transfer limit.
Fredlund (1988) obtained a relatively low value of Eɑ (26.3 kJ/mol). His kinetic values
differed greatly from those of other researches. The discrepancy may be due to the
technique employed in his experiment where the Frendlund samples were relatively
larger than others and hence the Frendlund Eɑ would fall into the range of heat and
mass transfer limit.
Regarding an initial sample mass/size and heating rate, we may point out that at high
heating rate (or large sample mass/size), the pyrolysis rate of cellulose would be
controlled by heat and mass transfer diffusion resulting in a low Eɑ. On the other hand,
at a low heating rate (or small sample mass/size), the pyrolysis rate is in a chemical
limit resulting into a high Eɑ.
Recently, single-step multiple independent parallel reactions accounting for the main
components of cellulosic materials have been proposed by researchers like Orfao
(1999) who assumed three independent parallel reactions to express decomposition
processes for a variety of wood species. Orfao (2001), and Wu and Dollimore (1998).
obtained Eɑ1 of 201 7 kJ/mol with ɑp1 of (1.14 0.4) x 1015 s-1 for pseudo-component
1, Eɑ2 of 88.4 kJ/mol with p of 5.27 x 10³ s-1 for pseudo-component 2, and Eɑ3 of
18.1 kJ/mol with ɑp3 of 1.57 x 10² s-1 for pseudo-component 3, where pseudo-

53
component 1, 2, and 3 are related to the primary decompositions of cellulose,
hemicelluloses, and lignin respectively.
Gronli et al. (2002) studied degradation processes of various species of hard and soft
woods. They found that with three parallel first-order reactions for the main three
components and two extractive reactions of wood, the simulation model could describe
the degradation processes of hard and soft woods with good accuracy. They suggested
a set for Eɑ of 100, 236, and 46 kJ/mol for the main components (hemicelluloses,
cellulose, and lignin respectively), and 105 and 127 for the two extractive components.
Wu and Dollimore (1998) assumed two parallel fist-order reactions to simulate a
kinetic degradation of red oak. With Eɑ1 of 220 kJ/mol and Eɑ2 of 240 kJ/mol, good
agreement between the simulation and the eexperiment was obtained. The above Ea
and p were derived based on a first-order reaction model; however, it is possible to
model the kinetic pyrolysis with other reaction order.
For example, Kashiwagi and Nambu (1992) employed a non-isothermal TGA
technique (heating rate ranging from 0.5 to 1 °C /min to determine the kinetic constants
of a thin cellulosic paper) They found that the simulated pyrolysis rates agreed well
with the experiments when the reaction order was assumed to be 1.8. They obtained
Eɑ of 220 kJ/mol with ɑp of 2 x 10¹⁷ s-1 for the degradation processes in a nitrogen
atmosphere, and Eɑ of 160 kJ/mol with p of 2 x 10¹²
s-1 for the degradation processes
in air. In the second group of Ea and p results in which the investigators assumed
values to obtain the best fit for their modelling predictions of thick decomposing wood
samples,
Kung (1972) used the values for Eɑ of 139 kJ/mol with ɑp of 5.3 x 10⁸s-1. Tinney (1964)
when computing weight loss of heated wooden dowels; found that it was necessary to
introduce a break point into the computations to obtain good agreement with the
experimental weight loss values. He suggested that for the first stage of computation,
(ρ/ρw < 0.33 ~0.5), the Ea would be 124 kJ/mol with ɑp of 6 x 10⁷ ~ 7.5 x 10⁸ s-1. For
the final stage of the decomposition (ρ/ρw > 0.33 ~0.5) the Eɑ would be 150 ~ 180
kJ/mol with ɑp of 4 x 10⁸ ~ 2 x 10⁹ s-1. Other estimated literature’s values of Eɑ and ɑp
are summarized in Appendix C.

54
(vii) Heat of Wood Pyrolysis
It is worthwhile to summarize the values for the heat of pyrolysis of wood (QP), from
literature. The heat of pyrolysis is the energy released from, or required to break the
molecular bonds of the wood. Among the literature’s values, there is great confusion
in terms of Qp as endothermic or exothermic, as well as its magnitude.
Suuberg et al. (1994) reported that as the wood pyrolysis proceeds, a number of
exothermic and endothermic processes are involved; however, the overall pyrolysis
process is endothermic. He suggested that the endothermic heat of pyrolysis was in the
range of 70-400 kJ/kg depending on the char yield.
In contrast, Roberts (1970a) argued that the bulk pyrolysis process of wood should be
exothermic due to the wood lignin content. He suggested that the wood decomposes to
yield cellulosic material and lignin.The lignin would further decompose to give volatiles
and residual solid, and thus this process is exothermic which controls the overall heat
of pyrolysis of wood. He calculated the exothermic heat of pyrolysis of wood as 192
kJ/kg.
Recently study on the heat of wood pyrolysis was carried out by Rath et al. (2003)
where they employed TGA and DSC (Differential Scanning Calorimeter) techniques
with a heating rate of 10 °C /min to two species of woods (beech and spruce). They
found that as the wood underwent the primary reaction (200 to 390 °C), the heat of
pyrolysis was endothermic; however, as the secondary reaction took place (from 390
to 500 °C), the heat of pyrolysis shifted to be exothermic. The primary reaction
reflected the degradation process of virgin wood to primary char, while the secondary
reaction was the further reaction of the primary char. The overall heat of pyrolysis was
the sum of the heat of pyrolysis from the primary and secondary reactions. Depending
on wood species, they calculated the overall heat of pyrolysis of beech as 122 kJ/kg
(endothermic) and spruce as 289 kJ/kg (endothermic).
In dealing with the uncertainty whether wood pyrolysis is exothermic or endothermic
process, Atreya (1998) suggested that the energy due to the pyrolysis term was small
compared to other terms in the transport energy equation of the wood pyrolysis process
and shall be neglected for simplicity. This assumption was also assumed by various

55
investigators like Parker (1985) and Fredlund (1988). A summary of literature on the
heat of pyrolysis of wood is presented in Appendix C.
2.3.6 The solid phase modelling
As wood is subjected to a heat flux, it undergoes decomposition. The wood
decomposes generating fuel gases flowing to the surrounding while leaving a residual
char matrix over the virgin wood. When the heat flux to the wood surface is low the
critical condition of the combustible mixture (e.g. suitable fuel/air concentration and
sufficient gas temperature) cannot be attained therefore the whole virgin wood is
converted to charcoal (Boonmee and Quintiere, 2002a).
The char layer behaves like a thermal insulator by blocking heat transfer to the virgin
wood; hence, a high surface temperature of the char layer is observed. To prevent this
high temperature of the char layer from igniting the char, the wood can be covered
with some insulating material to keep out the oxygen laden air. In the case of charcoal
production, the insulating material can range from concrete, blocks, bricks, earth layer
or soil covering as shown in Figure 2.2.
Figure 2.2: Heat and mass transfer in a pyrolysing piece of wood
(i) Theoretical Model
It is important to have a theoretical model for solid phase wood decomposition for the
physical and chemical processes accounting for heat and mass transfer in the solid

56
matrix. Nathasak (2004) developed such a model after Kung (1972) but imposed some
assumptions to simplify it.
(ii) Decomposition of Wood System
The wood system is considered as a continuum volume. At any time, the wood system
is composed of virgin wood, char, and volatiles. The decomposition of the virgin wood
can be described by the main three components of wood as cellulose (j = 1),
hemicellulose (j = 2), and lignin (j = 3). The decomposition of each of these component
is:
.3, VolatilesChar Lignin
;2, VolatilesCharoseHemicellul
;1, VolatilesChar Cellulose
3
2
1
k
k
k
j
j
j
Assuming each component of wood decomposes following a single-step first order
Arrhenius reaction rate.
The decomposition rate of the jth component can be described as:
(2.37) 3. 2, ,1jfor ; RT/E-expat
j,aj,pj,a
j
Where ρj is the total density of the jth component, ρɑ,j is the active density of jth
component, Eɑ,j. and ɑp,j are the activation energy and pre-exponential factor of the jth
component respectively.
It is convenient to represent the total density of the jth
component, ρj, in term of the
active density, ρaj. Initially the active density is equal to the virgin wood density, ρwj.
As the decomposition process takes place, the active density gradually pyrolyses to
zero, leaving only the final char density ρfj. Thus, at any instant, the total density of the
jth component, ρj, is expressed as
ρj = (1 – Xc,j)ρa,j + ρf,j (2.38)

57
Where Xc,j = ρf,j/ρw is the char mass fraction and ρf,j is the final char density of the jth
component. Combining Eq. (2.37) and (2.38), the jth component decomposition
becomes
(2.39) RT/E-expX1
j,
jc,
,
, a
jfj
jp
ja
t
The overall decomposition rate is the sum of each component; thus
(2.40) X3
1j
jtt
j
Where, Xj is the mass fraction of the jth component in the continuum volume of wood.
(iii) Species Conservation
The continuum volume of wood is composed of three species: active wood, char, and
volatiles;
(2.41) 0 gca
species volatile theis and species,density char total theis X where
density active total theis X density, wood total theis X where
g
3
1j
c,j
3
1j
,ja
3
1j
j
j
jaj
The volatile species is small and can be assumed negligible. The rate of change of the
total density in the continuum is
(2.42) tttt
gca
The effect of ignoring the gas density might be considered here. From the equation of
state, the gas density within the solid matrix may be estimated as ρg = P/RTg, where P
is the pressure inside the solid matrix taken as a constant. Thus
(2.43) t
T
Tt
T
T
1
R
P g
g
gg
2
g
t
g

58
Which is generally small (because ρg ≈ 0). The rate of change of the total density
becomes
(2.44) ttt
ca
Differentiating Eq. (2.38) with respect to time and substituting into Eq. (2.40) we can
also write the rate of change of the total density as
(2.45) X1 ctt
a
Where Xc = Xc,j is the char mass fraction which is constant for all wood components
cellulose, hemicellulose, lignin).
Rearranging Eq. (2.44), and (2.45) we obtain the rate of change of the total active and
char density as
(2.46)
t
X-1
1 X
c
,3
1j
j
tt
jaa
and
(2.47)
t
X-1
X X
c
c,3
1j
jc
tt
jc
The summation is made over the main three components of the active wood (cellulose,
hemicellulose, and lignin).
(iii) Mass Conservation
A one-dimensional mass conservation is
(2.48) 0
x
v
x
v
x
v
t
ggccaa
Since va = vc = 0, the active wood and char do not flow, and "
ggg mv the pyrolysis
mass flux of the volatiles (the negative sign indicates the pyrolysis mass flux flows out
in the negative x-direction). The mass conservation becomes

59
(2.49)
t
"
x
mg
(iv) Energy Conservation
A one-dimension energy conservation of the solid matrix is
(2.50)
t
h h h "gcca
x
qhvhvhv
xgggcccaaa
ga
Where jaja
j
aa hh , ,
3
1
j X
is the total enthalpy of the active wood (sum over
cellulose, hemicellulose and lignin), jcjc
j
c hh , ,
3
1
jc X
is the total enthalpy of char,
and ρghg is the total enthalpy of the volatiles. The subscript “a” is for active wood, “c”
is for char, and “g” is for volatiles. The "q is the heat conduction within the solid
matrix, which can be written as xT/ k .
Recalling that there is no flow for the active wood and char species; thus va = vc = 0,
and "
ggg mv , we can rewrite the energy equation as
(2.51)
x
T
t
h h h "gcca
k
xhm
xgg
ga
The total enthalpy is composed of the sensible enthalpy (hs,j) and the enthalpy of
formation (h°f,j). Replacing the total enthalpy with its definition, the energy equation
becomes
(2.52)
T
0
,
"
,
"
00
,
0
,
0
,0
,,,
xk
xhm
xhm
x
t
hhh
t
hhh
gfggSg
gfgcfcafagSgcScaSa
The rate of change of the gas total enthalpy can be neglected for the following reason
The gas sensible enthalpy term (dhs,g = CpgdT):

60
(2.53) 0
PC
RPC
T C
p,gp,g
g
p,g
,
tttt
h ggSg
Where R is the universal gas constant, P is the pressure within the solid matrix. In this
consideration, the pressure is constant. In general, the pressure could be allowed to
change as determined by the porosity of the system. This would require incorporation
of Darcy’s law which only add more complexity. This study incorporates the porosity
of the system of stack of wood logs in a kiln and this can cause the pressure to change.
This is dealt with in Chapter 4 of this work.
(v) Temperature Dependence Thermal Properties of Wood
Assuming the thermal properties of cellulose, hemicellulose, and lignin are the same
as the active wood, the temperature dependence thermal properties of active wood,
char, and volatiles are taken from (Ritchie, 1997) as:
Specific heat capacity
Active wood: Cp,a = 10 + 3.7 T (J/kg K)
Solid char: Cp,c = 1430 + 0.355 T – 0.732 T4 (J/kg K)
Volatiles Cp,g = 66.87 T1/2 – 136 (J/kg K)
Thermal conductivity
Active wood: ka = 3.054 x 10⁻⁴ T + 0.0362 (W/m K)
Solid char: kc = 9.46 x 10⁻⁵ T + 0.0488 (W/m K)
(vi) Boundary Conditions
The boundary conditions for mass and energy equations are described as follows:
Mass: No mass transfers at the back boundary (i.e. x = L), and the total pyrolysis mass
flux is equal to the mass flux at the surface (i.e. x = 0), the mathematical expression
for mass boundary conditions are
at x = L, "
gm (L) = 0,
at x = 0, "
gm (0) = "
,sgm
The mass flux for any given position can be determined by integrating Eq. (2.49) from
the back boundary to that location, i.e.

61
(2.54) ,)(" dxt
xm
x
L
g
Energy: At the back surface, the wood is insulated; thus an adiabatic boundary is
employed, i.e.
at x = L, .0
x
T
2.3.7 The gas phase modelling
As the fuel volatiles emanate from the pyrolysed wood, they mix with air from the
surrounding creating a boundary layer of combustible mixtures. At the same time the
boundary layer adjacent to the solid wood surface is heated by heat conduction from
the solid wood. As a result of the heating, the gas temperature in the boundary layer
rapidly increases together with the heat release rate. If the combustible mixture reaches
a critical condition, a thermal runaway can be accomplished and auto ignition can
occur without any help of a local heat source. In charcoal production this condition is
prevented by the lack of air in the chamber.
A theoretical model accounting for physical and chemical processes in the gas phase
described above has been developed by Nathasak (2004). In such a model, the gas
phase transport model is coupled with the wood pyrolysis model as developed in
Section 2.3.6 via the solid-gas interface surface.
(i) Theoretical Model
The problem considered here is illustrated in Fig. 2.3. The computational domain is
divided into solid phase and gas phase domains. In the solid phase domain, the problem
is formulated as one-dimensional heat conduction in the direction perpendicular to the
solid-gas interface surface (i.e. x-direction). The solid phase domain is subdivided into
wood and insulator portions. In the wood portion, the wood pyrolysis model described
earlier is used to solve for the wood surface temperature and pyrolysis mass flux. In
the insulator portion, the surface temperature is calculated from a transient heat
conduction equation.

62
In the gas phase domain, the gas phase transport equations for momentum, energy,
and species, are formulated as a two-dimensional transient boundary layer
approximation.
Figure 2.3: Systematic diagram for gas phase boundary layer model
Again here some assumptions were imposed in order to simplify the gas phase model. One
–dimension is assumed in the solid-gas phase while two-dimension is assumed in the gas
phase.
(ii) Governing Equations and Boundary Conditions
The governing equations for compressible transient gas phase transport equations
without reaction terms in the boundary layer are:
Conservation of mass
(2.55) 0
y
v
x
u
t
ggg
Conservation of momentum for x-direction (cross-stream)
(2.56) 0P
x
Conservation of momentum for y-direction (streamwise):
(2.57) vv
, gx
v
xyv
xu
t
vgggg

63
Conservation of energy:
(2.58) ,
x
Tk
xy
Tv
x
Tu
t
TC
g
g
ggg
gpg
Conservation of species:
(2.59) ,for , OFix
YD
xy
Yv
x
Yu
t
YC i
ggiii
gpg
Yin = 1 - ƩYi
The gas coordinate system is set as shown in Figure 2.3. The solid-gas interface surface
is essentially the y-axis. The stream wise direction is the y-direction and the cross-
stream direction is the x-direction. The subscript “g” refers to gas. The stream wise
velocity component is v and the cross-stream velocity component is u. P is the pressure,
Tg is gas temperature, and Yi is the mass fraction of species i (F, fuel; O, oxygen; In,
inert gas). μg is the gas kinematics viscosity, kg is the gas thermal conductivity, and Dg is
the gas mass diffusivity. g is the gravity (9.81 m/s2).
The x-momentum equation suggests that the pressure is constant across the boundary;
thus the pressure variation is only due to the hydrostatic pressure (e.g. P = ρg g (yref –
y), yref is the reference level. The hydrostatic pressure combined with the body force
is written in the last term on the Right Hand Side of the y-momentum equation.
The gas density is evaluated from the equation of state:
(2.60) T M
RP g
air
g
Where R is the universal gas constant (8.314 kJ/kmol.k), Mair is the molecular weight
of air (28.97 kg/kmol).
The boundary conditions are
At the inlet (y = 0):
u = 0, v = Vin
Tg = Tg, ∞

64
YF = 0, Yo = Yo, ∞
At the outlet (y = yout
):
(2.61) 0T
y
Y
y
Y
yy
v
y
u oFg
At the solid-gas interface, the coupled conditions (x=0):
Insulator portions
u = v = 0,
Tg = Ts
0
x
Y
x
Y OF
Wood portion
0 v,,
"
sg
netS
muu
Tg = Ts
OF,ifor "
,,,,
Si
S
igSgSiSSg m
x
YDYu
At the side wall (x = xside):
0T
xx
v
x
u g
YF = 0, Yo =Yo, ∞
Where Vin is the vertical inlet velocity, Tg is the ambient temperature (298 K), Yo,∞ is
the ambient oxygen mass fraction (0.233), us is the blowing velocity, "
netm is the net
pyrolysis mass flux ( "
fm + "
cm ) is the generation rate of fuel (i=f), or the destruction rate
of oxygen (i=0), and Ts is the solid surface temperature.

65
The coupled conditions in the wood portion are determined from solving the one-
dimensional wood pyrolysis model. The boundary condition for wood pyrolysis model
account for the heat conduction from the gas adjacent to the interface surface as:
(2.62) TT TT
H 4
ref
4
S
g
C
""
gas
g
Solid
scix
kx
kmq
Where the subscripts, “solid” indicate the temperature gradient evaluated on the solid
phase side, “gas” indicate the temperature gradient evaluated on the gas phase side.
In the insulator portions, the surface temperature is calculated from one-dimensional
transient heat conduction:
(2.63) TT
2
2
xtin
Subjected to the boundary conditions:
Solid-gas interface:
(2.64) TT TT 4
ref
4
S
g"
gas
g
Solid
inix
kx
kq
Back surface
(2.65) 0T
Solidx
Where kin is the insulator thermal conductivity and αin is the insulator thermal
diffusivity. The thermal properties of the insulator are taken from the insulator
manufacture (Kaowool® Board type M).
(iii) Coupled Procedure for Solid and Gas Phase Calculations
To couple between the gas phase and solid phase models, a numerical procedure is
performed. The solid phase governing equations variables are solved for a given heat
flux and also computed are the pyrolysis mass flux and the surface temperature to be
used in the solid-gas interface boundary conditions for the gas phase equations.

66
Then the gas phase governing equations (momentum, energy, and species) are solved
with the boundary conditions that use the previous values of the pyrolysis mass flux
and the solid surface temperature. This step allows a new distribution of the heat flux
feedback to the solid surface to be computed and then used as a boundary condition in
the solution of solid phase equations at the next time-step.
A detailed kinetic modelling of gas phase reaction might be impossible due to the lack
of knowledge for the compositions of the combustible mixtures as well as uncertainties
of their kinetics mechanisms. However, the problem can be alleviated by considering
a simplified global kinetic reaction that can reproduce experimental data over a wide
range.
2.3.8 Radiation modelling in Pyrolysis
Radiation is one of the four main phenomena requiring CFD "models.”. Turbulence,
chemical reaction, and multi-phase flow are the other three. Radiation, which presents
greater practical difficulties, has been a less popular subject for research. As a
consequence, inability to model radiation properly is often the main cause of
inaccuracy in CFD predictions. This is understandably true of high-temperature
processes, such as those taking place in the combustion chambers of engines and
furnaces like a charcoal kiln; but it is no less true of lower-temperature ones.
Radiative heat transfer is described mathematically with exactness. There are several
available equation-solving methods. When applied to problems of more than modest
size, like the charcoal kiln, these methods require very much more computer time and
elapsed time than anyone can afford; and this is so even with neglect of the influences
of: wave-length on absorption and emission, angle on the reflectivity of surfaces,
temperature on the radiative properties of materials, the chemical composition and
"surface finish" of those materials, and the complicating presence of turbulent
fluctuations of temperature and of multi-phase flow.
Heat radiation depends on the temperatures at all surrounding points, no matter how
far away they are. Where much radiation-absorbing material intervenes, e.g. within the
charcoal kiln, where char and finely-divided particles absorb, scatter and re-emit
radiation, then radiative transfer can be regarded as similar to conduction, but with an
increased thermal conductivity.

67
The magnitude of the "radiative conductivity" is of the order of:
(2.66)
4
s
Tkr
Where, = Stefan-Boltzmann Constant = 5.6678 x 10⁻⁸ W/(m2 K4)
T = absolute temperature, K
= absorption coefficient, m-1
s = scattering coefficient, m-1
The mathematical viewpoint
Because the mathematical expression for the radiative heat transfer to a point involves
adding up (i.e. integrating) the contributions from an infinite number of nearer and
more-remote locations, the equation describing the equation is called "integral-
differential".
This contrasts with the more modest "differential-equation" label which is used for the
conduction and convection processes. Differential equations are much easier to solve
than integral- differential ones. For this reason, nearly all practical simulations of
radiative heat transfer in CFD codes employ differential-equation approximations for
radiation.
The approximations differ mainly in their formulations of the radiative conductivity.
Other difficulties arise. The problem of simulating radiation mathematically is
complicated further by the need to account for the facts that:
(i) rays of radiation passing through any point differ in angle, corresponding with
their differing locations of origin;
(ii) the rays differ also in wave-length (i.e. "colour"); and
(iii) both angle and wave-length influence rays interactions with the materials on
which they impinge.
The task of accounting correctly for these facts is so large that they are either totally
neglected or greatly simplified. The simplifications usually involve coarsely
discretising the variations with wave-length and/or angle.

68
2.4 Technologies for Wood Pyrolysis
2.4.1 Basic Types of Charcoal-Making Systems
Generally, biomass-to-energy conversion technologies deal with a feedstock which is
highly variable in mass, energy density, size, moisture content, and intermittent supply.
Therefore, modern industrial technologies are often hybrid fossil-fuel/biomass
technologies which use the fossil fuel for drying, preheating and maintaining fuel
supply when the biomass supply is interrupted. There are several basic biomass
conversion technologies, which include Appendix D.
The biomass conversion technology path for charcoal making process is the
Thermochemical conversion path through pyrolysis. There are three basic types of
charcoal-making systems (Woods and Hall, 1994) as shown in Figures 2.4 – 2.6.
(i) Internally heated charcoal kilns are the most common form of charcoal kilns,
Figure 2.4. They are internally heated by controlled combustion of the raw
material. It is estimated that 10 to 20 percent of the wood (by weight) is combusted;
a further 60 percent (by weight) is lost through the conversion to, and release of,
gases to the atmosphere from these kilns (Emrich, 1985).
Figure 2.4: Internally heated charcoal kilns
(ii) Externally heated kilns neither allow oxygen nor rather air to be completely
excluded, and thus provide better quality charcoal on a larger scale, Figure 2.5.
They do, however, require the use of an external fuel source, which may be
provided from the "producer gas" once pyrolysis is initiated or from fuelwood or
fossil fuels (Emrich, 1985).

69
Figure 2.5: Externally heated charcoal kilns
(iii) Recirculating heated gas systems offer the potential to generate large quantities
of charcoal and associated by-products, Figure 2.6. Hot circulating gas (retort or
converter gas) is used for the production of chemicals. But they are presently
limited by high investment costs for large scale plant (Emrich, 1985).
Figure 2.6: Recirculating heated gas systems charcoal kiln
In general carbonising systems can be classified in terms of material make-up,
portability and source of heat for heating and drying the wood, Appendix E.
Appendix F shows some of the common kiln types for carbonising wood, while
Appendix G shows a modern wood carbonising retort, the Lambiotte.
2.4.2 Technologies for Biomass Pyrolysis
Various technologies exists for biomass pyrolysis (Cedric, n.d.).
(i) Fixed beds: They are used for the traditional production of charcoal. They are
poor, and the slow heat transfer results into very low liquid yields (Figure 2.7).

70
Figure 2.7: Fixed bed reactor concept for biomass pyrolysis (Cedric, n.d.)
(ii) Augers: Hot sand and biomass particles are fed at one end of a screw which
mixes and conveys them along (Figure 2.8). It has good control of biomass
residence time and no dilution of pyrolysis products with the carrier or
fluidizing gas. However, sand must be reheated in a separate vessel, and
mechanical reliability is a problem. There is no large-scale commercial
implementation of the auger pyroliser.
Figure 2.8: Auger/Screw pyrolysis reactor concept using heat carrier (Cedric, n.d.)
(iii) Ablative Process: Biomass particles are moved at high speed against a hot
metal surface (Figure 2.9). Ablation of any char forming at a particle's surface
maintains a high rate of heat transfer. This is achieved by using a metal surface
spinning at high speed within a bed of biomass particles, which may present
mechanical reliability problems but prevents any dilution of the products.

71
Alternatively, the particles may be suspended in a carrier gas and introduced at
high speed through a cyclone whose wall is heated; the products are diluted
with the carrier gas. The problem with all ablative processes is that scale-up is
made difficult since the ratio of the wall surface to the reactor volume decreases
as the reactor size is increased. There is no large-scale commercial
implementation the ablative process.
Figure 2.9: Ablative biomass pyrolysis reactor concept (Cedric, n.d.)
(iv) Rotating cone: Pre-heated hot sand and biomass particles are introduced into
a rotating cone (Figure 2.10). Due to the rotation of the cone, the mixture of
sand and biomass is transported across the cone surface by centrifugal force.
The process is offered by BTG-BTL, a subsidiary from BTG Biomass
Technology Group B.V. in The Netherlands. Like other shallow transported-
bed reactors relatively fine particles (several mm) are required to obtain a liquid
yield of around 70 wt.%. Larger-scale commercial implementation (up to 5 t/h
input) is underway.

72
Figure 2.10: Rotating cone reactor (Cedric, n.d.)
(v) Fluidized beds: Biomass particles are introduced into a bed of hot sand
fluidized by a gas, which is usually a recirculated product gas (Figure 2.11).
High heat transfer rates from fluidized sand result in rapid heating of biomass
particles. There is some ablation by attrition with the sand particles, but it is
not as effective as in the ablative processes. Heat is usually provided by heat
exchanger tubes through which hot combustion gas flows. There is some
dilution of the products, which makes it more difficult to condense and then
remove the bio-oil mist from the gas exiting the condensers. This process has
been scaled up by companies such as Dynamotive and Agri-Therm. The main
challenges are in improving the quality and consistency of the bio-oil.

73
Figure 2.11: Generalized diagram for fluidized bed reactors for biomass pyrolysis
(Cedric, n.d.)
(vi) Circulating fluidized beds: Biomass particles are introduced into a circulating
fluidized bed of hot sand (Figure 2.12). Gas, sand, and biomass particles move
together, with the transport gas usually being a recirculated product gas,
although it may also be a combustion gas. High heat transfer rates from sand
ensure rapid heating of biomass particles and ablation stronger than with
regular fluidized beds. A fast separator separates the product gases and vapors
from the sand and char particles. The sand particles are reheated in a fluidized
burner vessel and recycled to the reactor. Although this process can be easily
scaled up, it is rather complex and the products are much diluted, which greatly
complicates the recovery of the liquid products.
Figure 2. 12: Schematic recirculating fluidized bed pyroliser (Cedric, n.d.)

74
(vii) Chain Grate: Dry biomass is fed onto a hot (500C) heavy cast metal grate or
apron which forms a continuous loop. A small amount of air aids in heat
transfer and in primary reactions for drying and carbonization. Volatile
products are combusted for process and boiler heating.
(viii) Vacuum pyrolysis: Figure 13 illustrates vacuum pyrolysis system. The
organic material is heated in a vacuum in order to decrease its boiling point and
avoid adverse chemical reactions. It is used in organic-chemistry as a synthetic
tool. In flash vacuum thermolysis or FVT, the residence time of the substrate
at the working temperature is limited as much as possible, again in order to
minimize secondary reactions. Thus, a synthesis of 2-Furonitrile has been
described employing the dehydration of 2-furoic acid amide or oxime via flash
vacuum pyrolysis over molecular sieves in the gas phase (Jacqueline, 2007).
Figure 2.13: Vacuum pyrolysis reactor (Cedric, n.d.)
2.4.3 Carbonization Processes in Charcoal Making
Carbonisation is a particular form of that process in chemical technology called
pyrolysis that is the breakdown of complex substances into simpler ones by heating. It
is a term used when complex carbonaceous substances like wood or agricultural
residues are broken down by heating into elemental carbon and chemical compounds
which may also contain some carbon in their chemical structure. The carbonisation
process is shown in Table 2.3.

75
Table 2.3: Simplified summary of wood carbonization in an earth kiln
Carbonisation
Stage
Smoke
Type
Kiln
Temperature Kiln Activity
Kiln
Product
Kiln
Management
Combustion White and
dense
Ambient-500
°C
500-100 °C
Burning of
wood/kindling
matter
-
Close ignition
point after fire
established
Dehydration
White,
thick and
moist
100-300 °C Wood dries - -
Exothermic
reaction
Yellow,
hot and
oily
100-300 °C
300-700 °C
Wood breaks
down; wood
partially
burns; heat
production
Charcoal,
water,
vapour,
acetic acid,
methanol,
complex
chemicals
Controlled air
admission
through vents
in kiln, kiln
repair, may
need external
air provision
Cooling - 700-100 °C
100 °C- lower
Inside kiln
Outside kiln -
Charcoal
removed
Source: Manual for Charcoal Production in Earth Kilns in Zambia by S. H. Hibajene O. S. Kalumiana Department
of Energy Ministry of Energy and Water Development, 2003).

76
Typical illustration of the wood carbonisation processes are shown in Figure 2.14.
Fig
ure
2.1
4:
Car
bonis
atio
n P
roce
ss:
(a)
Com
bust
ion (
b)
Deh
yd
rati
on
(c)
Ex
oth
erm
ic (
d)
Cooli
ng
(b)
(d)
(a)
(c)

77
The carbonisation process is the most important step in charcoal production even
though it is not an expensive one. Unless it is carried out as efficiently as possible, it
puts the whole operation of charcoal production at risk. Low yields in carbonisation
reflect back through the whole chain of production in terms of high production costs
and waste of resources. Poor kiln design produces ashes while leaving other parts of
the charge only partly carbonised (brands) (Jacqueline and Philipe, n.d.).
2.4.4 Products of Carbonization and Environmental Concerns
There are five types of products/by-products from charcoal production operations:
(i) charcoal, mainly composed of carbon and other components in small
amounts,
(ii) noncondensible gases, i.e. volatiles (carbon monoxide [CO], carbon
dioxide [CO2], methane [CH4], and ethane [C2H6]),
(iii) pyroacids (primarily acetic acid and methanol),
(iv) tars and heavy oils (non volatiles)
(v) water and its vapour
With the exception of charcoal, all of these materials are emitted with the kiln exhaust.
Product constituents and their distribution vary depending on raw materials and
carbonization parameters. Organics and CO are naturally combusted to CO2 and water,
H2O, before leaving the kiln. Emission levels are quite variable because the extent of
this combustion varies from kiln to kiln.
Since carbonisation produces substances which can prove harmful, precautions should
be taken to reduce risks. During the last two decades environmental control legislation
has become an important factor for charcoal makers especially in developed countries.
Therefore, these aspects should be taken into consideration by the potential charcoal
maker when the charcoal plant is designed (FAO, 1987).
However earth kilns, as distinct from retorts and other sophisticated systems, do not
normally produce liquid effluent - the by-products are mostly dispersed into the
atmosphere as vapours. In these cases then, precautions against airborne
contamination of the environment are of greater importance (FAO, 1987).

78
2.4.5 Recovery of By-Products from Wood Carbonization
Recovery of chemicals from the vapours given off when hardwood is converted to
charcoal was once a flourishing industry. However, as soon as petrochemicals
appeared on the scene, wood as a source of methanol, acetic acid, speciality tars and
preservatives became uneconomic. Wherever charcoal is made there are possibilities
of recovering tars and using the wood gas as fuel to assist in making the carbonization
process more efficient. The economics, however, appear to be rather marginal but,
since recovery of by-products does reduce atmospheric pollution from wood
carbonization, the combined benefit makes it worthwhile having a close look at the
possibilities in this direction (FAO, 1987).
In the common practice of charcoal making, internal heating of the charged wood is
by burning a part of it and all the by-product vapours and gas escape into the
atmosphere as smoke. The by-products of charcoal making can be recovered and
burned to provide heat. The wood gas is only useable as fuel and consists typically of
17 percent methane; two percent hydrogen; 23 percent carbon monoxide; 38 percent
carbon dioxide; two percent oxygen and 18 percent nitrogen. It has a gas calorific value
of about 10.8 MJ per m³ i.e. about one third the value of natural gas.
Pyroligneous acid is the name of the crude condensate consisting mainly of water. It
is a highly polluting noxious corrosive liquid which must be either worked on properly
to produce by-products for sale, or burned with the help of other fuel such as wood or
wood gas to dispose of it.
The non-water component consists of wood tars, water soluble and insoluble, acetic
acid, methanol, acetone and other complex chemicals in small amounts.
To recover saleable by-products from the pyroligneous acid a refinery somewhat
similar to a small oil refinery but built of stainless steel or copper is required. The cost
would nowadays be of the order of US$ 5-10 million but it is rather difficult to give a
precise figure since such a refinery must be specially designed and built. They are not
available as a stock item. The recovery, for sale, of some of the tars produced in
carbonization is possible on a small scale and is now being carried out by some
producers of charcoal (FAO, 1987).

79
Nevertheless, the developing world can have markets for wood tar as a wood
preserving paint, caulking compound and as an antiseptic. Though tar can be used as
a road binder the small and sporadic amounts available and the low price and high
quantities of road tar produced by the bitumen industry make wood tar unattractive.
The price of wood tar at the point of charcoal production should be somewhat higher
than road tar. Tar can be burned as a fuel but it is generally more reasonable to use
wood wherever possible and collecting tar merely to burn it is hardly worth the effort
required. Wood tar is more valuable for other uses. The amount of wood tar which can
be collected in practice is not large. In practice about 25-35 kg of wood tar can be
collected from each ton of air dry wood. It is difficult to set a value but about $ 0.5 per
kg is a reasonable assumption (FAO, 1987).
2.5 Mechanisms of Charcoal Making
2.5.1 Choices of Carbonization Systems
Throughout the world, wood is turned into charcoal by a surprising variety of systems.
Choosing the optimum carbonization method is of interest to every potential charcoal
producer. To use the established method which is known to work successfully in a
locality is the logical option for those who cannot afford to take risks because of their
precarious economic situation. Where social factors are dominant, it is usually very
difficult to introduce a new technology of charcoal-making unless the social factors
are changed. Frequently one sees attempts to modify the technology of charcoal-
making by providing aid: inputs such as chain saws, new kilns and so on. When these
inputs are no longer available, economic necessities force the charcoal producers to
revert to the traditional, “successful” method with all its obvious technical faults.
Therefore, carbonising methods cannot be evaluated just on the basis of technical
factors; social factors are of equal importance (FAO, 1987).
In practice, as far as the developing world is concerned, the choices are limited to
deciding amongst earth-mound kilns, earth-pit kilns, brick kilns and steel kilns, which
are all internally heated. Where capital is the limiting resource, and wood is available,
earth kilns are preferable. Where some capital is available and a serious effort is to be
made to produce quality charcoal efficiently, brick kilns are probably preferred. Steel
kilns may find use where mobility is of such overriding importance that it overcomes
high capital and repair costs (FAO, 1987).

80
2.5.2 Comparative Performance Indices of Carbonizing Equipment
The various types of carbonisers can be compared, using various calculated indices
such as production per unit of internal volume, unit area of space occupied, unit of
capital invested, etc. (Trossero, 1978). The calculations for the indices are best carried
out to compare types within a subdivision. This is done after the basic type of
carboniser needed has been chosen on broad social and technological grounds. The
various carbonising methods are classified by Harris and in Section 2.4.1. (Harris,
1975).
2.5.3 Charcoal making methods
The production and distribution of charcoal consists of the following major stages of
(i) felling/cutting of trees and cross-cutting them into short logs or
billets
(ii) piling of the logs into a clamp, stack or pile
(iii) covering of the clamp with dug up soil lumps
(iv) applying fire to the kiln to initiate carbonization
(v) carbonization of wood into charcoal inside the kiln
(vi) 'harvesting' of charcoal from the kiln, cooling it and packing it into bags
(vii) transportation of the charcoal bags to market
Past efforts to improve charcoal production were largely focused on enhancing the
efficiency of carbonisation of the fourth stage through to the sixth stage by design of
new improved charcoal kilns.
The new improved charcoal kilns can broadly be classified into five categories namely:
earth kilns, metal kilns, brick kilns, cement or masonry kilns and retorts (Jacqueline
and Philipe, n.d.). The main characteristics of each of the five categories of kilns are
given in Appendix A. There is no clear demarcation between the various designs in
terms of yield. The critical factors appear to be operational, supervision skill and
moisture content of the utilised wood. The presence of a chimney that ensures optimum
draught conditions also appears to be important.

81
2.5.4 Use of Steel in Kiln Construction
The cost of steel can be critical in developing countries so it is important to compare
the relative efficiency with which it is utilized by different types of kilns. A useful
index is to calculate the production of charcoal per kg of steel used in construction for
various types. Obviously earth mounds and pits are best since they use no steel at all
and the index is infinite.
Charcoal can also be produced in kilns manufactured from standard 210 litre oil drums
using fast burning raw materials. However when operated with dense hardwoods,
complete carbonization is difficult to achieve and the resulting charcoal is likely to
have a high volatile content (FAO, 1955). Also used oil drums are sometimes difficult
and expensive to obtain in peri-urban and rural areas. The drums tend to burn out rather
quickly due to the thin metal used and have to be replaced fairly frequently.
There are several disadvantages of using metal kilns as compared to the traditional
earth pit or clamp method. Initial capital to cover the cost of the manufacture of the
kilns must be obtained. Basic mechanical workshop skills and equipment must be
available and the steel used in the kiln construction often has to be imported. For ease
of packing and maximum efficiency some care is needed in the preparation of the raw
material. The wood must be cut and/or split to size and seasoned for a period of at least
three weeks. Transportable metal kilns may prove difficult to move in very hilly
terrain, although more gentle slopes can be easily traversed. The life span of metal
kilns is only two to three years meaning capital reinvestment has to take place fairly
frequently.
2.5.5 Yield - investment interactions
The most powerful decision making parameter in choosing a carbonising system for
charcoal for most developing countries is the interaction between the yield of a process
and the capital necessary to install it. A process which has twice the yield of a
traditional one would obviously be chosen if the capital investment of both systems
were the same both in amount and origin of the investment funds. Practically there is
normally a trade-off between yield and investment. For example if the high yield
process requires substantial offshore loan funds to establish then it may be a better
option in terms of local development to use locally available capital and labour to grow
more wood in high yield plantations. This avoids a commitment to an offshore loan

82
for a process which would probably generate far less jobs than the lower yield process.
But if as is usual there is a shortage of either established forests or land on which to
establish plantations then other factors being equal the capital intensive process may
be attractive. Unfortunately in most developing countries which find themselves
simultaneously short of land resource and foreign investment funds the decision is
usually made for them. For developing countries then, the best option they can follow
is efficient use of available resources using the simple technology applied in the most
efficient way (FAO, 1985).
2.6 Earth Kilns for Charcoal Making
2.6.1 Charcoal Earth Kilning and Efficiency
The earth kiln is generally described as "wasteful" and inefficient due to its low
conversion efficiencies. Efficiencies as low as 5-12 percent have been reported
(Commonwealth Science Council, n.d.). However, recent reports by researchers have
reported higher figures of 14-22 percent (Hibajene et al., 1993), 24.5 percent on oven
dry basis (World Bank/ESMAP, 1990) and 17-33 percent on air dry basis (FAO, 1987).
In comparative trials, eight cubic metres of stacked wood with moisture content of 18
percent were used to obtain efficiencies of three types of kilns as shown in Table 2.4.
Table 2.4: Conversion efficiencies of three kiln types
Kiln Type Conversion Efficiency (%)
Oven dry basis Air dry basis
Earth clamp 25 21
Pit 15 13
Casamance 31 27 Source: Manual for Charcoal Production in Earth Kilns in Zambia by Hibajene, S. H. and O. S.
Kalumiana (2003).. Department of Energy. Lusaka, Zambia.
The results in the Table 2.4 show that the earth kiln is not as bad as is generally thought,
and given its low cost, in terms of investment, it compares favourably with other kiln
types. Since woody biomass contains about 50 percent carbon by mass (Openshaw,
1986), an efficiency of about 25 percent is quite high. Several factors like
carbonization temperature, moisture content of the wood charged into the kiln,
producer’s skill and condition of the wood charged into the kiln and, climatic
conditions of the location are considered to affect the efficiency of a kiln.

83
2.6.2 Factors Affecting Charcoal Yield in Earth Kiln
Several factors account for the observed low conversion efficiencies in traditional
charcoal production. Leading among these is poor preparation of feedstock, including
use of green wood for the charge. Other reasons are the poor loading of the kiln, often
using disproportionately sized wood, and poor monitoring of the carbonization
process; harvesting of charcoal before carbonization process is complete, thereby
leading to complete burning of wood meant for charcoal production (Hibajene and
Kalumiana, 2003b). The factors mentioned in last paragraph are mainly due to
management skills of the kilning process.
The charcoal yield decreases with rise in external temperature (Zanzi et al., 1996).
Hence the external temperature is one factor determining the charcoal yield. Small
wood sizes give less charcoal than large ones. The effect of the wood size is more
important at low temperature. The wood size influence on the char yield is explained
by the heating rate, and the residential time of the volatiles, which react with the
charcoal layer when flowing out of the wood to form charcoal. It takes longer time for
the volatiles to leave a large piece of wood than a small one. At high temperature, the
rate of pyrolysis is sufficiently high to decrease considerably the residential time of
the volatiles, even for large piece of wood. The higher the heating rate, the lower the
charcoal yields (Lede et al., 1987). Above 600 °C, the difference in charcoal yields
becomes less important between small and large wood sizes and therefore wood size
is almost negligible at higher temperatures. Higher temperatures enhance high rate of
heat transfer in both radial and longitudinal directions of the log.
Beside the wood size, another parameter which affects the residential time is the
external pressure. The greater the pressure, the longer the tars remain in the wood, and,
as it might be expected, a trend toward greater char formation with increasing pressure
has been reported (Agarwal and McCluskey, 1985, Mok and Antal, 1983, Blackadder
and Rensfelt, 1985). The presence of ash in a wood species favours the charcoal yield.
Hence agricultural residues, which have large ash content, produce more charcoal than
forest wood (Richards and Zheng, 1991 and Zanzi et al., 2002).
The characteristics of the wood raw material have a significant effect on the choice
and performance of carbonization equipment. The three important-characteristics of
wood are species, moisture content, and dimensions of the wood itself as discussed

84
above. On the grounds of availability, properties of the finished charcoal, and sound
ecological principles, wood remains the preferred and most widely used raw material
and there appears to be no reason why this should change in the future (FAO, 1987).
2.6.3 Traditional charcoal making methods
The overwhelming bulk of the world's charcoal is still produced by the simple
traditional method. Traditional charcoal production is an art requiring great deal of
skill. It wastefully burns part of the wood charge to produce initial heat and does not
recover any of the by-products or the heat given off by the pyrolysis process (FAO,
1987). Efforts to improve charcoal production are largely aimed at optimising the
volume of charcoal produced as well as at enhancing the quality characteristics of
charcoal at the lowest possible investment and labour cost while maintaining a high
weight ratio with respect to the wood feedstock.
Using earth as a shield against air laden with oxygen and to insulate the carbonising
wood against excessive loss of heat is the oldest system of carbonization and surely
goes back to the dawn of history. Even today, earth kilns are perhaps used to make
more charcoal than any other method. It therefore attracts careful study to find out its
advantages and disadvantages. Obviously, it keeps its place because of its low cost.
Wherever trees grow, earth must be universally available and it is natural that mankind
turned to this cheap available non-combustible earth material, as a sealing material for
enclosing the carbonising wood. There are two distinct ways to use an earth barrier in
charcoal making, namely, earth-pit kilns and earth-mound kilns. The pit method of
charcoal production results in about 15–20 percent of the charge by weight, being
converted to charcoal. Improved methods can raise the yield to about 30 percent or
more.

85
(i) Earth Pit Kiln for Charcoal Making
A pit is excavated and filled with the charge of wood and is covered with excavated
earth to seal up the chamber, Figure 2.15.
Figure 2.15: Earth Pit Kiln for Charcoal Making
A stratum of deep soil is needed for this method. Suitable deposits of soft soil will
usually be found along the banks of a stream or river. Pits can be made very large and
a cycle may take up to three months to complete (Harris, 1975, Vahram, 1978 and
Varela, 1979). Capital investment is minimal; nothing more than a shovel, an axe and
a box of matches is required. But the method is wasteful in resource. It is very difficult
to control the circulation of the gases in the pit. Much of the wood is burned to ashes
because of too much air in the pit. Another portion remains only partly carbonised,
because it was never properly heated and dried out during the burn.
Apart from the gross variations in quality, there is variation in volatile matter, i.e.
degree of carbonization within the acceptable charcoal. This is because in the pit,
carbonization is started at one end and progresses towards the other. Hence, the
charcoal at the start of the burn, being heated longer, is much lower in volatiles than
the charcoal at the end. This reduces the overall yield, since the "hard" or over burned
charcoal at the firing end with its low volatiles and high final carbon content implies a
low yield (theoretically about 30 percent). Over burning at one end is unavoidable in
order to burn the charge as a whole.
A further problem with pits is reabsorption of pyroligneous acid through rain falling
on the pit. The Pyroligneous acids tend to condense in the foliage and earth used to
cover the pit. When heavy rain falls they are washed back down and are absorbed by
the charcoal. They cause jute bags to rot and, on burning, the charcoal produces

86
unpleasant smoke. Nevertheless, skilled operators using pits which are not too big can
make excellent quality charcoal (Vahram, 1978). The low capital cost of the system
commends its use where wood is abundant and labour costs are low.
Small pits or holes up to a cubic metre or so are useful for producing small amounts
of charcoal from small, fairly dry wood. The method is employed at the village level,
but is usually too low in productivity to supply large amounts commercially.
Typical pits for charcoal are large and burning takes place progressively from one end
to the other. The larger pits producing six tons or more charcoal per burn are difficult
to control, but are more efficient in use of labour. Somewhat smaller ones have better
air flow and produce more uniform charcoal, but the output is lower and use of labour
less efficient.
(ii) Earth Mound Kiln for Charcoal Making
A mound or pile of wood on the ground is covered with earth, Figure 2.16.
Figure 2.16: Earth Mound Kiln for Charcoal Making
The earth forms the necessary gas-tight insulating barrier behind which carbonization
can take place without leakage of air, which would allow the charcoal to burn away to
ashes. This method is also very old and is widely used in many countries.
(Codjambassis, 1981, Garriott, 1982, Huygen, 1981, Karch, 1981, Karch et al., 1987,
Mabonga, 1978 and Savard, 1969).

87
One finds many variations of the basic method. Studies have been undertaken in some
countries to optimise the design. The Swedish work in this area some years ago is
notable (Bergstrom, 1934). The mound system was improved in Sweden through
research. The wood to be carbonized was enclosed behind an air-tight wall made from
earth.
The main improvements were the optimization of the flue system and use of an
external chimney to improve gas circulation (Bergstrom, 1934). The mound or earth
kiln system is versatile. It is suitable for sporadic small scale charcoal production and
yet is also adaptable for large scale production.
(iii) Hybrid or Mixed Kilns System
A hybrid or mixed kilns system containing elements of the earth mound and the pit is
used in some parts of Africa as shown in Figure 2.17.
Figure 2.17: Mixed Kilns
The system is successful where no air leaks occur in the cover. In practice, poor yields
of charcoal are common because it is difficult with large logs rolled into place to get a
well packed stack; gas circulation is erratic and large amounts of uncarbonised wood
result. Sealing of the piles is difficult and, at times, dangerous for the operator to repair.
The result is that air leaks are not controlled and the charcoal is reduced to ashes in
some parts of the pile before the remainder has been carbonised properly. As a rule, it
is difficult to combine high capital cost equipment with a technologically primitive
charcoal burning system and expect the operation to be profitable overall unless the
quality of management is first class (FAO, 1987).
88
The problem of obtaining and maintaining over the whole period of the burn effective
sealing against air, and good circulation, are the main factors limiting the size of pit
and mound burning systems. It is difficult to detect leaks in the covering and in very
large pits and mounds it is difficult to repair them.
Yields of charcoal vary with skill of burning, dryness of fuelwood and air-tightness of
the mound. Yields of 1 ton of charcoal from 4 tons of air dry fuelwood represent good
practice. Yields of 1 ton from 6 tons fuelwood are more common.
2.6.4 The clamps for charcoal production in Zambia
In 1986, a SADC woodfuel research study into urban energy sources, production and
marketing systems in Zambia examined the operations of charcoal makers in the
Lusaka areas of Chongwe, 30 km east and Mumbwa, 100 km west of Lusaka
respectively. It was not easy to generalise about the ‘production systems’. In the same
location were found big clamps of good yields and small clamps of poor yields (Foley,
1986).
The clamps found in the new source areas of Mumbwa were enormous; far bigger than
in the older areas of Kafue or Chongwe, and technically much more sophisticated than
in neighbouring countries. The Earth scan review of charcoal making has no examples
of clamps from developing countries which approach the scale of these Zambian
clamps. The biggest referred to are a mechanically-constructed Surinam kiln of 300
m3, and a Swedish mound kiln of 100-250 m3. In Mumbwa a clamp measured 2 m by
7.5 m by 85 m (1275 m3), and another under construction was to be well over 100 m
in length; even in Chongwe 30 m long clamps were not uncommon.
The rationale of these innovations of extremely long clamps is not completely clear. It
could be because in longer kilns the moisture content of the wood can be brought down
considerably so as to achieve a higher charcoal yield. That is less of the wood is burnt
to drive off the moisture. It could be as well a question of maintaining a lower
temperature over a large volume of wood resulting in a higher charcoal yield (quantity)
at the expense of lower carbon content (quality). But then there is the concurrent
problem of controlling the air supply to avoid combustion; and this is exacerbated by
the shape of the clamp with its relatively large surface area. The shape could be for
consistency of pyrolisation throughout the pile to avoid both combustion and cold

89
spots where wood could be insufficiently carbonised. It could as well have something
to do with harvesting. The shape could also be for the reduction of the sod covering
needed, and certain labour inputs. It is not certain that these long clamps are more
efficient; perhaps it is a case of an evolutionary branch (local trials) that will die out
or not. Simply on technical efficiency grounds, the literature suggests that different
production methods, such as vertical kilns, could also improve yields further.
2.6.5 Field Assessment of Earth-Kiln Charcoal Production Method in Zambia
This study of the traditional method of charcoal production was carried out by S. H.
Hibajene in Kamaila area, one of the major sources of charcoal for Lusaka, situated
about 40 km to the north of the city (Hibajene and Kalumiana, 1994)). The primary
objective of the study was to determine the most important factors for increasing or
maximising the output of the earth clamp method of charcoal production and their
effects on charcoal quality.
Six factors were investigated namely, wood arrangement in a kiln, direction of
carbonization in relation to prevailing wind direction, wood moisture content, earth
insulation thickness, weight (size) distribution in kiln and size of kiln. It was reported
that no factor investigated influenced the yield by more than 25 percent.
The cross-wise method of wood arrangement gave a slightly higher yield than length-
wise loading, but yielded charcoal of a higher quality. There was no difference in the
duration of the carbonization process.
Firing the kiln along the prevailing wind direction gave better output than firing against
the wind. The duration of carbonization was shorter for kilns fired along the wind
direction, and these kilns gave a considerably higher quality charcoal compared to
those where carbonization was against the wind direction.
The moisture content of the wood was observed to have only a small effect on the yield
and quality of charcoal. Dry wood gave a slightly higher yield than fresh wood on a
dry basis.
The currently used insulation earth thickness gives a better yield than a much thicker
layer of earth mound. However, the results cannot be regarded as conclusive due to the
difficulties that were encountered in monitoring the kilns that were doubly insulated.

90
The yield from these kilns might have been greatly influenced by a lack of proper
management. Thick insulation yielded less charcoal in this study by Hibajene, but the
quality of charcoal did not seem to be influenced by the insulation thickness.
In the case of weight distribution, the use of smaller logs gave a better yield of charcoal
than large logs. The variation of this factor gave the largest difference in yield among
all the factors investigated in the study. The charcoal from kilns in which small logs
dominated yielded charcoal with less volatile matter than from the kilns where large
logs were dominant. Hence both in terms of production and end-use the small logs
have an advantage over the large logs.
2.7 Conclusion
2.7.1 State of Modelling of Wood Pyrolysis in Charcoal Making Kiln
Traditionally the study of combustion of solid fuels has been focused on conversion
of coal. However at present the most solicited information concerns the behaviour
during combustion of biomass and organic wastes which have previously been
neglected and knowledge on their conversion behaviour is much less developed than
that of coal.
Currently wood pyrolysis studies for charcoal making have mainly been carried out in
laboratory experiments. Biomass materials studied have normally been wood particles,
wood pellets and saw dust as opposed to wood logs carbonised in a charcoal kiln.
A typical case of field study of wood pyrolysis of logs for charcoal making in a
traditional earth kiln was carried out in Zambia by (Hibajene, 1994). The study though
only involved empirical observations of several earth kilns for effect of some important
factors on conversion efficiency without the backing science and thermodynamics of
which this study endeavours to model numerically.
The literature review in Section 2.3 shows that pyrolysis modelling requires inputs
from kinetic models in order to analyse and solve heat transfer models of single particle
and pyrolysis bed. So far a suitable kinetic mechanism has not yet been utilized and
the solution to the heat and momentum balance equation is based on arbitrary boundary
conditions.

91
Babu and Chaurasia (2002a) established that secondary reactions are essential for
matching numerical results with experimental observations. They therefore presented
the kinetic model which considered the secondary reactions in pyrolysis kinetics. Their
model is the model of choice for most current research in pyrolysis due to its model
results matching experimental results excellently.
The competing reaction model of Thurner et al. (1981) is the most classical model for
wood pyrolysis. It kinetically models three competing reactions of wood to tar, wood
to char, and wood to gases by lumping the secondary reactions with the primary
reactions and features a varying char yield.
Schemes for wood constituents deal with the constituents separately. As such, they
deal only with primary reactions and leave out the description of secondary reactions
which are important when there is heat transfer involved, hence not suitable for kilns.
One step global models were used during the initial stages of the modelling of
pyrolysis process; one step global models do not represent the real situation, hence,
their use was sparingly found in literature.
Parallel reaction models have a fixed char yield and do not feature secondary reactions.
Models with secondary tar cracking are more flexible since they include the
description of the primary degradation of the solid and the secondary degradation of
primary pyrolysis products and thus can be profitably applied to simulate thermal
conversion.
One step global models, competing and parallel reaction models are weak when
compared to models with secondary tar cracking, as they assume a constant ratio of
the char to volatiles yield. Among the reaction mechanisms, the secondary tar cracking
schemes which cover most of the possible aspects of pyrolysis reactions can predict
reasonably accurate primary and secondary product distributions along with wide
heating rates and temperature range. Experimental works to produce reliable kinetic
data are very limited in biomass pyrolysis kinetic modelling. Preferably it is necessary
to develop generalized kinetic models which can be applied to any size and shape of
the particle. Also, development of kinetic models along with semi global kinetic
mechanisms accounting for generalization of wood variety is necessary.

92
Kinetic models development has a long history then. Hence even today it is difficult
to develop a precise kinetic model taking into account all the parameters concerned.
Revisiting the mechanisms for pyrolysis of biomass so far developed has revealed a
general approach: virgin biomass as the raw material and with gas, volatiles, tar, and
char as the end products.
2.7.2 Significance of Pyrolysis Modelling in Earth Kilns
One of the most important reasons why knowledge on the carbonisation of wood
biomass is needed is the design of efficient carbonising kiln with reduced harmful
emissions. Moreover the earth charcoal kiln has the potential to be improved but lacks
the science and thermodynamic knowledge input being sought for in this research.
Improving the conversion efficiency of the traditional charcoal kiln could be of great
economic gain for Zambia in particular and Africa at large. The study of the charcoal
making process in a traditional kiln using numerical methods and simulations has
never been done by the developed nations and neither is it going to be done in the near
future. Therefore this study provides an opportunity to apply numerical modelling and
simulations to study wood pyrolysis process for charcoal making in a traditional earth
kiln for improvement of kiln design and conversion efficiency.
2.7.3 Questions arising
Why it is then that traditional biomass conversion technologies are dogged by low
conversion efficiencies and viewed more as a means of waste disposal than for energy
production?
The answer partly lies in the fact that biomass has previously been regarded as a low-
grade, “poor man’s” fuel, but now it is increasingly viewed as an environmentally and
socially advantageous source of energy (Woods and Hall, 1994). Whereas traditional
earth kilns are considered to be wasteful, it has also been reported that they are not
necessarily as wasteful (Hibajene, 1994). They have potential for improvement of their
conversion efficiency to well above 25 percent through fundamental research using a
scientific and systematic approach to the study of carbonisation process and kiln
design.

93
It is equally worth noting that no clear demarcation exists amongst various kiln designs
in terms of size and yield but the literature suggests that simply on technical efficiency
grounds, different production methods could also improve yields further.
It is not easy then to generalise about ‘charcoal production systems’ in the same
locality. This is even compounded by the prevailing lack of fundamental research to
improve kiln design and wood carbonisation process. Much less is known about micro
scale processes, i.e. those kinetic, heat transfer and mass transfer processes occurring
adjacent to and within individual wood pieces in the kiln. Similarly different kiln
construction materials have been used, often with no set design or structure in mind
and corresponding expected charcoal yield.
List of References
Agarwal, .R. K. and McCluskey, R. J. (1985). "Effect of Pressure on the Pyrolysis of Newsprint. Fuel."
64(11): p.1502-1504.
Aldea, M. E., and Mastral, J. F. (1998). The Heat of Reaction during Combustion of Wood: In Biomass
for energy and Industry. 10th European Conference and Technology Exhibition. C.A.R.M.E.N.,
Rimpar, Germany.
Alves, S. and Figueiredo, J. L. (1989). "A Model for Pyrolysis of Wet Wood." Chemical Engineering
Science 44(12): 2861-2869.
Antal, M. J., and Varhegyi, G. (1995). "Cellulose Pyrolysis Kinetics: The Current State of Knowledge."
Industrial Engineering Chemical Research 34: p. 703-717.
Anthenien, R. A. and Fernandez-Pello, A. C. (1998). "A Study of Forward Smouldering Ignition of
Polyurethane Foam." 27(Twenty-Seventh Symposium (International) on Combustion): p. 2683-2690.
Atreya, A. (1998). "Ignition of Fire." Philosophical Transaction of the Royal Society of London 356: p.
2787-2813.
Babu, B. V. and Chaurasia, A. S. (2002b). Modelling for Pyrolysis of Solid Particle: Kinetics and Heat
Transfer Effects, Energy Conversion and Management.
Babu, B. V. and Chaurasia, A. S. (2003). Modelling, simulation and estimation of optimum parameters
in pyrolysis of biomass, Energy Conversion and Management. 44 pp 2135-2158.
Babu, B. V. and Chaurasia, A. S. (2002a). Modeling, Simulation, and Estimation of Optimum
Parameters in Pyrolysis of Biomass:, Energy Conversion and Management.
Bamford, C. H., and Crank, J. (1946). The Combustion of Wood. Proceedings. Cambridge Philosophical
Society. Vol. 42. p. 166-182.
Bellais, M. (2007). Modelling of the Pyrolysis of large Wood particles. Stockholm. Sweden. Ph.D.
Bergstrom, H. (1934). Handbook for Kolare. Jernkontoret Stockholm. (In Swedish).
Bilbao, R. (2001). "Experimental and Theoretical Study of the Ignition and Smouldering of Wood
Including Convective Effects." Combustion and Flame 126: p. 1363-1372.

94
Blackadder, W., and Rensfelt, E. A. (1985). Pressurized Thermo Balance for Pyrolysis and Gasification
Studies of Biomass London and New York,, Elsevier applied science publishers. p. 747-759.
Boonmee, N. and Quintiere, J. G. (2002a). "Glowing and Flaming Auto-Ignition of Wood: ." Twenty-
Ninth Symposium (International) on Combustion 29: p. 289-296.
Boutin, O., and Ferrer, M. (2002). "Flash Pyrolysis of Cellulose Pellets Submitted to a Concentrated
Radiation: Experiments and Modelling." Chemical Engineering Science Vol. 57: p. 15-25.
Branca, C., Alessandro, A., and Colomba, D. (2003). "Kinetics of the isothermal degradation of wood
in the temperature range, 528-708 K." Journal of Analytical and Applied Pyrolysis 67: 207-219.
Broido, A. and Nelson, M. A. (1975). "Char Yield on Pyrolysis of Cellulose." Combustion and Flame
24: p. 263-268.
Bryden, K. M., and Ragland, K. W. (2002). "Modelling Thermally Thick Pyrolysis of Wood." Biomass
and Bio energy Vol. 22: p. 41-53.
Capart, R., and Fagbemi, L. (n.d.) Wood Pyrolysis: A Model including Thermal effect of the Reaction.
In Energy from Biomass. Proceedings of the Third International Conference on Biomass, (Ven).
Cedric, B., Franco, B., and Jan, P. (n.d.). "Biomass Valorization for Fuel and Chemicals Production - A
Review." IJCRE vol. 6, R2(Available at: http://www.bepress.com/ijcre/vol6/R2/ ).
Chan, W. R., and Kelbon, M. (1985). "Modeling and Experimental Verification of Physical and
Chemical Processes During Pyrolysis of Large Biomass Particle." Fuel 64: 1505-1513.
Chidumayo, E. (2002). Charcoal Potential in Southern Africa (CHAPOSA).
Codjambassis, G. (1981). Méthode de production de charbon de bois (In French). Compte Rendu
GHA/74/013 Ghana, FAO.
Commonwealth Science Council (n.d.). Charcoal Production. A Handbook., National Resources
Institute.
Demirbas, A. (2001). Biomass resource facilities and biomass conversion processing for fuels and
chemicals, Energy conversion and Management. 42: 1357-1378.
Desch, H. E. and Dinwoodie, J. M. (1996). Timber: Structure, Properties, Conversion and Use. 7th ed.
. London, Macmillan Press Ltd: 306p.
Di Blasi, C. (1997). "Influence of Physical Properties on Biomass Devolatization." p. 76: 957-964.
Di Blasi, C. (1998). "Comparison of semi-global mechanisms for primary pyrolysis of lignocellulosic
fuels. ." Journal of Analytical and Applied Pyrolysis. Vol. 41: p. 4139-4150.
Di Blasi, C. (1998). "Physico-Chemical Processes Occurring Inside a Degrading Two-Dimensional
Anisotropic Porous Medium." International Journal of Heat and Mass Transfer Vol. 47(No. 1): p. 43-
64.
Emrich, W. (1985). Handbook of Charcoal Making, D. Reidel Publ.
Fan, L. T. (1977). "A Mathematical Model for Pyrolysis of a Solid Particle: Effects of the Lewis
Number." The Canadian Journal of Chemical Engineering. Vol. 55 p. 47-53.
FAO (1955). La carbonization du bois par fours transportables et installations fixes. . Document
d'information destiné au Commissions Forestières Regionales, FAO/867. (In French).
FAO (1985). Industrial Charcoal Making, Paper 63. Rome, FAO Forestry Department.

95
FAO (1987). Simple Technologies for Charcoal Making. Rome, FAO Forestry Department. Paper 41.
Flynn, J. H. (1991). "A General Differential Technique for the Determination of Parameters for dα/dt =
f(α) A exp(-E/RT): energy of activation, pre-exponential factor and order of reaction (when
applicable)." Journal of Thermal Analysis 37: p. 293-305.
Foley, G. (1986). Charcoal Making in Developing Countries, Technical Report No. 5. Earthscan
London, International Institute for Environment and Development.
Forest Service (1961). Charcoal Production, Marketing and Use. The U.S. Department of Agriculture.
Fredlund, B. (1988). A Model for Heat and Mass Transfer in Timber Structures during Fire: A
Theoretical, Numerical and Experimental Study. Sweden, Lund University, LUTVDG/ (Institute of
Science and Technology.
Garriott, G. (1982). Four improved charcoal kiln designs. Vita Energy Bulletin. Vol. 2.
Grioui, N., Kamel, H., Andre, Z. and Foued, H. (2006). "Thermogravimetric analysis and kinetics
modeling of isothermal carbonization of olive wood in inert atmosphere." Thermochimica Acta 440:
23-30.
Gronli, M. (1996). A Theoretical and Experimental Study of the Thermal Degradation of Biomass.
Dept. of Thermal Energy and Hydropower, Faculty of Mechanical Engineering. Trondheim, The
Norvegian University of Science and Technology. Ph.D.
Gronli, M. G., and Varhegyi, G. (2002). "Thermogravimetric Analysis and Devolatilization Kinetics of
Wood." Industrial Engineering Chemical Research 41: p. 4201-4208.
Harris, A. C. (1975). The Possibilities and Methods for Large Scale Production of Charcoal in Surinam.
. Surinam, UNDP..
Hibajene, S. H. (1994). Assessment of Earth Kiln Charcoal Production Technology. Lusaka,
Department of Energy,, Ministry of Energy and Water Development.
Hibajene, S. H., and Chidumayo, E. N. (1993). Summary of the Zambia Charcoal Industry, Policy and
Management challenges for the future. Department, of Energy. Siavonga, Zambia.
Hibajene, S. H. and Kalumiana, O. S. (1994). "Manual for Charcoal production in Earth kilns in
Zambia.": p. 39.
Hibajene, S. H. and Kalumiana, O. S. (2003). Manual for Charcoal Production in Earth Kilns in Zambia.
D. o. Energy. Lusaka, Zambia: p. 15-19.
Huygen, M. (1981). Mise en protection et en valeur des forêts de Cameroun. SEN/78/002, Terminal
Report. (In French), FAO of the United Nations.
Jacqueline, A., Campbell, M., and Graham, M. H. (2007). "Laboratory-scale synthesis of nitriles by
catalyzed dehydration of amides and oximes under flash vacuum pyrolysis (FVP) conditions."
Synthesis 20: 3179-3184.
Jacqueline, D. and Philipe, G. (n.d.). Experimental Center for Producing Charcoal. France.
Jalan, R. K. and Srivastava, V. K. (1998a). Studies on Pyrolysis of a Single Biomass Pellet- Kinetic and
Heat Transfer Effects:, Energy Conversion and Management. Vol. 40: p. 467-494.
Jalan, R. K. and Srivastava, V. K. (1994). Predictions of Concentration in the Pyrolysis of Biomass
Materials-I, Energy Conversion and Management.
Kansa, E. J., and Perlee, H. E. (1977). "Mathematical Model of Wood Pyrolysis Including Internal
Forced Convection." Combustion and Flame Vol. 29, : p. 311-324.

96
Kanury, A. M. (1972). "Thermal Decomposition Kinetics of Wood Pyrolysis." Combustion and Flame
18: p. 75-83.
Karch, G. E. (1981). Study of traditional charcoal making techniques. FAO Project Working Document
No. 2. Yaoundé, Cameroun, Cameroun Ministry of Mines and Energy. Doc. No. 1.
Karch, G. E. and Boutette, M. (1987). "The Casamance Kiln" Moscow, Idaho, The University of Idaho,
College of Forestry, Wildlife & Range Sciences.
Kashiwagi, T. (1979). "Experimental Observation of Radiative Ignition Mechanism " Combustion and
Flame 34: p. 231-244.
Kashiwagi, T. and Nambu, H. (1992). "Global Kinetic Constants for Thermal Oxidation Degradation
of a Cellulosic Paper." Combustion and Flame 88: p. 345-368.
Koufopanos, C., A. and Papayannakos, N. (1991). "Modeling of the Pyrolysis of Biomass Particles,
Studies on Kinetics, Thermal and Heat Transfer Effects." The Canadian Journal of Chemical
Engineering. 69: 907-915.
Kung, H. C. (1972). "A Mathematical Model of Wood Pyrolysis." Combustion and Flame 18: p. 185-
195.
Lede, J., and Huai, H. Z. (1987). "Fusion-Like Behaviour of Wood Pyrolysis." Journal of Analytical
and Applied Pyrolysis 10(4): p. 291-308.
Lewellen, P. C., and Peters, W. A. (1976). Cellulose Pyrolysis Kinetics and Char Formation Mechanism.
Sixteenth Symposium (International) on Combustion.
Living Documents (2005). Managing the Miombo; Economic Crisis Threatens People and Nature in
Zambia’s Copperbelt, WWF DGIS-TMF Programme.
Lyon, R. E. (1997). "An Integral Method of Nonisothermal Kinetic Analysis." Thermochimica Acta.
297: p. 117-124.
Mabonga, M. J. (1978). A report on charcoal production in Maputo. MONAP Project Working
Document, FAO.
Martin, S. B. (1964). "Diffusion-Controlled Ignition of Cellulosic Materials by Intense Radiant Energy."
Tenth Symposium (International) on Combustion 10: p. 877-896.
Mastral, F. J., and Esperanza, E. (2002). "Pyrolysis of High Density Polythene in a Fluidized Bed
Reactor, Influence of the temperature and Residence Time." Journal of Analytical and Applied Pyrolysis
Vol. 63: p. 1-15.
Milosavljevic, I. and Suuberg, E. M., (1995). "Cellulose Thermal Decomposition Kinetics: Global Mass
Loss Kinetics." Industrial Engineering Chemical Research 34: p. 1081-1091.
Miyanami, K., and Fan, L. S. (1977). "A Mathematical Model for Pyrolysis of a Solid Particle: Effects
of the Heat of Reaction." The Canadian Journal of Chemical Engineering. Vol. 55, : p. 317-325.
Mok, W. S. L. and Antal, M.J., Jr. (1983). Effects of Pressure On Biomass Pyrolysis I. Cellulose
Pyrolysis Products. Thermochimical Acta. 68: p. 155-164.
Nathasak, B. (2004). Theoretical and Experimental Study of Autoignition of Wood, College Park,
University of Maryland. Doctor of Philosophy.
Openshaw, K. (1986). Concepts and Methods for collecting and compiling statistics on biomass used
as energy. Paper prepared for U.N. statistical office workshop in Rome, 29 September – 3 October 1986.

97
Orfao, J. and Figueiredo, J. L. (2001). "A Simplified Method for Determination of Lignocellulosic
Materials Pyrolysis Kinetics from Isothermal Thermogravimetric Experiments." Thermochimica Acta
380: p. 67-78.
Orfao, J., Antunes, F. J. A., Figueiredo, J. L. (1999). "Pyrolysis Kinetics of Lignocellulosic Materials-
Three Independent Reactions Model." Fuel 78: p. 349-358.
Ouelhazi, N., and Arnaud, G. (1992). "A two-dimensional study of wood plank drying. The effect of
gaseous pressure below boiling point." Transport in Porous Media 7: 39-61.
Parker, W. J. (1985). Prediction of the Heat Release Rate of Wood. Fire Safety Science Proceedings the
First International Symposium. p. 207 - 216.
Perré, P. and Degiovanni, A. (1990). "Simulation par volumes finis des transferts cou-plés en milieux
poreux anisotropes: séchage du bois à basse et à haute tem-pérature." International Journal of Heat and
Mass Transfer 33(11): 2463-2478.
Peters, B., and Schroder, E. (2002). "Measurements and Pyrolysis of wood." Biomass and Bioenergy
22(1): 41-53.
Peters, B., and. Christian. B. (2003). "Drying and pyrolysis of wood particles: experiments and
simulation." J. Anal. Appl. Pyrolysis 70: 233-250.
Prakash N. and Karunanithi, T. (2008). "Kinetic Modeling in Biomass Pyrolysis – A Review." Journal
of Applied Sciences Research © 2008, INSInet Publication 4(12): 1627-1636.
Pyle, D. L. and Zaror, C. A. (1984). "Heat Transfer and Kinetics in the Low Temperature Pyrolysis of
Solids." Chemical Engineering Science Vol. 39: p. 147-158.
Ranta, J. and Makunka, J. (1986). Charcoal from Indigeneous and Exotic Species in Zambia. Forest
Department, Division of Forest Products Research. Technical Paper No. 29.
Rath, J., and Wolfinger, M. G. (2003). "Heat of wood pyrolysis." Fuel Vol.82(No.1): 81-91.
Richards, G. N. and Zheng, G. (1991). "Influence of Metal Ions and of Salts on Products from Pyrolysis
of Wood: Applications to Thermo chemical Processing of Newsprint and Biomass. ." Journal of
Analytical and Applied Pyrolysis 21(1-2): p.133-146.
Ritchie, S. J. (1997). The Effect of Sample Size on the Heat Release Rate of Charring Materials. Fire
Safety Science Proceedings of the Fifth International Symposium. p. 177-188.
Roberts, A. F. (1970(a)). Problems Associated with the Theoretical Analysis of the Burning of Wood.
Thirteenth Symposium (International) on Combustion. p. 893-903.
Roberts, A. F. (1970(b)). "A Review of Kinetics Data for the Pyrolysis of Wood and Related
Substances." Combustion and Flame 14: p. 264-272.
Roberts, A. F. and Clough, G. (1963). Thermal Degradation of Wood in an Inert Atmosphere. The 9th
International Symposium on Combustion, The Combustion Institute, Pittsburgh. p. 158-167.
Savard, J. (1969). Surinam - Possibilities for the production of metallurgical charcoal. UNDP No. TA
2745.
Shafizadeh, F. (1978). "Combustion, Combustibility and Heat Release of Forest Fuels." AIChE
Symposium Series Vol. 74, : p. 76-82.
Shafizadeh, S. (1992). "Introduction to Pyrolysis of Biomass. ." Journal of Analytical and Applied
Pyrolysis 3(4): p. 283-305.

98
Siau, J. F. (1995). Wood: influence of moisture on physical properties, Technical report, Virginia
Polytechnic Institute and State University, Department of Wood science and Forest Products.
Skaar, C. (1988). Wood Water Relations NewYork, Springer-Verlag: 283.
Spearpoint, M. J. (1999). Predicting the Ignition and Burning Rate of Wood in the Cone Calorimeter
Using an Integral Model, NIST GCR 99-775, National Institute of Standards and Technology.
Spearpoint, M. J. and Quintiere, J. G. (2001). "Predicting the Piloted Ignition of Wood in the Cone
Calorimeter Using an Integral Model-Effect of Species." Grain Orientation and Heat Flux. Fire Safety
Journal 36(4): p. 391-415.
Spearpoint, M. J. and Quintiere, J. G. (2000). "Predicting the Burning of Wood Using an Integral
Model." Combustion and Flame 123: p. 308-324.
Srivastava, V., and Sushil, K. (1996). "Prediction of Concentration in the Pyrolysis of Biomass
Materials-II." 37(4): p. 473-483.
Suuberg, E. M., and Milosavljevic, I. (1994). Behaviour of Charring Materials Simulated Fire
Environments, NIST-GCR-94-645. Gaithersburg, Maryland., National Institute Standards and
Technology.
Tang, W. K. and Neil, W. K. (1964). "Effect of Flame Retardants on Pyrolysis and Combustion of α-
cellulose." Journal of Polymer Science: p. 65-81.
Thurner, F., and Mann, U. (1981). "Kinetic Investigation of Wood Pyrolysis." Industrial and
Engineering Chemical Process Design and Development 20: 482-488.
Tinney, E. R. (1965). The Combustion of Wooden Dowels in Heated Air. 10th International Symposium
on Combustion, The Combustion Institute, Pittsburgh. p. 925-930.
Tinney, R. E. (1964). The Combustion of Wooden Dowels in Heated Air. Tenth Symposium
(International) on Combustion.
Trossero, M. A. (1978). Analisis Comparativo de Hornos de Carbón Vegetal. Congreso. ILAFA-Altos
Hornos. (In Spanish), Instituto Latinoamericano del Fierro y el Acero.
Tuck, A. R. C. and Hallett, W. L. H. (2005). Modelling of Particle Pyrolysis in a Packed Bed Combustor.
Ottawa, Ontario, University of Ottawa, Depts. of Chemical and Mechanical Engineering.
Vahram, M. (1978). Quality of charcoal made in the pit-tumulus, University of Guyana/National
Science Research Council. Charcoal Unit Laboratory Report No. 4.
Varela, R. C. (1979). Charcoal Production: Logging and Mechanical Forest Industries Demonstration
and Training Project. , . Georgetown, Guyana, UNDP/FAO of the United Nations. Field Document
No. 2.
Varhegyi, G., Jakab, E. and Antal, M. J. (1994). "Is the Broido-Shafizadeh Model for Cellulose
Pyrolysis True? ." Energy Fuels 8: 1345-1352.
Walker, J. C. F., and Butterfield, B. G. (1993). Primary Wood Processing. London, Chapman and Hall.
Wang, Y. and Yan, L. (2008). "CFD Studies on Biomass Thermochemical Conversion" International
Journal of Heat and Mass Transfer Molecular Sciences ISSN 1422-0067 9(1108-1130).
Woods, J. and Hall, D. O. (1994). Bioenergy for Development; Technical and Environmental
Dimensions FAO - TCP.
World Bank/ESMAP (1990). Zambia Household Energy Strateg Report. Washington D.C.

99
Wu, Y. and Dollimore, D. (1998). "Kinetics Studies of Thermal Degradation of Natural Cellulosic
Materials." Thermochimica Acta, 324: p. 49-57.
Zanzi, R., and Sjostrom, K. (2002). "Rapid Pyrolysis of Agricultural Residues at High Temperature."
Biomass and Bioenergy 23(5): p.357-366.
Zanzi, R., and Sjostrom, K. (1996). Rapid High-Temperature Pyrolysis of Biomass in a Free-Fall
Reactor. Fuel. 75: p. 545-550.
Zaror, C. A. and Pyle, D. L. (1982). The Pyrolysis of Biomass: A General Review. Proc. Indian Acad.
Sci. (Eng. Sci), India.

100
CHAPTER 3 MATERIALS AND METHOD
3.1 Introduction
The purpose of this research is to improve the kiln design, conversion efficiency of
wood to charcoal and charcoal yield by using a numerical method. This is achieved by
studying the influence of some major factors on the carbonisation process and the kiln
conversion efficiency. This entails determining optimum values of the factors that
result in an optimum kiln conversion efficiency and charcoal yield.
In this chapter the research objectives and methodology design used are explained.
The mathematical models and their supporting physical models are elaborated. A
solution method has been described to close up the modelling equations used. Factors
affecting the carbonisation processes in the kiln are explained. Also highlighted are
some limitations of the research method used.
3.2 Research Design
General Method
Computational fluid mechanics and heat transfer approach was used with PHOENICS
Intel 2009 software to model and simulate the kiln and the wood carbonisation
processes inside the kiln. Parametric studies employing numerical simulations are used
to determine the optimum values of the factors affecting wood carbonisation processes
in the kiln. The optimum values of the factors are subsequently used to design an
optimised charcoal kiln of optimum conversion efficiency. The numerical results are
validated against some field observations by Hibajene (1994) and other related
experimental results in the literature.
Specific Procedures
Using data sheets, data pertaining to charcoal earth kilning was obtained in the field.
The data was analysed for use as input to the kiln numerical model. The data is a typical
representation of field practises in charcoal making over a long time. The practises are
applied by charcoal producers in Zambia and neighbouring countries.
From the data collected, major factors of influence were identified and categorised
according to their type of influence whether variable, uncontrollable or fixed.
Variable factors can be changed as required, while uncontrollable factors are

101
influenced by nature. Fixed factors are deliberately kept constant or cannot just be
changed.
The statistical experimental design method of factorial experiments was used to design
the numerical experiments.
(i) Firstly the carbonisation process was characterised by determining how it is
affected by the controllable and uncontrollable factors.
(ii) Simulations were designed that enabled estimation of how much the
conversion efficiency relatively changed when each factor level was varied.
(iii) Information from the screening simulations was used to identify the critical
factors and to determine the direction of adjustment for these factors to improve
the kiln relative conversion efficiency.
(iv) The screening simulations also provided information about which factors
required more careful control during carbonisation process in order to improve
the kiln conversion efficiency.
(v) The logical step after the screening simulations was to optimise the kiln by
determining the region in the values of the major factors that lead to an
improved kiln relative conversion efficiency.
The details of the numerical experiments design and data used are provided in Chapter
four and Appendices H, I and J respectively.
3.3 Method
3.3.1 Introduction
The phenomenon taking place in the charcoal kiln is that of fluid flow (air and
volatile/non-volatile gases), heat transfer between woodlogs and between woodlogs
and gases and associated phenomena of partial combustion involving chemical
reactions during wood pyrolysis. To tackle such complex problems of fluid mechanics
and heat transfer, only the method of computational fluid dynamics (CFD) is equipped
with mechanisms to handle them. The computational approach solves numerically the
equations (usually in partial differential form) that govern the processes of interest.
This research work applies the CFD method for the analysis of the systems involving
such phenomenon by means of computer-based simulations. It is important to note that

102
the CFD method can produce practically unlimited level of detail of results and it is
very cheap to perform parametric studies to optimise the conversion efficiency of the
charcoal kiln. The method also reduces the costs and time associated with experimental
configurations especially of physical earth charcoal making kilns.
The CFD code used is structured around numerical algorithms that tackle fluid flow
and heat transfer problems. It uses sophisticated user interfaces to input problem
parameters and to examine the results. The flow problem is defined in the input
programme, QI. Numerical solution is executed by the solver EARTH using the finite
difference special method of finite volume to approximate the unknown flow variables
by means of simple functions and solution of algebraic equations through
mathematical manipulations. The results are displayed and analysed in the graphical
user interface (GUI) called PHOTON which visualises the output data for domain
geometry, grid distribution, contours, vector plots and other manoeuvres deemed
necessary.
3.3.2 Research sites
Three regions were selected for data collection as they are the major production
regions of charcoal:
(i) The Copperbelt province; Lushishi/Kasamba Kopa (Chingola), Ichimpe
(Kitwe), and Kafikondo (Kalulushi).
(ii) The Central province; Sungula/Nyambe (Kapiri-Mposhi) and ZAF area
(Mumbwa).
(iii) Lusaka province; Chongwe (Lusaka) and Kamaila (Lusaka), secondary data.
Apart from being major production areas of charcoal, they are also high consumers of
the charcoal. It is important to note that data for the Lusaka province areas were
obtained from the works of Hibajene and Kalumiana (Hibajene, 1994, Hibajene and
Kalumiana, 2003a). The sites maps where data was collected are shown in Appendices
K and L.
3.3.3 Research instruments
In order to establish suitable wood for charcoal, preferred kilns and practises in the
field in Zambia, the data had to be obtained through qualitative interviews, field
observations and measurements. The characteristics of some of the wood suitable for

103
charcoal making at the sites visited are listed in Appendix M. The other important
data was on kiln types. Also collected was the data on weather conditions of the areas.
Appendices N lists the form of the data collected for input in the kiln numerical model
of the problem. Various instruments used are described.
(i) GPS
A GPS was used to mark and name the charcoal kilns geographical locations, altitudes
and topology. It was also used to measure ambient temperatures and pressures of the
locations. The Garmin GPS is a GPSMAP 60CSx model with a satellite, trip computer,
campus sensors, maps and altimeter. It has a high resolution 256-colour screen. Its
receiver is a WAAS/EGNOS enabled. Campus accuracy is 5 degrees, resolution 1
degree. The altimeter accuracy is 10 feet, resolution 1 foot. The GPS accuracy is 10
metres (33 feet), 95 percent typical.
(ii) Digital Barometer
The barometer was used to measure temperature, pressure and humidity at the kilns
locations and the altitude for comparisons with values from the analog meters. The
electronic barometer model BA888 measures full pressure trend, and has a
hygrometer, thermometer and clock. It has a pressure altitude compensator (-100 to
2500 m), humidity 25 percent RH to 95 percent RH with resolution of 1 percent RH,
temperature range -5 °C to 55 °C with resolution of 0.5 °C , pressure 795 to 1050
mb/hPa (23.48 to 31.01 inHg) with resolution of 1 mb/hPa. Analog barometers
A Russian made analog barometer model GMP (rmn) was used for comparison
purposes with the digital readings. It measures barometric pressure in millimetres of
mercury with a range of 600 – 800 mmHg.
(iii) Measuring tapes
The 30 m measuring tape was used for measuring the width, height and length of the
kilns. It was also used to measure the distances from kiln at which the wind speed and
direction were taken. The small three meter measuring tape was used to measure
lengths of wood logs and the depth or thickness of the insulating earth wall as marked
on the 1.5 m long steel rod pushed into the earth insulating wall.

104
(iv) Anemometer
The anemometer was used to measure wind speed. The wind speed was measured at
four points marked around the kiln at 10 m distance and an average speed value
calculated. It is a simple form of free-stream turbine meter of propeller-type. The
number of turns of the wheel per unit time was counted using a stop watch. The speed
of the wind was then calculated using a formula provided with the machine. The meter
has an uncertainty of 0.25 percent to 1.5 percent for air flow.
(vi) Digital camera
An aigo DC-V630 digital camera was used to take pictures of the kilns, wood logs and
some other vital illustrative items. The camera has a sensor of 6 Mega Pixels CCD,
size: 1/2.5 inch. It has a focus range of Normal: 80 cm –infinity (from tip of barrier).
The resolution for still image being 2816 x 2112 (6M) maximum and 640 x 480
(VGA).
(vii) Data Collection Sheets
The sheets were designed to collect data on the site as the charcoalers were
interviewed. Information collected was basically wood characteristics, kiln designs
and operations data. Samples of the various data collection sheets are not attached here
due to their numerous numbers. Only the form of the key final data collected is shown
in Appendix N.
(viii) Mild steel rod
A 1.5 m long by 12 mm diameter steel rod was used to measure the thickness of the
insulating earth wall covering the wood pile on the kiln sides, ends and the roof. This
was done by pushing the rod through the earth wall until it touched the woodlog end
surface and then measure length of rod sunk in earth wall using the small three meter
measuring tape. Measurements were taken at two equally distanced locations on the
kiln ends and sides. At each location the thickness was measured at kiln bottom, mid-
height and near the roof and the average wall thickness calculated. For the roof
thickness, two equally distanced points on the kiln centre line were used to measure
earth covering thickness.

105
(ix) Nylon rope
To measure the diameter of the small, medium and large diameter woodlogs, a 1.5m
long nylon rope was wrapped around the particular log at three locations (i.e. the two
ends and the middle portion) and the circumferences calculated at these locations. The
calculated average of the three circumferences was taken as the woodlog diameter.
3.3.4 Data collection
Charcoal making kilns typical in Zambia are the traditional earth kilns found all over
Zambia in various sizes of similar design. In the urban and peri-urban areas of Central,
Lusaka and Copperbelt provinces, where charcoal production and consumption are
highest, large kilns are not uncommon. These are usually rectangular in shape, very
wide, very long and of some heights close to two metres. There were extremely large
kilns in the northern areas of the Copperbelt province in Chingola Lushishi area and
in Central Province Mumbwa district, while Lusaka province had almost standard size
charcoal kilns (2 m x 3 m x 7 m). Deep in the rural areas are mostly earth mound kilns
made by subsistence farmers as they clear and prepare their fields for crop cultivation.
These small earth mounds are almost shapeless in form. The wood arrangement in the
earth kilns was found to be mainly crosswise especially on the Copperbelt province
and both crosswise and longitudinal in the Central province, Mumbwa area.
The earth charcoal making kilns sampled in the sites mentioned here are the major
sources of the bulk of charcoal consumed in Zambia. The practises found in one area
are almost always the same in the other areas. This is so in that the same charcoal
makers could move from one region to the other depending on wood availability,
economic conditions e.t.c thus carrying with them the same practises. Therefore the
form of kilns in one area had almost always the same methods of construction applied
on them and hence the data tended to be similar for the different areas sampled.
Due to accessibility roads considerations, only kiln in areas reachable were targeted.
The distance between kilns locations in one area was also a challenge to sample more
kilns if available. Mostly only legal kilns were measured as guided by the forest
officials and the locals attending to such kilns. The kilns sampled were the standard
kiln sizes or larger normally found in state farms, natural forests, land clearing sites or
regrowth areas. Such kiln types were almost always found being constructed or ready

106
for firing or were still carbonising. This was typical in each of the areas of high
charcoal production.
The data collected is very reliable in that it was to a larger extent similar in almost all
the sampled regions, meaning it has been used in practise and proven over a long time.
It is important to note that this data was mainly collected in the dry season when bush
tracks are accessible. The same kiln construction parameters are applied all year round
except for a change in ambient conditions in the rainy wet season which mainly affect
wood moisture content and earth insulating material properties. On wood moisture
content, the charcoalers tend to dry the wet wood for longer periods in the rainy season
up to say two months before carbonising. In the rainy season, they also wait for dry
spells before they cover the kiln with the relatively dry earth lamps. Overall this
minimises the adverse effect of the moisture on carbonisation process.
Due to the similarity in the kiln parameters measured in each region only three kilns
were sampled at most in one location. To ensure instruments stability, measurements
were only taken at site after the set instruments have stabilised for 10 minutes or so.
The quality of data was guaranteed by taking several measurements of a particular
parameter and an average value determined.
3.3.5 Data analysis
The kiln and weather data collected was multivariate and discrete. The data was
processed to remove any erroneous measurements, grouped into charcoal production
regions and data of similar trends and range averaged to obtain standard values of the
measured parameters. A summary of the data of the important major factors is given
in Appendix O. The effect of variation of the major factors influencing carbonisation
process actually leads to practical conclusions as to which direction the kiln conversion
efficiency falls.
The major factors influencing carbonisation process were parametrically studied in
order to obtain their most favourable influence on the kiln relative conversion
efficiency. Their favourable values product are the determinants of the optimised kiln
design and hence the conversion efficiency. This then would show that the kiln
conversion efficiency can be improved by numerical modelling leading to optimum
parameter values.

107
3.4 Mathematical Modelling
3.4.1 Basic governing equations
The physical flow phenomena simulated here are: laminar, compressible, unsteady,
chemically reactive, and two-phase in nature. The immersed woodlogs were also
assumed to be taking part in the radiative heat transfer by way of absorption and
emission. The woodlogs partially occupy the space in which the fluid flows and are
bigger than the size of the local computational cells. The woodlogs are interacting
thermally with the volatile gases (i.e. there is 'conjugate heat transfer'). The
thermodynamic, transport (including radiative heat), chemical and other properties of
the gases and woodlogs are of arbitrary complexity.
Mathematically the equations solved are those which express the balances of: mass,
momentum, energy, material (i.e. chemical species), over discrete elements of space
and time, i.e. 'finite volumes' known as 'cells'. The cells are arranged in an orderly (i.e.
"structured") manner in a grid which is Cartesian. These equations express the
influences of: diffusion (including viscous action and heat conduction), convection,
and variation with time, sources and sinks. In order to reduce the numerical errors
which result from the unsymmetrical nature of the convection terms, use of 'higher-
order scheme' of QUICK was made. The dependent variables of these equations are
thus: mass fraction, velocity and pressure, concentration and in this case temperature.
The mass and momentum equations are solved in a semi-coupled manner by a variant
of the well-known SIMPLE algorithm as described in Chapter 4 of this work.
Due to the non-linearity of the whole equation system, the solution procedure is
iterative, consisting of the steps of: computing the imbalances of each of the above
entities for each cell; computing the coefficients of linearised equations which
represent how the imbalances will change as a consequence of (small) changes to the
solved-for variables; solving the linear equations; correcting the values of solved-for
variables, and of auxiliary ones, such as fluid properties, which depend upon them:
and then repeating the cycle of operations until the changes made to the variables are
sufficiently small.

108
Conservation equations
The terms appearing in the balance (conservation) equation are: convection (i.e.,
directed mass flow), diffusion (i.e., random motion of electrons in this case), and time
variation (i.e., directed motion from past to present - accumulation within a cell) and
sources (i.e., pressure gradient or body force for momentum, chemical reaction for
energy or chemical species).
The CFD model used here employs space averaging for the flow in porous media, with
the friction, heat-transfer and chemical reaction processes, per unit volume, being
represented by way of a grid that is too coarse to represent individual woodlogs as
stated before. Then volumetric sources are provided either by available
experimentally-based formulae or by deduction from separate computations of what
happens in individual woodlogs. The latter studies are suitably conducted in a one-
dimensional (radial) manner; and they too have experimental inputs that exist.
Modelling Assumptions
(i) The gas phase comprises air, water vapour and volatiles.
(ii) The solid phase consists of raw wood, water and charcoal.
(iii) Free water is assumed in the solid phase, but bound water is not modelled.
(iv) No shrinkage of the solid volume is modelled.
(v) Specific heat capacities are initially not dependent on temperature.
(vi) Radiation is modelled late in the final model.
(vii) The pyrolysis of raw wood is modelled by a one-step Arrhenius, endothermic
reaction resulting in the formation of volatiles and charcoal.
(viii) The rate of mass loss due to evaporation of water from the solid phase is
modelled by an Arrhenius-type law.
(ix) The production of liquid tar during pyrolysis is ignored.
The rate constants used in this study for wood drying and wood pyrolysis were taken
from the literature, but there is no consensus in the literature on their suitable values.
Further, in the absence of precise information on relevant drying and pyrolysis
timescales, further calibration was necessary to satisfactorily match earth-kiln data.
Such a calibration uncovered the need to employ more complex drying and pyrolysis
models, perhaps even necessitating relaxing the simplifying assumption of zero
dimensionality in the solid phase.

109
Continuity equations
The continuity equations for the gas and solid phases are:
(3.1) . pdggg Ut
(3.2) pdsst
where U is the superficial gas velocity vector, ωd and ωp are the mass drying and
pyrolysis rates, ρg and ρs are the densities of the gas and solid phases and ɛg and ɛs are
the volume porosities of the gas and solid phases, respectively.as are calculated later
in Chapter 4.
Momentum equation
The momentum equation for the gas phase is:
(3.3) U|U|i
KgρUvKgρ gρag,ρ)Ugνg.(ρUUgρ.Ugρgεt
g p
Where p is the perturbation pressure about ambient, g is the gravitational acceleration,
ρg,a is the ambient gas density, υg is the gas-phase kinematic viscosity, and Ki and Kv
are the inertial and viscous flow resistance coefficients, respectively.
Energy equations
The energy equations for the gas and solid phases in the earth kiln are:
(3.4) ).(. gsg
t
g
ggpgggpggg QTTCTCt
(3.5) ).( ddppgsssspsss HHQTkTCt
Where Hp is the heat of pyrolysis (=150kJ/kg), Hd is the heat of evaporation taken as
2.257MJ/kg (Felfi et al., 2004), and Qgs is the interphase heat transfer rate.
Gas-Phase species equations
The species equations for the gas phase are:
(3.6) ).(. 0,vspv
v
g
gvgvgg YYYUYt
)(3.7 ω)Yσ
ν.(ρYUρ.Yρε
tdh
h
g
ghghgg

110
(3.8) h
YvY1aY
Where Ya is the mass fraction of air in the gas phase, Yh is the mass fraction of water
vapour in the gas phase, and Yv is the mass fraction of volatiles in the gas phase.
Solid-phase species equations
The species equations for the solid phase are:
(3.10) )1(
).(0,
0,
vs
vs
pcscssY
YYDY
t
(3.11) 1 cYwYrY
Where Yr is the mass fraction of raw wood in the solid phase, Yc is the mass fraction
of charcoal in the solid phase, Yvs,0 is the mass fraction of potential volatile matter in
the solid phase and Yw is the mass fraction of water in the solid phase.
General Transport Equation
For a general variable of the fluid, such as mass, momentum, species or energy, the
above conservation equations can be summarized into a general transport equation of
as
(3.12)
Sxx
uxt ij
j
j
Where, is the transport coefficient of the general variable .
3.4.2 The State Equation of System
For a perfect gas system, the state equations can be written as
(3.13) 1 i
i
N
iM
mRTRTP
Where, mi and Mi are the mass fraction and the molecular weight of the ith species
respectively.
(3.9) ).(dwYDswYss
t

111
The basic governing equations for a homogenous Newtonian fluid flow form a closed
set of partial differential equations. These equations are the suitable form to solve
numerically a laminar flow phenomenon in the charcoal kiln.
3.5 Supporting Physical Models
3.5.1 Interphase momentum transfer model
The flow resistance through the wood pile employs the Ergun correlation, for which
the inertial and viscous flow-resistance coefficients Ki and Kv, appearing in Eq. (3.3)
are defined by:
(3.14) 75.13
pg
si
DK
(3.15) 150
23
1
2
pg
sv
D
vK
Here, Dp is the equivalent particle diameter for the porous woodlog media, and it is
given by:
(3.16) /6 '''
wp AD
Where Aw''' is the wood specific surface area per unit solid volume, i.e.:
(3.17) /44/2
'''
l
ll
ll
l
lw D
LD
LD
V
AA
Where Al is the log surface area, Vl is the log volume, Dl is the log diameter, and Ll is
the log length and so
(3.18) 5.1 lp DD
3.5.2 Interphase heat transfer model
The interphase heat transfer rate is modelled by:
(3.19) )( sgwgsgs TTAhQ

112
Where hgs is the interphase heat transfer coefficient, and Aw is the wetted surface area
per unit volume.
The heat transfer coefficient is defined in terms of a convective and solid contribution,
as follows:
(3.20) sg
sg
gshh
hhh
Where
(3.21) / lgg DNukh
and
(3.22) 2
l
ss
D
kh
Where kg is the gas thermal conductivity and Nu is the Nusselt number defined by:
(3.23) )(Re45.0 333.06.0
lNu
Where the laminar Prandtl number σl = 0.71, and
(3.24) Reg
lm DU
Where Um is the absolute value of interstitial velocity, defined by
(3.25) gm UU
The wetted surface area per unit volume is given by:
(3.26) k
llw
A
NDA
Where, Nl is the number of logs.
(3.27)
4/2
ll
ll
LD
VN
Here, Vl is the total volume of the wood stack and Ll the length of the woodlog.

113
3.5.3 Pyrolysis modelling
Wood pyrolysis results in the consumption of raw wood, and the formation of charcoal
in the solid phase, and volatiles in the gas phase. This process is modelled through the
reaction:
1 kg raw wood > Yvs,0 kg volatiles + (1-Yvs,0) kg char (3.28)
In general, the composition of the volatile gases can be determined from the wood
proximate analysis (Ragland et al., 1991), which gives the split between char and
volatiles in the raw wood, and the ultimate analysis, which gives the elemental
composition of the raw wood. The volatile gases are likely to be comprised of CO2,
CO, CmHn, H2O and H2, but for simplicity the elemental composition can be used to
define a single effective hydrocarbon gas with the formula CmHnOo. In the absence of
conducting any research, it is assumed that all volatiles gas escape to the surface as
methane CH4.
Following numerous workers for example (Rath et al., 2003, Hostikka and McGrattan,
2001 and Kuo and Hsi, 2005), they concluded that simple single-step, global,
endothermic reaction is employed to model the wood-pyrolysis kinetics, as described
in Chapter Four Section 4.52.
Pyrolysis is assumed to take place only when the temperature at the gas-solid interface,
Tsi > 180 °C. The surface temperature is estimated from the following relationship:
(3.29)
s
ggssgss
sih
ThThhT
The heat of pyrolysis is taken to be Hp = 150kJ/kg see Gronli and Melaaen (2000),
although there is much uncertainty in the literature as regards the heat of pyrolysis. For
example, Roberts reports that published estimates of the heat of pyrolysis vary from
Hp = 370kJ/kg (endothermic) to Hp = -1.7MJ/kg (exothermic) (Roberts, 1971a). In
dealing with the uncertainty whether wood pyrolysis is an exothermic or endothermic
process, the production of charcoal from wood pyrolysis is divided into four
consecutive stages as follows (Gomaa and Fathi, 2000, Bagramov, 2010);

114
(i) Drying (ends at about 150 to 170oC).
(ii) Initial decomposition (170 to 270oC).
(iii) Exothermic decomposition (270-350 oC).
(iv) Final decomposition (Above 350oC-550oC).
The foregoing suggests the need to include an exothermic reaction in future studies,
perhaps along the lines proposed by Boonmee (2004), who suggested using differing
values for Ep and Hp in the primary (T<350oC) and secondary (T>350oC) stages of the
wood pyrolysis process. A recent study by Rath et al. (2003) supports the view that
that the primary reaction (200 to 390o C) is endothermic, whereas the secondary
reaction (from 390 to 500oC) is exothermic.
3.5.4 Wood drying
A simple Arrhenius expression is used to model the wood drying, as follows:
(3.30) )/exp( 0 sdwsdsd TREYA
Wherein the pre-exponential factor Ad=5.13.106 s-1, and the activation energy
Ed=88kJ/mol see Felfi et al. (2004). For simplicity, the absolute temperature of the log
surface Ts is taken to be the same as the local solid temperature.
3.5.5. Radiative-heat-transfer model
The PHOENICS code used is supplied with five models of radiation, namely:-
Composite-flux model, Composite-radiosity model, Rosseland diffusion model,
IMMERSOL (Immersed solids) model, and Surface-to-surface radiation model.
The IMMERSOL model uses the "radiative-conductivity" concept, handles conjugate
heat transfer (i.e. heat conduction within large immersed solids) and two-phase flow
(i.e. additional suspended solids within the flowing medium). It is the only model that
handles radiation between solids like pyrolysing wood logs separated by non-
absorbing media. It also combines universal applicability with economic practicability
for complex geometries. All the models are restricted to "gray" radiation, i.e. to that in
which the influence of wave-length is neglected (CHAM, 2009).
It is a convenient method when radiating surfaces are so numerous, and variously
arranged, such that the use of the view-factor-type model is impractically expensive.
This method is capable of handling the whole range of conditions from optically-thin

115
(i.e. transparent) to optically-thick (i.e. opaque) media. It is mathematically exact when
the geometry is simple; and never grossly inaccurate even when it is not. The model is
used in this work and is discussed in full in this section (CHAM, 2009).
All the equations used in this section, 3.5.5 are referenced from the encyclopaedia from
(CHAM, 2009)
The IMMERSOL method involves three main elements: (CHAM, 2009)
(i) Solution for the variable T3, from a heat-conduction-type equation with a
local conductivity dependent on: nature of medium, its temperature, and
distance between nearby solid walls. T3 is defined, for media within which
thermal radiation is active, as the fourth root of the radiosity, divided by the
Stefan-Boltzmann constant, . For solid materials which may be immersed in
the medium, T3 is defined as being equal to the local solid temperature.
(ii) Solution for the temperature of the fluid phase(s) by means of the
conventional energy equation(s), having either temperature or enthalpy as the
dependent variable(s). The energy equation(s) contain radiation-source terms
proportional to:
(T34 - T12
4) (3.31)
Where, T12 stands for the temperature of the fluid phase to which the equation
relates. Equal and opposite sources appear in the T3 temperature equation.
(iii) Modifications of the source terms in cells adjacent to solids, which account
for the departures from unity of the surface emissivity.
Character
IMMERSOL provides an economically-realisable approximation to the precise
mathematical representation of radiative heat transfer. The claims that can be made for
it are that:-
(i) its predictions agree exactly with the precise representation in simple
(specifically, one-dimensional) circumstances and,
(ii) in more complex circumstances, its predictions are always plausible, and of the
right order of magnitude.

116
Justification
Its use can be justified in part by reference to the facts that:
(i) it is rare for the absorption and scattering coefficients to be known with great
precision, and
(ii) the neglect of wave-length dependencies, which is commonly regarded as
acceptable, is probably no less serious a cause of error.
(Moreover, its economy is such that it would allow refinement in respect of
wavelength, the single variable E3 (i.e. T34) being replaced by a set of variables, one
for each wavelength band; but this possibility has not yet been exploited. Its practical
realisability is its greatest asset. IMMERSOL is based upon intuition as much as on
rigorous analysis. It is therefore treated with both respect and caution.
Mathematical Formulation
The differential equation for T3 within the immersed solids
The temperature of the solid phase, T3, is governed by the differential equation which
describes how: the variation of T3 with time is balanced by conduction within the solid
and by such sources as are present within it. This equation can be written as:
(3.32) . 33
, qTkdt
TC sP
Where, Cps is the specific heat capacity of the solid, k is its thermal conductivity, and
q is the heat source per unit volume.
The differential equation for T3 between the immersed solids
Within the space between solids, the distribution of radiosity, J, i.e. 4
3T , can be
represented as obeying the equation:
(3.33) 3123 JJsJrad
Where:
J3 stands for radiosity,
J12 stands for the phase-surface-average of 4
3T of the first and second fluid
phases,

117
stands for the absorptivity of the fluid (possibly 2-phase) medium,
s stands for the scattering coefficient of that medium,
rad is defined as the reciprocal of
WGAPs
1
4
3 , and
WGAP stands for the distance between adjacent walls computed from the
solution for LTLS (local turbulence length-scale).
How T3 can represent both the solids temperature and 4
1
3
J
For the between-solids spaces, because it has no other significance where immersed
solids are absent, T3 can be defined by:
4
1
33
JT
, so that 4
33 TJ , and
3
3
33 4 dT
T
JdJ
i.e. 3
3
34 dTT
Hence, Eq. (3.33) can be expressed as a differential equation in terms of T3 as:
(3.34) TJsT 4
3123rad
Where:
WGAPs
Trad
13
16 3
3
This equation has no dt
dT3 term, because radiosity is not a quantity which is stored (in
the physical rather than computational sense).
Justification of the inclusion of Wall Gap (WGAP)
The inclusion of WGAP in the radiative-conductivity expression is the most significant
innovative feature of IMMERSOL; for it allows the conductivity to remain finite even
when and s are zero. Moreover it gives it the correct value for the only case which
is easy to test, namely that of radiative transfer between wide parallel surfaces.

118
A plausible justification in physical terms is as follows:
s
1 is the mean free path (or average ray-stopping distance) associated with
absorption and scattering. WGAP, the distance between the bounding walls of the
space, and is very definitely the "stopping distance" effected by those walls.
Combining the equations
Taken together, Eq. (3.32) and (3.33) imply that: A single heat-conduction-type
equation describes the influences of both conduction in solids and radiation between
them on the distribution of immersed-solids temperature, T3, throughout the domain,
with however a position- and T3-dependent conductivity and source terms which vary
similarly. Equations of this type can be easily solved, in an iterative manner, by the
PHOENICS software used.
Other phase-boundary effects
The phase boundary is also the location at which energy exchanges occur between the
solid on one side and the fluid on the other. The driving forces are the temperature
differences: T1-T3 and T2-T3, where T1 and T2 are fluid-phase temperatures. The
resistances to these energy exchanges are the sums of: the conductive resistance on the
solid side and the conductive and convective resistance on the fluid side.
When the fluid-phase temperatures are solved for indirectly, by way of the enthalpies,
some additional algebraic equations are needed; but their inclusion and simultaneous
solution present no difficulty.
Radiative interchanges with the fluid(s) between the solids
Absorption of radiation by the fluid materials between the immersed solids, and
emission of radiation by those materials, are represented by the term: 312 JJs
of Eq. (3.33).
This term can be spelled out in more detail as:
r1(1 + s1)(J1 - J3) + r2(2 + s2)(J2 - J3) (3.35)
Where, r1 and r2 represent respectively the volume fractions of the first and second
phases, and 1, s1 etc. are the phase absorption and scattering coefficients.

119
Each of the above two terms appears, with opposite sign. The IMMERSOL radiation
model is implemented via the input programme in PHOENICS with few actions.
Domain-boundary conditions
The radiation-influencing conditions at the boundaries of the domain needed to be
ascribed. The firing hole is represented as an aperture in the bounding surface of the
charcoal kiln through which radiation can enter and leave. The insulating earth walls
represent the domain boundary are simulated as solid walls of prescribed temperature,
for which the emissivity is defined.
Radiative properties of the Medium
In general the radiative properties of the medium vary with the local composition and
wave-length. The products of combustion, such as CO2 and H2O, are strong selective
absorbers and emitters; but they do not scatter radiation significantly. Particulates on
the other hand, such as pulverised coal, ash and soot, scatter strongly. The
absorptivities of N2, O2 and H2 are so small that these gases are almost completely
transparent to radiation. However, a detailed modelling of the radiative properties is
not warranted for the differential radiation models considered here.
3.6 Optimisation of Kiln and Conversion Efficiency
Optimisation Procedure
To optimise the kiln,
(i) Each of the major factors affecting carbonisation process was simulated to
obtain its optimum value for its main effect on the relative conversion
efficiency.
(ii) These relative efficiencies of the main effects for the major factors were
combined to obtain the optimum kiln conversion efficiency. The details of the
optimisation process are given in Section 4.6 of Chapter Four.

120
Mass Balance of the Kiln
Based on the simulation results of the optimised kiln, the mass balance to determine
the mass of charcoal produced for each dry ton of wood carbonised is calculated.
Figure 3.1 illustrates the mass inputs and outputs for the simulated charcoal kiln:
Figure 3.1: Major inputs and outputs of the mass balance
INPUT = [Mass of wood] + [Mass of air]
[Mass of wood] = [mass of dry wood] + [mass of water from moisture in wood]
[Mass of air] = [mass of O2 from air] + [mass of N2 from air] + [mass of H2O from air]
The mass of wood is a measured value and the mass of air is determined from other
model data.
The mass of air is extremely limited in this case of carbonisation. The mass balance is
given as:
[INPUT] = [OUTPUT]
OUTPUT = [mass of solid residue] + [mass of non-condensable gases] + [mass of condensable
volatiles]
[Mass of solid residues] = weight of the materials left inside the kiln at the moment
of simulation, i.e. the weight of dry charcoal and ashes produced (Gustan, 2004).
Efficiency of the Kiln
The efficiency of a kiln is defined as the mass of charcoal that a producer obtains from
a kiln expressed as a percentage of the mass of wood the producer initially charged

121
into the kiln. Practically this is the recovery efficiency. The conversion efficiency
includes even the charcoal fines (rejects) that may not be packaged for sale due to their
small size (Hibajene and Kalumiana, 2003a). The efficiency is calculated on fresh, air
or oven dry basis of wood, as follows:
(3.36) M
ME
w
ck
Where Ek Kiln Efficiency
Mc Mass of charcoal produced
Mw Mass of wood charged into the kiln
When quoting efficiencies, one has to state on what basis the masses are indicated in
relation to the moisture content of the wood. The moisture content (MC) of the piece
of wood, on percentage basis, can be calculated as follows:
(i) Wet basis:
(3.37) X100%woodwet of mass
water of MassMC
(ii) Dry basis:
(3.38) X100%dry wood of mass
waterof MassMC
The kiln conversion efficiency, Ekc, is (on wet/air dry basis):
Or on oven dry basis:
) (3.40 100% x wooddry of Mass
charcoal of MassEkc
It has been found through field tests that three percent of the charcoal produced is left
at the kiln site as small pieces that cannot be packaged. Therefore three percent of total
(3.39) 100% x wet woodof Mass
charcoal of MassEkc

122
mass of charcoal produced has to be subtracted from total mass of charcoal produced
in the calculations of the kiln conversion and kiln recovery efficiencies.
Charcoal yield and carbon yield
(Seifritz, 1993) stated that approximately 50 percent of the carbon in the wood (mainly
the trunk and the thicker branches) can be extracted in the form of charcoal composed
of fixed carbon, ash content, volatile matter and moisture. In the process of
carbonization, considerable amount of carbon is emitted to the air. Glazer compiled
past literatures and calculated the average carbon yield of various types of kilns
including a laboratory furnace, and reported a figure of 49.9 percent of carbon yield
on the average (Glazer et al., 2002).
This means that half of the total carbon inside wood raw material will be emitted to
the air or stored in the form of half-carbonized matter which is easily decomposed
(volatile matter). Therefore to raise carbon yield, not only charcoal yield, but also fixed
carbon content must be higher.
Usually, efficiency of charcoal production is indicated by charcoal yield. Figure 3.2
shows the carbon in wood material and pure carbon in charcoal (Gustan, 2004).
Figure 3.2: Carbon in wood material and pure carbon in charcoal

123
Charcoal yield is calculated using formula shown below:
(3.41) (%) content Moisture-100
100 X
100 X (kg) material woodof Weight dry Oven
(kg) charcoal of Weight (%) yieldCharcoal
A
C
Fixed carbon is actually the pure carbon. The fixed carbon content of charcoal is
calculated as follows
(3.42) C
D content matter Volatile -content Ash - 100 (%)content carbon Fixed
Carbon yield’ expresses the percentage of pure carbon derived from wood material
which is preserved in the produced charcoal. Carbon yield is calculated using the
formula shown below:
(3.43) 100 X (%)content Moisture-100
X
100
(%)content carbon Fixed X
(kg) material woodof dry weight Oven X 0.5
(kg) carbon ofWeight (%) yieldCarbon
B
D
100
The above formula indicates that the percentage of carbon in wood material is stored
in produced charcoal in the form of pure carbon. In this equation, it is presumed that
carbon content of wood material is 50 percent as shown in Figure 3.2
3.7 Limitations
The most inherent limitation in the computational fluid mechanics and heat transfer
method applied here are the numerical errors that exist in the computations. These can
cause differences between the computed results and reality. However these errors are
eliminated or minimised by proper analysis and critical judgement on the computed
results.

124
3.8 Conclusion
Overall the numerical method used in this research work involved collection of the
practical field data on major factors influencing the carbonisation process in the
charcoal kiln. The data was collected over a wide representative area of charcoal
production. This data was used as input in the developed numerical model in order to
simulate for the effect of major factors on kiln conversion efficiency.
To realistically complete the mathematical model, the following supporting physical
models were incorporated:
(i) IMMERSOL radiation model,
(ii) Interphase momentum transfer model,
(iii) Interphase heat transfer model,
(iv) Wood drying,
(v) Pyrolysis models.
Using all these parameters as inputs into the numerical model program, the numerical
simulations were carried out to determine the optimum effects of the factors affecting
carbonisation process and kiln conversion efficiency.
List of References
Bagramov, G. (2010). Economy of converting wood to biocoal. Finland, University of Lappeenranta.
MSc.
Boonmee, N. (2004). Theoretical and experimental study of autoignition of wood. USA, University of
Maryland. PhD.
Felfi, F. F., and Luengo, C. A. (2004). Mathematical modelling of wood and briquettes torrefaction
An.5.Enc.Energ.Meio Rural.
Glazer, B., Lehmann, J. (2002). Ameliorating physical and chemical properties of highly weathered
soils in the tropics with charcoal – a review. Biol Fertil Soils. 35: 219-230.
Gomaa, H. and Fathi, M. (2000). A simple charcoal kiln. ICEHM2000. Cairo, Cairo University: 167-
174.
Gronli, M. and Melaaen, M.C. (2000). "Mathematical model for wood pyrolysis - Comparison of
experimental measurements with model predictions." Energy and Fuels 14: 791-800.
Gustan, P. (2004). Charcoal production for carbon sequestration. Demonstration Study on Carbon
Fixing Forest Management in Indonesia, Forest Products Technology Research and Development
Center and Japan International Cooperation Agency.
Hibajene, S. H. (1994). Assessment of Earth Kiln Charcoal Production Technology. Lusaka,
Department of Energy,, Ministry of Energy and Water Development.

125
Hibajene, S. H. and Kalumiana, O. S. (2003). Manual for Charcoal Production in Earth Kilns in Zambia.
Department of Energy, Ministry of Energy and Water Development. Lusaka, Zambia.
Hostikka, S. and McGrattan, K. (2001). Large Eddy Simulation of Wood Combustion. International
Interflam Conference, 9th Proceedings. London, Interscience Communications Ltd,. vol.1, Sept: 17-19.
Kuo, J. T. and Hsi, C. L. (2005). "Pyrolysis and ignition of single wooden speheres heated in high-
temperature streams of air." Combustion and Flame 142: 401-412.
Ragland, K. W., Aerts, D.J. (1991). Properties of wood for combustion analysis. Bioresource
Technology. 37: 161-168.
Rath, J., Wolfinger, M.G. (2003). "Heat of wood pyrolysis." Fuel Vol.82(No.1): 81-91.
Roberts, A. F. (1971). "The heat of reaction during the pyrolysis of wood." Combustion and Flame(17):
79-86.
Seifritz, W. (1993). "Should we store carbon in charcoal? ." Int. J. Hydrogen Energy Vol.18( No.5):
405-407.
Zerbe, J. I. (2004). Energy from Wood. USA, USDA Forest Products Laboratory.

126
CHAPTER 4 NUMERICAL OPTIMISATION OF KILN
CONVERSION EFFICIENCY
4.1 Introduction
This chapter discusses the basic steps taken to set up the numerical model in order to
obtain a numerical solution. The numerical model is characterised in order to
determine the effect of the major factors on carbonisation processes. The simulations
determine the regions in which the optimum values of the major factors occur. The
fundamental principles underlying the simulation of the fluid flow processes preceding
the analysis of the computational solutions are explained.
The chapter describes the nature of the data used in the numerical model for the
simulations. The chapter closes with the method used for optimisation simulations.
4.2 Numerical Method
Intel PHOENICS 2009 solver was used. The finite volume method (FVM) and
iterative method together with convergence acceleration approach were applied to
solve the governing Partial Differential Equations system in integral forms of a series
of physical models for wood pyrolysis.
4.2.1 The discretisation scheme
The charcoal kiln was modelled using a Cartesian coordinate system. Its physical or
computational domain was divided into discrete control volumes (3D cells or mesh)
using rectangular-type grids. This mesh has cells having a hexahedral-shape element
with eight-nodal corner points in three-dimensions. This structured grid generation is
simple and enables the user to adaptively refine the mesh in areas that contain complex
flow structures, such as bends, regions of recirculation zones, inlets and outlets for the
domain.
For the numerical solution, the balance equations are solved in a finite-volume
formulation. The finite volume equations (FVE's) are obtained by integrating the
differential equation over the cell volume to construct the algebraic equation system
for discrete unknowns. Interpolation assumptions were made to obtain scalar values at
cell faces and vector quantities at cell centres.

127
Nomenclature - A compass-point notation system was used, as shown in Figure 4.1.
Figure 4.1: A cell in three dimensions and neighbouring nodes
Where,
P = Cell centre
n, s, e, w, h, l = Neighbour-cell centres
South North = Positive IY
West East = Positive IX
Low High = Positive IZ
An array of cells with the same IZ is referred to as a SLAB.
The finite volume form of the FVE after integration has the form:
(4.1) termssourceaaaaaaaa TLHWESNp TLHWESN
Where:
)continuity(by aaaaaaaa TLHWESNp
The neighbour links, the a's, have the form
(4.2) dt
density x volume
distance
tcoefficien-exchange xarea density x velocity xarea
Which is convection-diffusion transient.
North
High
East
South Low
West
n
h e
s
l
w P
y
z
x

128
Equation 4.2 is cast into correction form before solution. In correction form, the
sources are replaced by the errors in the real equation, and the coefficients may be only
approximate. The corrections tend to zero as convergence is approached, thus reducing
the possibility of round-off errors affecting the solution. The neighbour links increase
with inflow velocity, cell area, fluid density and transport coefficient. They decrease
with internodal distance and are always positive.
The transient phenomena which is always parabolic (i.e. the future does not affect the
past) has been applied in this work. This allows for a marching solution, with only the
current and previous time step values required. Reducing time step size thus does not
increase memory requirements. The solution is achieved by marching through space
in the Y (or J) direction, with considerable saving in memory requirement.
To close the equation set, auxiliary equations were used to provide for:
(i) Thermodynamic properties: density, enthalpy, and entropy
(ii) Transport properties: viscosity, diffusivity, and conductivity
(iii) Source terms: chemical kinetic laws, radiation absorption, and viscous
dissipation.
(iv) Interphase transport: of momentum, energy, mass, and chemical species.
All of the above may be functions of some or all of the other solved-for variables, or
auxiliary quantities, resulting in a highly non-linear set of equations.
A major consideration taken into account in the numerical model is the discretisation
of the convection terms in the finite-volume equations. The accuracy, stability and
boundedness of the solution depended on the numerical scheme used for these terms.
For an engineering problem like the carbonisation processes in the charcoal kiln, the
necessary degree of grid refinement is generally impractical as the upwind-
differencing scheme (UDS) and hybrid-differencing scheme (HDS) are sluggish to
grid-refinement tests. Thus, schemes with higher-order truncation errors than UDS can
be proposed in an attempt to improve resolution. These are Linear Schemes and Non-
Linear Schemes used for both single- and two-phase flows.

129
4.2.2 Pressure-velocity coupling
The momentum and continuity equations are linked, in that the momentum equations
share the pressure. The velocities and pressure enter the continuity equation via the
density in these compressible flows. The coupling between the velocity field and
pressure field is strong to solve the incompressible flows. Because of this assumption
of incompressibility, solution to the governing equations is complicated by lack of an
independent equation for pressure. The task of the CFD codes is to join the variable
without an equation (pressure), to the equation without a variable (continuity). The
PHOENICS code does this by using a variant of the SIMPLE (Semi-Implicit Method
for Pressure-Linked Equations) algorithm by Patankar (1980) namely SIMPLEST
(SIMPLEShorTened) to handle the discretisation of the momentum and continuity
equations with pressure-velocity coupling problems. The SIMPLE uses a relationship
between velocity and pressure corrections to enforce mass conservation and to obtain
the pressure field.
4.2.3 Segregated solution method
The algebraic equations discretised from the governing PDE’s can be solved
sequentially and iteratively by using segregated solution method. Since the governing
equations are non-linear and coupled the iterative method of SIMPLE is used to obtain
a set of converged solutions for unknowns at each grid. The algorithm was originally
put forward by Patankar and Spalding (Patankar and Spalding, 1972). It is essentially
a guess-and-correct procedure for the calculation of pressure on the staggered grid
arrangement. The convective fluxes per unit mass through cell faces are evaluated
from the so called guessed velocity components. Furthermore, a guessed pressure field
is used to solve the momentum equation and a pressure correction field which is in
turn used to update the pressure and velocity fields. As the algorithm proceeds the aim
is to progressively improve the guessed field. The process is iterated until convergence
of the velocity and pressure fields is achieved. Appendix P illustrates the solution
procedure.

130
4.2.4 Convergence and Accuracy
Practically, there are no standard measures to judge convergence. Therefore
convergence is difficult and indirectly established. However, for most practical
problems, the convergence criterion can be set such that the scaled residuals drop three
orders to 10-3 for solved equations (for energy equation, the convergence criterion is
10-6).
Two sources of error arise from the discretisation error:
(i) Difference between analytical solution of governing PDE and exact solution of
discretised algebraic equation.
(ii) Numerical error which is the difference between numerical solution and exact
solution of discretised algebraic equation.
If the discretization error shrinks in progression of refining the mesh, the discretization
scheme is consistent. While, if the numerical error p in the cell P shrinks in the
iterative procedure from step n to n+1, as
(4.3) 1
1
n
p
n
p
Then the numerical solution is stable. (Dahlquist, 1956) proved that a linear multistep
scheme is convergent if and only if it is consistent and stable. However, for the
practical combustion problems, the governing PDEs are highly non-linear, so there are
no universal measures for judging convergence. Instead, in order to obtain the
physically realistic results and stable iterative solutions, the discretisation scheme
should possess three properties of conservativeness, boundedness and transportiveness
(Patankar and Spalding, 1972, Versteeg and Malalasekera, 1995). For
conservativeness, the flux of the transported through a common face must be in a
consistent manner of the same expression in adjacent control volume. For
boundedness, all coefficients of the discretized equations should all be positive, and in
the absence of sources the internal nodal values of the variable should be bounded
by its boundary values. For transportiveness (Roache, 1976), the discretized scheme
should be able to recognise the direction of the flow or the strength of convection
relative to diffusion by the measure of cell Peclet number, Pe, as

131
(4.4) / x
u
diffusion
convectionpe
Where, x is the cell width.
It can be shown that upwind schemes possess these three properties, thus they are
highly stable. While, the QUICK scheme may be unbounded under certain flow
conditions, thus it is conditional stable.
It is apparent that there are two ways to enhance the solution accuracy by using higher-
resolution discretization (refining the mesh) or/and using the higher-order schemes. In
principle, one may refine the mesh until the numerical solution becomes grid non-
sensitive (grid-independent). For higher-order schemes, the second-order upwind
scheme and the third-order QUICK scheme can be applied. However, for a large mesh
case, the higher-order schemes will cost more computational time and may be less
stable. Therefore, in practice, a balance among the convergence, accuracy and
computational source is considered and evaluated (Wei, 2000).
4.3 Numerical Experiments Design
In order to perform these multifactor numerical simulations efficiently, the
experimental strategy used extensively in practise was employed. This is the classical
method of approach of one-factor-at-a-time. This method is invariably used in
science research as it helps determine cause and effect of factors on a parameter of
interest in this case the conversion efficiency. This approach actually requires that the
appropriate data is initially collected which would result in valid and objective
conclusions.
Factors, Levels and Ranges
For the factors screening; that is, characterisation of the carbonisation process, the
number of factor levels was kept as low as from two levels to even higher levels. The
regions of interest that is, the ranges were made broad enough as shown in Table 4.1.
Some fixed factors were determined or rather fixed by the physical situation of the
factors. The normal level was taken as representing the standard value or the baseline
measurement of the factor.

132
The fixed factors were simulated to characterise the carbonisation process in the kiln.
Fixed factors levels were as high as five and each factor was varied while keeping all
other factors fixed. The characterisation of the fixed factors was mainly to determine
the individual effects of each factor (or the main effects) on the conversion efficiency.
The main effect results from change of level of a primary factor of interest in the
simulation.
Table 4.1: Ranges and Levels for Major Factors Simulations
SNo. Factor Units Simulation Range Standard
Value Levels
Low High
1. Variable Factors
1. Density of
Wood kg/m3 450 1250 600 5
2. Diameter of
Log m 0.05 0.5 0.3 5
3. Length of Kiln m 6 20 7 7
2. Fixed Factors
1. Length of Log m 1 3 3 3
2.
Moisture
Content of
wood % 12 36 20 5
3. Wood
Arrangement Direction
Cross
wise
Longitu
dinal - 2
4. Wood
Distribution Direction
Large
Bottom - - 1
5. Wall thickness m 0.1 0.6 0.4 3
6. Wind direction Orientation Along
wind
Against
wind - 2
3. Uncontrollable Factors
1. Temp.,
ambient °C - - - -
2. Pressure,
ambient Pa - - - -
3. Humidity % - - - -
4. Heating rate o
C/min - - - -
5. Residence time Hours - - - -
The density values used refer to only hardwoods commonly suitable for charcoal
making in earth kilns (Desch and Dinwoodie, 1996). The moisture content (MC) of
fresh felled wood is around 60 percent. The average wood moisture content on wet
weight basis is 36 percent and on dry weight basis it is 20 percent. Wood can be dried
to as low as 12 percent moisture content (Desch and Dinwoodie, 1996). The standard
kiln size in Zambia falls in the range 39–60 m3 despite the abnormal sizes found in

133
Mumbwa area (Hibajene, 1994, Foley, 1986). The standard kiln size from field data
collected for this research was about 42 m3 (7 m length x 3 m wide x 2 m high).
The Kiln Carbonisation Efficiency
The kiln conversion efficiency was chosen as the response variable because it is
certainly the variable that practically provides useful information about the efficiency
of the carbonisation process under study in the kiln. This subsequently determines the
yield of charcoal per woody biomass charged in the kiln.
The Simulations Design
The sample size (or number of replicates) was kept at one per run since numerical
experiments almost always produce the same results per set input programme. The
running order of the simulation trials was planned logically according to the
carbonisation process itself.
4.4 Numerical Setup of Earth Kiln
4.4.1 Creation of Kiln Geometry
The flow region (i.e. the computational domain) for the numerical calculations was
created and its geometry defined. The air and subsequently gases from carbonisation
process flow between the stationary woodlogs in the kiln enclosure. They flow in
through a firing hole made in the end wall of the kiln. The woodlogs have the same
length as the internal width of the kiln domain. It is assumed that the width of the flow
within the three-dimensional physical domain is sufficiently large in order that the
flow is taken to be invariant along this transverse direction.
The initial numerical model developed in this study considered a transient, three-
dimensional flow in a rectangular kiln of dimensions representing a standard kiln:
Length of kiln, Lk = 7 m
Height of Kiln, Hk = 2 m
Width of Kiln, Wk = 3 m
This results in a total kiln volume Vk, of 42 m3. The kiln comprised wooden logs
initially stacked in a crosswise arrangement.

134
The logs parameters were as follows:
Log diameter, Dl = 0.3 m.
No of logs, Nl = 155
Length of logs Ll = Wk = 3 m
The foregoing translates into a total logs volume, Vl = Nl (π Dl2/4)*Ll of 32.868 m3,
and consequently the volume porosity of solid material ɛs = Vl//Vk of 0.782.
Figure 4.2 illustrates the physical and computational solution domain.
(a)
(b)
Figure 4.2: Kiln (a) Physical Domain and (b) Computational Domain
7 m
2 m
3m
Inlet
firing hole
Woodlog x 2 Wooden stringers
x 8 Outlets of 0.25 m each

135
The domain extends 0.5 m both upstream and downstream of the rectangular wood
stack, which gives a total kiln length of 7 m in the z-direction. In the other two
coordinate directions the domain boundary coincides with the outer surfaces of the
kiln.
4.4.2 Generation of kiln Grid
Subdivisions of the domain into a number of smaller, non-overlapping subdomains
were made in order to solve the flow physics within the kiln geometry. This generated
the mesh (or grid) of cells (elements or control volumes) overlaying the whole kiln
geometry. The fluids flow of interest are described in each of these cells and solved
numerically so that the discrete values of flow properties (pressure, velocity,
temperature and the other transport parameters of interest) are determined. This
determines the solution to the flow problem being solved. The larger the number of
cells the more accurate the solution obtained.
Spatial and temporal computational mesh
A one-dimensional transient simulation was initially performed in the z-direction. A
total of three cells were used, one upstream of the bed, one downstream, and one within
the bed itself. The details of the temporal mesh were:
Duration of transient: 2 days
Size of Time Step: 1 hour
No of time steps: 48
Numerical studies aimed at assessing the grid and time-step sensitivity of the solutions
were then carried out leading to further improvement of the numerical solution.
4.4.3 Selection of Physical and Material Properties
This study of the carbonisation process for improvement of the conversion efficiency
required solution of very complex physical flow processes of complicated chemical
reactions in combusting fluid flows and wood pyrolysis. These physical flow processes
strongly influence the local and global heat transport, which consequently affect the
overall fluid dynamics within the kiln. Appendix Q shows the flowchart highlighting
the roadmap of the various flow physics encountered within the framework of CFD
and heat transfer processes in the charcoal kiln.

136
Physical Properties
(i) Gas phase
The gas density is computed from the ideal gas law, as follows:
(4.5) RT
p
Where p is the pressure, T is the gas-phase temperature in K, and R is the gas constant
for the mixture determined from:
(4.6)
h
h
v
v
a
ao
M
Y
M
Y
M
YRR
Where Ro is the universal gas constant in J/kg-mol K, and Ma, Mv and Mh are the
molecular masses of air, volatiles and water vapour, respectively. The values used are
Ma=29 kg/kg-mol, Mv=16 kg/kg-mol and Mh=18 kg/kg-mol.
For simplicity, the specific heat of the gas phase is taken as Cpg = 1004 J/kg K, but
later a temperature dependent specific heat capacity is applied. The gas thermal
conductivity is given by kg=6.3.10-5*Tg+7.34.10-3 W/m K.
(ii) Solid-phase
Cps = 2400 J/kg K
Ks = 0.15 W/m K
The initial solid density is taken as s = 600 kg/m3, and thereafter it is computed from
the solid-phase continuity equation (3.2) during the course of the simulations..
4.4.4 Initial and Boundary Conditions
The appropriate boundary conditions that mimic the real physical representation of the
fluid flow into a solvable CFD problem were defined. These are permissible boundary
conditions that were available for the charcoal kiln simulations. They are suitable fluid
flow boundary conditions accommodating the fluid behaviour entering and leaving the
kiln. Appropriate boundary conditions were assigned for the external stationary solid
earth wall boundaries bounding the flow geometry and the surrounding walls of the
woodlogs within the kiln flow domain.

137
Initial Conditions
The iterative procedure used requires initialisation of all the discrete values of the flow
properties and other transport parameters of interest before computing the solution.
Though theoretically the initial conditions can be purely arbitrary, practically they are
intelligently imposed to accelerate convergence and have shorter computational time.
This avoids misbehaving of the iterative procedure and possibly its “blowing-up” or
diverging.
The initial conditions for the transient simulation are summarised below:
Solid phase
Wood temperature = 20oC.
Wood moisture content, Yw0 = 0.15.
Mass fraction of raw wood that is volatile matter, Yvs0 = 0.15.
Mass fraction of raw wood, = 0.85.
Wood density, s0 = 600 kg/m3.
Gas phase
The initial relative humidity of the air, Rh = 14.0%.
Gas temperature, Tg0 = 20oC.
Gas velocity = 0 m/s.
The initial mass fraction of water vapour Yh0 in the air-vapour mixture is computed
from the specified humidity and temperature, as follows:
(4.7)
10
hd
hdh
Y
YY
Where Yhd is the mass fraction of water vapour per unit mass of dry air:
(4.8)
0
0
va
vhhd
pPM
pMY
Where P is the pressure, and pv0 is the partial pressure of the vapour and psv0 is the
Saturation vapour pressure, given by:

138
.9)(4
C
TB/AexpPp
273g0
sv0
Where A=20.386, B=5132.0 and C=760.0.
Ignition source
For simplicity, the firing of the kiln is achieved artificially by introducing a heat source
into the airstream upstream of the fixed bed of woodlogs as follows:
0 to 14 hours - linear from 0.2 MW to 0.7 MW
14 to 48 hours - uniform at 0.7 MW.
This heat source is uniformly distributed over the kiln inlet area of Wk=1.5m by
Lk=10m initial size opening.
Inlet Boundary Conditions
The air stream approaching the kiln is assigned the following conditions:
Air relative humidity of the air, = 14.0 %.
Air temperature = 20 oC.
Air inlet velocity = 5 m/s.
Outlet Boundary Conditions
The outlet boundary is initially located downstream of the kiln, and a fixed pressure
condition was used at this boundary. In the later final models the outlets were located
on the sides and end of kiln all of similar size and positioned at kiln mid height. Refer
to kiln geometry diagram.
4.5 Simulations of Wood Pyrolysis
4.5.1 Wood drying
The drying of wood was treated as an interphase mass transfer process of removing
water from the woodlogs. The Arrhenius drying model was used with a specified
Arrhenius drying rate. The expression is as given in Eq. (3.30) with its associated
parameters as described.
The wood drying rate was in kg/s/m3. Water heat of vaporisation of 2.257 x 10⁶ kJ/kg
together with a gas constant of 8.31443 J/mol K was used. For simplicity, Arrhenius

139
expression was used and it was assumed that the log-surface temperature was equal to
the solid temperature.
4.5.2 Wood-Pyrolysis kinetics
A simple single-step, global, endothermic reaction is employed to model the wood-
pyrolysis kinetics.
(4.10) )/exp( 00, spvsrspsp TREYYA
Where the pre-exponential factor Ap = 5.4.106, the activation energy Ep = 121kJ/mol,
the universal gas constant, R0 = 8.31443 J/mol K, and Yr is the mass fraction of raw
wood. This simple model is useful for providing a rough account of the generation of
volatiles and char.
4.6 Optimisation of Major Factors Affecting Carbonisation
4.6.1 Geometrical variation
Only rectangular kilns were modelled as there was no other kiln shape found in the
field survey. These other kiln shapes expected in the field were the dome-shaped,
round kiln, earth-pit or conical kiln. It is obvious from these kiln types that their shapes
could pose a challenge in construction.
To study the effect of kiln size, the length of the kiln was varied from less than standard
kiln length to more than that length. The height of the kiln was fixed to a standard two
meter high for reason of enabling the charcoalers to cover the top of the kiln with
insulating grass, leaves and earth at ease. The kiln width was also fixed to a standard
3 m wide. This width minimises the tedious work of cutting several shorter pieces of
logs. A minimum log length of 2 m was used. Such log sizes are easy to move to the
kiln site in any terrain and easily rolled on to the wood pile.
Therefore only the kiln length and kiln width were parametrically studied for their
effect on the kiln conversion efficiency. The kiln length was varied from 3.5 m to 21
m in seven steps. The kiln width was varied from 1.5 m through to 3 m in seven steps.

140
4.6.2 Wood characteristics variation
From the field survey suitable woods for charcoal making were assessed by their
heaviness, hardness, strength and durability. Almost all these properties are closely
associated with the density of the wood. Another parameter used by the charcoalers to
enhance higher conversion efficiency is the moisture content of the wood. Therefore
in this work only the density (s) and moisture content (MC) of the wood were
simulated for their effect on the kiln conversion efficiency.
The study of only these two factors is justified in that they have been used as criterion
for choosing suitable wood for charcoal making over a long time and have always
given expected results according to the charcoal producers’ experience. Variation of
the woodlog diameters were also simulated for their effects on kiln conversion
efficiency.
4.6.3 Wood arrangement variation
Only the crosswise and longitudinal wood arrangements in the kiln were
parametrically studied for their effect on the kiln conversion efficiency as illustrated
in Figure 4.3.
(a) (b)
Figure 4.3: Woodlogs Arrangement (a) Crosswise and (b) Longitudinal

141
There was no single case found in the field where a kiln was loaded with wood in the
vertical position, conical position or circularly.
Not only due to lack of vertically loaded kilns in the field was this kind of arrangement
not studied but also nothing about it has been reported in the literature. The most
practical reason for the non-practise of such kind of wood arrangement is the difficulty
it can present in terms of construction and stability of the vertical wood pile and the
difficulty to cover the wood pile with earth insulation.
4.6.4 Wood logs Distribution Variation
Only one type of wood distribution in the kiln was modelled though theoretically three
forms of the wood distribution can be envisaged both in crosswise and longitudinal
arrangements. First case can constitute large wood logs at the bottom of the pile
followed by medium diameter woodlogs in mid-height of kiln while the upper half can
have small diameter woodlogs as shown in Figures 4.4(a) and 4.5(a). In the second
model, the wood pile can have smaller logs at the bottom followed by large diameter
logs in the mid-height of the kiln while the upper part can have again the smaller
diameter woodlogs Figures 4.4(b) and 4.5(b). In the third model, the wood pile can
have smaller logs at the bottom followed by medium diameter logs in the mid-height
of the kiln while the upper part can have the large diameter woodlogs Figures 4.4(c)
and 4.5(c).
In the field a variation of the wood distribution was observed where the large diameter
logs could be located either half way the kiln length or to either ends of the kiln. The
common trend was that large diameter logs were stacked at the bottom or near the
bottom of the wood pile and small ones at the top as shown in Figure 4.4. (a).

142
(a)
(b)
(c)
Figure 4.4: Cross Loading (a) Large logs at bottom (b) Large logs at middle and (c)
Large logs at top

143
(a)
(b)
(c)
Figure 4.5: Longitudinal Loading (a) Large logs at bottom (b) Large logs at middle
and (c) Large logs at top

144
4.6.5 Operating parameters variation
The only two important operating parameters of heating rate and residence time of the
solids (wood and charcoal) and gases (volatiles and non-volatile) in the kiln could not
be controlled. The heating rate depends on a lot of factors of which their combination
is impossible to control but instead follow their own course. The residence time is
determined by the completion of the carbonisation process in the kiln. This is observed
from collapsing of the kiln in size. This process cannot be controlled neither.
These two parameters are of very significant importance during the carbonisation
process. Their control is dependent on the kiln operator or rather it falls under kiln
management. Most important is that to date no models have been developed for the
heating rate and residence time.
4.6.6 Insulating earth wall thickness
The kiln insulating earth wall basically minimises loss of heat from the kiln during
wood carbonisation process. It also prevents air leaking into the kiln which can lead to
complete combustion of the wood or charcoal produced. This sealing from air leaks
depends on the type of soil and how the walls are constructed. Therefore it is important
that the wall thickness is optimal to maintain the optimal heat in the kiln as well as
keep out unwanted air to enhance carbonisation in kiln. Figure 4.6 illustrates the
insulations.
Figure 4.6: Insulating Earth Wall Thickness

145
4.6.7 Kiln Orientation to Prevailing Wind Direction
In the field it was observed that the charcoal producers always constructed their kilns
in a certain direction related to the prevailing wind direction. Therefore the numerical
simulations had to take account of this phenomenon. During data collection the wind
direction at each kiln site was taken and firing point location on kilns noted as shown
in Figure 4.7. Hence the effect of the prevailing wind direction in relation to firing
point had to be established.
(a) (b)
Figure 4.7: Kiln orientation (a) Against wind direction and (b) Along wind direction
4.7 Optimisation of the Kiln Conversion Efficiency
4.7.1 Combining optimised major factors
It is important to note that each of the factors affecting kiln conversion efficiency was
simulated individually while the other factors were held constant. This can result in
wrong effects being obtained. This is very true in that in the practical kiln all the factors
are at play at the same time during the carbonisation processes. Therefore the final
results obtained are due to the sum total of all factors at play. This calls for the use of
statistical methods of Response Surface Method (RSM) to design the numerical
experiments for multifactor simulations.
The RSM method has its own inherent drawbacks. Large variations in factors can be
misleading. It sometimes fails to define or specify critical factors. It does not define
the optimum if the range of levels of factors is too narrow or too wide. Method‘s over
reliance on computer might not make sure the results make good sense. Therefore the
practical classical one-factor-at-a-time approach was employed as it surely gives the
cause and effect for each factor at play and their product gives the overall effect.
Firing hole position Firing hole position
Prevailing wind direction Prevailing wind direction

146
4.7.2 Optimisation of the Kiln
The optimised variables and fixed factors relative conversion efficiencies were used
to calculate the optimal kiln conversion efficiency and charcoal yield. The following
logical sequence of the numerical simulations was applied:
(i) The most suitable wood for charcoal production was characterised by
simulating the wood density through the hardwoods density range.
(ii) The most suitable wood species density determined in (i) was then used to
determine the optimal wood moisture content through simulations across
the wood moisture content range.
(iii) To determine the suitable woodlog arrangement and diameter distribution,
the suitable wood species with optimal moisture content was simulated in
cross-wise and longitudinal arrangements for various wood diameters
distributions. The wood pile or stack normally comprises small, medium
and large diameter logs.
(iv) The best woodlogs setup in (iii) had its kiln width and length characterised
through simulations of the range of widths and lengths.
(v) To characterise the earth wall thickness, the characterised wood pile made
up of suitable wood type of optimal moisture content, suitable woodlog
length and kiln length was used to characterise the thickness of the
insulating earth wall.
(vi) The effect of prevailing wind direction in relation to kiln firing point was
determined by simulating the characterised wood pile covered in suitable
earth insulating wall thickness against and along the prevailing wind
profile.
(vii) Finally the kiln model was tested for grid independence and iterations
independence.
4.7.3 Kiln efficiency calculation
The kiln conversion efficiency was finally determined from the product of the relative
charcoal fractions produced. It is important to note that in a numerical simulation it is
assumed that there are no charcoal fines and brands. In the numerical model all the
charcoal is assumed to be solid lumps and completely carbonised in the kiln.

147
List of References
Dahlquist, G. (1956). "Convergency and Stability in the Numerical Integhration of Ordinary Differential
Equation." Math. Scand. 4: p. 33-53.
Desch, H. E. and Dinwoodie, J. M. (1996). Timber: Structure, Properties, Conversion and Use. 7th ed.
.London, Macmillan Press Ltd: 306p.
Foley, G. (1986). Charcoal Making in Developing Countries, Technical Report No. 5. Earthscan
London, International Institute for Environment and Development.
Hibajene, S. H. (1994). Assessment of Earth Kiln Charcoal Production Technology. Lusaka,
Department of Energy,, Ministry of Energy and Water Development.
Patankar, S. V. (1980). Numerical heat transfer and fluid flow, . New York, Hemisphere Publishing
Corporation, Taylor & Francis Group.
Patankar, S. V. and Spalding, D. B. (1972). "A Calculation Procedure for Heat, Mass, Momentum
Transfer in Three-Dimensional Parabolic Flows " Int. J. Heat Mass Transfer Vol. 15: 1787-1806.
Roache, P. J. (1976). Computational Fluid Dyanamics. Albuqerque, New Mexico, Hermosa.
Versteeg, H. K. and Malalasekera, W. (1995). An Introduction to Computational Fluid Dyanamics, The
Finite Volume Method, Prentice Hall, Pearson Education Ltd.
Wei, D. (2000). Design of Advanced Industrial Furnaces Using Numerical Modeling Method Heat and
Furnace Technology Department of Materials Science and Engineering. Stockholm Sweden, Royal
Institute of Technology. PhD.

148
CHAPTER 5 RESULTS AND DISCUSSIONS
In this chapter, the effects of the major factors on the kiln conversion efficiency were
obtained, plotted, analysed and discussed. The objective of the research was to
improve the conversion efficiency of the earth kiln using a numerical method by
parametrically studying the effects of the major factors on the carbonisation process
towards improving the kiln design features and efficiency of charcoal production.
Several major factors of influence were identified. The selection of these factors
studied was based on:
(i) Factors considered being influential on conversion efficiency by
charcoal producers in the field;
(ii) Charcoal producers strong feelings that only factors that can be
changed were worth studying for their effects on conversion efficiency;
and
(iii) Capabilities of the PHOENICS CFD software used for numerical
modelling and simulations;
Based on these reasons, the following major factors were therefore selected for the
study:
(i) Density of the wood;
(ii) Moisture content of the wood;
(iii) Diameter of the wood logs;
(iv) Weight distribution and arrangements of the wood logs;
(v) Size of the kiln in terms of width and length;
(vi) Thickness of earth insulating wall; and
(vii) Direction of carbonisation in relation to prevailing wind direction.
In this chapter, the relative charcoal fraction is the amount of charcoal produced from
1 unit of raw wood as related to the particular optimised factor of influence. This
relative charcoal fraction is taken as only the relative conversion efficiency of the
kiln and not overall conversion efficiency.

149
The chapter includes comparison of the model results so obtained with related results
from field observations and literature experimental results.
5.1 Computational Details
Table 5.1 summarises the computational details used for simulations in the numerical
model. These are the number of cell divisions in the x-, y-, and z-coordinate directions,
the number of calculations runs, the time taken to complete the simulation, the time
step duration and number of time divisions.
Table 5.1: Computational Details
Parameter Value Applied
Grid mesh 9 x 25 x 17
Iterations 500
Duration of
Transient 1447200 hrs. (16.75 days)
Size of Time step 6.7 hour
Number of time
steps 60
The Figure 5.1 (a) and (b) shows the model grid mesh distribution in the Y-Z- and X-
Z planes respectively.
(a)
(b)
Figure 5.1: Grid mesh (a) Z-Y Plane (b) Z-X Plane

150
5.1.1 Consistency
The consistency for the simulations was achieved by making the truncation error close
to zero when the time step t 0 and or mesh spacing x, y, and z 0. The
truncation error is the difference between the discretised equation and the exact one.
5.1.2 Stability
The stability of the numerical solution here concerned the growth or decay of errors
introduced at any stage during the computation. These are not errors of incorrect logic
but they are errors occurring due to rounding off at every step of computation due to
the finite number of significant figures the computer hardware can accommodate as
well as a poor initial guess. In this transient simulation, the solution did not diverge
hence stability was achieved.
5.1.3 Convergence
The CFD computational solution was characterised by convergence of the iteration
process and grid independence. Simulations were started on coarse grids and low
number of iterations and refined until the solution stopped changing. This coupled with
the consistence and stability resulted in a converged solution i.e. solution of the system
of algebraic equations approaching the true solution of the partial differential equations
having the same initial and boundary conditions as the refined grid system.
Figure 5.2 shows a typical converging monitor plot from the model kiln simulations.
Figure 5.2: Typical convergence monitor plot

151
5.1.4 Accuracy
The truncation error provided a means of evaluating the accuracy of the solution of the
partial differential equations. Since the grid was fine enough and the initial and
auxiliary boundary conditions were true enough, the order of the truncation error
coincided with the order of the solution error.
5.1.5 Efficiency
Computational efficiency was achieved using the capability of the single processor
computer. It had adequate gigabytes (500 GB) and speed (2.67 GHz) to allow
construction of high-quality grids which resolved the physical-flow structures of the
earth charcoal kiln domain.
5.2 Effect of Properties of Wood
Only the important wood properties of density and moisture content thought to
influence the carbonisation process in the kiln were simulated for their relative effects
on the kiln overall conversion efficiency. In both cases, a standard kiln of dimensions
2 m high x 3 m wide x 7 m long crosswise loaded with wood logs of uniform diameter
of 0.3 m was used to model the simulations.
5.2.1 Density of wood
The wood density affects the final product composition and charcoal yield. For
conversion in the large diameter wood logs (intra particle heat transfer control) wood
density mainly affect the activity of secondary reactions of tar vapours and conversion
time. Wood density only affect the conversion time in small diameter wood logs
(external heat transfer control) (Di Blasi, 1997). Interestingly, it was reported by
Chaurasia and Babu that density has no influence on the pyrolysis time (Chaurasia and
Babu, 2004).
Generally kinetic models in wood pyrolysis follow lumped parameter approach.
Practically kinetics of wood depends on the decomposition rates of the main
components caused by the wood species and also with respect to fractions of the
different major components, chemical composition of each constituent and presence
of inorganic components, which can catalyse thermal degradation reactions
(Raveendran et al., 1996).

152
Though wood has both chemical and physical properties, only its physical property of
density was studied in this work as it is easy to control in the field by simply choosing
wood of a particular species. The wood density can differ according to wood species.
Figure 5.3 depicts the model results of the plot of the change of density of wood and
the resulting relative charcoal fraction. Changing the density from 350 kg/m3
(softwoods) to 1250 kg/m3 (hard woods) did not change the relative charcoal fraction
of 0.32 at all. This agrees with S.H Hibajene’s observations in the field that changing
the wood species did not change the charcoal yield (Hibajene, 1994).
Source: Model results.
Figure 5.3: Relative charcoal fraction versus wood density in an earth kiln
It can be observed that density is the amount of matter in a specific volume, therefore
during wood conversion, the density changes due to loss of gaseous and volatile
components of the wood raw material. Physically the produced charcoal then is
expected to shrink in volume and mass. Charcoal formed from denser wood does not
burn easily in the kiln, thus more charcoal is retained and thus recovered. Charcoal
from less dense wood easily burns in the kiln and thus can reduce the charcoal yield.
Di Blasi et al. (2001) found that qualitatively different wood varieties present same
behaviour and similar process dynamics when internal heat transfer is the controlling
mechanism (Di Blasi et al., 2001). Quantitatively the differences remain large in terms
of temperature profile, product yields and average devolatilisation rate. Different
0
0.1
0.2
0.3
0.4
0.5
300 500 700 900 1100 1300
Rel
ati
ve
charc
oal
fract
ion
Wood density (kg/m3)

153
thermal diffusivities observed among wood varieties may have influenced in this
regard (Shen et al., 2007).
Hibajene (1994)’s field observations with the charcoal producers were that different
wood species of different densities did not result in higher kiln conversion efficiencies
when same quantities of wood were carbonised in an earth kiln.
5.2.2 Diameter of wood log
The wood geometry has certain influence on pyrolysis. Heat and mass transfer rates
are highly affected by the wood structure (Di Blasi, 1998). Large diameter wood logs
imply large thermal gradients and also the fluid residence times are sufficiently long
to result in secondary reactions (Bamford et al., 1946a, Chan et al., 1985b). The time
required for complete conversion of pyrolysis varies in wood slabs, spheres and
cylinders (Chaurasia and Babu, 2004).
In Figure 5.4 from the model results it can be observed that both cross loaded and
longitudinal loaded kilns have their relative charcoal fractions reduced as the diameter
of the logs increase. The model results in Figure 5.4 also show that the longitudinally
loaded kiln performs better than the cross loaded kiln.
The reduction in relative charcoal fraction in both cases is due to increased path of heat
conduction, evaporation and pyrolysis front. This results in a lot of uncarbonised wood
which reduces charcoal yield.
Grain orientation is an important parameter in pyrolysis due to the anisotropicity
resulting from it. (Roberts, 1971c) found out that permeability for flow along the grains
is 104 times that across the grain. Similarly thermal conductivity along the grains is
twice that across the grains. To a large extent, secondary reactions occur as the
intensity of the heat flux is increased and for perpendicular grain heating (Di Blasi,
1996).
In this numerical model it was established that a medium diameter log of say 0.25 m
will still give a relative charcoal fraction of 0.491 although small logs of diameter 0.05
m can yield as high as 0.928 relative charcoal fraction. It would not be practical in the
field to only use this small diameter sizes of logs as trees are made up of different sizes
of branches of woods. It can result in wastage of larger diameter logs. Blending of a

154
range of small and medium diameter woods in the kiln would still result in better
charcoal yield.
Source: Model results.
Figure 5.4: Relative charcoal fraction versus diameter of wood log
In the field the woods are grouped into three diameter sizes as small (< 0.15 m),
medium (0.15 m– 0.30 m) and large (> 0.50 m). The common practise in the field is
that small and partly medium sized woods are left on the floor to decompose. This
should not be the case as the model results in Figure 5.4 show that small and medium
diameter logs result in improved charcoal yield.
5.2.3 Moisture Content of Wood logs
The moisture content of the wood can be reduced from 60 percent for freshly failed
wood down to 12 percent either by drying in the air or in the oven. In the field air
drying can only bring down the wood moisture content to a range of 30-20 percent
depending on the period of drying. In an oven the wood moisture content can be
reduced to 12 percent.
0
0.2
0.4
0.6
0.8
1
0 0.1 0.2 0.3 0.4 0.5 0.6
Rel
ati
ve
charc
oal
fract
ion
Diameter of wood log (m)
Crosswise loading Longitudinal loading

155
The research model results in Figure 5.5 show that as the moisture content in the wood
was reduced from 35 percent to 12 percent the relative charcoal fraction increased from
0.272 to 0.577 respectively.
Source: Model results.
Figure 5.5: Relative charcoal fraction versus moisture content of wood
The presence of moisture content slows down the surface temperature rise due to the
consumption of large portion of energy for moisture evaporation. Moisture content in
the fuel affects solid internal temperature history due to endothermic evaporation. In
some cases moisture leads to cracking of the surface, while the total heat transfer
remains the same, whereas heat is transported more quickly to the interior due to the
presence of cracks on the surface. Internal failures result in changed local porosity and
permeability, affecting fluid flow inside.
In the field green logs are dried for periods depending on the season and/or the
economic status of the charcoal maker. The charcoal makers in Hibajene’s field work
observed that moisture content in the wood did not affect the charcoal yield
significantly or not at all (Hibajene, 1994).
Hibajene (1994) during his field work found that the moisture content of wood had
only a small effect on the yield and the quality of charcoal in his investigation. His
discussions with the charcoal makers in the field revealed that moisture content does
not affect the charcoal yield. This is contrary to findings in this research. According to
the charcoal makers perception carbonisation still takes place whether the wood is wet
0.2
0.3
0.4
0.5
0.6
10 15 20 25 30 35
Rel
ati
ve
charc
oal
fract
ion
Moisture content of wood (%)

156
or dry, but they don’t observe that there is slight loss of charcoal production and
delayed carbonisation process when the wood is wet.
On average in the field the moisture content of the fresh wood was 57 percent and that
of the dry wood was 26 percent (on dry basis).
Hibajene in his field work found that on a dry basis the dry wood kilns gave a slightly
higher charcoal yield. His results are consistent with expectations, as other studies
(FAO, 1987), (Ranta and Makunka, 1986) indicate that dry wood gives a higher yield
than fresh wood. A kiln loaded with fresh wood burns some of the wood to provide
heat for drying the wood prior to carbonisation (FAO, 1987). This reduces the quantity
of wood available for carbonisation and, therefore, leads to lower yield of charcoal.
5.3 Effect of Kiln Design
The avaerage kiln size recorded in central Zambia is 33.6 m3 as reported by Serenje et
al. (1993) , while (Ranta and Makunka, 1986) mention a volume of 20 m3 as the
ordinary size of a kiln. Other studies have found even larger kiln sizes. For World Bank
1990 study, 34 m3 was reported (World Bank/ESMAP, 1990). Chidumayo (1984)
reported 51 m3 (range 39-60 m3 for different parts of Zambia) (Chidumayo and
Chidumayo, 1984).
In this study, in the field for central and copperbelt parts of Zambia, the evrage kiln
size or standard kiln was established to be 7 m long x 3 m wide x 2 m high.
5.3.1 Width of Kiln
The width of the constructed kiln in the field depends on the available trees sizes.
Shorter trees provide shorter logs and vice versa. Very few tall trees are cut down for
the purposes of making charcoal, therefore very few or no kilns of width more than
3.0 m could be found in the field. The kiln widths modelled here ranged from 1.5 m to
3.0 m wide.
The model results in Figure 5.6 show that for both crosswise and longitudinal loaded
kilns, the relative charcoal fraction was extremely poor (0,032) for a 1.5 m wide kiln
but 0.928 for the 2.0 m wide kiln. For kiln widths of 2.5 m and above, the relative
charcoal fraction for the crosswise loaded kiln kept decreasing as the kiln width was

157
increased while for the longitudinally loaded kiln the relative charcoal fraction did not
change with increasing kiln width.
Source: Model results.
Figure 5.6: Relative charcoal fraction versus kiln width
Small width kilns are prone to lose their heat quickly through conduction and
convection through the closely distanced walls. Such small width kilns require
frequent supervision (Hibajene, 1994). For broader width kilns, the wide apart walls
tend to retain the heat in the kiln chamber.
The model results in Figure 5.6 show that an optimum kiln width fall in the range of
2.0 – 2.5 m. the results shows that for kiln width of 2.5 m and above, longitudinal
loading is better.
The size of a kiln has an effect on the efficiency of carbornisation. Big kilns give a
higher yield of charcoal. Hibajene (1994) made similar observations in his field work.
5.3.2 Length of Kiln
Based on model results, Figure 5.7 shows the relative charcoal fraction variance with
kiln length for both cross loaded and longitudinal loaded kilns. The relative charcoal
fraction ranges from 0.85 to 0.95 for the two types of wood loading. Both types of
loading were tested for kiln lengths from 3.5 m to 21.0 m. For the cross loaded kiln
0
0.2
0.4
0.6
0.8
1
1 1.5 2 2.5 3 3.5
Rel
ati
ve
charc
oal
fract
ion
Kiln width (m)
Crosswise loading Longitudinal loading

158
the relative charcoal fraction averaged 0.871 over the kiln length range. The
longitudinal loaded kiln relative charcoal fraction averaged 0.940 over the kiln length.
Source: Model results.
Figure 5.7: Relative charcoal fraction versus kiln length
The length of a kiln in the field does not really seem to matter to the charcoal makers
as they claimed it had no effect on the charcoal yield (Hibajene, 1994). The fact is that
the longer the kiln simply means there is more wood to carbonise to charcoal in the
kiln. Larger kilns, according to experienced charcoal makers are easy to manage and
carbonise well hence have a better efficiency.
5.3.3 Thickness of Insulating Wall
In the field, the charcoalers cited insulation thickness as one of the factors significantly
affecting the yield of the earth clamp method of charcoal production. In the field, the
average thickness at the top is commonly 20-25 cm while on the sides is generally 40-
45 cm. Hibajene (1994) observed in the field that the thicker insulation gave higher
charcoal yield.
In this study, the insulating wall thickness varied widely from site to site and for
various kiln sizes. It also depended on the soil type and type of undergrowth on the
kiln site. Sometimes even the tools/implements used to shape the earth lamps could
determine insulation thickness. A range of 10 cm to 60 cm was recorded in the field
and used in the model to determine an optimum thickness of insulation wall.
0.80
0.85
0.90
0.95
1.00
1 6 11 16 21
Rel
ati
ve
charc
oal
fract
ion
Kiln Length (m)
Crosswise Longitudinal

159
The numerical results from the model in Figure 5.8 show that the relative charcoal
fraction falls from some maximum value and falls as the insulation wall thickness is
increased for both cross and longitudinal loaded kilns. For the cross loaded kiln the
relative charcoal fraction decreases from 0.482 with wall thickness of 0.1 m to 0.229
with wall thickness of 0.6 m. In the case of longitudinally loaded kiln, the relative
charcoal fraction falls from 0.667 at 0.1 m thick insulation wall to 0.192 with insulation
wall thickness of 0.6 m.
Source: Model results.
Figure 5.8: Relative charcoal fraction versus insulation wall thickness
Though insulation wall thickness of 0.1 m can result into a higher relative charcoal
fractions of 0.667 for longitudinal loaded kiln and 0.487 for crosswise loaded kiln as
shown in the model results in Figure 5.8, it cannot be practical in the field as the thin
insulation wall will be difficulty to construct. Thicker insulation walls promote
retention of heat in the kiln thus burning most of the charcoal produced to ashes thereby
reducing the yield. This is likely to occur if the carbonisation process is longer than
necessary through mismanagement of the kiln.
Thick walled insulations also make management of the kiln difficult as reported by the
charcoal makers in the field (Hibajene, 1994). A 20 cm insulation wall thickness on
average will result in a relative conversion efficiency of 0.468 for either the crosswise
or longitudinally loaded kilns.
0.15
0.35
0.55
0.05 0.25 0.45 0.65
Rel
ati
ve
charc
oal
fract
ion
Insulation wall thickness (m)
Crosswise Longitudinal

160
5.4 Effect of Log Diameter Size and Log Diameter Distribution
In this section a series of numerical simulations were carried out to determine the effect
of diameter of wood logs on the charcoal yield in the kiln. The other simulations were
carried out to determine the effect of distribution of wood logs of various diameters in
the kiln on the yield of charcoal. In both the crosswise and longitudinal loaded kilns,
the diameter of the wood logs ranged from 0.1 m to 0.5 m.
5.4.1 Log Diameter Size Effect
To model the effect of log diameter size on charcoal yield, the kiln was loaded with
wood logs of same diameter from bottom to the top in both the crosswise and
longitudinal arrangement of wood logs.
Figure 5.9 shows the model results for both crosswise and longitudinal type of loading,
the relative charcoal fraction decreases as the diameter of the wood log increases from
0.1 m to 0.50 m. The results also show that small diameter logs are best used in
longitudinally loaded kilns.
It takes longer for heat to be conducted through a larger diameter log than a small or
medium diameter log. This can reduce the degree of carbonisation hence the reducing
relative charcoal fraction and charcoal yield.
Source: Model results.
Figure 5.9: Relative charcoal fraction versus diameter of wood log
0
0.2
0.4
0.6
0.8
1
0 0.1 0.2 0.3 0.4 0.5 0.6
Rel
ati
ve
charc
oal
fract
ion
Diameter of wood log (m)
Crosswise loading Longitudinal loading

161
The results mean that small diameter logs of say 0.05 m will produce more charcoal
than large diameter logs. It is both wasteful and tedious to construct a kiln wholly from
small branches only as it will entail cutting a large number of trees. The best practise
in the field would be to stack more small/medium diameter woods into the kiln pile
especially in the upper half of the kiln.
5.4.2 Log Diameter Size Distribution Effect
Log diameter size distribution of logs in the kiln simply means the weight distribution
of the diameter categories (small, medium and large). The common practise in the field
is to load large diameter logs at the bottom of the kiln height, medium diameter logs
in the middle of the kiln height and small diameter logs at the upper part of the kiln
height.
Almost always every tree cut down for charcoal making is made up of small and
medium diameter branches of wood and large diameter trunk It would only be
conservative to mix these different diameter logs in each and every kiln constructed.
This will avoid wasting the medium and large diameter wood logs.

162
5.4.2.1 Uniform diameter log distribution effect
Two kilns, one crosswise and the other longitudinal loaded, were simulated. Each kiln
was stacked with uniform diameter wood logs (0.250 m). Model results in Figure 5.10
show that the longitudinally loaded kiln has a higher relative charcoal fraction (0.491)
than the crosswise loaded kiln (0.412).
Source: Model results.
Figure 5.10: Relative charcoal fraction versus logs arrangement (uniform diameter)
The difference in the charcoal yield is due to nature of heat transfer process in the cross
and longitudinal type of loading. In the crosswise loading heat travels perpendicular
to the wood log’s length and its faster hence the charcoal can burn reducing charcoal
yield. As for the longitudinally loaded kiln, the heat transfer along the log is gradual
along the wood cellular fibres. This results in a slow carbonisation process that
promotes secondary reactions for more charcoal conversion and retention to give a
higher charcoal yield.
The two results contradict Hibajene’s findings in the field (Hibajene, 1994). The
longitudinally loaded kiln is actually a series of crosswise loaded kilns arranged side
by side with spaces between them. In the field it is difficulty to pack the wood in a
manner that closes the gap between the crosswise kilns and hence more air occupies
this space and burns the charcoal produced thus reducing the yield. In a numerical
model the space between the series of crosswise loaded kilns is perfectly closed and
0.412
0.491
0
0.1
0.2
0.3
0.4
0.5
Crosswise Longitudinal
Rel
ati
ve
charc
oal
fract
ion
Type of logs arrangement

163
no extra air is stored and hence no combustion of the charcoal produced, therefore the
model results depict a higher charcoal yield in the longitudinal loaded kiln. If log ends
are cut by saw in the field this problem can be eliminated.
5.4.2.2 Non- uniform diameter log distribution effect
The crosswise and the longitudinal loaded kilns were simulated each loaded with non-
uniform diameter wood logs. The logs distribution was as follows: the 0.05 m diameter
logs at the top of kiln: the 0.20 m diameter logs in the middle of the kiln: and the 0.50
m diameter logs at the bottom of the kiln.
Model results in Figure 5.11 show that the longitudinally loaded kiln had a higher
relative charcoal fraction (0.928) than the cross loaded kiln (0.845).
Source: Model results.
Figure 5.11: Relative charcoal fraction versus logs arrangement (non-uniform
diameter)
The relative charcoal fractions in the kilns with non-uniform diameter wood logs are
much higher than the relative charcoal fractions for the kilns using uniform diameter
wood logs. A mix of various diameter wood logs in a kiln promotes higher charcoal
yield. The Figure 5.12 shows model results for the overall comparison of the crosswise
loaded kiln with the longitudinal loaded kiln in terms of use of uniform diameter logs
and non-uniform diameter logs.
0.845
0.928
0
0.2
0.4
0.6
0.8
1
Crosswise Longitudinal
Rel
ati
ve
charc
oal
fract
ion
Type of logs arrangement

164
Source: Model results.
Figure 5.12: Relative charcoal fraction versus logs arrangement and diameter
distribution
From the model results of Figure 5.12 it can be observed that:
(i) For the crosswise type of loading the use of non-uniform diameter wood
logs has higher relative charcoal fraction (0.845) than the use of uniform
diameter wood logs (0.412) even though the uniform diameter woodlogs
were of the medium diameter category.
(ii) In the longitudinal type of loading higher relative charcoal fraction is
obtained (0.928) when use is made of non-uniform diameter wood logs than
when uniform diameter wood logs are used (0.491).
(iii) Overall the longitudinal type of wood log arrangement preferably stacked
with non-uniform diameter logs in the medium diameter category has better
charcoal yield.
0.412
0.845
0.491
0.928
0
0.2
0.4
0.6
0.8
1
Crosswise(uniform
Diameter)
Crosswise (Non-uniform
Diameter)
Longitudinal(UniformDiameter)
Longitudinal(Non-uniform
Diameter)
Rel
ati
ve
charc
oal
fract
ion
Type of log arrangement and diameter distribution

165
5.5 Effect of Direction of Prevailing Wind to Direction of Carbonisation
A WIND object incorporated in the software was used to specify the atmospheric
boundary layer profiles at the upwind edges of the kiln using logarithmic law velocity
profiles and an outlet pressure boundary condition at the downwind face of the kiln,
given a prevailing wind direction and speed.
In the field, standard and bigger than standard kilns are constructed oriented either
along or against the prevailing wind direction. Only smaller kilns were constructed
without regard to the prevailing wind direction on kiln site. The firing points for the
crosswise and longitudinal loaded kilns were modelled both against and along the
prevailing wind direction for their effect on the relative kiln conversion efficiency.
5.5.1 Effect of prevailing wind direction in crosswise loaded kiln
The model results in Figure 5.13 show the relative charcoal fraction for two crosswise
loaded kilns in prevailing wind streams of opposite directions. The first kiln has its
carbonisation direction along the direction of the prevailing wind and resulted in a
relative charcoal fraction of 0.369. The second kiln’s direction of carbonisation was
against the prevailing wind direction and resulted into a relative charcoal fraction of
0.642.
Source: Model results.
Figure 5.13: Relative charcoal fraction versus wind direction (Crosswise)
0.369
0.642
0
0.1
0.2
0.3
0.4
0.5
0.6
0.7
Wind against point of firing Wind along point of firing
Rel
ati
ve
charc
oal
fract
ion
Crosswise loading of logs

166
There is an improvement in the relative charcoal fraction of 74 percent when
carbonisation direction is against the direction of the prevailing wind. This could be
attributed to non-retention of cold air and moisture inside the kiln since the air is blown
away from the kiln fire point thus no heat energy expended in heating the cold air to
kiln temperature and evaporating the moisture. Also excess heat that could lead to
burning some of the produced charcoal is moved out of the kiln firing opening.
The low relative charcoal fraction of 0.369 in the case of carbonisation along the
direction of prevailing wind direction is due to burning of most of the raw wood in the
kiln to heat the ever incoming cold air to kiln temperatures. The combusted wood
reduces yield of charcoal in the final analysis. Also excess heat could be retained in
kiln by pressure of incoming air thus burning some of the produced charcoal.
5.5.2 Effect of prevailing wind direction in longitudinal loaded kiln
The model results in Figure 5.14 show the relative charcoal fraction for two
longitudinally loaded kilns in prevailing wind streams of opposite directions. The first
kiln has its carbonisation direction along the direction of the prevailing wind and
resulted in a relative charcoal fraction of 0.632. The second kiln’s direction of
carbonisation was against the prevailing wind direction resulting into a relative
charcoal fraction of 0.452.
Source: Model results.
Figure 5.14: Relative charcoal fraction versus wind direction (Longitudinal)
0.632
0.452
0
0.2
0.4
0.6
0.8
Wind against point of firing Wind along point of firing
Rel
ati
ve
charc
oal
fract
ion
Longitudinal arrangement of logs

167
In the longitudinal loaded kiln, firing against the direction of the prevailing wind
direction reduces the relative charcoal fraction from 0.632 to 0.452, which is a
reduction of 28.5 percent. The nature of the stacking causes a problem of heat loss
from the kiln. The porosities or spaces run straight from kiln fire point to end and
parallel to wind direction. This sucks out the heat from the kiln very easily thus
consuming more wood to provide the required heat for carbonisation.
Hibajene (1994) reported that the cross-wise loaded kilns carbonising along the
prevailing wind direction had twice uncarbonised wood (17 percent) compared with
similar kilns carbonising against the prevailing wind direction (8 percent). Its vice-
versa for parallel loaded kilns. The higher yielding kilns had better carbonisation.
5.6. Spatial Distribution of Carbonisation Variables
In this section the model results of the spatial distributions of the key variables in the
optimised kiln are presented and interpreted. These variables are the pressure and
velocity, temperature, radiation energy, gas phase, and solid phase parameters.
(i) Pressure and Velocity Distribution
The pressure distribution shown in Figure 5.15 was taken along the centreline of the
kiln model. The pressure is uniformly distributed in the kiln within range of 0.244-
0.520 Pa. At the firing point of the kiln the pressure is intense (2.45 to 3.00 Pa) due
the combustion process taking place to fire the kiln.
This pressure is measured above gauge (atmospheric) pressure to keep the kiln from
collapsing in. the kiln only collapses when the carbonisation process is complete inside
the kiln.
Source: Model results.
Figure 5.15: Pressure contours along the kiln length

168
The case of model velocity vector plots, depicted in Figure 5.16, is for a kiln fired
along the prevailing wind direction. The velocity distribution in the kiln is fairly
uniform between 0.837 to 1.247 m/s. This velocity is slightly lower than the average
2.3 m/s measured in the field. The logs resistance in the kiln reduce this superficial
velocity of 2.3 m/s measured in the field.
(a)
Source: Model results.
(b)
Figure 5.16: Velocity distributions along kiln length (a) vectors and (b) contours
(ii) Temperature Distribution
Pyrolysis at lower kiln temperatures favours the production of charcoal whereas at
higher temperatures results in the fission, dehydration, disproportionation,
decarboxylation and decarbonylation reactions, which favours gas production. The
temperature distribution shown in Figure 5.17 model results is at the end of the 16.75
days of carbonisation period simulated. The peak temperature in the simulation results
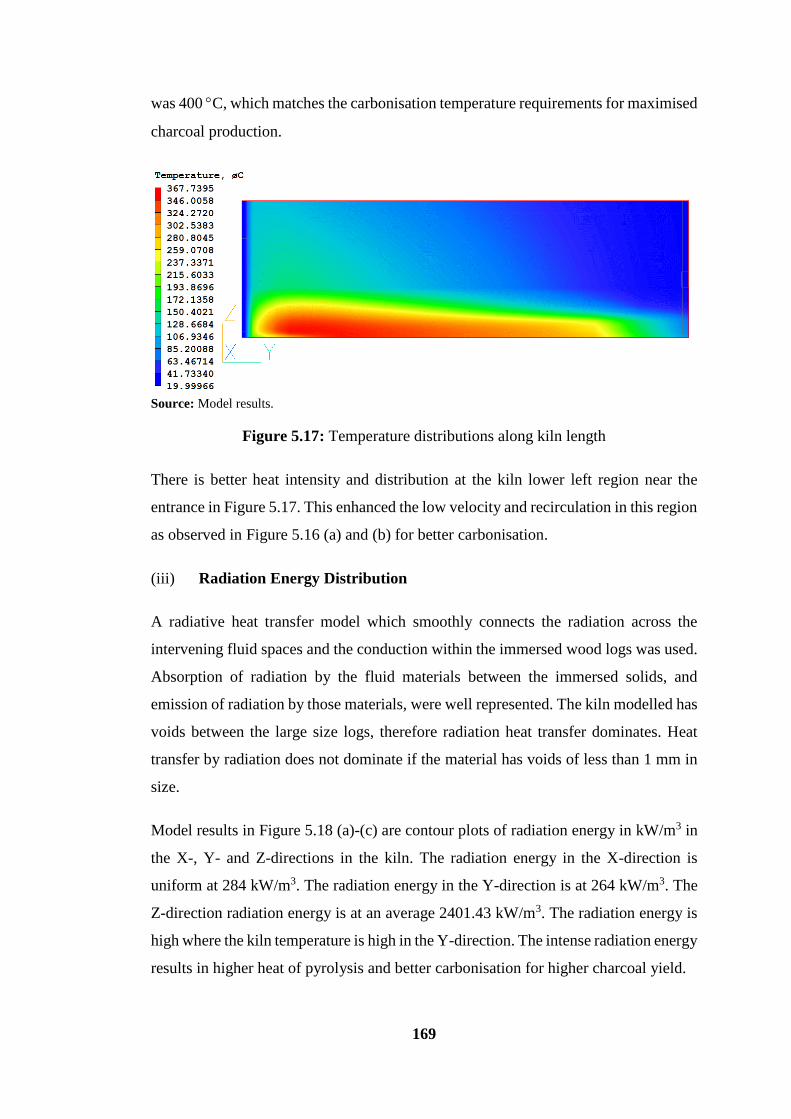
169
was 400 C, which matches the carbonisation temperature requirements for maximised
charcoal production.
Source: Model results.
Figure 5.17: Temperature distributions along kiln length
There is better heat intensity and distribution at the kiln lower left region near the
entrance in Figure 5.17. This enhanced the low velocity and recirculation in this region
as observed in Figure 5.16 (a) and (b) for better carbonisation.
(iii) Radiation Energy Distribution
A radiative heat transfer model which smoothly connects the radiation across the
intervening fluid spaces and the conduction within the immersed wood logs was used.
Absorption of radiation by the fluid materials between the immersed solids, and
emission of radiation by those materials, were well represented. The kiln modelled has
voids between the large size logs, therefore radiation heat transfer dominates. Heat
transfer by radiation does not dominate if the material has voids of less than 1 mm in
size.
Model results in Figure 5.18 (a)-(c) are contour plots of radiation energy in kW/m3 in
the X-, Y- and Z-directions in the kiln. The radiation energy in the X-direction is
uniform at 284 kW/m3. The radiation energy in the Y-direction is at 264 kW/m3. The
Z-direction radiation energy is at an average 2401.43 kW/m3. The radiation energy is
high where the kiln temperature is high in the Y-direction. The intense radiation energy
results in higher heat of pyrolysis and better carbonisation for higher charcoal yield.

170
(a)
(b)
(c)
Source: Model results.
Figure 5.18: Radiation energy distribution in the kiln length (a) X-direction (b) Y-
direction and (c) Z-direction

171
These model results in Figure 5.18 show that the kiln regions with high radiation
energy also have high temperatures and low velocity with recirculation which enhance
heat of pyrolysis for better yield of charcoal.
(iv) Gas Phase Distribution
The gas phase is composed of air, water vapour and volatile gases. The air is important
for firing the kiln to initialise carbonisation process while the water vapour evolves
from the heating of the wood during drying and the volatile gases are produced from
the wood carbonisation processes. Figure 5.19 depicts the model results for the gas
phase distributions.
In Figure 5.19 (a) there is low air concentration in the first half of the kiln as it is
consumed for combustion initiation and carbonisation in the kiln. The second half of
the kiln in (a) has high concentration of air as carbonisation has not taken place in this
second half of the kiln.
In Figure 5.19 (b) there is low concentration of water vapour in the first half of the kiln
where the wood has been dried from intense heat from the kiln firing combustion. The
water vapour concentration is high in the second half of the kiln where the wood is yet
to be dried prior to carbonisation.
In Figure 5.19 (c) the concentration of volatile gases is high in the first half of the kiln
where carbonisation has taken place while the second half of the kiln has low
concentration of volatile gases since carbonisation is yet to take place.

172
(a)
(b)
(c)
Source: Model results.
Figure 5.19: Gaseous phase distribution along kiln length (a) air (b) water vapour
and (c) volatiles

173
(v) Solid Phase Distribution
The solid phase is made up of the raw wood logs, water (moisture) in the logs and the
charcoal produced. In Figure 5.20 (a) the water moisture fraction is low in the first
half of the kiln as the wood has been converted to charcoal but the moisture fraction is
high in the last half of the kiln where carbonisation has yet to take place and raw wood
is abundant.
In Figure 5.20 (b) the fraction of raw wood is low in the first half of the kiln where it
has been carbonised to charcoal, but the second half of the kiln has high fraction of
raw wood since carbonisation is yet to take place.
In Figure 5.20 (c) three quarters of the kiln has a high fraction of charcoal fraction.
This is expected as the wood is carbonised, the water fraction decreases and so is the
fraction of raw wood, which is being converted to charcoal hence the charcoal fraction
increases instead.

174
(a)
(b)
(c)
Source: Model results.
Figure 5.20: Solid phase distribution along kiln length (a) moisture (b) raw wood
and (c) charcoal

175
5.7. Temporal Evolutions of Carbonisation Variables
In this section model results of the temporal evolution of the wood density,
temperature, drying, pyrolysis rates, mass fractions and temperature of gas and solid
phases in the optimised kiln are depicted and discussed.
(i) Wood Density and Temperature
Figure 5.21 model results depicts that as the wood temperature increases, from ambient
temperature of 20°C to about 420°C in 4 days, the wood density drops from initial 350
kg/m3 to about 275 kg/m3. At 420°C the carbonisation process ends with production
of charcoal. During pyrolysis of the wood there is a rise in temperature and evolution
of volatile gases and water vapour leading to significant loss of mass and drop in
density. The resulting wood volume shrinkage is insignificant to warrant an increase
in the wood density. The shape of charcoal pieces observed in the field showed that
shrinking of wood takes place to a small extent.
Source: Model results.
Figure 5.21: Temporal distribution of wood density and kiln temperature
From the 9th day of carbonisation and thereafter the kiln temperature is constant at
200°C. This is an advantageous temperature as carbonisation in wood only starts when
the wood is heated to 160°C and above.
The wood temperature increases from initiation of combustion and carbonisation and
reaches the peak of 420°C at which temperature carbonisation is optimum and
continues even under lower than 420°C due the heat in the kiln.
0
100
200
300
400
500
0 2 4 6 8 10 12 14
Tem
per
atu
re /
Den
stit
y
Days of carbonisation
Solid phase temperature (°C) Wood density (kg/m3)

176
(ii) Drying, and Pyrolysis rates per unit volume
Figure 5.22 model results depicts that a day and half after firing the kiln, the drying
and pyrolysis processes commence with their rates increasing rapidly to a peak of
0.0045 kg/m3s and drops to zero rate on the second day of carbonisation. Field
observations showed that drying and pyrolysis rates are very crucial in the
carbonization process as they mostly depend on the kiln management and the initial
wood logs preparations especially the degree of drying.
Source: Model results.
Figure 5.22: Temporal distributions of drying and pyrolysis rates
0.00E+00
1.00E-05
2.00E-05
3.00E-05
4.00E-05
5.00E-05
0.0 1.0 2.0 3.0 4.0 5.0
Rate
per
un
it v
olu
me
kg/m
3s
Days of carbonisation
Drying rate Pyrolysis rate

177
(iii) Solid and gas phase temperatures
It is observed in Figure 5.23 model results that the wood temperature increases steadily
from ambient of 20°C to about 420°C during the first 4 days. The gases temperature
follows the same pattern as the solid phase temperature. On a kiln in the field, it was
observed that as the carbonization temperature increased in the kiln, very hot gases
were evolving from the kiln wall perforations at very high temperature.
Source: Model results.
Figure 5.23: Temporal distributions of solid and gas phase temperatures
(iv) Gas Phase Mass Fractions
Figure 5.24 depicts that depending on the spatial location of the observation point and
the point in time of the carbonisation process, there could be much air fraction and low
volatile gases and water vapour fraction due to combustion of the wood to dry wood
prior to carbonisation.
This signifies almost complete drying of the wood with respect to unbound and
chemically bound water. This phenomenon was validated by observation in the field
where gaseous emissions could be observed together with the white water vapour as
the raw wood burns driving out moisture while also carbonizing and releasing gases.
20
70
120
170
220
270
320
370
420
470
1 3 5 7 9 11 13
Tem
per
atu
re
C
Days of carbonisation
Solid phase temperature Gas phase Temperature

178
Source: Model results.
Figure 5.24: Temporal distributions of gas phase mass fractions
(v) Solid Phase Mass Fractions
In the Figure 5.25 model results it is observed that 24 hours after kiln is fired, drying,
and carbonisation starts in the kiln. After 48 hours the moisture mass fraction decreases
to zero. The raw wood mass fraction decreases to zero in 72 hours after kiln firing.
Charcoal starts forming 24 hours after firing kiln and its mass fraction reaches one
after 72 hours and remains constant for the rest of the carbonization process. In an
actual kiln there are usually varying proportions of charcoal, and uncarbonised wood
brands especially towards the end of the kiln. The mass fractions of these components
depend on the kiln management and wood preparation prior to carbonization.
-0.2
0.0
0.2
0.4
0.6
0.8
1.0
1.2
0.0 2.0 4.0 6.0 8.0
Mass
fra
ctio
ns
Days of carbonisation
Volatile Gases Air Water vapour

179
Source: Model results.
Figure 5.25: Temporal distributions of solid phase mass fractions
5.8 Optimised Charcoal Kiln Parameters
In this section the parameters leading to optimisation of the charcoal kiln are
summarised and discussed. These are the major factors that influence the carbonisation
process in the kiln, the conversion efficiency and the charcoal yield.
5.8.1 The kiln optimised factors
The Table 5.2 lists the major factors that relatively influenced the carbonisation
process in the kiln model. These factors were optimised through numerical simulations
in the kiln model. Each factor was individually simulated for optimisation purpose to
produce a relative improvement in the conversion efficiency here termed as the relative
charcoal fraction.
Practically all factors influencing a process of a system normally take place at the same
time to produce the one effect of particular interest like the conversion efficiency in
this study. This however, is not feasible in a numerical model as the influence of
several factors can only be simulated one at a time using the classical statistical method
of one-factor-at-time. Table 5.2 shows model results of the optimum parameters of
major factors and their resulting relative charcoal fractions.
0.0
0.2
0.4
0.6
0.8
1.0
1.2
0 1 2 3 4 5 6 7 8
Rel
ati
ve
Mass
fra
ctio
ns
of
char,
raw
wood
an
d w
ate
r
Days of carbonisation
Charcoal Wood Moisture

180
Table 5.2: Relative Charcoal Fractions for Optimised Kiln Factors
Factor Range
Factor relative charcoal fraction
Crosswise
loaded kiln
Longitudinal
loaded kiln
Kiln Size 2.0 m wide x
7.0 m long 0.883 0.883
Diameters of logs
distribution 5.0 – 20.0 cm 0.928 0.928
Arrangement of Logs Both loading
types 0.845 0.928
Carbonising direction Along the
Wind 0.642 0.632
Moisture content 12 - 20% 0.577 0.577
Thickness of insulation
wall 10 – 40 cm 0.482 0.667
5.8.2 Conversion efficiency of kiln
Using the model results for the optimised factor relative charcoal fractions in Table
5.2, the conversion efficiency of the kiln Eck is calculated using Equation 3.39 and as
a product of the individual factor relative charcoal fractions. These individual factor
relative charcoal fractions are computed retrospectively in the numerical simulation
program.
Conversion efficiency for crosswise loaded kiln
Eck = 0.88 x 0.928 x 0.845 x 0.642 x 0.577 x 0.482 x 100 = 12.36 percent
Conversion efficiency for Longitudinal loaded kiln
Eck = 0.883 x 0.928 x 0.928 x 0.632 x 0.577 x 0.667 x 100 = 18.50 percent

181
5.8.3 Charcoal yield of kiln
To calculate the charcoal yield of the kiln, Equation 3.41 was used. In this equation
the ratio A
C represents the conversion efficiency Eck as determined in section 5.8.2.
The moisture content of 12 percent being the optimum was used in the equation.
Charcoal yield for crosswise loaded kiln
percent 14.05 12- 100
100 x 12.36
(%)content Moisture - 100
100x
A
C (%)yield Charcoal
Charcoal yield for Longitudinal loaded kiln
percent 21.02 12- 100
100 x 18.50
(%)content Moisture - 100
100x
A
C (%)yield Charcoal
These model results are an improvement on the conversion efficiency and charcoal
yield of a traditional earth charcoal making kiln which are reported as having a
conversion efficiency of as low as 5 - 10 percent. Hibajene’s field results reported an
improvement of charcoal yield of not more than 25 percent for each of the factors
investigated for both the crosswise and longitudinal loaded kilns.
The CHAPOSA reported various conversion efficiencies of the improved traditional
charcoal kilns; ranging from 11 - 30 percent for Dar-es-Salaam,; the yield varied from
14-20 percent for Maputo; conversion efficiency of 20-25 percent for Lusaka,.
Sometimes for Zambia and elsewhere the average conversion efficiencies are reported
to be as low as 6 percent.
On the other hand the ranges of charcoal yields reported by others for the traditional
method of charcoal production are: Hibajene (1994) obtained yields of 14-25 percent

182
under field conditions; Chidumayo (1990) obtained yields of 17-33 percent; while
Ranta and Makunka (1986) obtained yields of 26-29 percent under laboratory
conditions.
Therefore the efficiencies and yields obtained here are comparable within the number
of factors studied in the numerical model, otherwise further improvements are possible
with increased number of factors and model parameters.
List of References
Agarwal, .R. K. and McCluskey, R. J. (1985) 64, p.1502-1504.
Akita, K. (1959), Vol. 9 Japan, pp. 1-44, 51-54, 77-83, 95-96.
Aldea, M. E., Mastral, J. F., Ceamanos, J., and Bilbao, R. (1998) In 10th European Conference and
Technology Exhibition C.A.R.M.E.N., Rimpar, Germany.
Alves, S. and Figueiredo, J. L. (1989) Chemical Engineering Science, 44, 2861-2869.
Amous, S. (2000) EC-FAO Partnership Programme working document, Rome.
Antal, M. J., Varhegyi, G. (1995) Industrial Engineering Chemical Research, 34, p. 703-717.
Anthenien, R. A. and Fernandez-Pello, A. C. (1998) 27, p. 2683-2690.
Atreya, A. (1998) Philosophical Transaction of the Royal Society of London, 356, p. 2787-2813.
Babu, B. V. and Chaurasia, A. S. (2002b) Energy Conversion and Management.
Babu, B. V. and Chaurasia, A. S. (2002a) Energy Conversion and Management.
Bagramov, G. (2010), Vol. MSc University of Lappeenranta, Finland.
Bamford, C. H. Crank, J. and Malan, D. H. (1946a) In Cambridge Philosophical Society. Vol. 42. p.
166-182.
Bamford, C. H., Crank , J. and Malon, D. H. (1946b) In Proc Cam. Phil. Soc, Vol. 42, pp. 166-182.
.Bellais, M. (2007) Modelling of the Pyrolysis of large Wood particlesVol. Ph.D Stockholm. Sweden.
Bergstrom, H. (1934) Handbook for Kolare. Jernkontoret Stockholm. (In Swedish).
Bilbao, R. (2001) Combustion and Flame, 126, p. 1363-1372.
Blackadder, W. and Rensfelt, E.A. (1985) Pressurized Thermo Balance for Pyrolysis and Gasification
Studies of Biomass Elsevier applied science publishers. p. 747-759, London and New York,.
Boonmee, N. (2004), Vol. PhD University of Maryland, USA.
Boonmee, N. and Quintiere, J. G. (2002a) Twenty-Ninth Symposium (International) on Combustion, 29,
p. 289-296.
Boutin, O., Ferrer, M., and Lede, J. (2002) Chemical Engineering Science, Vol. 57, p. 15-25.
Branca, C., Alessandro, A., and Colomba, D. (2003) Journal of Analytical and Applied Pyrolysis, 67,
207-219.
Broido, A. and Nelson, M. A. (1975a) Combustion and Flame, 24, p. 263-268.
Broido, A. and Nelson, M. A. ( 1975b) Combustion and Flame, 24, 263.
Bryden, K. M., Ragland, K. W. and Rutland, C.J. (2002) Biomass and Bio energy, Vol. 22, p. 41-53.
Capart, R., Fagbemi, L. and Gelus, M. (n.d.) In Proceedings of the Third International Conference on
Biomass(Ed, J. Coombs W. Palz and D.O. Hall, e.) (Ven).

183
Cedric, B., Franco, B., and Jan, P. (n.d.) Biomass Valorisation for Fuel and Chemicals Production - A
Review, vol. 6, R2.
CHAM, U. K. (2009) In PHOENICS Encyclopedia. CHAM, London.
Chan, W. C. R. (1983) In Department of chemical engineering, Vol. Ph.D University of Washington,
Washington
Chan, W. C. R., Kelbon, M. and Krieger, B. (1985a), Vol. 64, pp. 1505-1513.
Chan, W. R., Kelbon, M. and B., K. B. (1985b) Fuel, 64, 1505-1513.
CHAPOSA (1999) In First Annual Report Covering the period from 20 December 1998 to 20 December
1999.
Chaurasia, A. S. and Babu, B. V. (2004) J. Arid Land Stud., 159-162.
Chidumayo, E. (1991a) Bioresource Technology, 37, 43-52.
Chidumayo, E. (2002) Charcoal Potential in Southern Africa (CHAPOSA).
Chidumayo, E. and Chidumayo, E. (1984) Department of Natural Resources, Lusaka.
Chidumayo, E. N. (2012) FAO, Lusaka, Zambia.
Chidumayo, E. N., Masialeti, I., Ntalasha, H. and Kalumiana, O. S. (2001) Stockholm Environment
Institute, Stockholm.
Chipungu, J. (2000) In Africa News Online (www.africanews.orgPanafrican News Agency.
Codjambassis, G. (1981) FAO, Compte Rendu GHA/74/013 Ghana.
Commonwealth Science Council (n.d.) National Resources Institute.
Dahlquist, G. (1956) Math. Scand., 4, p. 33-53.
Demirbas, A. (2001), Vol. 42 Energy conversion and Management, pp. 1357-1378.
Demirbas, A. and Arin, G. (2002) Energy Sources, 24, 471-482.
Department of Energy (1994.) (Ed, Department of Energy) Lusaka, Zambia.
Department of Energy (2007a) Ministry of Energy and Water Development, Lusaka, Republic of
Zambia, pp. p. 11-14.
Department of Energy (2007b) Ministry of Energy and Water Development, Republic of Zambia, pp.
p. 2.
Department of Energy (2007c) Ministry of Energy and Water Development, Lusaka, Republic of
Zambia, pp. p. 3.
Desch, H. E. and Dinwoodie, J. M. (1996) Macmillan Press Ltd, London, pp. 306p.
Di Blasi, C. (1993) Progress in Energy and Combustion Science,, 19, 71-104.
Di Blasi, C. (1996) Chem. Eng. Sci., 51, 1121-1132.
Di Blasi, C. (1997) Influence of Physical Properties on Biomass Devolatization 76, 957-964.
Di Blasi, C. (1998) Journal of Analytical and Applied Pyrolysis., Vol. 41, p. 4139-4150.
Di Blasi, C., Branca, C., Santoro, A. and Hermandez, E. G. (2001) Combust. Flame, 124, 165-177.
ECZ (2008) Environmental Council of Zambia.
Emrich, W. (1985) Handbook of Charcoal Making, D. Reidel Publ.
Fan, L. T. (1977) The Canadian Journal of Chemical Engineering., Vol. 55 p. 47-53.
Fan, L. T. Fan, L. S., Miyanami, K., Chen, T. Y. and Walawender, P. (1977) Can. J. Chem Engg, 55,
47-53.
FAO (1955) In Document d'information destiné au Commissions Forestières Regionales, FAO/867. (In
French).

184
FAO (1983), Vol. FAO Paper 41 Rome.
FAO (1985) FAO Forestry Department, Rome.
FAO (1987), Vol. Paper 41
FAO Forestry Department, Rome.
FAO (2011) FAO, Rome, Italy.
Felfi, F. F., Luengo, C. A. , Soler, P. B. and Rocha, J. D. (2004) Mathematical modelling of wood and
briquettes torrefaction An.5.Enc.Energ.Meio Rural.
Foley, G. (1986) International Institute for Environment and Development, London.
Forest Service (1961) (Ed, The U.S. Department of Agriculture).
Fredlund, B. (1988) Lund University, LUTVDG/ (Institute of Science and Technology, Sweden.
Garriott, G. (1982) In Vita Energy Bulletin, Vol. Vol. 2.
Glazer, B., Lehmann, J., and Zech, W. (2002) In Biol Fertil Soils., Vol. 35, pp. 219-230.
Gomaa, H. and Fathi, M. (2000) In ICEHM2000Cairo University, Cairo, pp. 167-174.
Grioui, N., Kamel Halouani, Andre Zoulalian and Foued Halouani, (2006) Thermochimica Acta, 440,
23-30.
Gronli, M. (1996) In Dept. of Thermal Energy and Hydropower, Faculty of Mechanical Engineering.,
Vol. Ph.D The Norvegian University of Science and Technology, Trondheim.
Gronli, M. and Melaaen, M.C. (2000) Energy and Fuels, 14, 791-800.
Gronli, M. G. Varhegyi, G., and Di Blasi, C. (2002) Industrial Engineering Chemical Research, 41, p.
4201-4208.
Gustan, P. (2004) Forest Products Technology Research and Development Center and Japan
International Cooperation Agency.
Harris, A. C. (1975) UNDP, Surinam.
Henry, M., Maniatis, D., Gitz, V., Huberman, D. and Valentini, R. (2011) In Environment and
Development Economics, Vol. 16 pp. 381-404.
Hibajene, S. H. (1994) Department of Energy,, Ministry of Energy and Water Development, Lusaka.
Hibajene, S. H. Chidumayo, E.N and Ellegård, A. (1993) (Ed, Department, of Energy) Siavonga,
Zambia.
Hibajene, S. H. and Kalumiana, O. S (1994) Manual for Charcoal Making in Earth Kilns in Zambia. p.
39.
Hibajene, S. H. and Kalumiana, O.S. (2003a) (Department of Energy, Ministry of Energy and Water
Development) Lusaka, Zambia.
Hibajene, S. H. and Kalumiana, O. S. (2003b) (Ed, Energy, D. o.) Lusaka, Zambia, pp. p. 15-19.
Hostikka, S. and McGrattan, K. (2001) In International Interflam Conference, 9th Proceedings, Vol.
vol.1, Sept Interscience Communications Ltd,, London, pp. 17-19.
Huygen, M. (1981) In SEN/78/002, Terminal Report. (In French)FAO of the United Nations.
ILUA (2010) (Eds, Forestry.Department and Department) Lusaka, Zambia.
Jacqueline, A. Campbell, M., Graham, M. (2007) Synthesis 20, 3179-3184.
Jacqueline, D. and Philipe, G. (n.d.) Experimental Center for Producing Charcoal France.
Jalan, R. K. and Srivastava, V. K. (1998a), Vol. Vol. 40 Energy Conversion and Management, pp. p.
467-494.
Jalan, R. K. and Srivastava, V. K. (1999) Energy Conversion and Management 40, 467-494.
Japanese International Cooperation Agency (JICA) (2007) The Tokyo Electric Power Company, Inc.,
Tokyo, pp. Chap. 1-3.

185
Kalinda, T., Bwalya, S., Mulolwa, A. and Haantuba, H. (2008) Ministry of Tourism, Environment and
Natural Resources, Lusaka.
Kansa, E. J., Perlee, H.E., and Chaiken, R.F. (1977a) Combustion and Flame, Vol. 29, p. 311-324.
Kanury, A. M. (1972) Combustion and Flame, 18, p. 75-83.
Karch, G. E. (1981) In FAO Project Working Document No. 2, Vol. Doc. No. 1 Cameroun Ministry of
Mines and Energy, Yaoundé, Cameroun.
Karch, G. E., Boutette, M. and Christophersen, K. (1987) The University of Idaho, College of Forestry,
Wildlife & Range Sciences Moscow, Idaho.
Karekezi, S. (2001) AFREPREN/FWD.
Kashiwagi, T. (1979) Combustion and Flame, 34, p. 231-244.
Kashiwagi, T. and Nambu, H. (1992) Combustion and Flame, 88, p. 345-368.
Kelbon, M. (1983), Vol. M.S University of Washington.
Koufopanos, C., A , Papayannakos, N., , Maschio, G. and Lucchesi, A. (1991) The Canadian Journal
of Chemical Engineering., 69, 907-915.
Krishna Prasad, K., Sangen, E. and Visser, P. (1985) Advances in Heat Transfer, 17, 159-310.
Kung, H. C. (1972) Combustion and Flame, 18, p. 185-195.
Kuo, J. T. and Hsi, C. L. (2005) Combustion and Flame, 142, 401-412.
Lede, J., Huai, H.Z., Zhi Li and Villermaux, J. (1987) Journal of Analytical and Applied Pyrolysis, 10,
p. 291-308.
Lee, C. K., Chaiken, R. F. and Singer, J. M. (1976) In 16th Symposium (Intl.) on
CombustionCombustion Institute, Pitts, pp. 1459-1470.
Lewellen, P. C., Peters, W. A. and Howard, J. B. (1969) In 12th Symposium on Combustion, The
Combustion Institute, Pitts, pp. 1471-1480.
Lewellen, P. C., Peters, W. A. and Howard, J. B. (1976) In Sixteenth Symposium (International) on
Combustion, pp. 1471-1480.
Living Documents (2005) WWF DGIS-TMF Programme.
Maa, P. S. and Bailie, R. C. (1973) Combustion Science and Technology 7, 257-269.
Mabonga, M. J. (1978) In MONAP Project Working DocumentFAO.
Martin, S. B. (1964) Tenth Symposium (International) on Combustion, 10, p. 877-896.
Masiliso, S. (2004) Energy Statistics 'The case of Zambia'.
Mastral, F. J., Esperanza, E., Garcia, P. and Juste, M. (2002) Journal of Analytical and Applied
Pyrolysis, Vol. 63, p. 1-15.
Matsumoto, T., Fujiwara, T. and Kondo, J. (1969) In 12th Symposium on CombustionThe Combustion
Institute, Pitts, pp. 515-531.
Milosavljevic, I. and Suuberg, E. M. (1995) Industrial Engineering Chemical Research, 34, p. 1081-
1091.
Miyanami, K., Fan, L. S., Fan, L. T. and Walawender, W. P. (1977) The Canadian Journal of Chemical
Engineering., Vol. 55, , p. 317-325.
Mok, W. S. L. and Antal, M.J., Jr. (1983) In Thermochimical Acta, Vol. 68, pp. p. 155-164.
Murty, K. A. and Blackshear Jr., P. E. (1967) In 11th Symposium (International) on CombustionThe
Combustion Institute, Pitts, pp. 517-523.
Mwitwa, J. and Makano, A. (2012) USAID Report, Lusaka
Nathasak, B. (2004), Vol. Doctor of Philosophy College Park, University of Maryland.

186
Openshaw, K. (1986) Concepts and Methods for collecting and compiling statistics on biomass used
as energy. Paper prepared for U.N. statistical office workshop in Rome, 29 September – 3 October
1986.
Orfao, J. J. M., & Figueiredo, J. L. (2001) Thermochimica Acta, 380, p. 67-78.
Orfao, J. J. M., Antunes, F. J. A., Figueiredo, J. L. (1999) Fuel, 78, p. 349-358.
Ouelhazi, N., Arnaud, G. and Fohr, J. P. (1992) Transport in Porous Media, 7, 39-61.
Panton, R. L. and Rittman, J. G. (1971) In 13th Symposium (International on CombustionThe
Combustion Institute, pp. 881-891.
Panton, R. L. and Rittmann, J. G. (1970) ThirteenSymposium (International) on Combustion, 881-889.
Parker, W. J. (1985) In Fire Safety Science Proceedings the First International Symposium. p. 207 -
216.
Patankar, S. V. (1980) Numerical heat transfer and fluid flow, , Hemisphere Publishing Corporation,
Taylor & Francis Group New York.
Patankar, S. V. and Spalding, D. B. (1972) Int. J. Heat Mass Transfer, Vol. 15, 1787-1806.
Paul, A. R. (1987) Africa’s Charcoal Dilemma. IDRC Reports.
Perré, P. and Degiovanni, A. (1990) International Journal of Heat and Mass Transfer, 33, 2463-2478.
Peters, B. and Christian, B. (2003) J. Anal. Appl. Pyrolysis 70, 233-250.
Peters, B., Schroder, E., Bruch, C. and Nussbaumer T. (2002) Biomass and Bioenergy, 22, 41-53.
Prakash, N., Karunanithi, T. (2008) Journal of Applied Sciences Research © 2008, INSInet Publication,
4, 1627-1636.
Ragland, K. W., Aerts, D.J. and Baker, A.J. (1991) In Bioresource Technology, Vol. 37, pp. 161-168.
Ranta, J. and Makunka, J. (1986), Vol. Technical Paper No. 29 (Ed, Forest Department, Division of
Forest Products Research).
Rath, J., Wolfinger, M.G., Steiner, G., Barontini, F., and Cozzani, V. (2003) Fuel, Vol.82, 81-91.
Raveendran, K., Ganesh, A. and Khilar, K. C. (1996) Fuel, 75, 987-998.
Richards, G. N. and Zheng, G. (1991) Journal of Analytical and Applied Pyrolysis, 21, p.133-146.
Ritchie, S. J. (1997) In Fire Safety Science Proceedings of the Fifth International Symposium. p. 177-
188.
Roache, P. J. (1976) Computational Fluid Dyanamics, Hermosa, Albuqerque, New Mexico.
Roberts, A. F. (1970(a)) In Thirteenth Symposium (International) on Combustion. p. 893-903.
Roberts, A. F. (1970(b)) Combustion and Flame, 14, p. 264-272.
Roberts, A. F. (1971a) Combustion and Flame, 79-86.
Roberts, A. F. (1971b) In 16th Int. Symposium on CombusionThe Combustion Institute, Pitts, pp. 893-
903.
Roberts, A. F. (1971c) In 13th International Symposium on Combustion August 23-29The Combustion
Institute, Pittsburgh, pp. 893-903.
Roberts, A. F. and Clough, G. (1963a) In The 9th International Symposium on CombustionThe
Combustion Institute, Pittsburgh. p. 158-167.
Roberts, A. F. and Clough, G. (1963b) In 9th Symposium (Intl.) on CombustionThe Combustion
Institute, Pitts, pp. 158-167.
Savard, J. (1969) In UNDP No. TA 2745.
Seifritz, W. (1993) Int. J. Hydrogen Energy, Vol.18, 405-407.
Serenje, W., Chidumayo, E. N., Chipuwa, J. H., Egneus, H. and Ellegard, A. (1993) In Energy,
Environment and Development SeriesStockholm Environment Institute.

187
Shafizadeh, F. (1978) AIChE Symposium Series, Vol. 74, , p. 76-82.
Shafizadeh, S. (1992) Journal of Analytical and Applied Pyrolysis, 3, p. 283-305.
Shen, D. K., Fang, M. X., Luo, Z. Y. and Cen, K. F. (2007) Fire Safe, 42, 210-217.
Siau, J. F. (1995) Virginia Polytechnic Institute and State University, Department of Wood science and
Forest Products
Sinha, S., Jhalani, A., Ravi, M. R. and Ray, A. (2004) Indian Institute of Technology, Hauz Khas,
Department of Mechanical Engineering, New Delhi - 110016, India.
Skaar, C. (1988) In Wood Water Relations Springer-Verlag, NewYork, pp. 283.
Spearpoint, M. J. (1999) National Institute of Standards and Technology.
Spearpoint, M. J. and Quintiere, J. G. (2001) Grain Orientation and Heat Flux. Fire Safety Journal, 36,
p. 391-415.
Spearpoint, M. J. and Quintiere, J. G. (2000) Combustion and Flame, 123, p. 308-324.
Srivastava, V., Sushil, K., and Jalan, R.K. (1996) 37, p. 473-483.
Stephen Karekezi and Touria Dafrallah (n.d.) In ADB Finesse Africa Program AFREPREN/FWD,
ENDA-TM.
Suuberg, E. M., Milosavljevic, I., and Lilly, W. D. (1994) National Institute Standards and Technology,
Gaithersburg, Maryland.
Tang, W. K. and Neil, W. K. (1964) Journal of Polymer Science, p. 65-81.
Tang, W. K. and Neill, W. K. (1964) J. Polymer Science B.Ke (ed.) Part C 65.
Tara, N. (1998) In Regional Training on Charcoal Production, RWEDP. Pontianak, Indonesia.
Tinney, E. R. (1965a) In 10th Symposium (International) on CombustionThe Combustion Institute, pp.
925-930.
Tinney, E. R. (1965b) In 10th International Symposium on CombustionThe Combustion Institute,
Pittsburgh. p. 925-930.
Tinney, R. E. (1964) In Tenth Symposium (International) on Combustion, pp. p. 925-930.
Trossero, M. A. (1978) In Congreso. ILAFA-Altos Hornos. (In Spanish)Instituto Latinoamericano del
Fierro y el Acero.
Tuck, A. R. C. and Hallett, W.L.H. (2005) University of Ottawa, Depts. of Chemical and Mechanical
Engineering, Ottawa, Ontario.
Vahram, M. (1978), Vol. Charcoal Unit Laboratory Report No. 4 University of Guyana/National
Science Research Council.
Varela, R. C. (1979), Vol. Field Document No. 2 UNDP/FAO of the United Nations, Georgetown,
Guyana.
Varhegyi, G., Jakab, E., and Antal, M. J. (1994) Energy Fuels, 8, 1345-1352.
Versteeg, H. K. and Malalasekera, W. (1995) An Introduction to Computational Fluid Dyanamics, The
Finite Volume Method, Prentice Hall, Pearson Education Ltd.
.Vinya, R., Syampungani, S., Kasumu, E. C., Monde, C. and Kasubika, R. (2012) (Ed, FAO) Ministry
of Lands & Natural Resources, Lusaka, Zambia.
Walker, J. C. F., Butterfield, B. G., Langrish, T. A. G., Harris, J. M. and Uprichard, J. M. (1993) Primary
Wood Processing, Chapman and Hall, London.
Wang, Y. and Yan, L. (2008) International Journal of Heat and Mass Transfer Molecular Sciences
ISSN 1422-0067 9, 1108-1130.
Wei, D. (2000) In Heat and Furnace Technology Department of Materials Science and Engineering,
Vol. PhD Royal Institute of Technology, Stockholm Sweden.
Woods, J. and Hall, D.O. (1994) FAO - TCP.

188
World Bank/ESMAP (1990) Washington D.C.
Wu, Y. and Dollimore, D. (1998) Thermochimica Acta,, 324, p. 49-57. Zambia (2005-2008) (Ed,
Forestry, Z.) Lusaka.
Zanzi, R., Sjostrom, K. and Bjornbom, E. (2002) Biomass and Bioenergy, 23, p.357-366.
Zanzi, R., Sjostrom, K. and Bjornbom, E. (1996), Vol. 75, pp. p. 545-550.
Zaror, C. A. and Pyle, D. L. (1982) In Proc. Indian Acad. Sci. (Eng. Sci), Vol. 5 India, pp. 269-285.
Zaror, C. A. and Pyle, D. L. (1984) Models for Low Temperature Pyrolysis of Wood. Thermochemical
Processing of Biomass, Butterworths & Co. Pub. Ltd., London.

189
CHAPTER 6 CONCLUSIONS AND RECOMMENDATIONS
6.1. Summary of Findings
In this research work, a numerical method was used to study the effects of factors that
influence the carbonisation process and conversion efficiency in an earth charcoal
making kiln for the purpose of optimising the charcoal yield. It was found that the
factors having significant influence on wood conversion efficiency were wood
moisture content, diameter of the wood logs, nature of loading of wood in the kiln,
weight distribution (or distribution of log sizes), size of kiln, thickness of wall
insulation, prevailing wind direction in relation to direction of carbonisation and type
of loading (cross wise or longitudinal).
Values of factors favouring optimum conversion efficiency for high yield of charcoal
were found to be; 12-20 percent moisture content; wood log diameters of 5 -20 cm;
kiln loaded with 33 percent of each diameter categories of small, medium and large
logs sizes; kiln size of minimum length of 3.5 m by 2 - 2.5 m width and height of 2.0
m; insulation wall thickness of 20-40 cm; carbonising along prevailing wind direction;
and preferably a longitudinally loaded kiln to a crosswise loaded kiln.
The optimised earth charcoal making kiln with wood loaded crosswise had a
conversion efficiency of 12.36 percent and charcoal yield of 14.05 percent. The
optimised earth charcoal making kiln with wood loaded longitudinally had a
conversion efficiency of 18.50 percent and charcoal yield of 21.02 percent. These
results were obtained in an optimised kiln model of dimensions 7.2 m x 2.7 m x 2.2 m,
insulation wall thickness inclusive. These conversion efficiencies and charcoal yields
are better than the reported average values of 5–10 percent and 12-15 percent
respectively for an unimproved traditional charcoal making kiln.
Therefore the earth charcoal making kiln can have its conversion efficiency improved
by understanding and applying scientific methods. The findings indicate that the
optimisation procedure for charcoal production would take the following into account:
Using wood that is as dry as possible, incorporating wood of small sizes, preferably
longitudinally packing the logs into the kiln, using insulation of normal thickness,
making the kiln as big as possible and firing the kiln along the wind direction.

190
6.2. Conclusions
1. Wood Properties
The moisture content of the wood was observed to have a slight effect on the wood
conversion efficiency. Drier wood gave slightly higher relative conversion
efficiency (57.7 percent) than fresh wood (27.2 percent) on a dry basis.
The wood density changes in the modelling did not change the wood relative
conversion efficiency. This is in agreement with Hibajene’s field observations. The
model could otherwise give different results if other wood properties like heat
capacity, thermal conductivity e.t.c. were modelled.
The wood diameter significantly affects the carbonisation process efficiency in a
kiln as observed. Smaller diameter logs gave higher relative conversion efficiency
(92.8 percent) than larger diameter logs (60 percent).
2. Wood Weight Distribution
The use of more smaller diameter logs (5-20 cm) gave a better relative conversion
efficiency (92.8-60.0 percent) than large diameter logs (35-50 cm) whose relative
conversion efficiency was (25.8-16.2 percent). This is a very wide variation in the
yield.
These results implications are that earth kilns dominated by small diameter wood
logs will result in higher conversion efficiency. For high production of charcoal
kiln should be loaded with at list 33.3 percent smaller diameter logs.
3. Wood Arrangement
The longitudinal method of wood arrangement gave a higher relative conversion
efficiency (49.1 percent) than the crosswise loading (41.2 percent). Currently
charcoal producers prefer the cross wise type of wood arrangement as it is easy to
construct the pile, but for higher charcoal yield the model results show that the
longitudinally loaded kiln is better.
4. Kiln Design Features
The results of varying the kiln width and length showed a significant effect on
efficiency of carbonisation with bigger kilns resulting in a better yield. A narrow
kiln of width 1.5 m had a relative conversion efficiency of 3.6 percent while a kiln

191
of width between 2.0-2.5 m had a relative conversion efficiency averaging 92.8
percent. A kiln of length 3.5 m had a relative conversion efficiency of 85.2
percent. Bigger kilns give a better charcoal yield than small kilns.
The thinner insulation thickness (10.0 cm) resulted in higher relative conversion
efficiency (48.2 percent) than a much thicker layer of insulation (40.0 cm) of earth
mound (28.4 percent). A 20 cm thick insulation wall is best for both kiln types as
it gave relative conversion efficiency of 0.468 in either case.
5. Carbonising direction versus prevailing wind direction
In the cross wise loaded kiln firing the kiln along the prevailing wind direction
gives better relative efficiency (64.2 percent) than firing against the wind (36.9
percent). In the case of the longitudinal loaded kiln, firing against the prevailing
wind direction gave better relative conversion efficiency (63.2 percent) than firing
along the prevailing wind direction (52.0 percent). The crosswise loaded kiln fired
along prevailing wind direction is best of all options.
6. Optimised Kiln Conversion Efficiency.
In the crosswise loaded kiln the optimised conversion efficiency and charcoal yield
were 12.36 percent and 14.05 percent respectively, while for the longitudinally
loaded kiln the optimised conversion efficiency and charcoal yield were 18.50
percent and 21.02 percent respectively. This compares well with what other reports
indicate to be the efficiencies of the traditional method of charcoal production.
These efficiencies obtained in this model though are not higher than the 25 percent
threshold for potential for improvement. This shows that the traditional earth
charcoal making kiln can further be improved by considering other parameters of
influence both on kiln design and carbonisation process.
Current charcoal making in the traditional earth kiln in the field then is to some
extent in line with some improved practices. To ultimately improve the efficiencies
other parameters not considered here could be investigated.

192
6.3. Summary of Contributions
1. The research explored new territory in an earth charcoal making kiln by
exploiting features which exists in CFD in novel ways by applying CFD
simulation to a process which has potential economic importance for Zambia
in particular and Africa in general, and has not received (and probably never
will receive) attention from Western-world CFD-specialists.
2. A numerical model has been developed in 3-D that is able to simulate in
transient the factors influencing conversion efficiency during carbonisation in
an earth charcoal making kiln with help of appropriately formulated support
physical models.
3. The numerical model developed is capable of easily accommodating more
parameters for improving the kiln efficiencies.
6.4. Suggestions for Further Research
1. Calibration of the drying and pyrolysis models against experimental results by
modifying the drying and pyrolysis constants to match time taken in practice
to drive out moisture from wood for a given heat input and time-scale of
charcoal production process.
2. Inclusion of a sub model to study the evolution of the individual emitted gases,
volatiles and tars as opposed to the current modelling them as one lamp
fraction.
3. Inclusion of sub models for wood properties like thermal conductivity which
varies with temperature and conversion of wood and specific heat capacity
which affects the time taken to attain pyrolysis temperature and conversion
time.
4. For further improvement in efficiency, model can be modified to include
various kiln shapes like round, conical or cylindrical chambers with vertical,
conical or mixed wood loading in the kiln.
5. Good workmanship and kiln management is paramount in achieving good
charcoal yield.

193
6.5. Recommendations for Implementation
1. Wood for charcoal making in the field must be dried as much as possible for a
longer period by the charcoal makers to moisture content of 12 – 20 percent
wet basis for improved conversion efficiency.
2. Small logs of diameter 4.5-5.0 cm should also be carbonised by the charcoal
makers and not discarded as they have better charcoal yield of 14.05 percent
and 21.02 percent for cross loaded and longitudinally loaded kilns respectively.
3. The commonly constructed wall insulation thickness of 40 cm in the field for
the traditional earth kiln should be reduced to 20 cm for improved conversion
efficiency.
4. Longitudinally loaded kilns should be highly put into practise by charcoal
makers as they have better conversion efficiency and charcoal yield (14.05 and
21.02 percent respectively) than the commonly practised crosswise loaded
kilns (12.36 and 18.50 percent respectively).
5. Dissemination of knowledge on aspects of study found to improve conversion
efficiency and charcoal yield but thought of as not doing so in the field. These
parameters are small diameter logs, low moisture content of wood, half normal
insulation thickness, longitudinally loaded kilns and prevailing wind direction.
This can be done by the Department of Energy in the Ministry of Energy and
Water Development by revising the Manual for charcoal Production in Earth
Kilns in Zambia.
6. All the above five recommendations can be of high benefit in the Ministry of
Tourism, Environment and Natural Resources specifically for projects and
programs like: the National Appropriate Mitigation Actions (NAMAs) under
the sustainable charcoal production; Reducing Emissions from Deforestation
and Forest Degradation (REDD) as well as sustainable management of forests,
forest conservation and the enhancement of forest carbon stocks (+) (REDD+)
under the production and consumption of woodfuels; and Department of
Energy (DoE) for improvement of the Manual for Charcoal Production in
Earth Kilns in Zambia.

194
APPENDICES

195
Appendix A: Main Characteristics of Various Categories of Charcoal Kilns
Type Typical
Capacity Yield
Estimated
Cost (US$) Usage
Lambiotte 3,000-20,000
tons per year 30-35 % 0.5 to 2 million
Australia, Cote d'lvoire,
France and other developing
countries
Retort kilns Cornell 1-3 tons 22-33 % 40000
Norway and other developed
countries (smaller prototypes
tried in Ghana and Zambia)
Missouri 350 m3 25-33 % 15000 USA and other developing.
countries
Cement or masonry
kilns (Katugo) 70 m3 * 25-30 % 8000 Uganda
Brick kilns Beehive
and half-orange
9-45 m3 25-35 % 150 to 1500 Argentina. Brazil and
Malawi
Oil Drum 12-15 kg 23-28 % Low Kenya and The Philippines
Metal kilns 300-400 kg 20-25 % 2000-5000 Uganda
Pit 3-30 m3 31-35 % Very low
Sri Lanka, United Republic
of Tanzania and other
developing countries
Casamance Variable 25-31 % 200 Cameroon, Ghana, Malawi,
and Senegal
Earth kilns
Mound 5-100 m3 10-25 % Very low Many developing countries
Yield: On dry-wood weight basis (at variable moisture contents). [Source: Kristofferson and Bokalders,
1986, World Bank, 1988, Teplitz-Sempbitzky, 1990.

196
Appendix B: Challenges and opportunities for the successful development of
fundamental research
Challenges Opportunities
Feed production Feed selection.
Feed characterisation.
Improve feed specifications and establish
relationships between feed and product
characterisation.
Challenges Opportunities
Reactor and
Reaction
Heat transfer rates and
heat transfer area.
Fundamental research to improve design methods
and modelling.
Hemicellulose and
lignin cracking.
Fundamental research into primary and secondary
reactions, leading to improved reactor design and
process design.
Process improvement and optimisation.
Secondary reactions.
Fundamental research into primary and secondary
reactions, leading to improved reactor design and
process design.
Process improvement and optimisation.
Products quality
Stability.
Fundamental research to understand stability and
relate it to process parameters, technology and
feedstock.
Improve process and process control.
Yield Fundamental research to optimise the production
of a specified product of interest.
Challenges Opportunities
Scale up Design and
optimisation.
Successfully apply the results from laboratory,
pilot plant and demonstration plant and
demonstration facilities.
Use of modelling.
Connection to some other Thermochemical
conversion process like gasification or
liquefaction if need be
Source: Adapted from Bridgewater, (2002).

197
Appendix C: Summary of wood kinetic parameters and heat of pyrolysis
References p [s-1] Ea [kJ/mol] Qpc [kJ/kg] Sample
Milosavljevic et
al. (1995)
Suuberg (1994,
1996)a
9.13x10¹¹
(>327°C, and
rapid β),
1.13x10¹⁷
(<327°C, and
slow β)
139
(>327°C, and
rapid β),
221
(<327°C, and
slow β)
+70~+400
Cellulose powder
(Whatman CF-11
powder)
Kanury (1977) a 2.5x10⁴ 79.80 - - cellulose
Roberts (1970) a 7x10⁷
126 (rapid β, with
autocatalytic
effects),
235 (slow β,
without
autocatalytic
effects)
- Cellulosic
material
Fredlund (1988) a 0.54 26.3 0 Pruce
Lewellen et al.
(1976)a 6.79x10⁹ 140 -
Cellulosic
material
Orfao et al (1999,
2001)a
p1=
(1.140.4) x1015
p2=5.27x10⁵
p3=1.57x10⁻² s-1
Ea1=2017
(Cellulose)
Ea2=88.4
(Hemicellulose)
Ea3=18.1
(Lignin)
-
Pine,
Eucalyptus,
Pine bark
Gronli et al.
(2002)a
2.63x10¹⁷
(Cellulose)
2.29x10⁶
(Hemicellulose)
3.98
(Lignin)
8.13x10⁸
(extractive 1)
1.78x10¹⁰
(extractive 2)
236
(Cellulose)
100
(Hemicellulose)
46
(Lignin)
105
(extractive 1)
127
(extractive 2)
- Redwood
Wu et al. (1998)a
p1=
1 x10¹⁵
p2=1x10¹⁵
Ea1=220
Ea2=240
Red Oak
Broido & Nelson
(1975)a - 74 -
Cellulosic
material
(> 100 mg)
Kashiwagi et al.
(1992)a
2x10¹⁷ (in N2)
2x10¹²(in Air)
220 (in N2)
160 (in Air) Paper
Rath et al. (2003)a - - +122
+289
Beech
Spruce
Weatherford &
Sheppard (1964)b 5.3x10⁸ 139 +360 -
Gandhi & Kanury
(1988)b 7x10⁷ 126 +360 -
Ritchie et al.
(1997)b 2.5x10⁸ 126 +126 -
Roberts (1970)b 7x10⁷ 126 -192 -
Parker (1985)b 5.94x10⁷ 121 0 -
Tinney (1964)b
6x10⁷~7.5x10⁸
(ρ/ρw < 0.33~0.5)
4x10⁸~2x10⁹
(ρ/ρw > 0.33~0.5
124
(ρ/ρw < 0.33~0.5)
150~180
(ρ/ρw > 0.33~0.5
- -

198
Atreya (1998)b 1x10⁸ 125 0 -
Sibulkin (1985)b 1x10¹⁰ 150 +500 -
Nathasak (2004) 1.4x10⁹
125
(Hemicellulose
141 (Cellulose)
165 (Lignin)
- Redwood
a obtained from experimental data b obtained from the best fit to their numerical models c positive sign indicates endothermic, negative sign indicates exothermic
Source: Nathasak, B., (2004), Theoretical and experimental study of auto ignition of wood, PhD
Thesis, pp. 86 -87.

199
Appendix D: Biomass Conversion Technologies
Source: Bio-energy for MDG’s, Animesh Dutta, 5 June 2007

200
Appendix E: Classification of Carbonisation Systems
System for
Carbonizing Wood.
Internal source of
heat to dry and
heat wood
achieved by
burning part of
charge
External source of heat
to dry and heat wood by
burning wood, gas, coal
or oil and tars.
Direct heating by
recirculating hot neutral
gas through wood to be
carbonized.
Brick kilns
(Swartz Type)
Metal
(Lambiotte)
)Reichart etc.)
Pits
Earth Mounds
Metal Kilns
Brick Kilns Fixed
Indirect heating
through retort
walls.
Portable
Portable
Metal
Retorts
Fixed

201
Appendix F: Some Common Kiln Type for Carbonising

202
Appendix G: A modern Retort for Carbonising Wood: the Lambiotte

203
Appendix H: Research Matrix
No. Principle
Area Theory Method/Principles Tool
1. Combustion Pyrolysis under
carbonisation.
Numerical modelling
and simulations.
Intel
PHOENICS
2009
2. Wood Wood properties
and characteristics. Data collection.
Interviews
Literature
survey
Desktop
studies
Laboratory
testing
3. Kiln
Design features and
operating
characteristics.
Numerical modelling
and simulations.
Intel
PHOENICS
2008
4. Products of
carbonisation
Sample gas
analysis.
Sample gas analysis
and combustion
calculations.
Gas analysers
and spread
sheets.

204
Appendix I: Analytical Framework Matrix
No. Key Questions Requirements Input Data Expected Outputs
1.
How do wood
characteristics affect kiln
conversion efficiency?
Collection of data
on wood
characteristics.
Sizes of logs,
Moisture content,
and
Species for
charcoal
Optimal wood
characteristics for
higher conversion
efficiency.
2.
How do kiln design
features affect kiln
conversion efficiency?
Data on kiln types
and sizes.
Size
Shape
Draught system
Flue system.
Optimal kiln
design for higher
conversion.
3.
How do kiln operating
characteristics affect kiln
conversion efficiency?
Heating rate and
residence time of
solids and gases in
kiln.
Heating rates and
residence times in
kilns
Optimal operating
conditions for
higher kiln
conversion
efficiency.
4.
How can non-solid
products of carbonisation
be reduced or used
efficiently?
Improvement of
carbonisation
process in kiln.
Factors affecting
carbonisation
process.
Reduced emission
levels and good
environment.

205
Appendix J: Tasks, Methodology, Scope and Outcomes
No. Task Task
Description Methodology Scope Outcomes
1. Wood
characteristics
Determine effect
of wood
characteristics
on kiln
conversion
efficiency.
Mathematically
model and simulate
the effects.
Dia.: .05-1.0m
Length:1.0-
2.0m
Moisture: 30-
60%
Species: Best
Optimal wood
size and
suitable wood
species.
2. Kiln design
features
Determine
influence of kiln
design features
on conversion
efficiency.
Model and
simulate effect of
kiln design using
the best
characteristics of
wood.
Kiln size: 1-
1500m3
Shape: square,
rectangular.
Firing Hole: against and
along
prevailing
wind
Optimal kiln
design for
higher
conversion
and charcoal
yield.
3.
Wood weight
distribution
and
arrangement
Determine best
wood weight
distribution and
arrangement in
kiln.
Model and
simulate effect of
wood weight
distribution and
arrangement on
kiln conversion
efficiency using the
optimised kiln
design and wood
characteristics.
Large logs at
bottom or vice
versa.
Cross piling,
Longitudinal
piling or
Vertical piling.
Most suitable
type of wood
distribution
and
arrangement
in kiln for
higher
conversion
efficiency.
4.
Effect of kiln
operating
conditions
Determine the
optimal heating
rate and
residence time in
kiln.
Model and
simulate effect of
kiln operating
characteristics on
conversion
efficiency using the
optimised kiln with
best wood
characteristics and
wood loading.
Heating rate
and
residence times
to be
determined.
Optimal
heating rate
and residence
time of solids
and gases in
kiln.
5. Validation
Validation of
numerical results
of the optimised
kiln design in the
field.
Use field results
and experiments in
literature
Observed kilns
at Kamaila
Matching of
numerical and
practical
results.

206
Appendix K: Site Maps for some Charcoal Production Areas Sampled [Copperbelt:
(a) Chingola, and (b) Kalulushi]
(a) Chingola
(b) Kalulushi

207
Appendix L: Site Maps for some Charcoal Production Areas Sampled [Central: (a)
Kapiri-Mposhi, and (b) Line of Rail: Central/Copperbelt provinces]
(a)Kapiri-Mposhi
(b) Line of Rail: Central/Copperbelt provinces

208
Appendix M: Tree Species Suitable for Charcoal Making in Zambia
Botanical Name Vernacular Name Characteristics
Brachystegia allenii Muumba (T) Good for charcoal
Brachystegia boehmii Musamba (B), Mubombo (L),
Muombo (T)
Heavy, tough and strong with
coarse interlocking grain.
Good for charcoal
Brachystegia bussei Munkulungu (B), Chikungu
(L)
Heavy, not durable. Good for
charcoal
Brachystegia floribunda Mosompa (B), Musobo (L) White wood, no heartwood,
good for charcoal
Brachystegia manga Musompa (B) Very heavy and strong, not
durable. Good for charcoal
Brachystegia spiciformis Muputu (B), Mutuya (L)
Moderately heavy, tough, hard
interlocked grain, not durable.
Good for charcoal
Brachystegia taxifolia Ngalati (B), Mukube (L) Good for charcoal
Bridelia micrantha Musabayembe (B),
Mushiwe (T)
Very hard, moderately hard,
heavy, very durable. Excellent
charcoal
Dicrostachys cinerea Kansalonsalo (B)
Katenge (T)
Hard and tough, durable, small
size, good firewood and
charcoal
Diplorhynchus condylocarpon Mwenge (B), Mutowa (T) Small size, good firewood.
Good charcoal
Erythrophleum africanum Kayimbi (B), Mungansa (T)
Mukoso (L) Very hard. Excellent charcoal
Eucalyptus (Gum Trees) Mulemu (B)
Properties differ species to
species. Good for firewood and
charcoal
Faurea speciosa Saninga (B), Musokoto (L),
Musenya (T)O
Mottled, hard, durable. Very
good charcoal
Isoberlinia angolensis Mutobo (B, L), Moderately heavy and strong.
Good firewood and charcoal
Julbernardia golbiflora Mpasa (B), Katondomumba
(L), Sandwe (T)
Strong, hard and heavy. Coarse
textured. Good fo charcoal
Julbernardia paniculata Mutondo (B, L, T), Hard, coarse grained. Good for
charcoal
Marquesia macroura Museshi (B), Musanya (K) Durable, very hard. Excellent
charcoal but poor charcoal
Monotes africanus Chimpampa (B),
Mutembo (L, T)
Strong and moderately
durable. Good for charcoal
Parinari curatellifolia Mupundu (B), Mubula (L),
Mula (T)
Very hard, but acceptable
charcoal
Pericopsis angolensis Mubanga (B, L, T), Hard, heavy, durable. Good
firewood and charcoal
Pseudolachnostylis
maprouneifolia
Musangati (B), Mukunyu (L,
T)
Moderately heavy, good
firewood and charcoal
Tamarindus indica Mushishi (B), Musika (T) Very hard, good charcoal
Source: “Know your trees” Some of the common trees found in Zambia by A. E. G Storrs, 1995.
NB: Some trees not usually cut for charcoal production. In the Miombo woodlands some tree species
are known to produce poor quality charcoal. Some species are too hard to cut especially with an axe. It
is also illegal to cut fruit trees. Other trees are left due to their value in producing good quality timber
or wood. All such species not listed here, but see Hibajene, S. H. and Kalumiana, O. S., 2003, Manual
for Charcoal Production in Earth Kilns in Zambia, Department of Energy, Ministry of Energy and
Water Development, Lusaka, Zambia.

209
Appendix N: Nature of data collected for numerical model of earth charcoal kiln
TYPE OF DATA UNITS
Location Data
Province Name
District Name
Area Name
Barometric Data
Temperature (ambient) °C
Pressure (atmospheric) Pa (N/m2)
Wind direction (general)
Wood Data
Wood Type Species (Appendix J)
Maturity of wood Descriptive
Wood drying duration Months
Log length (maximum) Meter
Log length (minimum) Meter
Log length (average) Meter
Log diameter (maximum) Centimeter
Log diameter (minimum) Centimeter
Log diameter (average) Centimeter
Kiln Data
Kiln shape
Rectangular,
conical,
circular
Kiln length (uncovered) Meter
Kiln width (uncovered) Meter
Kiln height (uncovered) Meter
Guard thickness Meter
Wood distribution
Cross,
longitudinal,
vertical
Number of stringers Number
Kiln orientation Direction
Draught system orientation Direction
Flue system orientation Direction
Draught system location On kiln faces
Flue system location On kiln faces
Firing hole orientation Direction
Firing hole size Direction
Firing hole location (center) On kiln faces
Expected number of bags Number
Operation Data
Firing time of day Time of day
Monitoring intervals Hours
Monitoring times of the day Time of day
Carbonization duration (estimated) Days
Experience of charcoaler Months to years

210
Appendix O: Summary of analysed field data for numerical simulations
SNo. Parameter Units Range Sample Average
Value Lowest Highest
1. Woodlog diameter m 0.08 0.57 0.34
2. Woodlog length m 1.60 2.89 2.42
3. Kiln stack width m 1.14 4.50 2.99
4. Kiln stack length m 1.40 10.97 6.41
5. Kiln stack height m 1.13 2.30 1.60
6. Insulation thickness m 0.10 0.677 0.35
7. Kiln insulated width m 1.34 5.85 3.60
8. Kiln insulated length m 1.60 12.32 6.96
9. Stringer diameter m 0.12 0.18 0.15

211
Appendix P: Overview of the transient SIMPLE solution procedure in PHOENICS
START
t>tmax
Convergent?
STOP
Step 1: Initiate velocities, pressure and other variables
Step 2: Set time step t
Step 3: Solve discretised momentum equations
Step 4: Solve pressure correction equations
Step 5: Correct pressure and velocities
Step 6: Solve all other discretised transport equations
Yes
Yes
No
No

212
Appendix Q: Flowchart encapsulating the various flow physics in kiln
Computational Fluid Dynamics and Heat Transfer
Transient/Unsteady
Viscous Fluid
External
(Wind profile
surrounding kiln)
Internal
(Inside kiln)
Compressible
(Air for combustion)
Incompressible
(Water, Low speed air in kiln)
Heat Transfer
Laminar Turbulent Radiation Conduction Convection
Fluid

213
Appendix R: Tables of results for Numerical Experiments
Table Appendix R.1 Density of Wood logs
Wood Density
(kg/m3) 350 450 550 600 700 1000 1250
Charcoal
Fraction 0.320 0.320 0.320 0.320 0.320 0.320 0.320
Table Appendix R.2 Moisture content of Wood Logs
Wood
Moisture
Content (%)
12 15 18 20 25 30 35
Charcoal
Fraction 0.577 0.519 0.457 0.392 0.364 0.319 0.272
Table Appendix R.3 Diameter of wood (Crosswise loading)
Diameter of
log (m) 0.05 0.15 0.25 0.30 0.35 0.45 0.50
Charcoal
Fraction 0.928 0.778 0.412 0.320 0.258 0.185 0.162
Table Appendix R.4 Diameter of wood (Longitudinal loading)
Diameter of
log (m) 0.05 0.15 0.25 0.30 0.35 0.45 0.50
Charcoal
Fraction 0.928 0.857 0.491 0.382 0.308 0.218 0.190
Table Appendix R.5 Logs distribution (Uniform diameter of 0.25 m)
Arrangement Crosswise Longitudinal
Charcoal
Fraction 0.412 0.491

214
Table Appendix R.6 Logs distribution (Non-uniform diameters 0.05, 0.20, 0.35 m)
Arrangement Crosswise Longitudinal
Charcoal
Fraction 0.845 0.928
Table Appendix R.7 Width of Kiln (Non-uniform diameter distribution)
Arrangement Crosswise Longitudinal
Width of
Kiln (m) 1.5 2.0 2.5 3.0 1.5 2.0 2.5 3.0
Charcoal
Fraction 0.032 0.928 0.928 0.845 0.036 0.928 0.928 0.928
Table Appendix R.8 Length of Kiln (Non-uniform diameter distribution)
Arrangement Crosswise Longitudinal
Length of
Kiln (m) 3.5 7.0 10.5 21 3.5 7.0 10.5 21
Charcoal
Fraction 0.852 0.845 0.833 0.956 0.928 0.928 0.954 0.951
Table Appendix R.9 Insulation Wall Thickness (Wood stack: 2m x 3m x 7m)
Arrangement Crosswise Longitudinal
Wall
thickness
(m)
0.1 0.2 0.4 0.6 0.1 0.2 0.4 0.6
Charcoal
Fraction 0.482 0.458 0.328 0.229 0.667 0.468 0.284 0.192
Table Appendix R.10 Prevailing Wind Direction (Wood stack: 2m x 3m x 7m)
Arrangement Crosswise Longitudinal
Direction of
wind Against Along Against Along
Charcoal
Fraction 0.369 0.642 0.632 0.452


![KASAMA KASISI REPORT 2009 [Kompatibilitetsmodus] · KASAMA KASISI REPORT 2009 Traditional charcoal kiln at work in Zambia One ton of dry wood gives 250kg charcoal. The rest, mostly](https://static.fdocuments.net/doc/165x107/5f335d68eabdda152d506bd5/kasama-kasisi-report-2009-kompatibilitetsmodus-kasama-kasisi-report-2009-traditional.jpg)