
IMPROVEMENT OF COMPRESSIBILITY CHARACTERISTICS OF … · IMPROVEMENT OF COMPRESSIBILITY...
13
80 IMPROVEMENT OF COMPRESSIBILITY CHARACTERISTICS OF MODEL ORGANIC SOILS Dr. Adel H. Majeed 1 , Dr. Madhat S. Al-Soud 2 , *Zainab H. Sadiq 3 1) Asst. Prof., Civil Engineering Department, Al-Mustansiriayah University, Baghdad, Iraq. 2) Asst. Prof., Civil Engineering Department, Al-Mustansiriayah University, Baghdad, Iraq. 3) Civil Engineering Department, Al-Mustansiriayah University, Baghdad, Iraq. Abstract: The characteristics of organic soil are low permeability, low shear strength and high compressibility, therefore organic soil has to be improved before any engineering works can commence. In this study dry kaolinite is used as a clay minerals and fresh reed as an organic material for different percentages (0%, 2%, 5%, 8%, 12% and 20%) by dry weight. Lime is used as a treatment material of different percentages (0%, 3%, 6%and 9%) by dry weight. The experimental work included a series of compaction and compressibility tests conducted on 48 samples. The effect of addition of lime on compressibility characteristics of non-decomposed and decomposed model organic soil was studied. The results showed that the compressibility characteristics [compression index, rebound index, coefficient of consolidation and coefficient of secondary compression] are increased with increased organic content for decomposed and non-decomposed samples. The use of lime has improved the compressibility characteristics of organic soil. Keywords: organic content, lime, compressibility characteristics, (Cc), (Cr), (Cv), (Cα). نضغاطئص ا تحسين خصا ية لتربة عضويةصة الخ: يتئص انخشبت انعضى خصا ا ه اتفارهت ان قه و راثضغاط. نزنكت اخفضت وعانىة انقص ي ق فأحخاجت ح انخشبت انعضىحس ح اناست انذس هزت. فذسال ه اع ا قبم انبذء ف انكاونخذو ا سخ ج اادةصذس نهنطاصج ك , وانقصب ا انطعذصذس ن ك( خهفتسب يخت وب انعضى0 , 2 , 5 , 8 , 22 , 20 نداف. ا انىص ي%) خذيج اسخ( خهفتسب يخة يعاندت وبادىسة ك ان3 , 6 , 9 ي%) نداف. ا انىص و قذم انم انع ش انشص( نفحىصاث اهسهت ي س خبش خضغاط واج عه اخش انخ) 48 ت. ع ثضافتش است حاث ى دساخائح ت. اظهشث انخحههش انخحههت وغت انىرخ ت انط نهخشبت انعضىضغاث ا يعايىسة عه ان( تضغاطئص ا خصا اش يؤشضغاط , اش يؤشفاخ,خ اى نثاو ااضيم ا و يعااوضيم ا يعارج انا نهحخىي انعضىدة انا حضداد يع ص) خ حههش ت و غخ انتت نهخشبت انعضىضغاطئص ا خصاحس حىسة ادي انخذاو ان حههت. اسخ. 1. Introduction Organic materials in soil are created from decomposition of animal and plant residues. When this material incorporated in the soil is attacked by variety of worms, *Corresponding Author [email protected] www.jeasd.org Vol. 21, No.02, March 2017 ISSN 2520-0917
Transcript of IMPROVEMENT OF COMPRESSIBILITY CHARACTERISTICS OF … · IMPROVEMENT OF COMPRESSIBILITY...
Journal of Engineering and Sustainable Development Vol. 21, No. 02, March 2017 www.jeasd.org (ISSN 2520-0917)
80
IMPROVEMENT OF COMPRESSIBILITY CHARACTERISTICS
OF MODEL ORGANIC SOILS
Dr. Adel H. Majeed1, Dr. Madhat S. Al-Soud2, *Zainab H. Sadiq3
1) Asst. Prof., Civil Engineering Department, Al-Mustansiriayah University, Baghdad, Iraq.
2) Asst. Prof., Civil Engineering Department, Al-Mustansiriayah University, Baghdad, Iraq.
3) Civil Engineering Department, Al-Mustansiriayah University, Baghdad, Iraq.
Abstract: The characteristics of organic soil are low permeability, low shear strength and high
compressibility, therefore organic soil has to be improved before any engineering works can commence.
In this study dry kaolinite is used as a clay minerals and fresh reed as an organic material for different
percentages (0%, 2%, 5%, 8%, 12% and 20%) by dry weight. Lime is used as a treatment material of
different percentages (0%, 3%, 6%and 9%) by dry weight. The experimental work included a series of
compaction and compressibility tests conducted on 48 samples. The effect of addition of lime on
compressibility characteristics of non-decomposed and decomposed model organic soil was studied. The
results showed that the compressibility characteristics [compression index, rebound index, coefficient of
consolidation and coefficient of secondary compression] are increased with increased organic content for
decomposed and non-decomposed samples. The use of lime has improved the compressibility
characteristics of organic soil.
Keywords: organic content, lime, compressibility characteristics, (Cc), (Cr), (Cv), (Cα).
لتربة عضوية يةتحسين خصائص االنضغاط
انخشبت انعضىت ححخاج فأ قىة انقص يخفضت وعانت االضغاط. نزنك و راث قههت انفارت اهاخصائص انخشبت انعضىت ي : الخالصة
كصذس نعذ انط , وانقصب انطاصج كصذس نهادة اجسخخذو انكاوناقبم انبذء ف ا اعال هذست. ف هز انذساست ان ححس
9, 6, 3انىسة كادة يعاندت وبسب يخخهفت )اسخخذيج (% ي انىص انداف. 20, 22, 8, 5, 2, 0انعضىت وبسب يخخهفت ) (% ي
ى دساست حاثش اضافت ثعت. 48( انخ اخشج عه واالضغاط خخبش سهسهت ي انفحىصاث )انشصشم انعم انو قذ انىص انداف.
يؤششا خصائص االضغاطت ) انىسة عه يعايالث االضغاط نهخشبت انعضىت انىرخت انخحههت وغش انخحههت. اظهشث انخائح
ت و غش حههخ( حضداد يع صادة انحخىي انعضى نهارج انيعايم االضاو و يعايم االضاو انثاىاالخفاخ, يؤششاالضغاط ,
.حههت. اسخخذاو انىسة ادي ان ححس خصائص االضغاطت نهخشبت انعضىتانخ
1. Introduction
Organic materials in soil are created from decomposition of animal and plant
residues. When this material incorporated in the soil is attacked by variety of worms,
*Corresponding Author [email protected]
www.jeasd.org
Vol. 21, No.02, March 2017 ISSN 2520-0917
Journal of Engineering and Sustainable Development Vol. 21, No. 02, March 2017 www.jeasd.org (ISSN 2520-0917)
81
microbes and insects in the soil if the soil is moist. A large number of studies
investigated the behavior of organic soil. The problems of organic soils are represented
by high compressibility, poor shear strength, and high magnitude and rates of creep.
Abbass et al.[1] found that the organic content plays an important role in reducing the
maximum dry density and increasing the optimum water content. Similar results were
obtained by Habbi[2]. Zbar et al[3] concluded that the optimum water content and
maximum dry density decreased with increasing organic matter due to decreasing the
specific gravity.
Yunus[4], found that the addition of lime decreases the maximum dry density and
increases the optimum water content. Rafizul et al.[5], illustrated the geotechnical
properties of treated soil prepared in the laboratory by mixing bentonite, lime and
cement at varying content of (5, 10, 15, 20 and 25) % of dry mass of organic soil. They
found that the optimum moisture content decreases while the maximum dry density
increased with increasing the admixture content.
Andersland and Al-Khafaji[6], proposed an approach for approximating the
consolidation settlement of organic soil using kaolinite as a clay mineral and wood pulp
fiber as organic material (slurry) in a manner independent of the compression index.
Adejumo[7],investigated the effect of organic content on consolidation characteristics
of organic clayey soils. It was found that the increase in organic content leads to
increase the initial void ratio. It was further shown that at lower stress, high organic
content clay samples experienced significant decrease in void ratio with a little increase
in pressure. The compression index (Cc) was increased (parabolic variation) with the
increase in organic content
Thiyyakkandi and Annex[8], showed that the coefficient of consolidation (Cv) is
decreased (parabolic) with the increase in organic content. Rabbee and Rafizul[9],
determined the coefficient of consolidation by using log fitting method, and illustrated
that this coefficient is generally increases with the increase in consolidation pressure
and the organic content
Wardwell and Nelson[10], studied the effect of organic materials on the coefficient of
secondary compression (Cα). They illustrated that (Cα) increases with increasing the
organic content which cause a large void ratio in the soil mass.
Therefore organic soil has to be improved before starting any engineering works. The
improvement can be represented by replacing the soil in the site with the superior
material or; change the engineering properties of in situ soil according to standard
requirement by adding another materials which known as soil stabilization[11].Chemical
stabilization methods are presented to provide mitigation of total and differential
settlements, soil strength improvement, reduced construction costs, shorter construction
period, and other characteristics which may influence on their operation to specific
projects on organic soil.
2. Experimental Work
2.1 Materials

Journal of Engineering and Sustainable Development Vol. 21, No. 02, March 2017 www.jeasd.org (ISSN 2520-0917)
82
1. Soil: the kaolinite clay, taken from local market, was used as a soil mass.
2. Organic Materials: The fresh reeds as a source of organic materials were taken
from AL-Talbiya in Baghdad city is air dried, chopped to small pieces and then
sieved. The materials passing sieve No.10 and retained on sieve No.200 were
considered as fibrous organic materials.
3. Lime: Quick lime was used as a treatment material taken from local market.
2.2 Preparation of soil samples
The soil samples were mixed with fresh reed in two different methods:
The first method by mixing dry kaolinite as clay minerals with fresh reed as a source
of organic materials at different percentages (0, 2, 5, 8, 12, 20) % by dry weight of soil.
Then each sample (with a certain percentage of fresh reed) was stabilized by adding
three different percentages of lime (3, 6, 9)% by dry weight of sample.
The second method by mixing kaolinite with fresh reed at different percentages (0, 2,
5, 8, 12, 20) % by dry weight of soil at a saturation condition. Saturation condition was
checked by left the samples in a bucket for six months soaked in water to achieve
decomposition of organic material. After this period of soaking the samples were air-
dried, grinded and sieved to remove the non-decomposed reed materials. Each sample
was stabilized by adding three different percentages of lime (3, 6, 9) % by dry weight of
sample.
2.3 Laboratory investigation
The Physical and classification properties of kaolinite are shown in Table (1) while
the chemical properties of Kaolinite and lime are showed in Tables (2) and (3)
respectively.
Table (1) Physical and classification properties of kaolinite.
Properties Value Standard
Specific Gravity (Gs) 2.63 ASTM D 854-00
Liquid Limit (L.L.)% 51.45 B.S.1377:1975
Plastic Limit (P.L.)% 28 B.S.1377:1975
Plasticity Index (P.I)% 23.45
Standard Compaction Test
Maximum dry unit weight
ɣd max. (kN/m3)
Optimum water content (%)
(o.w.c)
15.84
22.21
ASTM D698-78
Unified Soil Classification
System (USCS)
CH* ASTM D2487-06
* CH: Clay of high plasticity.
Table (2) Chemical composition of kaolinite.
Chemical Element Percent ( % )
SiO2 50.9
Al2O3 42.3

Journal of Engineering and Sustainable Development Vol. 21, No. 02, March 2017 www.jeasd.org (ISSN 2520-0917)
83
CaO 2.4
Fe2O3 1.7
MgO 0.8
Loss of Ignition 1.8
Table (3) Chemical composition of lime.
Chemical Element Percent ( % )
CaO 69.8
MgO 2.4
Fe2O3 1.9
AL2O3 1.2
SiO2 2.3
SO3 0.5
CO2 2.7
Loss of Ignition 19.1
2.4 Testing program
A detailed testing program was conducted on the modeled organic soil. All tests are
summarized in the flow chart shown in Figure (1).
Figure (1) Flow chart of testing program.
2.5 Organic content test
Ignition method is used in this study to determine the percent of organic content in the
soil according to ASTM D2974. The results of organic content tests by the ignition
method are summarized in Table (4) after the decomposition of soil samples.
Compaction
tests
Experimental
work
Organic content tests
Soil samples with
organic content
(0,2,5,8,12,20)%
Saturated soil samples
with organic content
(0,2,5,8,12,20)% after 6
months
Mixed
samples
with lime
(3,6,9)%
Mixed
samples with
lime
(3,6,9)%
One
dimensional
compression
tests
Chemical tests

Journal of Engineering and Sustainable Development Vol. 21, No. 02, March 2017 www.jeasd.org (ISSN 2520-0917)
84
Table (4) Results of Ignition test method for samples after 6 months of saturation.
Organic content (O.C %)
Before after
2 1.83
5 4.62
8 6.92
12 10.96
20 13.79
2.6 Compaction Tests
The standard compaction effort is used according to ASTM D698-78 specification.
2.7 One Dimensional Compression Tests
The one dimensional compression test is performed according to the conventional
procedure recommended by (ASTM D2435-80). The samples are prepared by calculate
the sample weight corresponding to 90% of maximum dry unit weight at an optimum
water content, according to Equation (1).
(1)
4. Result and Discussion
4.1 Physical Properties
The physical properties which are investigated in this study include the specific
gravity for non-decomposed and decomposed samples. The values of specific gravity of
samples are presented in Table (5). The obtained results are calculated from Equation
(2)[12], depending on the values of specific gravity of natural soil equal to (2.63),
organic material (1.67) and lime equal to (2.52).
pps
ps
G)PG(G
GGG
(2)
Table (5) Values of specific gravity for both non-decomposed and decomposed sample.
Non-decomposed Decomposed
O.C % Lime % G O.C* % Lime % G
0
0 2.63
0
0 2.63
3 2.627 3 2.627
6 2.623 6 2.623
9 2.619 9 2.619
2
0 2.6
1.83
0 2.603
3 2.598 3 2.6 6 2.595 6 2.598

Journal of Engineering and Sustainable Development Vol. 21, No. 02, March 2017 www.jeasd.org (ISSN 2520-0917)
85
9 2.593 9 2.595
5
0 2.557
4.62
0 2.562
3 2.556 3 2.561
6 2.555 6 2.559
9 2.554 9 2.558
8
0 2.514
6.92
0 2.529 3 2.514 3 2.528
6 2.514 6 2.528
9 2.515 9 2.528
12
0 2.46
10.96
0 2.474
3 2.462 3 2.475
6 2.464 6 2.477
9 2.465 9 2.478
20
0 2.36
13.79
0 2.437
3 2.365 3 2.439
6 2.369 6 2.442
9 2.374 9 2.444
* After decomposition of organic material. 4.2 Compaction tests
The results of the compaction tests are shown in Tables (6) and (7) for non-
decomposed and decomposed samples respectively. The maximum dry density is
decreased with increasing the organic content for each percent of lime in both cases
(non-decomposed and decomposed samples), while no significant effect was noticed
with increasing lime content for all percent of organic content except 12% and 20%
organic contents for non-decomposed samples. At these two organic contents, the
maximum dry density was continuously increased due to the addition of lime. These
results may be related to the effect of specific gravity of samples (increasing specific
gravity leads to increase max. dry density).
The optimum water contents were increased with increasing the organic content for
each percent of lime in both cases, while no significant effect can be recognized when
added lime for each percentage of organic content and for both non-decomposed and
decomposed samples. These results are due to the insufficient time required to complete
the reaction between the lime with soil particles and lime with organic content.
Table (6) Value of maximum dry density for organic soil with different percentage of lime.
(a) Non-decomposed samples.
%O.C
% Lime
0 2
5
8 12 20
0 15.48 14.58 13.82 12.99 12.29 10.74
3 15.16 14.52 13.87 13.35 12.87 11.11
6 15.25 14.55 13.89 13.37 12.83 11.11
9 15.28 14.56 13.75 13.39 12.85 11.11
(b) Decomposed samples.
%O.C
% Lime
0 1.83 4.62 6.92 10.96 13.79
0 15.48 14.39 14.31 14.07 13.88 13.52
Journal of Engineering and Sustainable Development Vol. 21, No. 02, March 2017 www.jeasd.org (ISSN 2520-0917)
86
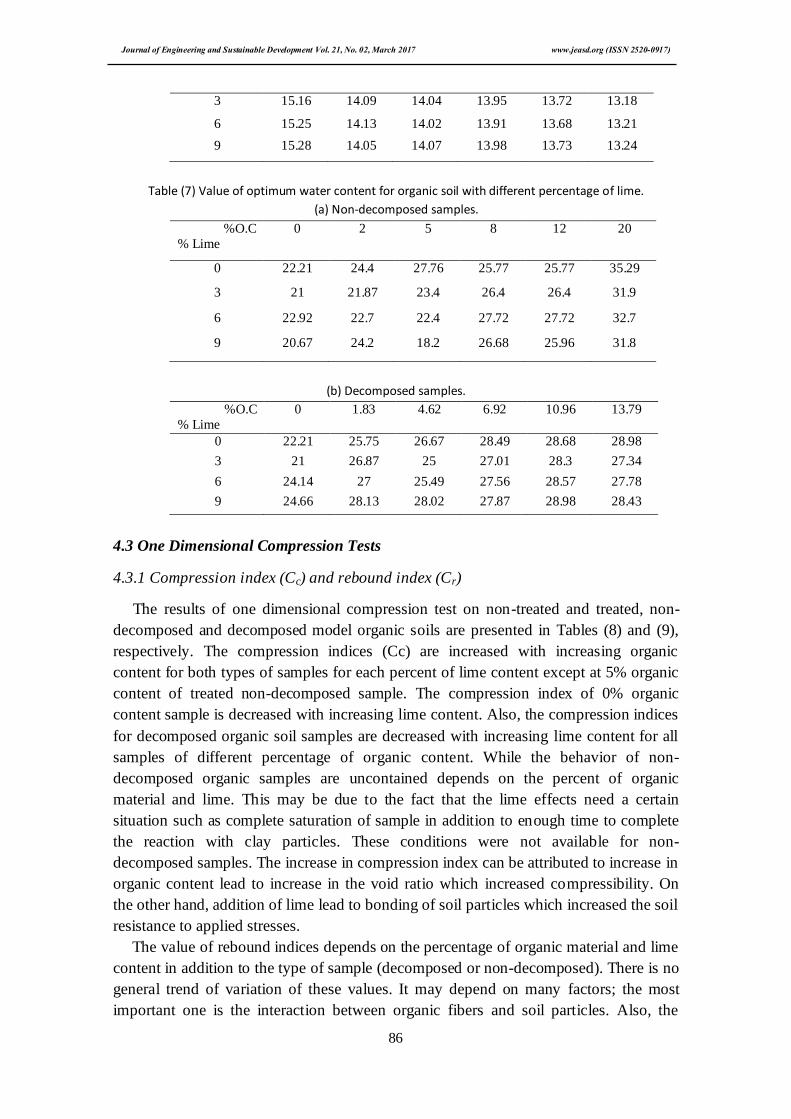
3 15.16 14.09 14.04 13.95 13.72 13.18
6 15.25 14.13 14.02 13.91 13.68 13.21
9 15.28 14.05 14.07 13.98 13.73 13.24
Table (7) Value of optimum water content for organic soil with different percentage of lime.
(a) Non-decomposed samples.
%O.C
% Lime
0 2
5
8 12 20
0 22.21 24.4 27.76 25.77 25.77 35.29
3 21 21.87 23.4 26.4 26.4 31.9
6 22.92 22.7 22.4 27.72 27.72 32.7
9 20.67 24.2 18.2 26.68 25.96 31.8
(b) Decomposed samples.
%O.C
% Lime
0 1.83 4.62 6.92 10.96 13.79
0 22.21 25.75 26.67 28.49 28.68 28.98
3 21 26.87 25 27.01 28.3 27.34
6 24.14 27 25.49 27.56 28.57 27.78
9 24.66 28.13 28.02 27.87 28.98 28.43
4.3 One Dimensional Compression Tests
4.3.1 Compression index (Cc) and rebound index (Cr)
The results of one dimensional compression test on non-treated and treated, non-
decomposed and decomposed model organic soils are presented in Tables (8) and (9),
respectively. The compression indices (Cc) are increased with increasing organic
content for both types of samples for each percent of lime content except at 5% organic
content of treated non-decomposed sample. The compression index of 0% organic
content sample is decreased with increasing lime content. Also, the compression indices
for decomposed organic soil samples are decreased with increasing lime content for all
samples of different percentage of organic content. While the behavior of non-
decomposed organic samples are uncontained depends on the percent of organic
material and lime. This may be due to the fact that the lime effects need a certain
situation such as complete saturation of sample in addition to enough time to complete
the reaction with clay particles. These conditions were not available for non-
decomposed samples. The increase in compression index can be attributed to increase in
organic content lead to increase in the void ratio which increased compressibility. On
the other hand, addition of lime lead to bonding of soil particles which increased the soil
resistance to applied stresses.
The value of rebound indices depends on the percentage of organic material and lime
content in addition to the type of sample (decomposed or non-decomposed). There is no
general trend of variation of these values. It may depend on many factors; the most
important one is the interaction between organic fibers and soil particles. Also, the

Journal of Engineering and Sustainable Development Vol. 21, No. 02, March 2017 www.jeasd.org (ISSN 2520-0917)
87
interaction of both materials with lime and the chemical reactions which may developed
between these materials.
Table (8) Summary of compression tests results for non-decomposed samples with different percentage
of lime.
Properties
%Lime
O.C.%
0 2 5 8 12 20
ɣd(kN/m3) 0 13.95 13.25 12.766 11.5 11.16 9.822
3 13.58 13.115 12.2 11.86 11.714 9.9191
6 12.843 13.05 12.143 12.07 11.676 9.9314
9 13.713 13.204 12.056 12.1 11.669 9.81
%ofɣd max.* 0 90.18 90.85 92.37 88.53 90.81 91.45
3 89.578 90.324 87.96 88.84 91.02 89.281
6 91.01 89.691 87.423 90.28 91.01 89.391
9 90.395 90.687 87.68 90.366 90.81 88.299
e 0 0 0.849 0.9272 0.9837 1.154 1.172 1.375
3 1.0954 0.944 1.0794 0.8052 1.0721 1.2499
6 1.0034 0.9531 1.0826 0.781 1.0799 1.187
9 0.9292 0.9268 1.0959 0.816 1.0822 1.2547 w.c.(%) 0 23.42 29.69 32.47 27.27 36.53 37.39
3 22.41 34.71 36.499 34.363 33.203 32.24
6 24.63 36.79 36.44 31.27 33.824 32.97
9 25.03 34.894 37.791 35 32.559 32.28
Cc 0 0.1997 0.2138 0.2603 0.2394 0.3169 0.4497
3 0.1736 0.2579 0.23 0.3136 0.3985 0.4234
6 0.0837 0.23682 0.218 0.2396 0.313 0.4671
9 0.0634 0.2291 0.1876 0.2829 0.361 0.5121
Cr 0 0.0538 0.0615 0.0769 0.0454 0.0469 0.0813
3 0.0149 0.0258 0.0254 0.0286 0.0469 0.0816
6 0.01986 0.0449 0.019 0.0279 0.0318 0.0415
9 0.02153 0.0328 0.0329 0.0306 0.0387 0.0466
*% of ɣ d max = ɣ d used / ɣ d max.
Table (9) Summary of compression tests results for decomposed samples with different percentage of
lime.
Properties
%Lime
O.C%
0 1.83 4.62 6.92 10.96 13.79
ɣd(kN/m3)
0 13.95 12.95 12.852 12.632 12.57 12.259
3 13.58 12.801 12.688 12.58 12.34 11.7101
6 12.843 12.572 12.686 12.289 12.38 12.02
9 13.713 12.437 12.508 12.68 12.292 11.808
% of ɣdmax*
0 90.18 89.99 89.81 89.78 90.56 90.67
3 89.578 90.851 90.37 90.175 89.942 88.85
6 91.01 88.975 90.485 88.35 90.497 90.99
9 90.395 88.516 88.898 90.7 89.527 89.18
e 0
0 0.849 1.144 1.0491 1.2025 1.2563 1.661
3 1.0954 0.992 0.9799 1.0565 1.163 1.043
6 1.0034 1.0382 0.9787 1.0496 1.148 0.9597
9 0.9292 1.0467 1.0061 1.0697 1.143 0.94719

Journal of Engineering and Sustainable Development Vol. 21, No. 02, March 2017 www.jeasd.org (ISSN 2520-0917)
88
w.c.(%)
0 23.42 26.143 27.37 29.364 30.67 30.52
3 22.41 29.69 25.77 28.85 28.714 28.125
6 24.63 28.696 27.368 27.5 29.53 29.289
9 25.03 30.099 28.824 27.083 29.355 29.074
Cc
0 0.1997 0.2841 0.2958 0.3786 0.5163 0.5195
3 0.1736 0.2293 0.2347 0.3481 0.27301 0.3136
6 0.0837 0.221 0.2248 0.3367 0.2573 0.3128
9 0.0634 0.2077 0.2056 0.3201 0.2389 0.242
Cr
0 0.0538 0.0364 0.033 0.0507 0.0311 0.025
3 0.0149 0.0243 0.02875 0.0307 0.0327 0.0475
6 0.01986 0.0391 0.0309 0.0327 0.03301 0.0535
9 0.02153 0.0325 0.0213 0.0332 0.0317 0.0503
*% of ɣ d max = ɣ d used / ɣ d max.
4.3.2 Coefficient of consolidation (Cv)
The results of non-decomposed and decomposed samples for different lime content are
summarized in Tables (10) and (11). Square root time method is used to determine the
coefficients of consolidation for samples. The general trend of variation of Cv is the
value of Cv are increased with the increase of organic content and with increase of
consolidation pressure for each percent of lime content and for non-decomposed and
decomposed samples. While the values of Cv are decreased with the increase of lime
content for all consolidation stresses and for each percentage of organic content and for
non-decomposed and decomposed samples. The increase in organic content causes an
increase in the void ratio then increase in permeability which cause increase in the
values of Cv . On the other hand, the addition of lime causes pozzolanic reaction taking
place within the soil which in turn changes the soil matrix. The adsorbed cations of the
clay mineral exchanges with the free calcium in lime, which decrease the size of spread
water layer surrounding the clay particles meant causing agglomeration/flocculation of
the clay particles, which changes the clay into a more sand-like or silt-like materials[13].
Table (10) Values of Cv(m2/yr) for non-decomposed samples with different percentage of lime.
20 12 8 5 2 0 %O.C
%Lime
P(kPa)
5.93 1.65 2.53 0.94 0.63 0.53 0
3.73 0.94 1.61 0.63 0.53 0.44 3
25
2.81 0.72 1.29 0.46 0.51 0.36 6
2.87 0.58 0.82 0.56 0.48 0.34 9
6.72 6.2 1.94 1.57 0.97 0.72 0
6.32 4.26 1.92 0.94 0.84 0.71 3
50 6.04 3.57 1.58 0.75 0.82 0.64 6
5.73 3.18 1.49 0.83 0.74 0.62 9 7.04 6.82 5.28 1.94 1.53 0.93 0
6.47 3.72 4.91 1.27 1.04 0.73 3
100
6.25 3.42 3.72 1.03 0.84 0.66 6
5.83 2.81 3.85 1.06 0.76 0.53 9
7.83 7.92 6.65 2.85 1.96 1.04 0
6.74 5.62 5.84 1.67 1.37 0.94 3
200 5.83 5.23 4.95 1.03 1.02 0.73 6

Journal of Engineering and Sustainable Development Vol. 21, No. 02, March 2017 www.jeasd.org (ISSN 2520-0917)
89
5.27 4.71 4.19 0.93 0.82 0.58 9
9.05 8.34 6.92 3.94 2.71 1.58 0
4.61 6.82 4.52 2.93 2.38 1.04 3
400 4.46 6.43 4.04 2.59 1.09 1.35 6
3.66 5.72 3.58 2.14 1.06 1.02 9
9.96 11.36 7.51 6.04 5.62 4.05 0 6.64 6.28 6.36 5.31 4.53 3.64 3
800 6.18 6.82 5.74 5.21 4.02 3.28 6
5.17 7.42 5.38 4.36 3.72 3.01 9
Table (11) Values of Cv(m2/yr) for decomposed samples with different percentage of lime.
13.79 10.96 6.92 4.62 1.83 0 %O.C
%Lime
P(kPa)
5.93 2.25 3.93 2.73 1.01 0.53 0
4.13 1.54 1.72 1.34 0.82 0.44 3
25
3.72 1.41 1.37 0.92 0.61 0.36 6
3.51 0.84 1.16 0.73 0.47 0.34 9
6.92 2.83 4.35 2.93 1.62 0.72 0
5.25 1.52 3.16 2.42 1.93 0.71 3
50 4.82 2.9 2.82 1.83 0.93 0.64 6
4.04 1.24 2.72 1.74 0.82 0.62 9
7.94 5.82 6.39 3.56 1.93 0.93 0
6.47 3.79 5.12 2.45 1.63 0.73 3
100
6.25 3.22 4.25 1.45 0.78 0.66 6 6.62 2.89 4.15 1.06 0.67 0.53 9
8.34 6,85 7.02 5.27 2.82 1.04 0
6.74 4.73 6.22 4.81 1.73 0.94 3
200 5.83 4.25 5.71 3.93 1.24 0.73 6
5.27 3.92 5.16 3.47 0.92 0.58 9
9.35 7.92 7.84 6.79 4.82 1.58 0
7.26 6.82 6.82 5.52 2.83 1.04 3
400 7.01 6.43 6.15 4.25 1.92 1.35 6
6.26 5.72 5.62 4.15 1.6 1.02 9
14.04 12.02 10.82 7.92 7.02 4.05 0
9.35 9.34 8.34 6.36 4.53 3.64 3
800 7.35 8.43 6.26 5.25 4.02 3.28 6
6.36 7.12 6.61 4.36 3.72 3.01 9
4.3.3 Coefficient of secondary compression (Cα)
Figures (2) and (3) show the relation of lime content vs coefficient of secondary
compression (Cα) for the non-decomposed and decomposed samples for different
percentage of organic content. Cα is assumed to be the slope of axial strain versus
logarithm of time curve for time period between passing 24 hours (1440 min) to
becomes asymptotic after the dial gage reading becomes stable under a consolidation
pressure (800) kPa. The results of non-decomposed and decomposed samples for
different lime content are summarized in Tables (12) and (13). The values of Cα are
increased with increasing organic content at each percent of lime for both cases, while
the values of Cα generally decrease with increasing lime content for all percentage of
organic soils in both cases. This is because the void ratio of soil increases with
increasing organic content, which leads to increase the compressibility. On the other
hand, the addition of lime causes pozzolanic reaction taking place within the soil which
in turn changes the soil matrix. The adsorbed cations of the clay mineral exchanges with
the free calcium of the lime, resulting in decrease in size of the spread water layer

Journal of Engineering and Sustainable Development Vol. 21, No. 02, March 2017 www.jeasd.org (ISSN 2520-0917)
90
surrounding the clay particles causing agglomeration/flocculation of the clay particles,
which changes the clay into a more sand-like or silt-like materials[13].
Figure (2) Effect of lime content on coefficients of secondary compression for different consolidation
pressures for non-decomposed samples.
Figure (3) Effect of lime content on coefficients of secondary compression for different consolidation
pressures for decomposed samples.
Table (12) Values of Cαx(10-3) for non-decomposed samples with different percentage of lime.
20 12 8 5 2 0 O.C.%
Lime%
15.39 10.38 8.94 7.52 5.99 3.86 0
9.83 8.51 8.28 6.73 4.62 2.34 3
9.36 8.27 8.27 6.56 4.15 1.77 6
8.34 7.63 8.08 6.47 3.76 1.62 9
Table (13) Values of Cαx(10-3) for decomposed samples with different percentage of lime.
13.79 10.96 6.92 4.62 1.83 0 O.C.%
Lime%
14.26 11.42 9.87 8.37 6.97 3.86 0
7.98 5.03 4.85 4.58 4.64 2.34 3
7.44 4.46 4.26 4.16 4.29 1.77 6
7.14 4.23 3.63 3.04 3.52 1.62 9

Journal of Engineering and Sustainable Development Vol. 21, No. 02, March 2017 www.jeasd.org (ISSN 2520-0917)
91
5. Conclusions
Based on the results from the experimental works, the following conclusions can be
drawn. It was emphasized that these conclusions were limited to the variables studied:
1. The maximum dry unit weight decreases and the optimum moisture content
increases with increasing the organic content for both cases.
2. The max. dry density is decreased with increasing organic content for each
percent of lime for both cases, while no significant effect in the maximum dry
density noticed with increased lime content for each percent of organic content for
non-decomposed and decomposed samples except 12% and 20% organic content
for non-decomposed samples, where the max. dry density is increased with
increased lime content.
3. Increasing the organic content of soil leads to increase the compression index (Cc)
for both non-decomposed and decomposed samples for each percent of lime
content.
4. The compression index (Cc) for decomposed organic soil samples are decreased
with increasing lime content, for all samples of different percentage of organic
content.
5. Coefficient of consolidation (Cv) for both types of samples are increased with the
increase of organic content and stresses. While, it is decreased with increase of
lime content.
6. The value of Cα are increased with increase organic content for each percent of
lime for both cases, while the values of (Cα) generally decrease with increases of
lime content for all percentage of organic soils in both cases.
7. Using lime will improve the compressibility characteristics of organic soil.
Abbreviations
G Specific gravity of soil
Gp Specific gravity of added material Gs Specific gravity of soil particles
p Proportion of added material by dry mass
w Required weight(gm)
ɣd Dry unit weight (kN/m3) ɣdmax. Maximum dry unit weight (kN/m3)
ɣ d used Dry unit weight of sample(kN/m3)
O.W.C Optimum water content for sample (%)
6. References
1. Abbas, A., Majeed, A. H., and Hassan, I. M., 1985 "Compaction and Strength of
Slightly Organic Soil", Journal of Building Research Center, Vol.4, No.1, Iraq, PP.
1-19, May.
2. Habbi, Z. M., 2005 "Compressibility and shear strength characteristics of model
organic soils", Master Thesis of Science in Civil Engineering, Al-Mustansiriya
University, November.

Journal of Engineering and Sustainable Development Vol. 21, No. 02, March 2017 www.jeasd.org (ISSN 2520-0917)
92
3. Zbar B. S., Khan M. A., Jawag A. S., 2013 "Geotechnical properties of compacted
silty clay mixed with different sludge contents". International conference for
geotechnical engineering and transportation, ICGTE Vol.31, part (A), No. 20,
pp.262-278.
4. Yunua N. Z. B. M., 2007"Stabilisation of organic clay using lime-added salt",
Master Thesis of Engineering (Civil-Geotehcnic), UniversitiTeknologi Malaysia
November.
5. Rafizul I. M., Assaduzzaman M., Alamgir M., 2012 "The effect of chemical
admixtures on the geotechnical parameters of organic soil: a new statistical model",
Journal of Applied sciences and engineering research Vol. 1, Issue 4, pp. 623-634.
6. Andersland, O. B., and Al-Khafaji, A. W. N., 1980 "Organic Material and Soil
Compressibility" Journal of Geotechnical Engineering Division, ASCE, Vol.106,
No.GT7, Proc. Paper 15546, PP. 749-758, July.
7. Adejumo T. E., 2012"Effect of Organic Content on Compaction and Consolidation
Characteristics of Lagos Organic Clay", National Technical University, Minsk,
Belarus, Vol. 17, Bund. O, pp. 2201-2211.
8. Thiyyakkandi S., Annex S., 2011"Effect of Organic Content on Geotechnical
Properties of Kuttanad Clay", Vol. 16, Bund.U., pp.1653-1663.
9. Rabbee T., Rafizul I. M., 2012"Strength and Compressibility Characteristics of
Reconstituted Organic Soil at Khulna Region of Bangladesh", International Journal
of Engineering and Technology Volume 2, No.10, October, pp.1672-1681.
10. Wardwell, R., and Nelson, J. D., 1981"Settlement of Sludge Landfills with Fiber
Decomposition", Proceeding of the Tenth International Conference on Soil
Mechanics and Foundation Engineering, Vol.2, PP 397-401.
11. Ingles, O. G. and Metcalf, J. B., 1972'' Soil Stabilization Principles and Practice'',
New York.
12. AS 1289.3.5.2, 2002 "Method of testing soils for engineering purpose, Method 3.5.2:
Soil classification tests-determination of the soil particle density of combined soil
fractions-vacuum pycnometer method", standards Australia.
13. Gromko, G. J., 1974"Review of expansive soils", J. Geotechnical Eng. Division.
June ASCE, pp: 667-689.


