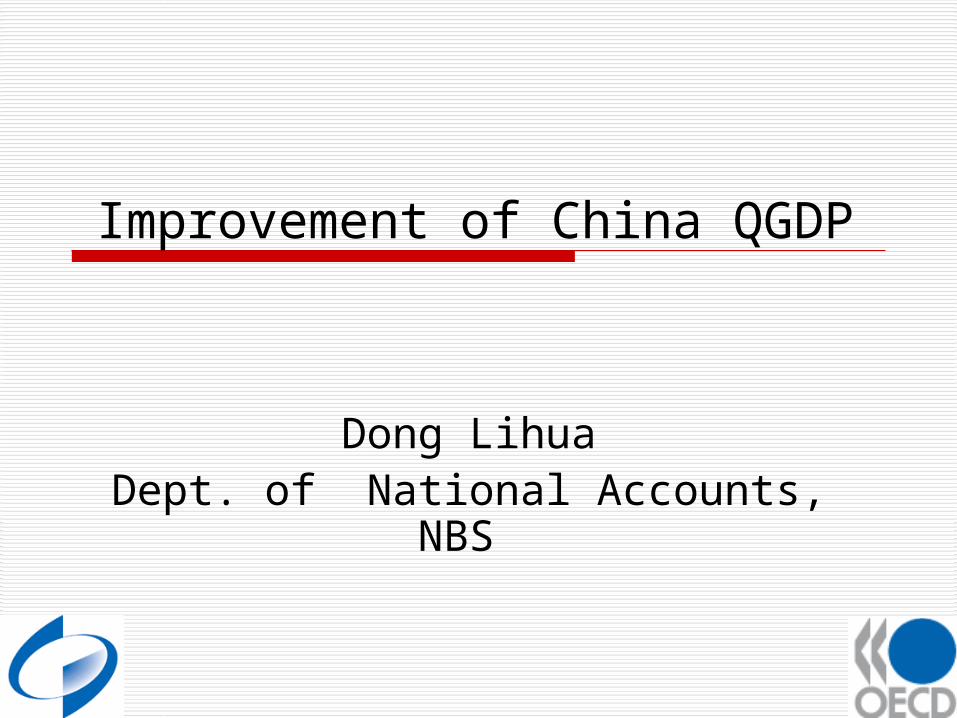
Improvement of China QGDP Dong Lihua Dept. of National Accounts, NBS.
21
Improvement of China QGDP Dong Lihua Dept. of National Accounts, NBS
-
Upload
horatio-miller -
Category
Documents
-
view
219 -
download
0
Transcript of Improvement of China QGDP Dong Lihua Dept. of National Accounts, NBS.
Improvement of China QGDP
Dong LihuaDept. of National Accounts, NBS

Overview
QGDP began in 1992, established Experimental Scheme for Quarterly GDP Estimation
Features:1. Accumulated accounting2. By industries3. Method: Production approach, Extrapolation
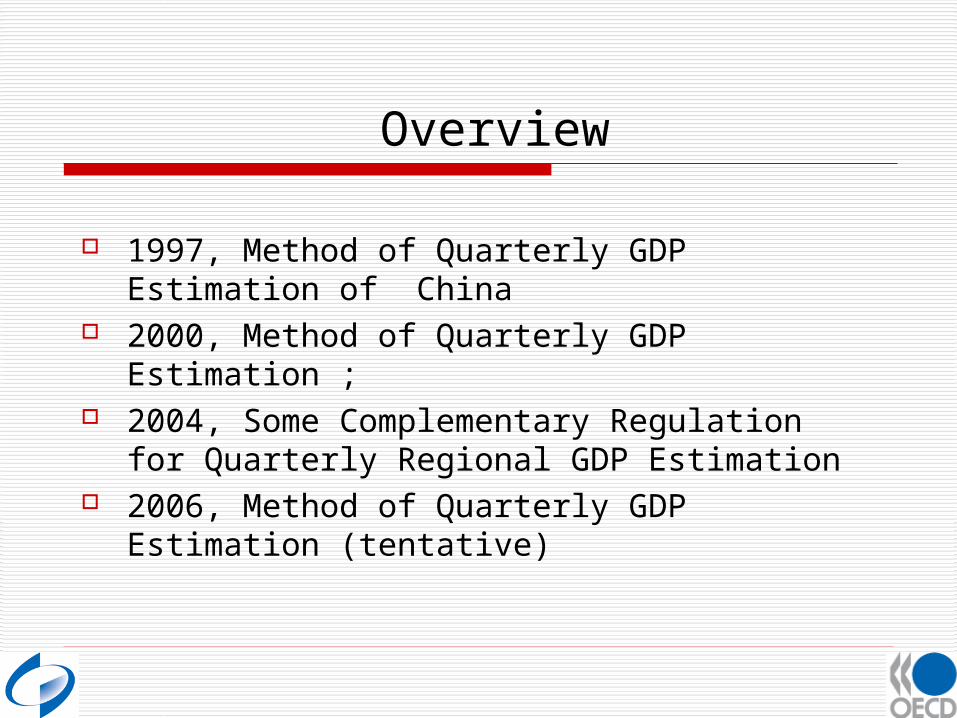
1997, Method of Quarterly GDP Estimation of China
2000, Method of Quarterly GDP Estimation ; 2004, Some Complementary Regulation for
Quarterly Regional GDP Estimation 2006, Method of Quarterly GDP Estimation
(tentative)
Overview
Improvement in recent years
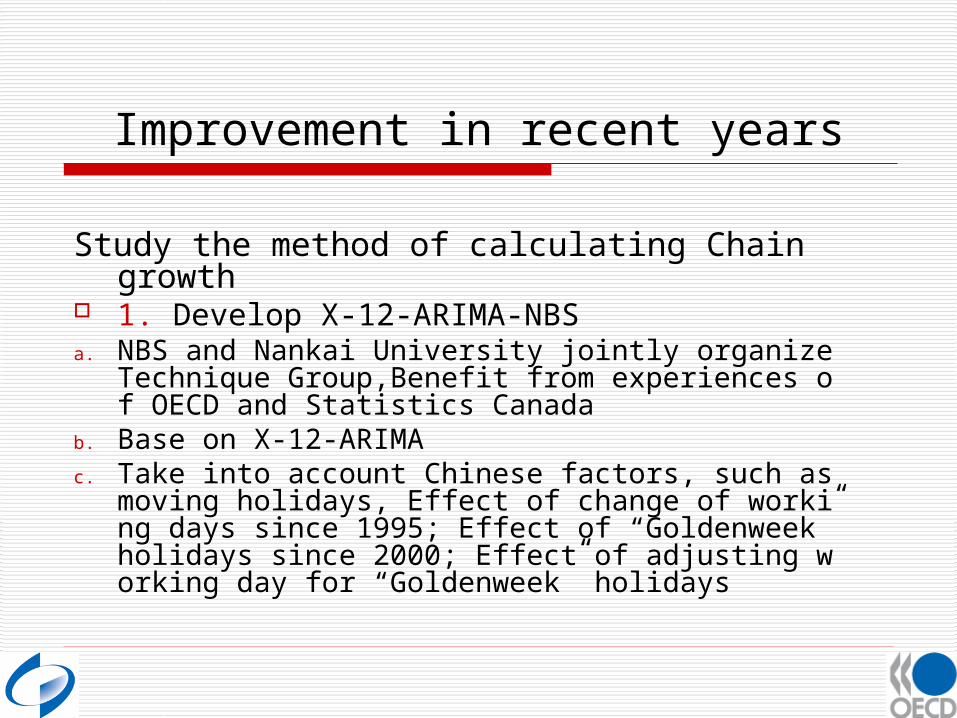
Study the method of calculating Chain growth 1. Develop X-12-ARIMA-NBSa. NBS and Nankai University jointly organize Technique
Group,Benefit from experiences of OECD and Statistics Canada
b. Base on X-12-ARIMAc. Take into account Chinese factors, such as moving holi
days, Effect of change of working days since 1995; Effect of “Goldenweek” holidays since 2000; Effect of adjusting working day for “Goldenweek” holidays

Chinese factors
Effect of Moving Holidays:
There are Spring Festival, Mid-autumn Festival, Qingming Festival and Dragon boat Festival. Their effects are reflected by the relevant variables
Chinese factors
Effect of Changing Workdays Since April 1995, the working time has changed
from 6 days per week to 5 days per week . The effect reflected by redefined workday effect of X12.
Chinese factors
Effect of golden week Golden week is appeared in Oct. 1999. As the
name implies, golden week is a seven-days holiday which consists of nation holiday/labor holiday/spring festival and its adjacent weekend. This effect is adjusted by relative variables.
Chinese factors
Effect of working days shift In order to make the golden week seven days,
sometimes we need to exchange several working days with weekend. Obviously, it will change the effect of working days and trading days. For this reason, we redefined the relative variables of trading days.
Improvement in recent years
d. Set up X-12-ARIMA-NBS for Chinese seasonal adjustment
2. Seasonal Adjustment for 18 selected indicators

Quarterly Indicators
1.GDP 2.Agriculture 3.Industry 4.Contruction 5.Transport, Postal and
Telecommunication 6. Wholesale and Retail
7. Hotel and Catering 8.Finance 9.Real Estate 10.Others 11.Wage and Salary
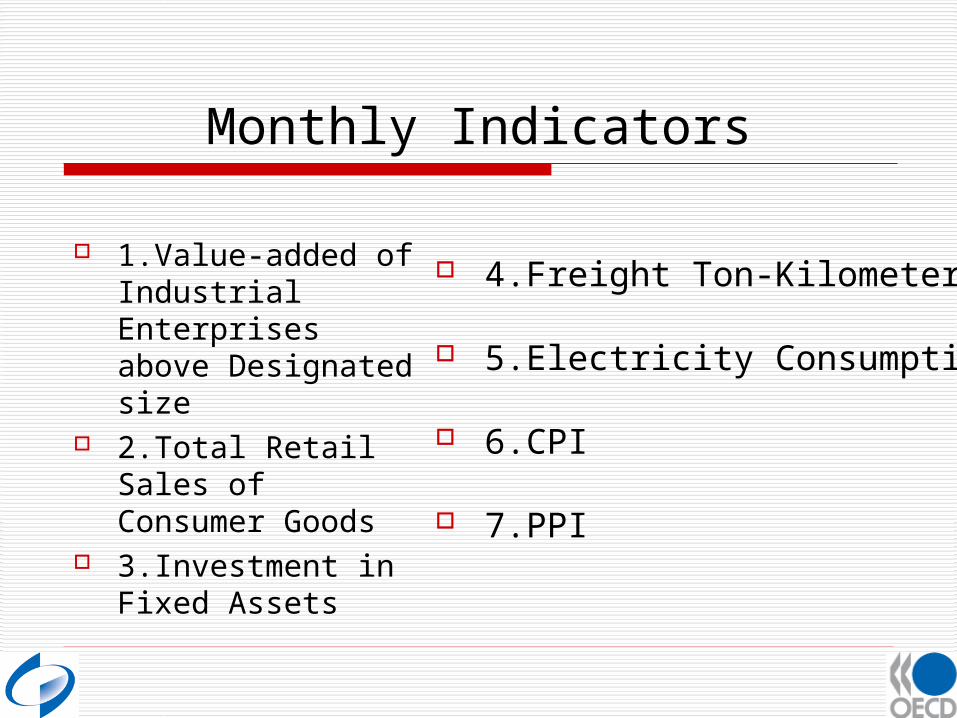
Monthly Indicators
1.Value-added of Industrial Enterprises above Designated size
2.Total Retail Sales of Consumer Goods
3.Investment in Fixed Assets
4.Freight Ton-Kilometers
5.Electricity Consumption
6.CPI
7.PPI
Improvement in recent years
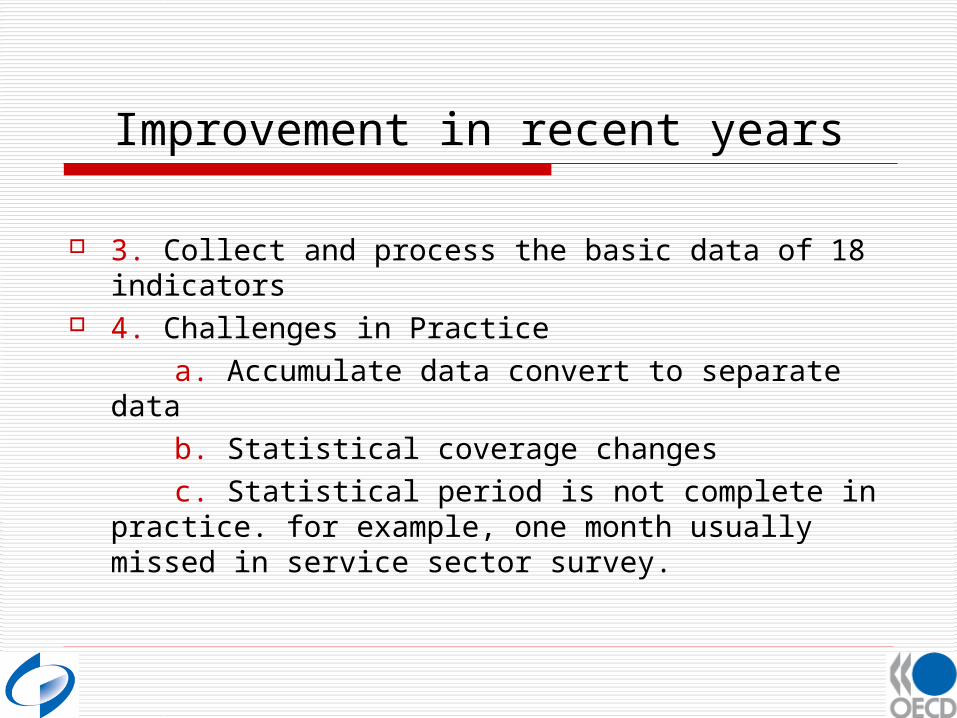
3. Collect and process the basic data of 18 indicators 4. Challenges in Practice
a. Accumulate data convert to separate data
b. Statistical coverage changes
c. Statistical period is not complete in practice. for example, one month usually missed in service sector survey.

Improvement in recent years
d. The length of time series is not enough e. Master seasonal adjustment technique as soon as
possible f. Chain growth and Growth year on year, which
one is dominant? g. Whether annualized or not?

Improvement in recent years
Study the method of quarterly GDP by Expenditure Approach and implement on trial.
1. Accumulated quarterly accounting
2. The primary method

The primary method
Items of Expenditure
Method of Estimation Basic Data
Household Consumption Expenditure (HCE)
ExtrapolationExtrapolated indicator:(1) Growth rate of HCE=
Growth rate of per capita HCE×Growth rate of total population
(2) Growth rate of Investment in owner-occupied dwelling
(1) Household sample survey: Per capita rural resident HCE in cash, Per capita urban resident HCE;
(2) Investment in fixed assets statistical survey;
(3) CPI
The primary method
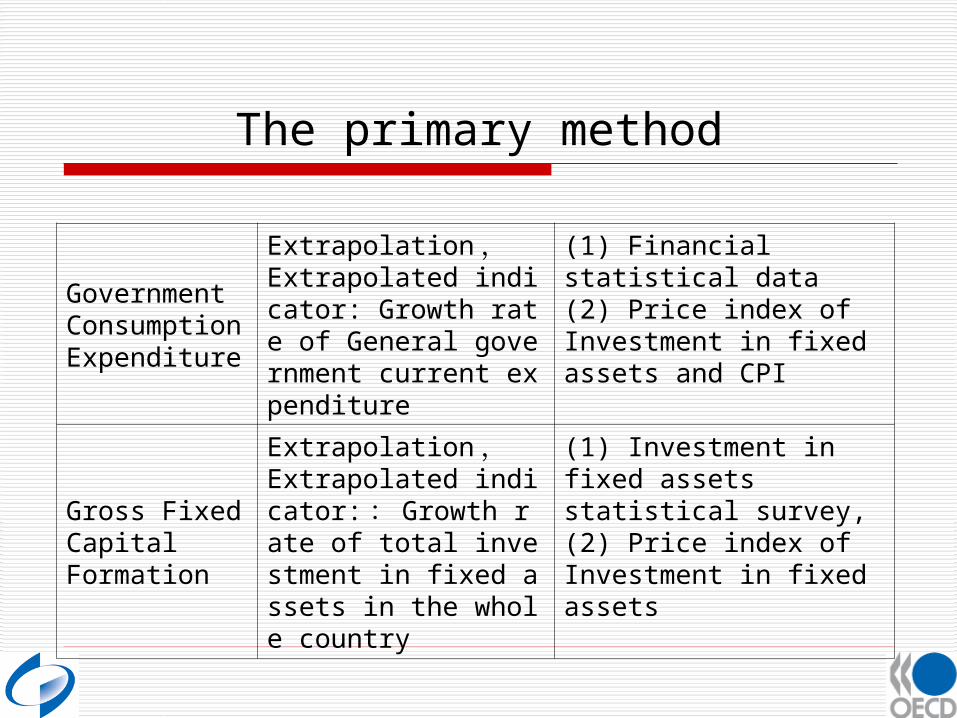
Government Consumption Expenditure
Extrapolation,Extrapolated indicator: Growth rate of General government current expenditure
(1) Financial statistical data (2) Price index of Investment in fixed assets and CPI
Gross Fixed Capital Formation
Extrapolation,Extrapolated indicator:: Growth rate of total investment in fixed assets in the whole country
(1) Investment in fixed assets statistical survey,(2) Price index of Investment in fixed assets

The primary method
Change in Inventory
Change in inventory=value of end of period- value of beginning of period
(1))Financial statistical data: Inventory of state-owned enterprises(2)Industry statistical survey: Inventory of finished goods of industrial enterprises above designated size(3)Wholesale and retail trade statistical survey: Inventory of enterprises above designated size(4)PPI
The primary method
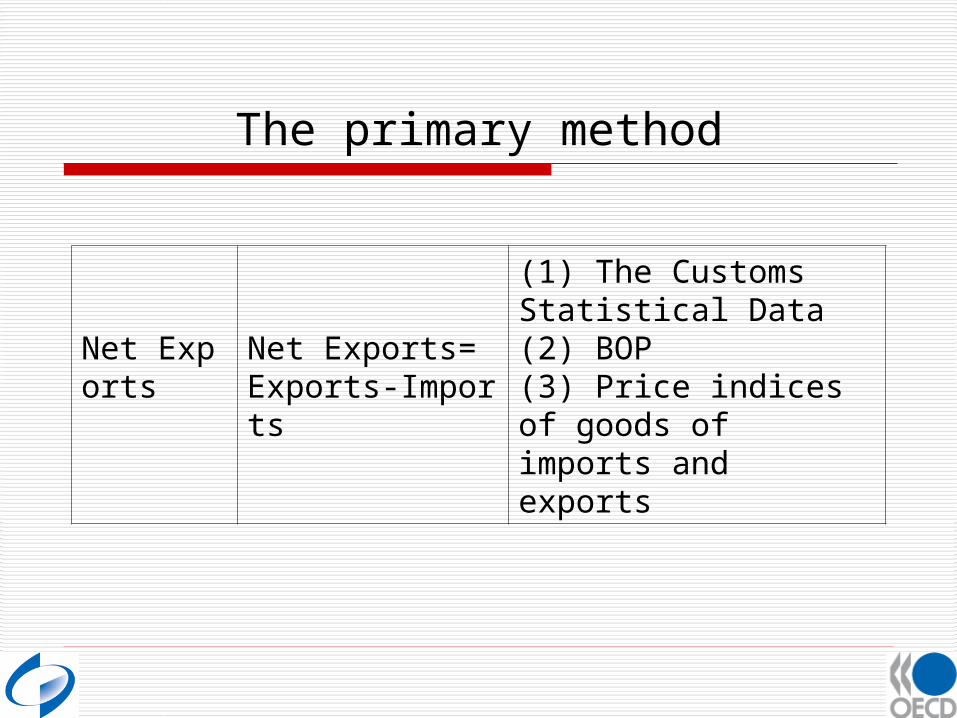
Net Exports
Net Exports=Exports-Imports
(1) The Customs Statistical Data(2) BOP(3) Price indices of goods of imports and exports
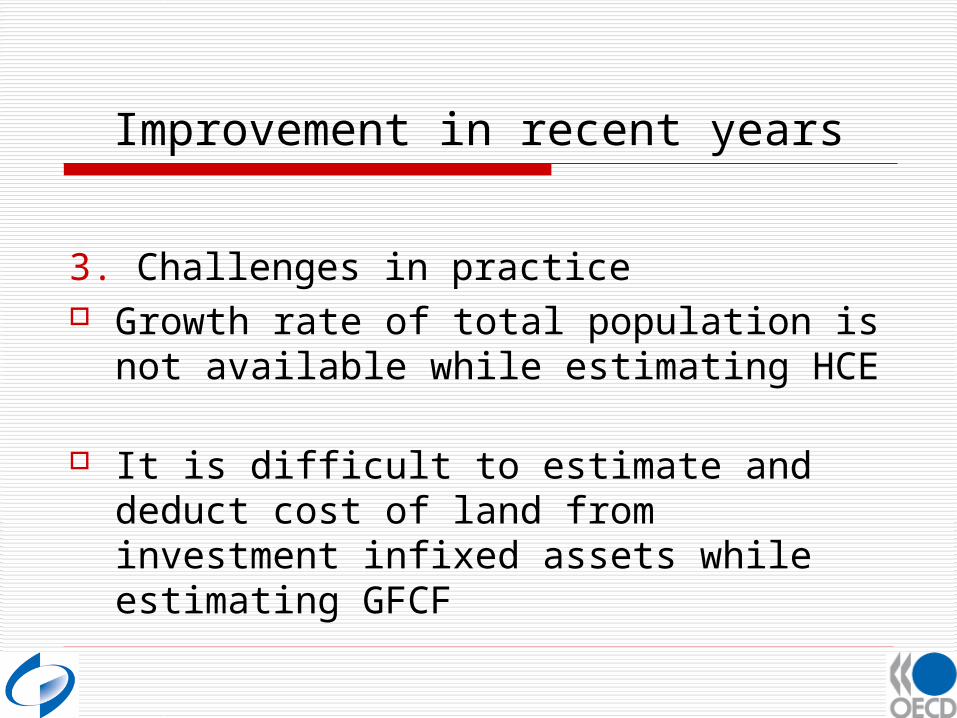
Improvement in recent years
3. Challenges in practice Growth rate of total population is not available
while estimating HCE It is difficult to estimate and deduct cost of land
from investment infixed assets while estimating GFCF
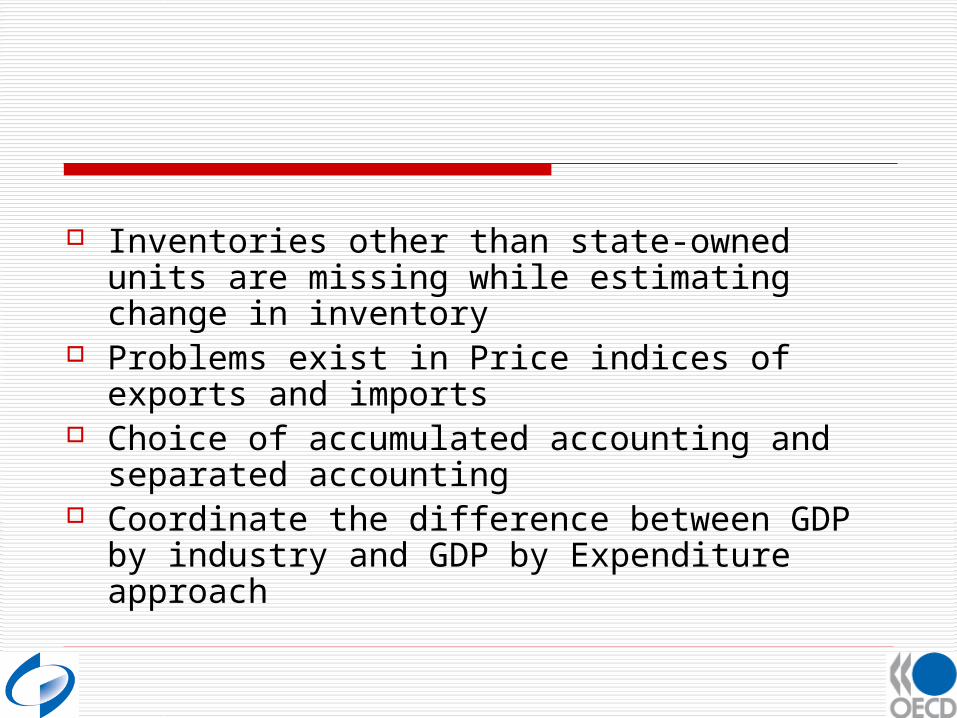
Inventories other than state-owned units are missing while estimating change in inventory
Problems exist in Price indices of exports and imports
Choice of accumulated accounting and separated accounting
Coordinate the difference between GDP by industry and GDP by Expenditure approach

Thank you !