Improved reefer container for fresh...
27
Improved reefer container for fresh fish Sæmundur Elíasson Björn Margeirsson Sigurjón Arason Vinnsla, virðisaukning og eldi Skýrsla Matís 01-13 Janúar 2013 ISSN 1670-7192
Transcript of Improved reefer container for fresh...

Improved reefer container for fresh fish
Sæmundur Elíasson Björn Margeirsson Sigurjón Arason
Vinnsla, virðisaukning og eldi
Skýrsla Matís 01-13 Janúar 2013 ISSN 1670-7192
Effect of modified
María
Vinnsla og vöruþróun
Skýrsla Matís 22-08 September 2008 ISSN 1670-7192

Titill / Title Improved reefer container for fresh fish /
Endurbættur kæligámur fyrir ferskfisk – LOKASKÝRSLA
Höfundar / Authors Sæmundur Elíasson, Björn Margeirsson, Sigurjón Arason
Skýrsla / Report no. 01‐13 Útgáfudagur / Date: Jan 2013
Verknr. / project no. 2083
Styrktaraðilar / funding: AVS rannsóknasjóður í sjávarútvegi
AVS‐Ref.No.: R11 093‐11
Ágrip á íslensku:
Meginmarkmið verkefnisins Endurbættur kæligámur fyrir ferskfisk var
að endurbæta kæligáma og verklag við flutninga á ferskum
sjávarafurðum með endurhönnun og prófunum. Markmiðið er að
hönnunarúrbætur skili kæligámum sem ná jafnara hitastigi gegnum
flutningaferlið. Leitast skyldi við að ná viðunandi endurbótum á
kæligámum sem í dag er notast við með einföldum og kostnaðarlitlum
aðgerðum.
Afleiðingar bættrar hitastýringar í vinnslu‐ og flutningaferlum eru aukin
gæði, stöðugleiki og öryggi, sem auka um leið verðmæti vörunnar.
Samstarfsaðilar í verkefninu voru Matís, Háskóli Íslands, Eimskip Ísland
og Samherji. Í þessari skýrslu er helstu niðurstöðum og afurðum
verkefnisins lýst.
Niðurstöður verkefnisins leiddu í ljós að þörf er á endurbótum í
sjóflutningskeðjum og sýnt var fram á að hægt er að ná fram úrbótum
með einföldum og kostnaðarlitlum aðgerðum. Hitastýringu við
sjóflutninga má bæta með því að velja markhitastig og kæligáma sem
hæfa best til flutninga ferskra fiskafurða. Kortlagning á hitadreifingu
kæligáma sýndi fram á breytileika bæði í flutningsferlinu og með tilliti til
staðsetningar innan gámsins en hönnunarúrbætur sem miðuðu að því
að þvinga loftflæði innan gámsins skiluðu jafnari hitadreifingu. Einnig var
sýnt fram á mikilvægi verklags við hleðslu kæligáma og meðhöndlun
þeirra frá framleiðanda til kaupanda.
Lykilorð á íslensku: Fiskur, hitastig, flutningar, hitastýring, kæligámar

Summary in English:
The purpose of the project Improved reefer container for fresh fish is to
use simple redesign and experimental testing to improve temperature
control in reefer containers and work procedures of fresh fish products
during transport. The design improvements are aimed at producing a
reefer with more stable temperature through sea freight and transport.
The aim is to get satisfactory improvements with simple and cost
effective procedures.
Improved temperature control in fish chill chains leads to increased
product quality, stability and safety and thereby increased product
value. The project was done in collaboration with Matís, University of
Iceland, Eimskip Ísland and Samherji. This report describes the main
results and products of the project.
The results of the project showed that there is room for improvement in
sea transport cold chains and with design improvements experiments it
was demonstrated that they can be improved with simple and cost
effective procedures. The results showed that the temperature control
during sea freight may also be improved by selecting the reefer types
most suitable for fresh fish transport and selecting different set point
temperatures during summer and winter. The mappings of temperature
distribution inside the reefers showed spatiotemporal variability and
design improvements achieved a more uniform distribution by means of
forced air circulation. Field tests demonstrated the importance of
correct operating procedures during loading of reefers and their
handling from processor to end location.
English keywords: Fish, temperature, transport, temperature control, reefer, refrigerated container

Table of Contents
1 INTRODUCTION 1
2 MATERIALSANDMETHODS 3
2.1 Measurement devices 3
2.2 Measured reefers 4
3 RESULTSANDDISCUSSION 7
3.1 Effects of ambient temperature on reefer performance 7
3.2 Temperature control during land and sea transport 9
3.3 Temperature distribution in reefer containers 13
3.4 Design improvements 16
4 CONCLUSIONS 21
ACKNOWLEDGEMENTS 22
PUBLICATIONS 22
REFERENCES 23

1
1 INTRODUCTION
The purpose of this report is to review the most important results obtained in the R&D project
“Improved reefer container for fresh fish”.
Insufficient temperature control in cold chains has negative effects on fresh fish quality and
storage life. Until recent years, fresh fish fillets and other high‐value, short storage life products
have generally been transported by air freight but large volume exporters now take advantage of
better temperature control1 and the lower cost option of refrigerated sea transport. The main
aim of the project was to improve temperature control in reefer containers and work procedures
of fresh fish products during transport by using simple redesign and experimental testing. The
design improvements are aimed at producing a reefer with more stable temperature through sea
freight and transport. The aim is to get satisfactory improvements with simple and cost effective
procedures.
Refrigerated containers used to transport frozen products are also used for chilled products at
temperatures around 0 °C. Frozen products are less responsive to temperature fluctuations and
refrigeration units often allow considerably more fluctuations than is optimal for chilled
products. Older researches have confirmed the importance of stable temperature when storing
seafood products2,3. Transportation of frozen products allows for 2–3 °C temperature
fluctuations but for refrigerated fish fillets around 0 °C the fluctuations should be much less4. The
project aim is to improve the reefer, which has largely remained unmodified over the last
decade, in order to make it more suitable for transport and storage of chilled products.
Many studies have been done on refrigerated container shipments of chilled products. The
majority of the published work, however, reefers to 20 ft. containers and transport of fruits. The
work that was done on 40 ft. reefers5,6 focused on temperature variation in palletised stows of
1 Margeirsson, B. 2012. Modelling of temperature changes during transport of fresh fish products. Doctoral thesis. Faculty of industrial engineering, mechanical engineering and computer science, University of Iceland.
2 Axelsdóttir, K. 2002. Greining á flutningaferlum lausfrystra sjávarafurða. M.Sc. thesis. University of Iceland.
3 Björnsson, H.Ó. 2005. Geymslu- og flutningastýring lausfrystra sjávarafurða. M.Sc. thesis. University of Iceland.
4 Lauzon, H.L., Margeirsson, B., Sveinsdóttir, K., Guðjónsdóttir, M., Karlsdóttir, M.G., Martinsdóttir, E. 2010. Overview on fish quality research. Impact of fish handling, processing, storage and logistics on fish quality deterioration. Matís report 39-10.
5 Billing, D. P., Hayes, A.J., McDonald, B. 1995. Temperature and airflow characteristics in reefer vessels carrying New Zealand produce. Prod. 19th International Congress of Refrigeration. Vol II: 485-492.
2
fruit showed that there was a significant variability both spatially across the width of the
container as well as in time7. Temperature control is a critical parameter to retard quality
deterioration of perishable foodstuffs, such as fresh fish, in the whole chill chain from catch,
through processing and distribution to consumers. The importance of pre‐cooling the product to
the intended storage temperature before packaging has been shown and the thermal protection
from external environment by insulated boxes has been tested and optimized1,8.
In the current study, experiments were conducted in order to gain additional knowledge on
reefer transport routes from Icelandic producers, temperature distribution during transport and
the effects of design improvements. Result from transport experiments, mapping temperature
distribution in reefers, are used to determine possible low‐cost design improvements. The main
results comprise assessment of temperature control during land and sea transport and redesign
of the loading process into the reefer.
6 Tanner, D. J., Amos, N. D. 2003.Temperature variability during shipment of fresh produce. Acta Horticulturae, 599 p.193-203.
7 Punt, H., Huysamer, M. 2005. Temperature variance in a 12 m integral reefer container carrying plums under a dual temperature shipping regime. Acta horticulturae, 687, p. 289-296.
8 Valtýsdóttir, K. L. 2011. The effects of different precooling techniques and improved packaging design on fresh fish temperature control. M.Sc. thesis. University of Iceland.
3
2 MATERIALS AND METHODS
In this section measurement devices and the measured reefers will be discussed. The field test
experiments were carried out with fresh fish while other experiments conducted in static
conditions used bacalao (salted cod). The reasons for using bacalao instead of fresh fish were
that the temperature measurements were done over a period of time which exceeds the storage
life of fresh fish.
2.1 Measurement devices
The specification of the different measurement devices used is presented in Table 1. Ibutton
temperature loggers (DS1922L, see Figure 1) from Maxim Integrated Products (Sunnyvale, CA,
USA) were used to monitor the air temperature inside the reefers and fish temperature within
the insulated boxes (Figure 4). Its diameter is 17.35 mm and the thickness is 5.89 mm. Tidbit v2
temperature loggers (Figure 2) from Onset Computer Corporation (Bourne, MA, USA) were used
to monitor the ambient temperature outside the reefers. All temperature loggers were factory
calibrated and re‐calibrated in a thick mixture of fresh crushed ice and water to ensure
uniformity of the collected data. Relative humidity was monitored with HoBo U12 temperature
and relative humidity loggers (Figure 3) from Onset Computer Corporation (Bourne, MA, USA).
Table 1. Specification of measurement devices
Device Resolution Range Accuracy
Ibutton 0.0625 °C –40 to 85 °C ±0.5 °C between –15 and 65 °C
Tidbit v2 0.02 °C –20 to 70 °C ±0.2 °C between 0 and 50 °C
HoBo U12 0.03% 5 to 95% ±2.5%
Figure 1. Ibutton DS1922L temperature datalogger.
Figure 2. Tidbit v2 temperature datalogger.
Figure 3. HoBo U12 temperature and relative humidity datalogger.

4
Figure 4. Whole haddock fillets in an EPS box. Also shown are temperature loggers used for monitoring temperature on top of fillets.
2.2 Measured reefers
The measured reefers were all 40 ft. high cube RF45 type boxes with integral refrigeration units
and a T‐bar floor. The reefers were chosen in collaboration with experts at the shipping
company, emphasizing reefer types that are most commonly used for export of chilled fresh fish.
The container boxes are similar in size and build with regard to material and insulation
specifications. Table 2 shows the main sizes and characteristics of the RF45 container boxes. The
dimensions listed are the inside measures of a container box.
Table 2: Characteristics of a RF45 container
Lenght Width Height Own weight Capacity Volume
11.6 m 2.3 m 2.5 m 4,950 kg 29,000 kg 67 m3
The reefers are equipped with refrigeration units from different manufactures (Thermo King,
Carrier and Star Cool) specified in detail in the experimental reports9,10. The units have similar
operating ranges and capacities, with cooling capacity ranging from 11.7 kW to 12.3 kW when
maintaining temperature around 2 °C inside the reefer with 38 °C ambient temperature11.
9 Elíasson, S. 2012. Temperature control during containerised sea transport of fresh fish. M.Sc. thesis. University of Iceland.
10 Elíasson, S., Margeirsson, B., Sigurjón, A. 2012. Project Report – Work Package 3. Experiments results. Matís.
11 Thermo King, M. 2007. Available at http://www.containere-maritime.ro/Magnum_Brochure.pdf. Ingersoll Rand Climate Control Technologies. Diegem, Belgium.

5
Heating capacities of the units range from 5.25 kW to 5.6 kW12. In experiments 1 and 2 the
refrigeration unit temperature was set at –2 °C, ventilation closed and the RU operation set to
chilled mode, in which the evaporator fans run at high speed (up to 3,450 rpm). In experiments
3–6 the set point temperature was 0 °C. Table 3 shows the setup and set point temperature for
each experiment. Reefer set point temperatures are generally decided by the producer or the
shipper.
Table 3: Experiment description
Set point
temp.
Cargo load Experiment
Experiments MSc 0 °C Cod/Bacalao Master thesis experiments
Experiment 1 –2 °C Cod loins Real sea transport ‐ Single pallet measurement
Experiment 2 –2 °C Saithe fillets Real sea transport ‐ Reefer measurement
Experiment 3 0 °C Cod loins Real sea transport ‐ Reefer measurement
Experiment 4 0 °C Cod loins Real sea transport ‐ Reefer measurement
Experiment 5 0 °C Bacalao Controlled environment ‐ Setup comparison
Experiment 6 0 °C Bacalao Controlled environment ‐ Setup comparison
The choice of pallet stowage pattern in the reefers commonly depends on the pallet sizes. The
stowage patterns are chosen mostly with the aim of maximizing the number of pallets in the
reefer and to balance the internal load. The most common pallet type for fresh fish transport is
the Euro pallet (800x1200 mm), which is used in most experiments in this study. The most
common stowage pattern used for the Euro pallet is shown in Figure 5. The Euro pallet stowage
pattern refers to the layout of pallets and is not restricted to the Euro pallet as the stowage
pattern is also used for other pallet sizes.
Figure 5: Europallet stowage pattern with Euro pallets in a 40 ft. reefer Figure 6: Air bags between pallet loads
With the Euro pallet stowage pattern there is a longitudinal gap formed between the pallets. Due
to the asymmetry of the stowage the gap is more to one side of the reefer centreline. With
12 Carrier,Transicold. 2010. Operation and service manual-Container refrigeration unit 69NT40. Carrier corporation. New York, USA.

6
pallets pressed against the reefer walls this gap can be around 28 cm using Euro pallets. For Euro
pallets, air filled bags are blown up between pallets to ensure stability and minimize pallet
movement within the reefer during transport. Figure 6 shows containerised EPS boxes on Euro
pallets with an air bag in position between the pallets. For all experiments a three dimensional
grid was defined for the measurement points. Figure 7a shows 9 measurement points in a
vertical cross section of a reefer. Left and right sides are viewed from the reefer door‐end. In all
experiments temperature loggers were placed in three horizontal levels; bottom, middle and top
level, as presented in Figure 7b. The MSc experiments had measurement grids of 40–70 locations
within the reefer. For experiments 2, 3, 5 and 6 a measurement grid comprising 3 vertical
sections from the reefer RU‐end to the door‐end was used, as shown in Figure 7c. For
experiment 4 the same measurement grid was used but another section added between the
middle and door‐end sections, as shown in Figure 7d.
a) b)
c) d)
Figure 7: a) Logger placements in a vertical cross section, b) Definition of bottom, middle and top levels, c) Definition of vertical cross sections for experiments 2, 3, 5 & 6, d) Definition of vertical cross sections
for experiment 4.

7
3 RESULTS AND DISCUSSION
In this section the main results of the experiments listed in Table 3 are reviewed and discussed.
3.1 Effects of ambient temperature on reefer performance
Temperature mappings were done during summer (July) and winter (March)9. Figure 8 shows
temperature evolution for two different loading patterns carried out in an outside, stationary
environment at a container terminal in Reykjavík. The average temperature inside the reefer was
found to be 1 to 2 °C above the set temperature of 0 °C. The effects of the ambient temperature
fluctuations inside the reefer are relatively small close to the RU‐end and down by the container
floor. However they are more noticeable farther from the RU‐end and by the door‐end ceiling
the daily ambient temperature changes result in temperature fluctuations of 1 to 1.5 °C inside
the reefer.
Figure 8: Ambient and reefer average air temperatures during summer
Figure 9 shows a similar temperature mapping of a single reefer during winter time with the
same set point temperature. The average temperature was found to be fairly stable around an
average value of 0.2 °C, fluctuating less with the ambient temperature than during summer.
8
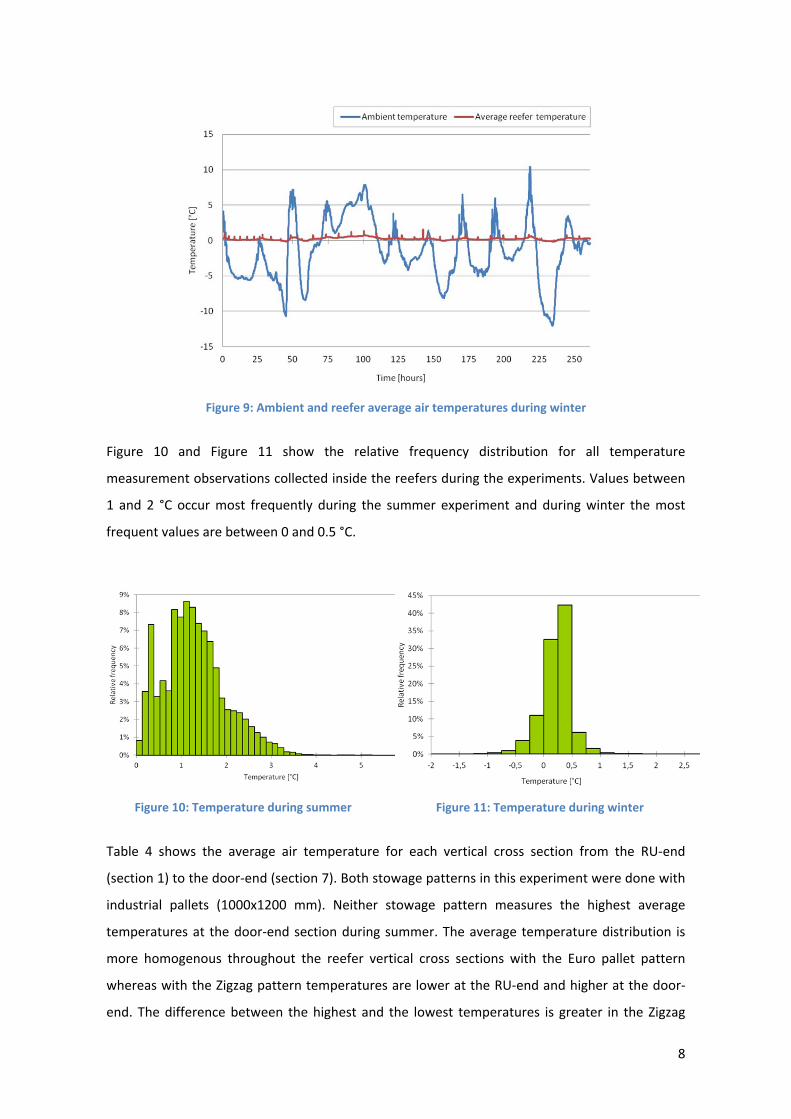
Figure 9: Ambient and reefer average air temperatures during winter
Figure 10 and Figure 11 show the relative frequency distribution for all temperature
measurement observations collected inside the reefers during the experiments. Values between
1 and 2 °C occur most frequently during the summer experiment and during winter the most
frequent values are between 0 and 0.5 °C.
Figure 10: Temperature during summer Figure 11: Temperature during winter
Table 4 shows the average air temperature for each vertical cross section from the RU‐end
(section 1) to the door‐end (section 7). Both stowage patterns in this experiment were done with
industrial pallets (1000x1200 mm). Neither stowage pattern measures the highest average
temperatures at the door‐end section during summer. The average temperature distribution is
more homogenous throughout the reefer vertical cross sections with the Euro pallet pattern
whereas with the Zigzag pattern temperatures are lower at the RU‐end and higher at the door‐
end. The difference between the highest and the lowest temperatures is greater in the Zigzag

9
pattern compared to the Euro pallet. The average temperature during winter measures lowest by
the reefer door‐end section due to ambient conditions.
Table 4: Average temperature over vertical cross sections [°C]
Section 1 Section 2 Section 3 Section 4 Section 5 Section 6 Section 7
Summer (Europallet) 0.7 1.1 1.2 1.1 1.4 1.4 1.3
Summer (Zigzag) 0.6 0.9 0.9 1.0 1.6 1.8 1.7
Winter 0.3 0.3 0.2 0.2 0.2 0.2 0.1
3.2 Temperature control during land and sea transport
Temperature measurements from various locations in Iceland to buyers in France showed that
while the sea transport is generally well temperature controlled, the transport chain is often
broken during land transport and when loading and unloading reefers to the ship. Figure 12
shows the ambient temperature around a pallet from packaging to reefer loading, where the
pallet is stored in a freezer storage after processing and then moved to a loading area before
being containerized. While in the freezer storage the temperature in the pallet top corner box
lowered but a temperature change was not noticeable in the middle and bottom corner boxes.
Figure 12: Ambient temperature from production to container loading
10
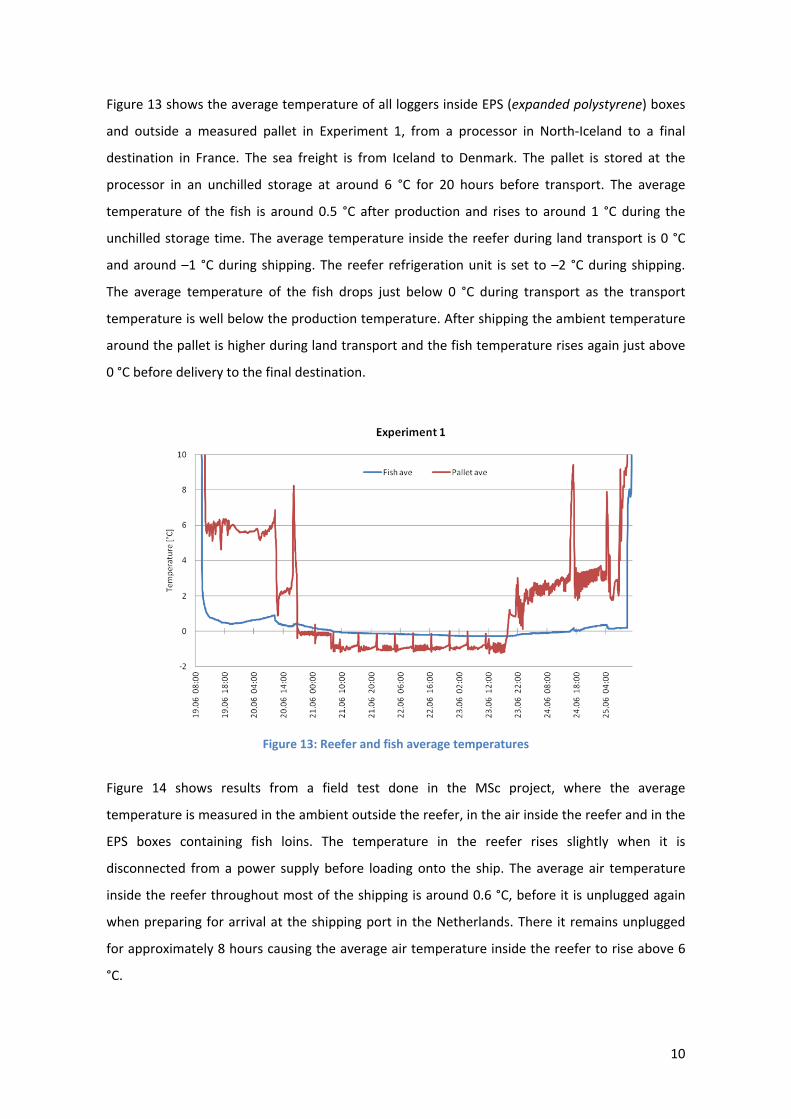
Figure 13 shows the average temperature of all loggers inside EPS (expanded polystyrene) boxes
and outside a measured pallet in Experiment 1, from a processor in North‐Iceland to a final
destination in France. The sea freight is from Iceland to Denmark. The pallet is stored at the
processor in an unchilled storage at around 6 °C for 20 hours before transport. The average
temperature of the fish is around 0.5 °C after production and rises to around 1 °C during the
unchilled storage time. The average temperature inside the reefer during land transport is 0 °C
and around –1 °C during shipping. The reefer refrigeration unit is set to –2 °C during shipping.
The average temperature of the fish drops just below 0 °C during transport as the transport
temperature is well below the production temperature. After shipping the ambient temperature
around the pallet is higher during land transport and the fish temperature rises again just above
0 °C before delivery to the final destination.
Figure 13: Reefer and fish average temperatures
Figure 14 shows results from a field test done in the MSc project, where the average
temperature is measured in the ambient outside the reefer, in the air inside the reefer and in the
EPS boxes containing fish loins. The temperature in the reefer rises slightly when it is
disconnected from a power supply before loading onto the ship. The average air temperature
inside the reefer throughout most of the shipping is around 0.6 °C, before it is unplugged again
when preparing for arrival at the shipping port in the Netherlands. There it remains unplugged
for approximately 8 hours causing the average air temperature inside the reefer to rise above 6
°C.

11
Figure 14: Temperature profiles from the processor (Iceland) to the final destination (France)
In another field test from Experiment 3, shown in Figure 15, the average temperature inside the
reefer also rises when it is disconnected from a power supply before loading onto the ship. The
cod loins were superchilled to around –1 to –0.5 °C before packaging. The average air
temperature inside the reefer throughout most of the shipping is 0.6 °C, before it is unplugged
again when preparing for arrival at the port in the Netherlands. There it remains unplugged
causing the average air temperature inside the reefer to rise above 5 °C, and the reefer does not
recover as the average temperatures during continuation land transport are high and fluctuating.
Figure 15: Temperature profiles from the processor (Iceland) to the final destination (France) in Experiment 3

12
Experiment 4 was done at the same time as Experiment 3, using a reefer from another processor
from another location in Northern Iceland where the cod loins were chilled to 0.5 to 1 °C before
packaging. The temperature results for Experiment 4 are shown in Figure 16, using the same sea
freight and the same final destination as the reefer from Experiment 3. The average temperature
inside the reefer rises above 5 °C when it is disconnected from a power supply before loading
onto the ship. The average air temperature inside the reefer throughout most of the shipping is
0.8 °C, before it is unplugged again when preparing for arrival at the port in the Netherlands.
There it remains unplugged causing the average air temperature inside the reefer to rise above 6
°C, and the reefer does not recover during the continued transport.
Figure 16: Temperature profiles from the processor (Iceland) to the final destination (France) in Experiment 4
Figure 17 shows the average temperature of loggers inside EPS boxes in contact with fish loins,
from the reefer loading in Iceland to delivery in France, in a temperature mapping study from
one of the field trips. The average temperature of pallet 4, located by the reefer doors, rises
more rapidly than in the other pallets located closer to the refrigeration unit. A temperature rise
inside all EPS corner boxes is noticeable when the reefer is unplugged during arrival in the
Netherlands. Top corner boxes on pallets were subject to the greatest temperature rise through
the journey. Boxes in bottom corners of pallets suffer less thermal load and boxes located in the
middle of pallets are not affected, except on pallet 4, by the reefer door‐end.

13
Figure 17: Average temperature of EPS boxes from reefer loading in Iceland to delivery in France
3.3 Temperature distribution in reefer containers
Temperature measurements at around 40–70 positions inside different types of refrigerated sea
containers during the MSc experiments revealed that the mean air temperature inside fully
loaded containers at ambient temperature of around 15 °C can be 1 to 2 °C above the set point
temperature of 0 °C 9. Furthermore, around 1 °C higher air temperature can be expected in the
quadrant at the back of the container as compared to the quadrant closest to the refrigerating
equipment at the front of the container. Taking into account that storage life of whitefish
products is larger for products stored at –1 °C than at 0 °C,13 these results imply that the set point
temperature should be set to no higher than –1.5 to –1.0 °C during periods when the expected
ambient temperature is higher than 10 to 15 °C. On the other hand, measurements during the
winter time at ambient temperature around –5 to 5 °C, mean air temperature of around 0 to 0.5
°C can be expected under these more favourable conditions. This implies that in order not to risk
excessive freezing of whitefish products due to air temperature fluctuations inside containers in
the wintertime, the set point temperature should probably not be set at lower temperature than
–1.0 °C.
13 Lauzon, H.L., Margeirsson, B., Sveinsdóttir, K., Guðjónsdóttir, M., Karlsdóttir, M.G., Martinsdóttir, E., 2010. Overview on fish quality research - Impact of fish handling, processing, storage and logistics on fish quality deterioration. Matís report 39-10. 2010. Overview on fish quality research - Impact of fish handling, processing, storage and logistics on fish quality deterioration. Matís report 39-10.
14
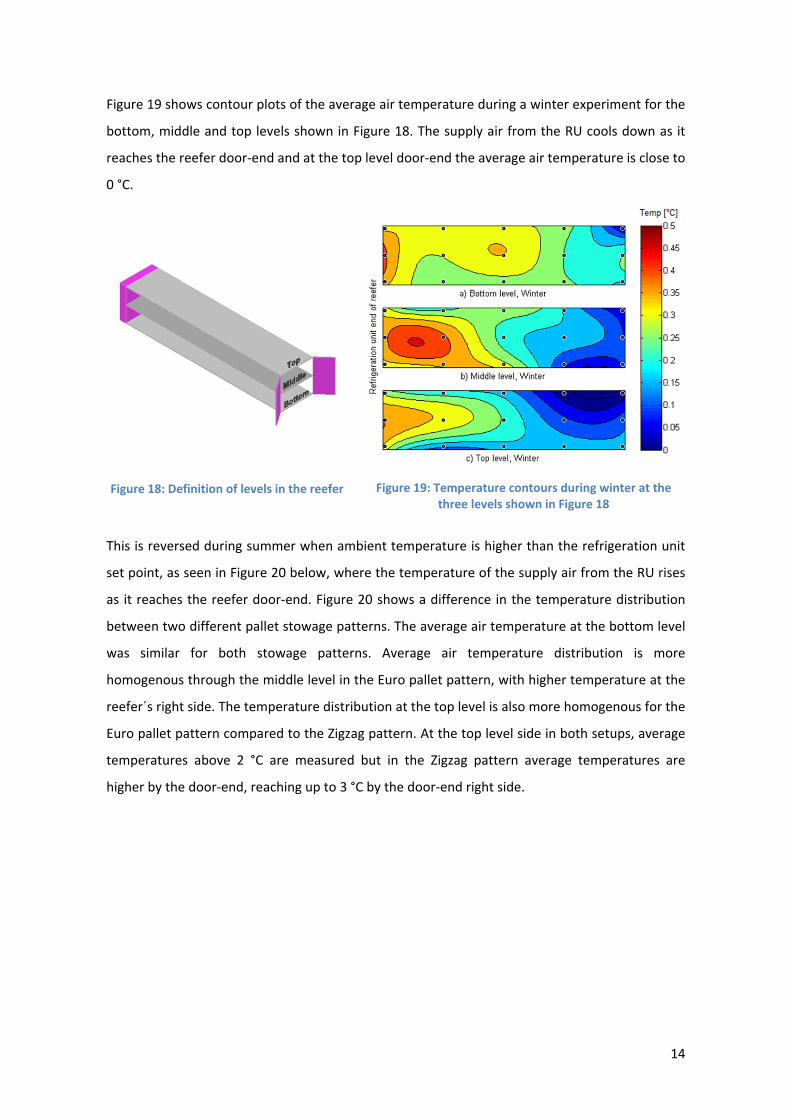
Figure 19 shows contour plots of the average air temperature during a winter experiment for the
bottom, middle and top levels shown in Figure 18. The supply air from the RU cools down as it
reaches the reefer door‐end and at the top level door‐end the average air temperature is close to
0 °C.
Figure 18: Definition of levels in the reefer Figure 19: Temperature contours during winter at the three levels shown in Figure 18
This is reversed during summer when ambient temperature is higher than the refrigeration unit
set point, as seen in Figure 20 below, where the temperature of the supply air from the RU rises
as it reaches the reefer door‐end. Figure 20 shows a difference in the temperature distribution
between two different pallet stowage patterns. The average air temperature at the bottom level
was similar for both stowage patterns. Average air temperature distribution is more
homogenous through the middle level in the Euro pallet pattern, with higher temperature at the
reefer´s right side. The temperature distribution at the top level is also more homogenous for the
Euro pallet pattern compared to the Zigzag pattern. At the top level side in both setups, average
temperatures above 2 °C are measured but in the Zigzag pattern average temperatures are
higher by the door‐end, reaching up to 3 °C by the door‐end right side.

15
Figure 20: Temperature contours during summer at three levels with Euro pallet (left) and zigzag (right) loading patterns
Figure 22 shows the average temperature distribution of vertical cross section inside a reefer
transport from South‐Iceland to England during Experiment 2. The reefer refrigeration unit was
set to –2 °C during sea transport and the measurement grid is shown in Figure 21. The
temperature is lowest by the refrigeration unit and in the middle of the mid‐section.
Temperatures are higher at the reefer door‐end. All sections show external heat flowing through
the reefer walls and the roof, and the effects of heating are considerably higher by the reefer
door‐end area.
Figure 21: Measured sections, Experiment 2 Figure 22: Mean temperature distribution, Experiment 2
Figure 23 and Figure 24 show the contour plot average temperature distributions in the vertical
cross sections at the RU‐unit, in the middle and at the door‐end for Experiments 3 and 4, which
were conducted at the same time for different reefers. All the plots have a common “cold spot”
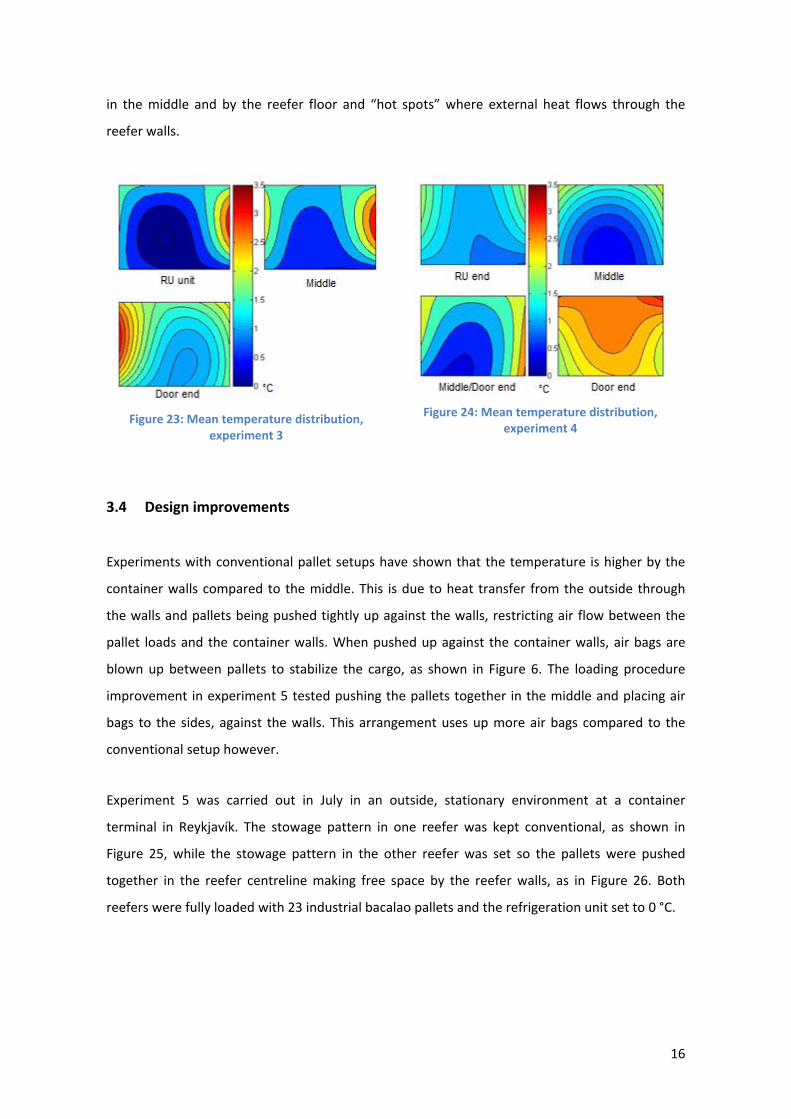
16
in the middle and by the reefer floor and “hot spots” where external heat flows through the
reefer walls.
Figure 23: Mean temperature distribution, experiment 3
Figure 24: Mean temperature distribution, experiment 4
3.4 Design improvements
Experiments with conventional pallet setups have shown that the temperature is higher by the
container walls compared to the middle. This is due to heat transfer from the outside through
the walls and pallets being pushed tightly up against the walls, restricting air flow between the
pallet loads and the container walls. When pushed up against the container walls, air bags are
blown up between pallets to stabilize the cargo, as shown in Figure 6. The loading procedure
improvement in experiment 5 tested pushing the pallets together in the middle and placing air
bags to the sides, against the walls. This arrangement uses up more air bags compared to the
conventional setup however.
Experiment 5 was carried out in July in an outside, stationary environment at a container
terminal in Reykjavík. The stowage pattern in one reefer was kept conventional, as shown in
Figure 25, while the stowage pattern in the other reefer was set so the pallets were pushed
together in the reefer centreline making free space by the reefer walls, as in Figure 26. Both
reefers were fully loaded with 23 industrial bacalao pallets and the refrigeration unit set to 0 °C.

17
Figure 25: Conventional Euro pallet setup Figure 26: Improved Euro pallet setup
A measurement grid with 3 horizontal sections was used for each reefer, as shown in Figure 27,
with 27 measurement points in total. The reefers were located side by side (with space between
them), so the measurements are similar. The average temperature of both reefers is close to 1 °C
but the reefers are set to 0 °C.
Figure 27: Experiment 5 measurement grid Figure 28: Experiment 5 pallet setup
The temperature measurements were found to be similar for both setups indicating that there is
not a significant difference between the two setups. However the difference could be less
noticeable due to the experimental set up, as in the conventional setup the chilled fish is being
pushed up against loggers at the reefer walls.
The results from the MSc experiments imply that the cold air blown along the floor gratings is not
delivered properly from the refrigeration unit to the other end of the container. Partly blocking
floor gratings close to the refrigeration unit should distribute cold air better to the other end of
the container, by the doors.
Experiment 6 was carried out in an outside, stationary environment at a container terminal in
Reykjavik to test the effects of blocking the floor compared to the conventional setup.

18
Measurements on two reefers took place over a period from July to August. The stowage pattern
in one reefer was kept conventional Euro pallet setup, as shown in Figure 29. The stowage
pattern in the other reefer was the same but there the T‐bar floor was partly blocked in the
reefer RU‐end half, as shown in Figure 30.
Figure 29: Conventional Euro pallet setup Figure 30: Partly blocked floor setup
Figure 31: T‐bar floor blocking Figure 32: Measured reefers in container terminal
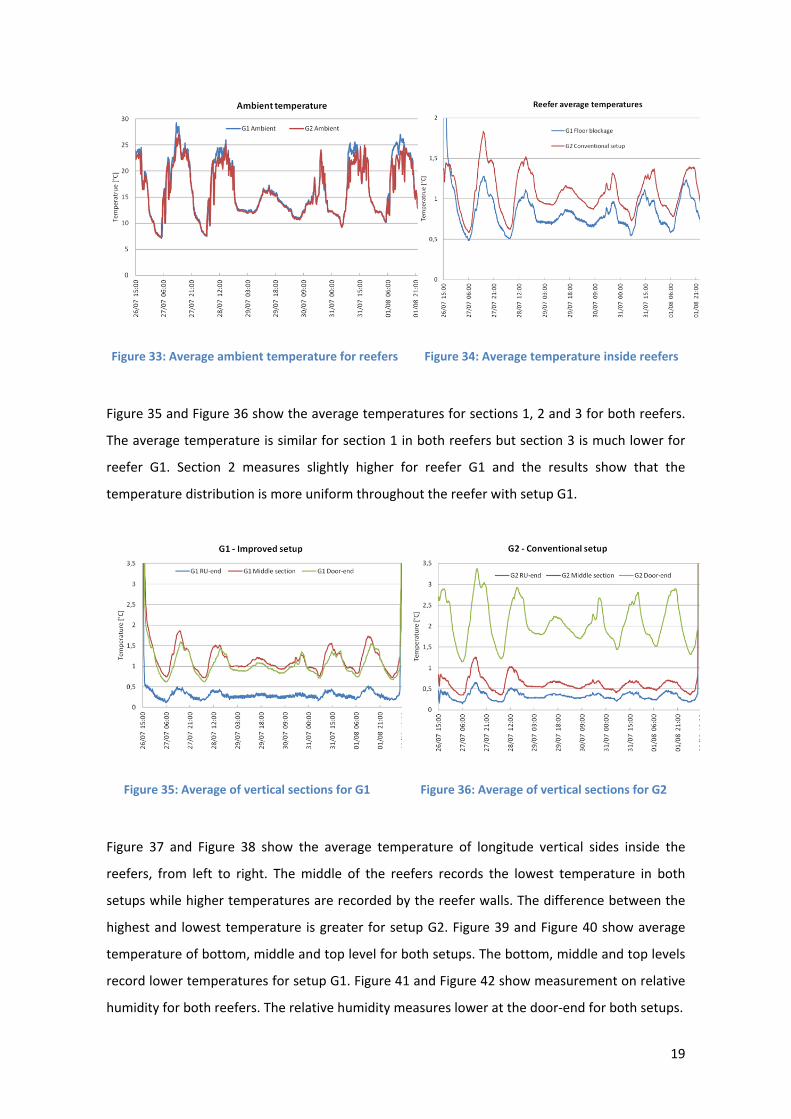
Figure 33 shows the average ambient temperature for each reefer, G1 representing the floor
blockage setup and G2 with the conventional setup. The reefers were located side by side (with
sufficient space between them to exclude thermal interference between the two reefers), so the
ambient measurements are similar. Figure 34 shows the average temperature inside each reefer,
G1 records lower average temperature during the whole measurement period.
19
Figure 33: Average ambient temperature for reefers Figure 34: Average temperature inside reefers
Figure 35 and Figure 36 show the average temperatures for sections 1, 2 and 3 for both reefers.
The average temperature is similar for section 1 in both reefers but section 3 is much lower for
reefer G1. Section 2 measures slightly higher for reefer G1 and the results show that the
temperature distribution is more uniform throughout the reefer with setup G1.
Figure 35: Average of vertical sections for G1 Figure 36: Average of vertical sections for G2
Figure 37 and Figure 38 show the average temperature of longitude vertical sides inside the
reefers, from left to right. The middle of the reefers records the lowest temperature in both
setups while higher temperatures are recorded by the reefer walls. The difference between the
highest and lowest temperature is greater for setup G2. Figure 39 and Figure 40 show average
temperature of bottom, middle and top level for both setups. The bottom, middle and top levels
record lower temperatures for setup G1. Figure 41 and Figure 42 show measurement on relative
humidity for both reefers. The relative humidity measures lower at the door‐end for both setups.

20
Figure 37: Average temperature of sides for G1 Figure 38: Average temperature of sides for G2
Figure 39: Average temperature of levels for G1 Figure 40: Average temperature of levels for G2
Figure 41: Relative humidity for G1 Figure 42: Relative humidity for G2
21
4 CONCLUSIONS
In conclusion the results of the project show that temperature control during containerised sea
transport may be improved by simple design improvements, changes in operation procedures
and conditional temperature settings of the reefer.
The transport results showed that the effect of precooling at the processor will help maintain the
temperature through the transport chain. After production fresh fish should be stored at a
temperature close to the desired transport temperature but not in a freezer or an unchilled
storage as is commonly done. Loading cargo at temperatures above the desired transport
temperature should be avoided and the loading should preferably take place in a temperature
controlled environment or at least under a shelter during the summertime.
While temperature was found to be stable through the sea freight, the land transport and
transport of the reefers from the dock to shipping is less controlled. Improvements at loading
facilities when moving and loading containers are needed. Information from producers and truck
drivers are often incomplete and that can be the cause for unnecessary pallet movement and
excessive waiting time for pallets before they are containerised, resulting in a temperature rise in
the product. The time reefers are unplugged during transport should be minimized. This is
especially relevant prior to loading and unloading the reefer from container ships. When
transporting fresh fish, reefer set point temperatures should be set between –1.5 and –1 °C
during summer and –1 to 0 °C during winter because of influences of variable season ambient
conditions. Reefers older than 2–3 years should be used for less sensitive cargo than fresh fish as
newer reefers were found to perform better. As the doors of the reefer were found to constitute
a weak point regarding leakage, they must be regularly monitored and repaired.
Temperatures and temperature fluctuations were generally found to be the greatest at the
reefer´s door‐end area and the design improvement results showed that by forcing air flow to
that area temperature control can be improved. The cargo should also be spaced from the reefer
walls to allow for air flow from the refrigeration unit to counteract heat gain from the ambience.
22
ACKNOWLEDGEMENTS
This work was funded by AVS R&D Fund of Ministry of Fisheries and Agriculture in Iceland
(project no. R 11 093‐11). The work was done in cooperation with Matís, University of Iceland,
Eimskip and Samherji and the financing of this work is gratefully acknowledged.
PUBLICATIONS
The following has been published on the results of the current project:
Elíasson, S. 2012. Temperature control during containerised sea transport of fresh fish. MSc. Thesis, University of Iceland. Elíasson, S., Margeirsson, B., Arason, S., Pálsson, H. Temperature control during containerised sea transport of fresh fish. Presentation given at the 4th Trans‐Atlantic Fisheries Technology Conference, 30 Oct–2 Nov, 2012. Clearwater Beach, FL, United States.
Margeirsson, B., Pálsson, H., Arason, S., Lauzon, H.L., Jónsson, M.Þ., Gospavic, R., Popov, V. Quality deterioration and numerical modelling of temperature fluctuations of chilled cod fillets packaged in different boxes stored on pallets under dynamic temperature conditions. In: 2nd IIR International Conference on Sustainability and the Cold Chain, Paris, 2–4 April, 2013. Submitted 6 Dec, 2012.
Margeirsson, B. Aukin verðmæti sjávarfangs ‐ bætt nýting aukaafurða og betri kælikeðja. Presentation given at an open meeting on Héðinn Protein Plant, 16 May, 2012. Snæfellsbær, Iceland.

23
REFERENCES
1) Margeirsson, B. 2012. Modelling of temperature changes during transport of fresh fish products. Doctoral thesis. Faculty of industrial engineering, mechanical engineering and computer science, University of Iceland.
2) Axelsdóttir, K. 2002. Greining á flutningaferlum lausfrystra sjávarafurða. M.Sc. thesis. University of Iceland.
3) Björnsson, H.Ó. 2005. Geymslu‐ og flutningastýring lausfrystra sjávarafurða. M.Sc. thesis. University of Iceland.
4) Lauzon, H.L., Margeirsson, B., Sveinsdóttir, K., Guðjónsdóttir, M., Karlsdóttir, M.G., Martinsdóttir, E. 2010. Overview on fish quality research. Impact of fish handling, processing, storage and logistics on fish quality deterioration. Matís report 39‐10.
5) Billing, D. P., Hayes, A.J., McDonald, B. 1995. Temperature and airflow characteristics in reefer vessels carrying New Zealand produce. Prod. 19th International Congress of Refrigeration. Vol II: 485‐492.
6) Tanner, D. J., Amos, N. D. 2003.Temperature variability during shipment of fresh produce. Acta Horticulturae, 599 p.193‐203.
7) Punt, H., Huysamer, M. 2005. Temperature variance in a 12 m integral reefer container carrying plums under a dual temperature shipping regime. Acta horticulturae, 687, p. 289‐296.
8) Valtýsdóttir, K. L. 2011. The effects of different precooling techniques and improved packaging design on fresh fish temperature control. M.Sc. thesis. University of Iceland.
9) Elíasson, S. 2012. Temperature control during containerised sea transport of fresh fish. M.Sc. thesis. University of Iceland.
10) Elíasson, S., Margeirsson, B., Sigurjón, A. 2012. Project Report – Work Package 3. Experiments results. Matís.
11) Thermo King, M. 2007. Available at http://www.containere‐maritime.ro/Magnum_Brochure.pdf. Ingersoll Rand Climate Control Technologies. Diegem, Belgium.
12) Carrier,Transicold. 2010. Operation and service manual ‐ Container refrigeration unit 69NT40. Carrier corporation. New York, USA.
13) Lauzon, H.L., Margeirsson, B., Sveinsdóttir, K., Guðjónsdóttir, M., Karlsdóttir, M.G., Martinsdóttir, E. 2010. Overview on fish quality research ‐ Impact of fish handling, processing, storage and logistics on fish quality deterioration. Matís report 39‐10.