Improved Oxidation Stability and Solvency of Naphthenic ... Presentations... · Track or Category:...
42
Track or Category: Lubrication Fundamentals Improved Oxidation Stability and Solvency of Naphthenic/Paraffinic Blends – A Parameter Study Thomas Norrby, Naphthenics TechDMS, Nynas AB, Nynashamn, Sweden Ann-Louise Jonsson, Naphthenics Research, Nynas AB, Nynashamn, Sweden INTRODUCTION Base oil blends are frequently encountered in finished lubricant formulations. Nynas has for some time supplied Group I replacement base oils which has proven to fulfil the viscosity and solvency needs for industrial lubricants. One additional key performance aspect of these novel blended base oils is their response to added antioxidants. In the present study, a new test matrix comprising Naphthenic, Group II, Group II and PAO base fluids were investigated with respect to Pour Point, Flash Point, Aniline Point and viscosity. A new set of correlations between added primary and secondary antioxidants and overall base oil sulfur could be established, which serve as useful guidelines for lubricant formulators. With the Group I base oil production capacity rapidly declining, industrial lubricants are facing new challenges with formulation compatibility, additive solubility and extensive re-formulations. Nynas has developed a new range of Group I replacement base oils which has proven to fulfil the viscosity and solvency needs for industrial lubricants. One important aspect of these novel base oils is their response to added antioxidants. The first part of this study was reported at the STLE Annual Meeting in 2017 [1]. In that study, base oil and additive sulfur levels could be correlated to oxidation stability in different laboratory tests. In the present study, a new test matrix comprising Naphthenic, Group II, Group II and PAO base fluids were investigated with respect to Pour Point, Flash Point, Aniline Point and Kinematic Viscosity. This is of general interest to the lubricants formulator, or anyone interested in the properties of blends. What are the significant changes of properties arising from the gradual increase in the Naphthenic blending component? How fast do key variables like volatility and solvency change? How long does a “synthetic” base fluid retain its properties, before a transition to a semi-synthetic blend can be observed? A new set of correlations between added primary and secondary antioxidants and overall base oil Sulfur could be established, which serve as useful guidelines for lubricant formulators. MATERIALS AND METHODS The base oils in this study are Naphthenic oils, and paraffinic base oils of Group II and Group III, and fully synthetic PAO (Group IV), see Table 1 (Low viscosity), Table 2 (Mid viscosity) and Table 3 (Upper mid viscosity) Table 1. The low viscosity blends of NYNAS™ T 9 (8.89 cSt) into Group II (HP 2, 10.7 cSt), Group III (NEXBASE 3020, 7.55 cSt) or PAO (SpectraSyn 2, 5 cSt). Viscosity Index (VI) ASTM D 2270, Pour Point ASTM D 7346 (PP); Aniline Point ASTM D 611 (AP). Group II Group III PAO NYN AS T 9, 5% in 10.61 cSt VI 66.5 PP -39 °C AP 90 °C 7.58 cSt VI 95.9 PP -42 °C AP 94 °C 5.08 cSt VI 83.9 PP -87 °C AP 100 °C NYN AS T 9, 15% in 10.40 cSt VI 63.6 PP -42 °C AP 88 °C 7.69 cSt VI 89 PP -42 °C AP 95 °C 5.31 cSt VI 79.9 PP -87 °C AP 97.1 °C NYN AS T 9, 25% in 10.20 cSt VI 60.5 PP -42 °C AP 86 °C 7.86 cSt VI 93.3 PP -42 °C AP 92 °C 5.54 cSt VI 77.7 PP -84 °C AP 94.1 °C More on the properties of the Naphthenic base oil can be found at Nynas web pages, www.nynas.com , or in the web app productfinder.nynas.com. The key properties of these blends were investigated with respect to Kinematic Viscosity, Viscosity Index (VI), Flash Point, Pour Point and Aniline Point. An oxidation stability study utilizing HP-DSC Oxidation Induction Time (OIT, ASTM D6186) in relation to
Transcript of Improved Oxidation Stability and Solvency of Naphthenic ... Presentations... · Track or Category:...
TrackorCategory:LubricationFundamentals
ImprovedOxidationStabilityandSolvencyof
Naphthenic/ParaffinicBlends–AParameterStudy
ThomasNorrby,NaphthenicsTechDMS,NynasAB,Nynashamn,Sweden
Ann-LouiseJonsson,NaphthenicsResearch,NynasAB,Nynashamn,Sweden
INTRODUCTIONBase oil blends are frequently encountered in finished lubricant formulations. Nynas has for some time suppliedGroup I replacementbaseoilswhichhasprovento fulfil theviscosityandsolvencyneeds for industrial lubricants.Oneadditionalkeyperformanceaspectof thesenovelblendedbaseoils is theirresponsetoaddedantioxidants. Inthepresentstudy,anewtestmatrixcomprisingNaphthenic,GroupII,GroupIIandPAObasefluidswereinvestigatedwithrespecttoPourPoint,FlashPoint,AnilinePointandviscosity.Anewsetofcorrelationsbetweenaddedprimaryand secondary antioxidants and overall base oil sulfur could be established, which serve as useful guidelines forlubricantformulators.
WiththeGroupIbaseoilproductioncapacityrapidlydeclining, industrial lubricants are facing newchallenges with formulation compatibility, additivesolubility and extensive re-formulations. Nynas hasdeveloped a new rangeofGroup I replacement baseoils which has proven to fulfil the viscosity andsolvency needs for industrial lubricants. Oneimportant aspect of these novel base oils is theirresponsetoaddedantioxidants.
The first part of this study was reported at theSTLEAnnualMeetingin2017[1]. Inthatstudy,baseoil and additive sulfur levels could be correlated tooxidationstabilityindifferentlaboratorytests.Inthepresent study, a new test matrix comprisingNaphthenic, Group II, Group II and PAO base fluidswere investigated with respect to Pour Point, FlashPoint,AnilinePointandKinematicViscosity.Thisisofgeneral interest to the lubricants formulator, oranyoneinterestedinthepropertiesofblends.
What are the significant changes of propertiesarising from the gradual increase in the Naphthenicblending component?How fast do key variables likevolatility and solvency change? How long does a“synthetic” base fluid retain its properties, before atransitiontoasemi-syntheticblendcanbeobserved?
AnewsetofcorrelationsbetweenaddedprimaryandsecondaryantioxidantsandoverallbaseoilSulfurcouldbeestablished,whichserveasusefulguidelinesforlubricantformulators.
MATERIALSANDMETHODS
The base oils in this study are Naphthenic oils, andparaffinicbaseoilsofGroupIIandGroupIII,andfully
syntheticPAO(GroupIV),seeTable1(Lowviscosity),Table 2 (Mid viscosity) and Table 3 (Upper midviscosity)Table1. The lowviscosity blendsofNYNAS™T9
(8.89cSt)intoGroupII(HP2,10.7cSt),GroupIII
(NEXBASE3020,7.55cSt)orPAO(SpectraSyn2,5
cSt).ViscosityIndex(VI)ASTMD2270,PourPoint
ASTM D 7346 (PP); Aniline Point ASTM D 611
(AP).
Group
II
GroupIII
PAO
NYNAST9,5%in
10.61cStVI66.5PP-39°CAP90°C
7.58cStVI95.9PP-42°CAP94°C
5.08cStVI83.9PP-87°CAP100°C
NYNAST9,15%in
10.40cStVI63.6PP-42°CAP88°C
7.69cStVI89PP-42°CAP95°C
5.31cStVI79.9PP-87°CAP97.1°C
NYNAST9,25%in
10.20cStVI60.5PP-42°CAP86°C
7.86cStVI93.3PP-42°CAP92°C
5.54cStVI77.7PP-84°CAP94.1°C
MoreonthepropertiesoftheNaphthenicbaseoilcanbefoundatNynaswebpages,www.nynas.com,orinthe web app productfinder.nynas.com. The keyproperties of these blends were investigated withrespect to Kinematic Viscosity, Viscosity Index (VI),Flash Point, Pour Point and Aniline Point. Anoxidation stability study utilizing HP-DSC OxidationInduction Time (OIT, ASTM D6186) in relation to

addedprimaryandsecondaryantioxidants,andbaseoilsulfurlevels,wasalsocarriedout.
Table2.ThemidviscosityblendsofNYNAS™T22
(23.01cSt)intoGroupII(HP4,19.7cSt),GroupIII
(NEXBASE 3043, 19.9 cSt) or PAO (SpectraSyn 4,
18.4cSt).ViscosityIndex(VI)ASTMD2270,Pour
Point ASTM D 7346 (PP); Aniline Point ASTM D
611(AP).
GroupII
Group
III
PAO
NYNAST22,5%in
19.82cStVI104PP-18°CAP107°C
20.03cStVI122PP-18°CAP115°C
18.47cStVI123PP-72°CAP118°C
NYNAST22,15%
in
19.95cStVI98PP-21°CAP105°C
20.06cStVI116PP-21°CAP111°C
18.64cStVI114PP-72°CAP115°C
NYNAST22,25%
in
20.13cStVI90PP-21°CAP102°C
20.13cStVI108PP-21°CAP108°C
18.66cStVI110PP-69°CAP111°C
Table3.Theuppermidviscosityblendsof
NYNAS™BT46(46.51cSt)intoGroupII(HP6,
41.30cSt),GroupIII(NEXBASE3080,48.48cSt)or
PAO(SpectraSyn8,47.53cSt).ViscosityIndex(VI)
ASTMD2270,PourPointASTMD7346(PP),
AnilinePointASTMD611(AP).
GroupII
GroupIII
PAO
NYNASBT46,5%
in
41.53cStVI100PP-21°CAP111°C
48.20cStVI131PP-15°CAP126°C
46.90cStVI136PP-54°CAP132°C
NYNASBT46,15%in
41.72cStVI95PP-24°CAP109°C
47.40cStVI124PP-15°CAP122°C
45.85cStVI129PP-54°CAP127°C
NYNASBT46,25%in
41.96StVI89.5PP-24°CAP106°C
46.68cStVI117PP-18°CAP118°C
44.95cStVI121PP-54°CAP122°C
RESULTSANDDISCUSSION
Select results of the properties of these blends areexemplified by the results for NYNAS™ T 22 andGroupII(seeTable2).
AnilinePoint
ThesolvencyoftheblendsishererepresentedbytheAniline Point (AP) data, Figure 1. The AP drops byseven (7) degrees at 25% T 22 in the blend, and itdecreases ina linear fashion towards theAPofT22(76 °C). Thus, solvency can be readily tuned byblending.
Figure1.Theeffecton solvency, as expressedby
the Aniline Point (AP), of blending NYNAS T 22
intoaGroupIIparaffinicbaseoil.
PourPointThe Pour Point (PP) is a convenientmeasure of thelow temperature flow properties of base oils andlubricants.Inthisstudy,theNaphthenicbaseoilsandPAO represent the “wax free” fluids, with excellentlow tempproperties,and theparaffinicGroup IIandGroupIIIbaseoilsdisplayPourPointstypicalof“waxcontaining “base oils. The T 22 blends in Figure 2displayapronounceddrop inPP,by six (6)degrees,already after the addition of only 5% T 22, and bynine(9)degreesat15%addition.Thisproperty(PP)showslesslinearityacrossthestudy,butaslowtempproperties aremore complexphenomena, this isnotentirelysurprising.
Figure 2. The effect on low temperature
properties,asexpressedbythePourPoint(PP),of
blending NYNAS T 22 into a Group II paraffinic
baseoil.
OxidationStabilitybyOIT
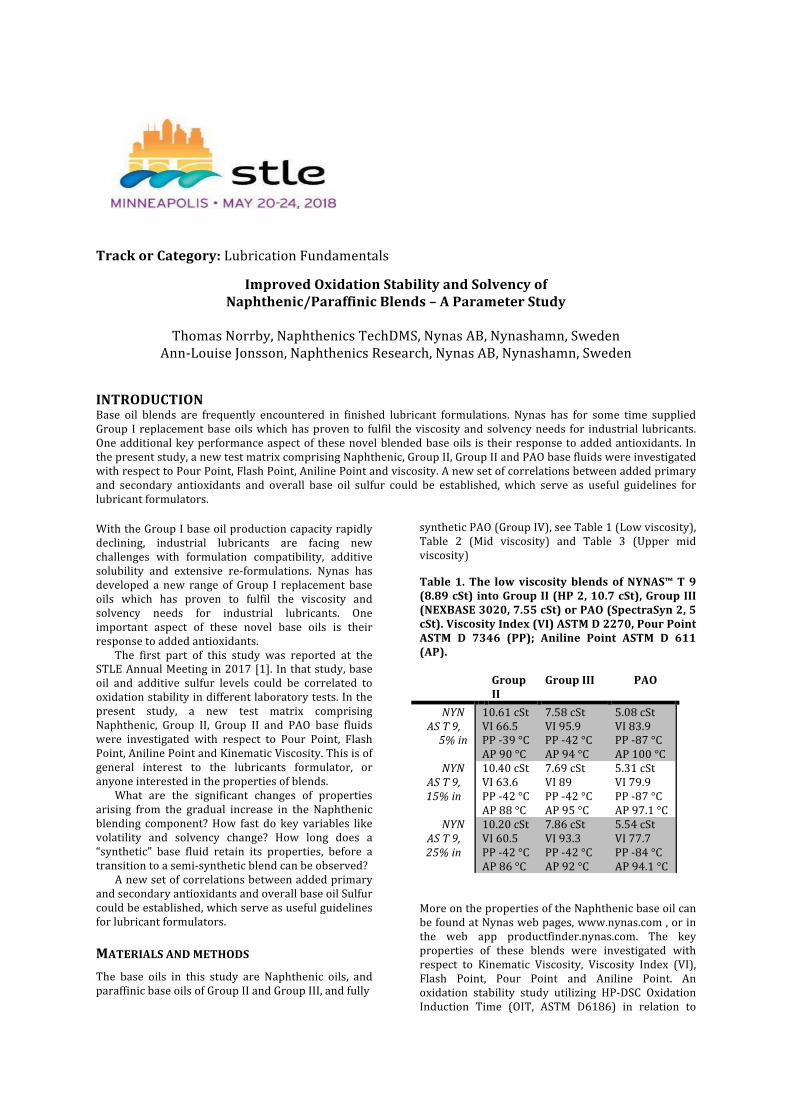
The oxidation stability of inhibited blends wasstudied by the Oxidation Induction Time (OIT). Asprimary Antioxidants (AO), 0.03% BHT and 0.03%Aryl Amine were used. As an ashless SecondaryAntioxidant (Sec. AO), 0.03% Dialkyl Di-Thiocarbamate was utilized to provide someadditionalSulfur.ThetotalAOconcentrationthuswas0.1%. The Group II base oil provides ca 15 ppmSulfur,therestoftheScomesfromtheSec.AO.Witheach5%ofT22inablend,about20ppmadditionalbaseoilSulfurisadded,sinceT22hasabout400ppmS.TheeffectofthisisvisibleinFigure3, leadingtoarapidimprovementinOIT,witharealstep-upalreadyat5%T22,withafactorof3x,from4to12minutes.
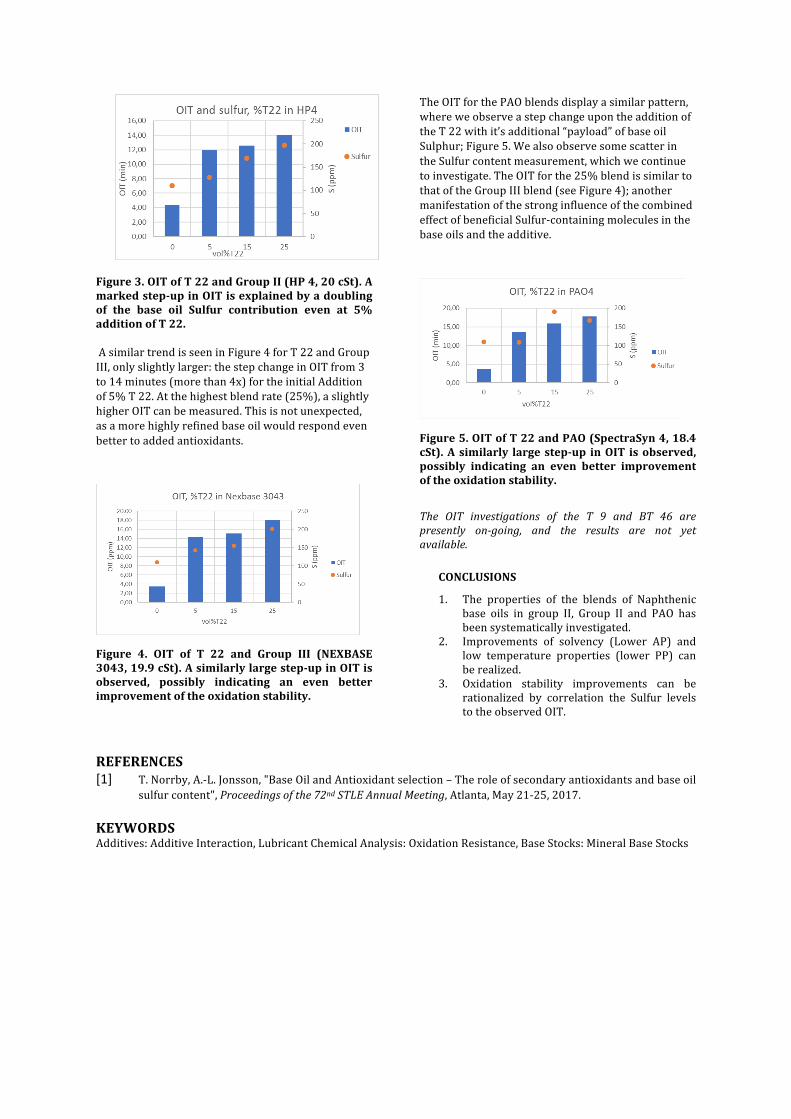
Figure3.OITofT22andGroupII(HP4,20cSt).A
markedstep-upinOITisexplainedbyadoubling
of the base oil Sulfur contribution even at 5%
additionofT22.
AsimilartrendisseeninFigure4forT22andGroupIII,onlyslightlylarger:thestepchangeinOITfrom3to14minutes(morethan4x)fortheinitialAdditionof5%T22.Atthehighestblendrate(25%),aslightlyhigherOITcanbemeasured.Thisisnotunexpected,asamorehighlyrefinedbaseoilwouldrespondevenbettertoaddedantioxidants.
Figure 4. OIT of T 22 and Group III (NEXBASE
3043,19.9cSt).Asimilarlylargestep-upinOITis
observed, possibly indicating an even better
improvementoftheoxidationstability.
TheOITforthePAOblendsdisplayasimilarpattern,whereweobserveastepchangeupontheadditionoftheT22withit’sadditional“payload”ofbaseoilSulphur;Figure5.WealsoobservesomescatterintheSulfurcontentmeasurement,whichwecontinuetoinvestigate.TheOITforthe25%blendissimilartothatoftheGroupIIIblend(seeFigure4);anothermanifestationofthestronginfluenceofthecombinedeffectofbeneficialSulfur-containingmoleculesinthebaseoilsandtheadditive.
Figure5.OITofT22andPAO(SpectraSyn4,18.4
cSt).Asimilarly largestep-up inOIT isobserved,
possibly indicating an even better improvement
oftheoxidationstability.
The OIT investigations of the T 9 and BT 46 arepresently on-going, and the results are not yetavailable.
CONCLUSIONS
1. The properties of the blends of Naphthenicbase oils in group II, Group II and PAO hasbeensystematicallyinvestigated.
2. Improvements of solvency (Lower AP) andlow temperature properties (lower PP) canberealized.
3. Oxidation stability improvements can berationalized by correlation the Sulfur levelstotheobservedOIT.
REFERENCES
[1] T.Norrby,A.-L.Jonsson,"BaseOilandAntioxidantselection–Theroleofsecondaryantioxidantsandbaseoilsulfurcontent",Proceedingsofthe72ndSTLEAnnualMeeting,Atlanta,May21-25,2017.
KEYWORDSAdditives:AdditiveInteraction,LubricantChemicalAnalysis:OxidationResistance,BaseStocks:MineralBaseStocks

Prof. Thomas NorrbyDr. A.-L. JonssonNynas ABSweden
Improved Oxidation stability and solvency of naphthenic/ paraffinic blends – a parameter study

Nynas was founded in 1928Nynas is the largest specialty oil producer in Europe
Offices in more than 30 countries around the globe
Net Sales: 1.5 Billion USD (2016)
Average number of employees: 1000
Refineries in Nynäshamn (SE), Harburg (DE), Gothenburg (SE), Eastham JV (UK), Antwerp JV (BE)
Nynashamn Harburg
May 2018
© 2017 Nynas. All rights reserved.2
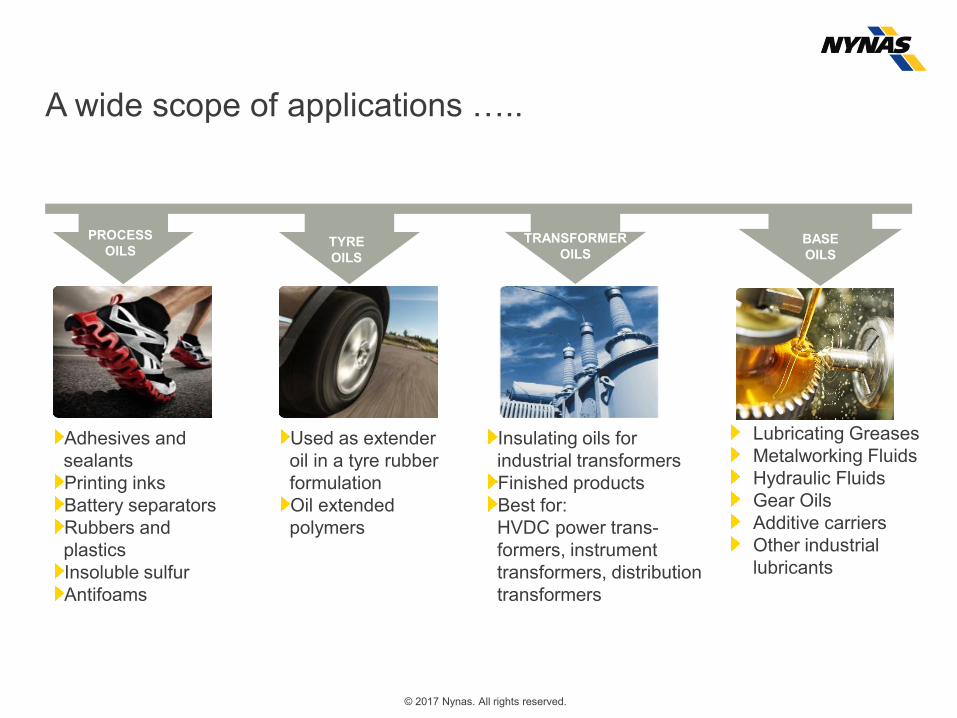
Lubricating GreasesMetalworking FluidsHydraulic FluidsGear OilsAdditive carriersOther industrial lubricants
A wide scope of applications …..
TYREOILS
PROCESSOILS
TRANSFORMEROILS
BASEOILS
Adhesives and sealantsPrinting inksBattery separatorsRubbers and plasticsInsoluble sulfurAntifoams
Used as extender oil in a tyre rubber formulationOil extended polymers
Insulating oils for industrial transformersFinished productsBest for: HVDC power trans-formers, instrument transformers, distribution transformers
May 2018
© 2017 Nynas. All rights reserved.

NSP Blend Study
4 May 2018© 2017 Nynas. All rights reserved.
Nynas has developed a new range of Group I replacement base oils which has proven to fulfil the viscosity and solvency needs for industrial lubricants
The first part of this study was reported at the STLE Annual Meeting in 2017 [1].
In that study, base oil and additive sulfur levels could be correlated to oxidation stability in different laboratory tests.
In the present study, a new test matrix comprising Naphthenic, Group II, Group II and PAO base fluids were investigated with respect to
Pour Point, Flash Point, Aniline Point and Kinematic Viscosity (KV).
Hopefully, this study is of general interest to the lubricants formulator, or anyone interested in the properties of blends
Introduction
5 May 2018
[1] T. Norrby, A.-L. Jonsson, "Base Oil and Antioxidant selection –The role of secondary antioxidants and base oil sulfur content", Proceedings of the 72nd STLE Annual Meeting, Atlanta, May 21-25, 2017.
© 2017 Nynas. All rights reserved.

What are the significant changes of properties arising from the gradual increase in the Naphthenic blending component?
How fast do key variables like volatility, pour point and solvency change?
How long does a “synthetic” base fluid retain its properties, before a transition to a semi-synthetic blend can be observed?
What is the Antioxidant response in this test matrix?
What is the correlation to benefits of base oil Sulfur?
Some interesting aspects of base oil blends
6 May 2018© 2017 Nynas. All rights reserved.

The base oils in this study are Naphthenic oils, and paraffinic base oils of Group II and Group III, and fully synthetic PAO (Group IV)
Three viscosity ranges:• Table 1 (Low viscosity, ca. 10 cSt)• Table 2 (Mid viscosity, ca. 20 cSt)• Table 3 (Upper mid viscosity, ca. 46 cSt)
In each viscosity group, Naphthenic base oils have been matched viscosity-wise with the paraffinic base oils
The Naphthenic base oil has then been blended in with 5%, 15% and 25 % into each base oil from Group II, Group III or Group IV (PAO )
The key properties of these blends were investigated with respect to Kinematic Viscosity, Viscosity Index (VI), Flash Point, Pour Point and Aniline Point.
An oxidation stability study utilizing HP-DSC Oxidation Induction Time (OIT, ASTM D6186) in relation to added primary and secondary antioxidants, and base oil sulfur levels, was also carried out.
Base oils used in the blending study
7 May 2018© 2017 Nynas. All rights reserved.

Table 1. Low viscosity blends
8 May 2018© 2017 Nynas. All rights reserved.

Table 2. Mid viscosity blends
9 May 2018
Group II
Group III
PAO
NYNAS T22, 5% in
19.82 cSt VI 104
PP -18 °C AP 107 °C
20.03 cSt VI 122
PP -18 °C AP 115 °C
18.47 cSt VI 123
PP -72 °C AP 118 °C
NYNAS T22, 15% in
19.95 cSt VI 98
PP -21 °C AP 105 °C
20.06 cSt VI 116
PP -21 °C AP 111 °C
18.64 cSt VI 114
PP -72 °C AP 115 °C
NYNAS T22, 25% in
20.13 cSt VI 90
PP -21 °C AP 102 °C
20.13 cSt VI 108
PP -21 °C AP 108 °C
18.66 cSt VI 110
PP -69°C AP 111 °C
© 2017 Nynas. All rights reserved.

Table 3. Upper mid viscosity blends
10 May 2018
Group II Group III PAO
NYNAS BT 46, 5% in
41.53 cSt VI 100
PP -21 °C AP 111 °C
48.20 cSt VI 131
PP -15 °C AP 126 °C
46.90 cSt VI 136
PP -54 °C AP 132 °C
NYNAS BT 46, 15% in
41.72 cSt VI 95
PP -24 °C AP 109 °C
47.40 cSt VI 124
PP -15 °C AP 122 °C
45.85 cSt VI 129
PP -54 °C AP 127 °C
NYNAS BT 46, 25% in
41.96 cSt VI 89.5
PP -24 °C AP 106 °C
46.68 cSt VI 117
PP -18 °C AP 118 °C
44.95 cSt VI 121
PP -54 °C AP 122 °C
© 2017 Nynas. All rights reserved.

A compilation of the results of the investigations of the properties of these blends are displayed in the following section
We have grouped the results by each Naphthenic oil (T 9, T 22 or BT 46), and compare the properties across each viscosity group
The results for Kinematic Viscosity of the blends is followed by solvency (Aniline Point), low temperature properties (Pour Point) and volatility (exemplified by the Flash Point)
A brief discussion in each sub section outlines the findings, and some general trends are high-lighted.
The properties of blends
11 May 2018© 2017 Nynas. All rights reserved.
The Kinematic Viscosity (KV) of blends of base oils with different properties; e.g. different viscosity and VI; are not trivial to predict, nor can the viscosity behavior be expected to be linear.
This phenomenon is particularly visible at 40 °C, why we have displayed the viscosity at that temperature throughout.
Large differences in viscosity has been cited as one factor [2, 3], but as we show in Figures 1-3, also base oils with similar KV but very different chemistry, density and VI will show non-linear blends viscosities.
Kinematic Viscosity
12 May 2018
[2] B. Zhmud, “Viscosity Blending Equations”, Lube-Tech No. 93, Lube Magazine No. 121, June 2014.[3] G. Centeno, G. Sánchez-Reyna, J. Ancheyta, J. A. D. Muños, N. Cardona, “Testing various mixing rules for
calculation if viscosity of petroleum blends”, Fuel, Vol. 90, (2011), pp 3561-3570.
© 2017 Nynas. All rights reserved.

KV of blends of T9, T 22 and BT 46
13 May 2018
NB Pronounced non-linearity in the blend viscosity diagrams for T 22 and BT 46. (Most visible at 40 degrees)An extra data point at 65% blend ratio is shown for illustration purpose.
© 2017 Nynas. All rights reserved.

The solvency of the blends is here represented by the Aniline Point (AP) data
The Aniline Point data fall in on a linear behaviour, thus creating what appears to be a more straight-forward additive behaviour of this property of the blends
The large difference in AP between the paraffinic base oils and T9 result in a steep slope and large effect on the AP by blending
Aniline Point, T 9
14 May 2018© 2017 Nynas. All rights reserved.
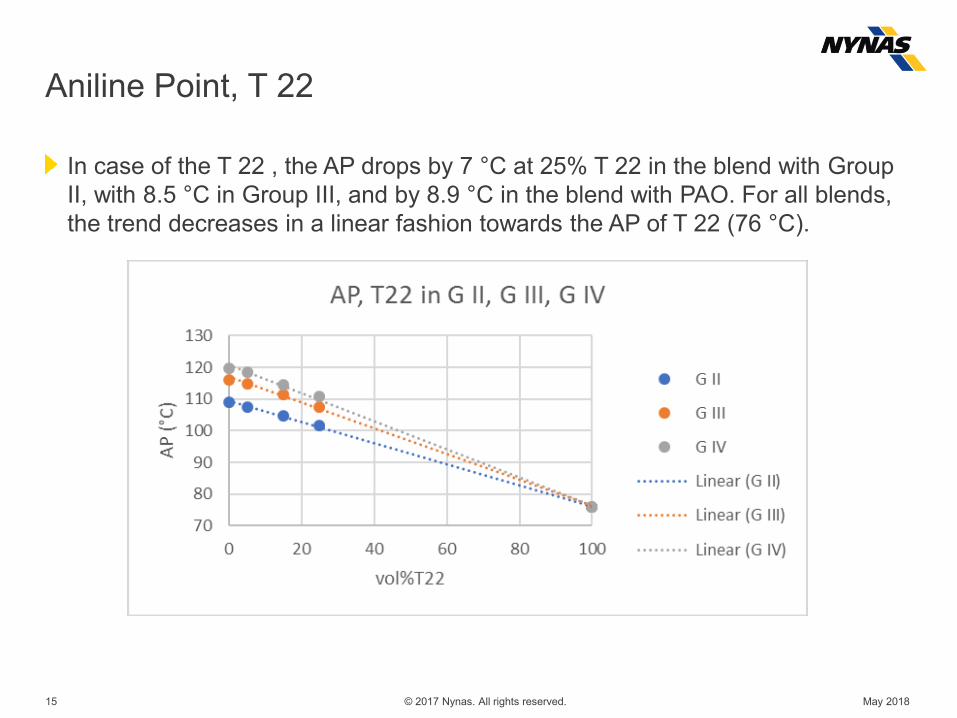
In case of the T 22 , the AP drops by 7 °C at 25% T 22 in the blend with Group II, with 8.5 °C in Group III, and by 8.9 °C in the blend with PAO. For all blends, the trend decreases in a linear fashion towards the AP of T 22 (76 °C).
Aniline Point, T 22
15 May 2018© 2017 Nynas. All rights reserved.

Similarly, for the blends of BT 46, at 25% blend ratio the AP decreases by 8-10 °C, which is twice the gap in AP between neat PAO and Group III, for example.
Aniline Point, BT 46
16 May 2018© 2017 Nynas. All rights reserved.

The volatility of a base oil blend is another important property
One convenient way to study and compare one aspect of this, is to measure the Flash Point (FP)
Here we report the results by Pensky-Martin (PM, ASTM D 93)
Flash Point
17 May 2018© 2017 Nynas. All rights reserved.

The FP of the blends of NYNAS T 9 and Gr II, Group III and Group IV (PAO) are shown below
The apparently high FP of the Group II base oil must be seen in the relation to its comparatively high KV (10.7 cSt, vs. Gr III 7.5 cSt and PAO, 5.0 cSt), see Table 1
Flash Point, T 9
18 May 2018© 2017 Nynas. All rights reserved.

For the blending of T 22 into the mid viscosity base oils, where the FP difference is rather large, the effect is rather substantial
For the 5% blend of T 22, the FP remains above 200 °C.
The trend line for the more highly refined Group III and PAO is clearly above that of the Group II blends, which fully reflects the design intention and key requirements on these base oils
Flash Point, T 22
19 May 2018© 2017 Nynas. All rights reserved.

The Flash points of the upper mid-viscosity blends follow a similar trend, but here all blends studied remain at FPs well above 200 °C
Flash Point, BT 46
20 May 2018© 2017 Nynas. All rights reserved.
The Pour Point (PP) is a convenient measure of the low temperature flow properties of base oils and lubricants
In this study, the Naphthenic base oils and PAO represent the “wax free” fluids, with excellent low temp properties..
..and the paraffinic Group II and Group III base oils display Pour Points typical of “wax containing“ base oils
This property (PP) shows less linearity across the study, but as low temperature properties are more complex phenomena, which sum up to a total effect based on different contributing parts, this is not entirely surprising
Pour Point
21 May 2018© 2017 Nynas. All rights reserved.
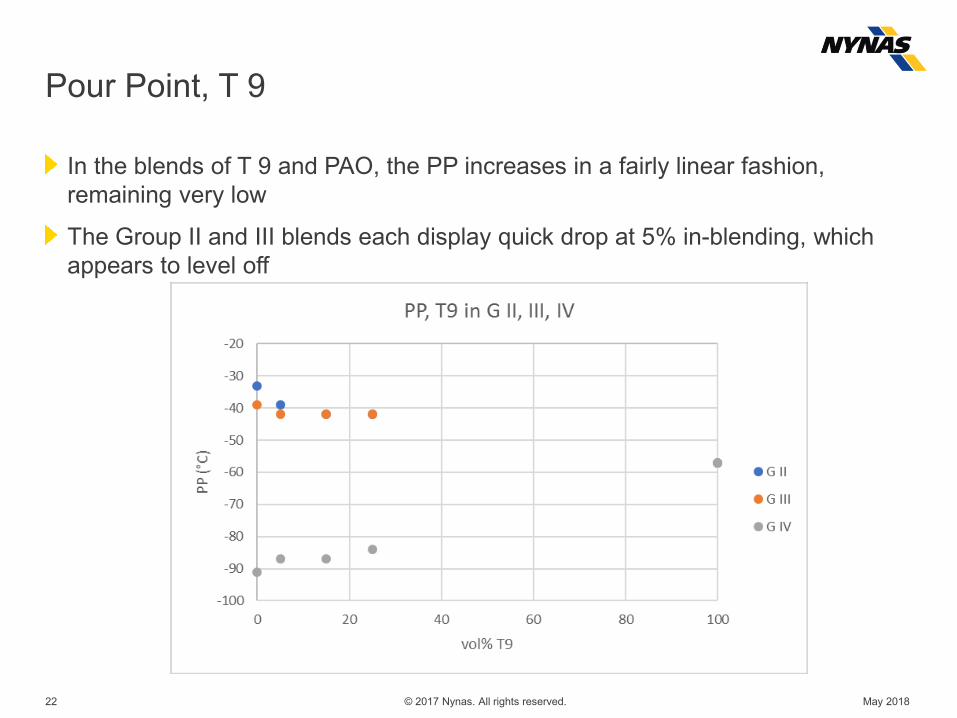
In the blends of T 9 and PAO, the PP increases in a fairly linear fashion, remaining very low
The Group II and III blends each display quick drop at 5% in-blending, which appears to level off
Pour Point, T 9
22 May 2018© 2017 Nynas. All rights reserved.
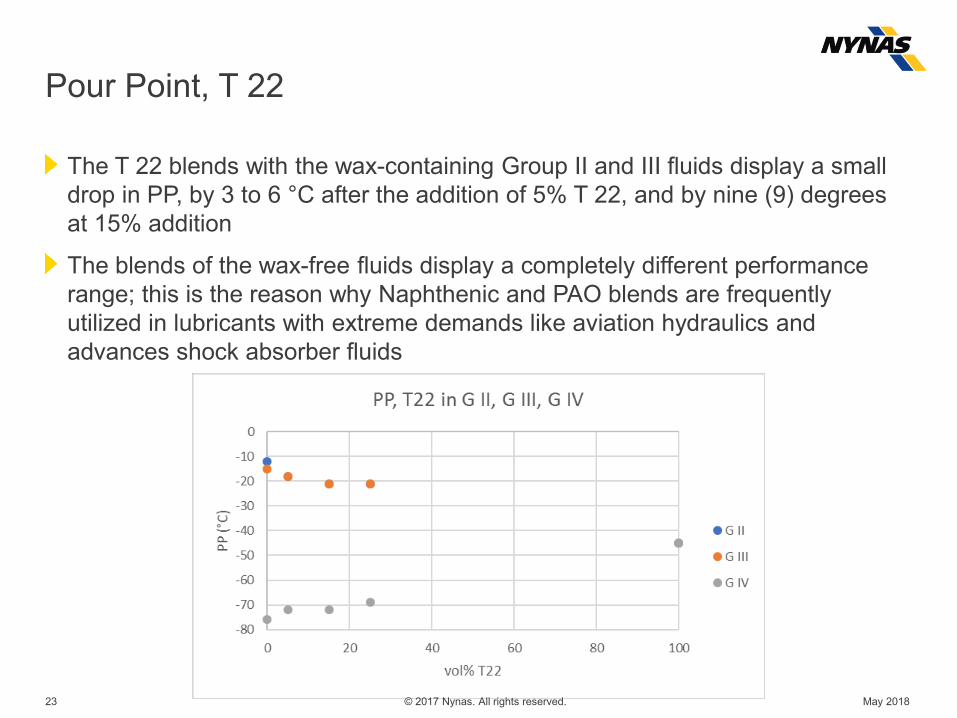
The T 22 blends with the wax-containing Group II and III fluids display a small drop in PP, by 3 to 6 °C after the addition of 5% T 22, and by nine (9) degrees at 15% addition
The blends of the wax-free fluids display a completely different performance range; this is the reason why Naphthenic and PAO blends are frequently utilized in lubricants with extreme demands like aviation hydraulics and advances shock absorber fluids
Pour Point, T 22
23 May 2018© 2017 Nynas. All rights reserved.

For the blends of BT 46, a similar pattern appears.
The PAO blends are dominated by the PAO at 5-25%, which in this case almost fully retain the PP of the neat PAO.
Pour Point, BT 46
24 May 2018© 2017 Nynas. All rights reserved.
The oxidation stability of inhibited blends was studied by the Oxidation Induction Time (OIT)
As primary Antioxidants (AO), 0.03% BHT and 0.03% Aryl Amine were used
As an ashless Secondary Antioxidant (Sec. AO), 0.03% Dialkyl Di-Thiocarbamate was utilized to provide some additional Sulfur
The total AO concentration thus was 0.1%.
The Group II base oil provides ca 15 ppm Sulfur, the rest of the S comes from the Sec. AO; Group III and PAO similar patterns
Importantly, with each 5% of T 22 in a blend, about 20 ppm additional base oil Sulfur is added, since T 22 has about 400 ppm S.
Oxidation stability and Antioxidant response
25 May 2018© 2017 Nynas. All rights reserved.

OIT of T 22 and Group II (20 cSt)
The synergistic and beneficial effect of the increase in Sulfur leads to a rapid improvement in OIT, with a real step-up already at 5% T 22, with a factor of 3x, from 4 to 12 minutes
OIT and Sulfur content, T 22 and Group II
26 May 2018© 2017 Nynas. All rights reserved.
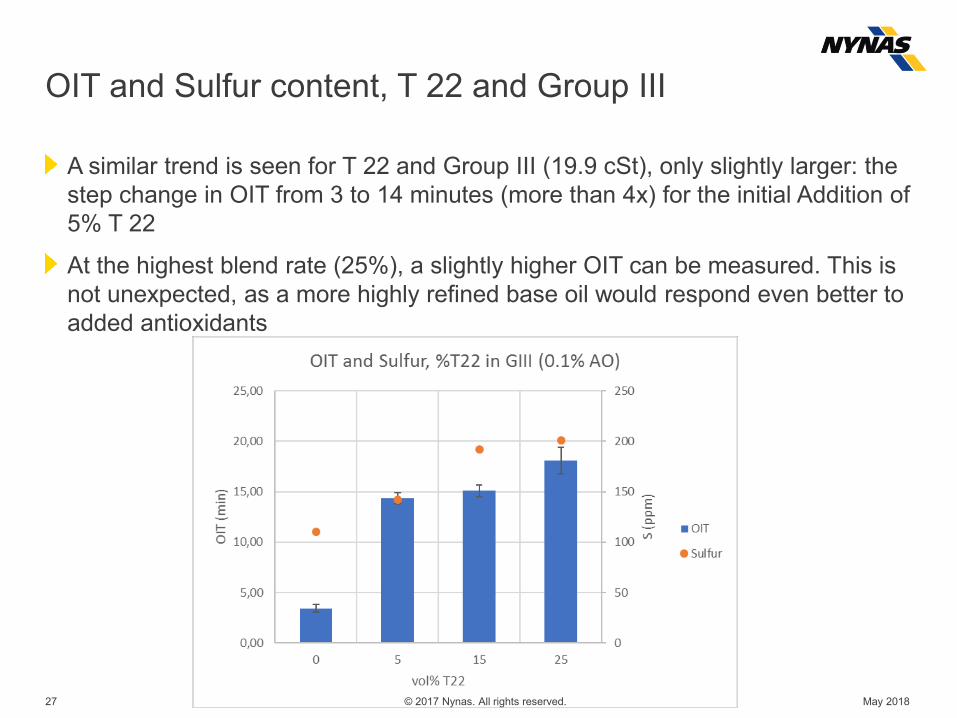
A similar trend is seen for T 22 and Group III (19.9 cSt), only slightly larger: the step change in OIT from 3 to 14 minutes (more than 4x) for the initial Addition of 5% T 22
At the highest blend rate (25%), a slightly higher OIT can be measured. This is not unexpected, as a more highly refined base oil would respond even better to added antioxidants
OIT and Sulfur content, T 22 and Group III
27 May 2018© 2017 Nynas. All rights reserved.

The OIT for the PAO blends display a similar pattern, where we observe a step change upon the addition of the T 22 with it’s additional ”payload” of base oil Sulphur
We also observe some scatter in the Sulfur content measurement, which we continue to investigate. The OIT for the 25% blend is similar to that of the Group III blend (18 min); another manifestation of the strong influence of the combined effect of beneficial Sulfur-containing molecules in the base oils and the additive
OIT and Sulfur content, T 22 and Group IV (PAO)
28 May 2018© 2017 Nynas. All rights reserved.

In this part of the study, we found stable result only at a higher AO treat rate (0.3% overall)
As primary Antioxidants (AO), 0.1% BHT and 0.1% Aryl Amine were used
As an ashless Secondary Antioxidant (Sec. AO), 0.1% Dialkyl Di-Thiocarbamate was utilized to provide some additional Sulfur
The total AO concentration thus was 0.3%
The Group II base oil provides ca 15 ppm Sulfur, the rest of the S comes from the Sec. AO; Group III and PAO similar patterns
Importantly, with each 5% of BT 46 in a blend, about 40 ppm additional base oil Sulfur is added, since T 22 has about 880 ppm Sulfur
OIT and Sulfur content, BT 46 and Group II
29 May 2018© 2017 Nynas. All rights reserved.

Blends of BT 46 and Group II base oil provides a similar manifestation of the strong influence on oxidation stability of base oil sulfur in combination with sulfur-containing secondary antioxidants
Addition of naphthenic oils to paraffinic base oil improves the response to antioxidants, increasing the oxidation induction time
OIT and Sulfur content, BT 46 and Group II
30 May 2018© 2017 Nynas. All rights reserved.

Blends of BT 46 and Group III yield a similar pattern
Even higher OIT is reached, compared to the Group II case, supporting the expectation of a better AO response in Group III with Sec. AO and Sulfur
OIT and Sulfur content, BT 46 and Group III
31 May 2018© 2017 Nynas. All rights reserved.

Blends of BT 46 and Group III yield a similar pattern
A higher OIT is reached, compared to the Group II case, supporting the expectation of a better AO response in Group III with Sec. AO and Sulfur
OIT and Sulfur content, BT 46 and Group III
32 May 2018© 2017 Nynas. All rights reserved.

Blends of BT 46 and PAO again yield a similar pattern
Even higher OIT is reached, compared to the Group III case, displaying an even better AO response in PAO with Sec. AO and Sulfur
OIT and Sulfur content, BT 46 and Group IV (PAO)
33 May 2018© 2017 Nynas. All rights reserved.

The sulfur content of T 9 is low compared to T 22 and BT 46• T 9: 80 ppm• T 22: 360 ppm• BT 46: 880 ppm
Although base oil sulfur increase with the addition of T 9 to G II (HP 2), the overall sulfur content is still very low and the secondary AO (dithiocarbamate) will account for the main source of sulfur in the formulated blends used in the OIT-measurements
Interestingly, how addition of T 9 to paraffinic base oils affects the oxidation stability proved much more difficult to assess using OIT than for the blends of heavier series previously discussed
OIT and Sulfur of T 9 blends
34 May 2018© 2017 Nynas. All rights reserved.

Possibly, a difference in OIT between the paraffinic base oil (HP 2) and the blend with 25% T 9 can be distinguished, but otherwise the differences are to small and repeatability way too large for certainty in any assessment
OIT and Sulfur of T 9 blends
35 May 2018© 2017 Nynas. All rights reserved.
Clearly OIT determination of low viscosity lubricants is difficult, a problem previously encountered when trying to develop a short oxidation test for transformer oils. It is noted that ASTM D 6186 was not developed encompassing low viscosity lubricants [4]
The blends of T9/G III and T9/G IV (PAO 2) display similar behavior when trying to determine OIT
Higher treat rates of antioxidant (increasing from 0.1% to 0.3%) did not improve the repeatability or give larger differences in OIT, nor did changing the isothermal temperature (185 qC) to lower (160 qC) or higher (190 qC).
One factor which have been mentioned as a source of uncertainty of the method is the sample cups (crucibles) [5], which have been verified in our investigations as well
Some general comment on OIT measurements
36 May 2018© 2017 Nynas. All rights reserved.
[4] I.-S. Rhee, “Development of New Oxidation Stability Test Method for Lubricating Oils Using Pressure Differential Scanning Calorimeter (PDSC)”, NLGI Spokesman, 2001, 65, 16[5] B. K. Sharma, A. J. Stipanovic, “Development of new oxidation stability test method for lubricating oils usinghigh-pressure differential scanning calorimetry” Thermochim. Acta, 2003, 402, 1

Another factor which might impact OIT measurements, particularly with low viscosity oils, is the volatility of the sample. The volatility of T 9 is comparatively much higher than for T 22 and BT 46
During OIT measurement, the sample is gradually heated up to the isothermal measurement temperature which normally is ~170−190 qC (range of method 130-210 qC)
Although high pressure is applied to minimize evaporation it is possible that this operation still could cause losses for low viscosity samples, thus affecting the accuracy
It is possible that the oxidation stability of these blends could be assessed by other methods, specifically by the methods usually employed for transformer oils (e.g. IEC 61125, ASTM D 2440, ASTM D 2112), but this was not investigated within the scope of this project
Some general comment on OIT measurements (II)
37 May 2018© 2017 Nynas. All rights reserved.
The impact of naphthenic oil addition to base fluids of paraffinic character in terms of oxidation stability, flammability, solvency and cold temperature properties have systematically been investigated
Results give that addition of naphthenic base oils to paraffinic base fluids can improve pour point and aniline point, without unjustified sacrifices in e.g. flash point
The non-linear relationship of blending base oils of different viscosity index and chemistry is specifically highlighted
The correlation of base oil sulfur with increased oxidation stability and response to antioxidants have been further corroborated.
Summary and conclusions
38 May 2018© 2017 Nynas. All rights reserved.
TAKING OIL FURTHER
We take oil further to bring lasting value to customers and the world we live in.