Improved identification of volcanic features using …wright/rse78.pdf · Improved identification...
14
Improved identification of volcanic features using Landsat 7 ETM+ Luke P. Flynn*, Andrew J.L. Harris, Robert Wright HIGP/SOEST, University of Hawaii, 2525 Correa Road, Honolulu, HI 96822, USA Received 16 March 2000; received in revised form 18 December 2000; accepted 30 April 2001 Abstract Volcanic eruptions can present unpredictable hazards to populations living within regions containing potentially active volcanoes and for people traveling in jet aircraft that intersect with ash-laden eruption clouds. Methods of monitoring volcanic activity include searching for variations in the thermal signal from active fumaroles, lava domes, lava lakes, flows, and other features. Over many active volcanoes in the Western Hemisphere, low spatial resolution (4 km/pixel) weather satellite data acquired every 15 min are used to identify changes in eruptive activity, but are of insufficient spatial resolution to map active volcanic features. The Enhanced Thematic Mapper Plus (ETM+) on Landsat 7 can be used to monitor active volcanoes at a higher spatial resolution (15- to 60-m pixels). ETM+ also offers improvements over its predecessor, the Thematic Mapper of Landsats 4 and 5, by way of a 15-m panchromatic band and higher spatial resolution (60 m/pixel) thermal infrared (IR) band. With higher spatial resolution panchromatic data, we are able to map lava flow fields, trace very high temperature lava channels, and, at Lascar volcano, identify an arcuate feature associated with a collapsed crater floor, a phenomenon that may precede explosive activity. With improved spatial resolution in the thermal IR, we are able to map the bifurcation and braiding of underground lava tubes at Kilauea. Identifying tube locations and tracking their extension are important because, for a given volumetric lava production (effusion) rate, tube-fed flows can extend a much greater distance than surface flows. At both Kilauea and Etna, we are able to use the thermal data to estimate effusion rates, an important parameter for assessing how far a flow is likely to extend and therefore the hazard it poses. An improved ETM+ data collection and distribution system includes a well-formulated and -executed Long-Term Acquisition Plan and less expensive data that is available much faster than previously possible. D 2001 Elsevier Science Inc. All rights reserved. Keywords: Volcano; Landsat 7; Enhanced Thematic Mapper Plus; Sensing 1. Introduction Thermal infrared (IR) data provided by the Advanced Very High Resolution Radiometer (AVHRR) were first demonstrated to be useful for identifying steel mills and other hot spots in 1981 (Matson & Dozier, 1981). Publica- tion of the first high spatial resolution studies of the active Lascar volcano in Chile followed 5 years later (Francis & McAllister, 1986). In terms of volcano studies, the important character- istics of spatial resolution and satellite revisit frequency are inextricably linked. This is largely due to the limi- tations of data transfer rates from satellites to receiving stations, the size of data recorders onboard satellites, and the configuration of detectors which trade off between larger swath widths and higher spatial resolution. These technological limitations have resulted in remote sensing data sources that can be divided into two groups. The first group combines high spatial resolution ( < 120 m per pixel) with low temporal resolution (minimum 8- to 16- day revisit frequency). The second group combines low spatial resolution (>1 km pixel) with high temporal resolution (multiple passes per day). Analysis of both types of data is extremely important for the future of remote sensing of volcanoes. High temporal resolution thermal IR data provided in near real time via Web sites have been shown to be useful for tracking the progress of eruptions in entire volcanic regions (e.g., Dean et al., 1998; Harris et al., 2000a). However, higher spatial resolution data sets are required to map the distribution of active lava flows and are better for placing constraints on the size and temperature of volcanic thermal anom- alies, heat flux, lava production rates, and other quant- itative parameters. Here, we focus attention on one of the latest high spatial resolution remote sensing instruments 0034-4257/01/$ – see front matter D 2001 Elsevier Science Inc. All rights reserved. PII:S0034-4257(01)00258-9 * Corresponding author. Tel.: +1-808-956-3154; fax: +1-808-956- 6322. E-mail address: [email protected] (L.P. Flynn). www.elsevier.com/locate/rse Remote Sensing of Environment 78 (2001) 180 – 193
Transcript of Improved identification of volcanic features using …wright/rse78.pdf · Improved identification...

Improved identification of volcanic features using Landsat 7 ETM+
Luke P. Flynn*, Andrew J.L. Harris, Robert Wright
HIGP/SOEST, University of Hawaii, 2525 Correa Road, Honolulu, HI 96822, USA
Received 16 March 2000; received in revised form 18 December 2000; accepted 30 April 2001
Abstract
Volcanic eruptions can present unpredictable hazards to populations living within regions containing potentially active volcanoes and for
people traveling in jet aircraft that intersect with ash-laden eruption clouds. Methods of monitoring volcanic activity include searching for
variations in the thermal signal from active fumaroles, lava domes, lava lakes, flows, and other features. Over many active volcanoes in the
Western Hemisphere, low spatial resolution (4 km/pixel) weather satellite data acquired every 15 min are used to identify changes in eruptive
activity, but are of insufficient spatial resolution to map active volcanic features. The Enhanced Thematic Mapper Plus (ETM+) on Landsat 7
can be used to monitor active volcanoes at a higher spatial resolution (15- to 60-m pixels). ETM+ also offers improvements over its
predecessor, the Thematic Mapper of Landsats 4 and 5, by way of a 15-m panchromatic band and higher spatial resolution (60 m/pixel)
thermal infrared (IR) band. With higher spatial resolution panchromatic data, we are able to map lava flow fields, trace very high temperature
lava channels, and, at Lascar volcano, identify an arcuate feature associated with a collapsed crater floor, a phenomenon that may precede
explosive activity. With improved spatial resolution in the thermal IR, we are able to map the bifurcation and braiding of underground lava
tubes at Kilauea. Identifying tube locations and tracking their extension are important because, for a given volumetric lava production
(effusion) rate, tube-fed flows can extend a much greater distance than surface flows. At both Kilauea and Etna, we are able to use the thermal
data to estimate effusion rates, an important parameter for assessing how far a flow is likely to extend and therefore the hazard it poses. An
improved ETM+ data collection and distribution system includes a well-formulated and -executed Long-Term Acquisition Plan and less
expensive data that is available much faster than previously possible. D 2001 Elsevier Science Inc. All rights reserved.
Keywords: Volcano; Landsat 7; Enhanced Thematic Mapper Plus; Sensing
1. Introduction
Thermal infrared (IR) data provided by the Advanced
Very High Resolution Radiometer (AVHRR) were first
demonstrated to be useful for identifying steel mills and
other hot spots in 1981 (Matson & Dozier, 1981). Publica-
tion of the first high spatial resolution studies of the active
Lascar volcano in Chile followed 5 years later (Francis &
McAllister, 1986).
In terms of volcano studies, the important character-
istics of spatial resolution and satellite revisit frequency
are inextricably linked. This is largely due to the limi-
tations of data transfer rates from satellites to receiving
stations, the size of data recorders onboard satellites, and
the configuration of detectors which trade off between
larger swath widths and higher spatial resolution. These
technological limitations have resulted in remote sensing
data sources that can be divided into two groups. The first
group combines high spatial resolution ( < 120 m per
pixel) with low temporal resolution (minimum 8- to 16-
day revisit frequency). The second group combines low
spatial resolution ( > 1 km pixel) with high temporal
resolution (multiple passes per day). Analysis of both
types of data is extremely important for the future of
remote sensing of volcanoes. High temporal resolution
thermal IR data provided in near real time via Web sites
have been shown to be useful for tracking the progress of
eruptions in entire volcanic regions (e.g., Dean et al.,
1998; Harris et al., 2000a). However, higher spatial
resolution data sets are required to map the distribution
of active lava flows and are better for placing constraints
on the size and temperature of volcanic thermal anom-
alies, heat flux, lava production rates, and other quant-
itative parameters. Here, we focus attention on one of the
latest high spatial resolution remote sensing instruments
0034-4257/01/$ – see front matter D 2001 Elsevier Science Inc. All rights reserved.
PII: S0034 -4257 (01 )00258 -9
* Corresponding author. Tel.: +1-808-956-3154; fax: +1-808-956-
6322.
E-mail address: [email protected] (L.P. Flynn).
www.elsevier.com/locate/rse
Remote Sensing of Environment 78 (2001) 180–193

flown on the Landsat series of satellites: the Enhanced
Thematic Mapper Plus (ETM+).
The Landsat series of satellites is the longest performing
high spatial resolution system of instruments collecting
Earth remote sensing data. Landsat 1, launched in 1972,
was the first of a series of Landsat satellites that have been
collecting terrestrial data for over 27 years. Technological
advances have been incorporated into the Landsat series
since Landsat 1. The Landsat Multispectral Scanner (MSS)
was followed by the Thematic Mapper (TM) carried by
Landsats 4 and 5. In terms of volcano studies, the near-IR
TM bands 5 and 7 (30 m spatial resolution, Table 1) are very
sensitive to objects radiating at active and cooling lava
temperatures (120–1150�C). The Landsat TM instrument
also offered a high spatial resolution (120 m/pixel) thermal
IR channel (Band 6, Table 1) which can be used to map the
distribution of cooling lava flows or locate the surface
thermal expression of active underground lava tubes (e.g.,
Flynn et al., 1994; Harris et al., 1998). Cooler thermal
anomalies, such as active fumarole fields or crater lakes, can
also be detected and analyzed using data from this band
(e.g., Harris & Stevenson, 1997; Oppenheimer, 1993).
Further, Bonneville and Gouze (1992) have shown that,
once adiabatic cooling has been accounted for, the Landsat
thermal IR band may be used to locate subtle thermal
anomalies due to shallow intrusions.
The spatial and spectral capabilities of the TM have
allowed researchers to map the distribution of lava flows
and estimate the size of active phenomena with a much
higher degree of precision than with > 1km data sets (e.g.,
AVHRR and GOES). However, as with all high spatial
resolution sensors, Landsat data are limited for thermal
studies due to the satellite’s low target revisit frequency
(once every 16 days for daytime images). The presence of
clouds over the target volcano during Landsat acquisitions
frequently translates into a prolonged period between suc-
cessive useful images. In some instances in which the emitted
radiance is extremely high due to an extensive or particularly
hot thermal anomaly, detector saturation occurs. For Landsat
TM, radiant flux due to an anomaly in one pixel can then
contaminate adjacent along-track or even cross-track pixels
(Rothery et al., 1988). These situations may lead to an
overrepresentation of the size of the anomaly (Harris et al.,
1999a; Rothery et al., 1988). Most investigations during the
TM era demanded considerable resources as the cost of
scenes was quite high (US$1650/TM quarter scene). Despite
these shortcomings, the utility of the TM instrument is borne
out by the number of thermal investigations of lava flows
(Bhattacharya et al., 1993; Flynn et al., 1994; Harris et al.,
1998; Harris et al., 2001a; Harris et al., 2000b; Oppenheimer,
1991, 1998; Pieri et al., 1990; Wright et al., 2000), lava lakes
(Harris, et al., 1999a; Harris et al., 1999b; Oppenheimer &
Francis, 1997; Rothery et al., 1988), volcanic domes
(Abrams et al., 1991; Andres & Rose, 1995; Francis &
Rothery, 1987; Glaze et al., 1989; Harris et al., 2001b;
Oppenheimer et al., 1993a; Rothery et al., 1988), fumarole
fields (Harris & Stevenson, 1997; Oppenheimer & Rothery,
1991; Oppenheimer et al., 1993b), Strombolian vents (Goa-
nac’h et al., 1994; Harris & Stevenson, 1997), and warm
crater lakes (Oppenheimer, 1993, 1996, 1997).
Following the launch of Landsats 4 and 5, there was an
8-year hiatus before the unsuccessful attempt to launch
Landsat 6 in October 1993. Landsat 7, successfully launched
in April 1999, carries the ETM+ featuring a new 15-m spatial
Table 1
Summary of Landsat TM sensor parameters
Band Center wavelength (mm) Wavelength range (mm) Pixel size (m) Minimum temperature (�C) Maximum temperature (�C)
Landsats 4 and 5 TM
1 0.485 0.45–0.52 30� 30 1050 1490
2 0.560 0.52–0.60 30� 30 960 1410
3 0.660 0.63–0.69 30� 30 810 1170
4 0.830 0.76–0.90 30� 30 620 1000
5 1.650 1.55–1.75 30� 30 220 430
6 11.420 10.42–12.42 120� 120 � 60 90
7 2.215 2.08–2.35 30� 30 120 290
Landsat 7 ETM+
1 0.482 0.450–0.515 30� 30 1051 (1075) 1483 (1526)
2 0.565 0.525–0.605 30� 30 900 (922) 1301 (1340)
3 0.660 0.630–0.690 30� 30 755 (775) 1119 (1156)
4 0.825 0.750–0.900 30� 30 595 (613) 926 (961)
5 1.650 1.55–1.75 30� 30 206 (217) 417 (440)
6 11.450 10.40–12.50 60� 60 � 33 (� 134) 51 (77)
7 2.220 2.09–2.35 30� 30 92 (101) 258 (276)
8 0.710 0.520–0.900 15� 15 702 (721) 1056 (1092)
Band refers to individual TM channels having a center wavelength in the second column and a wavelength range (full-width half maximum) given in the third
column. Pixel size is the nominal ground area represented of each image element. Minimum temperature is the lowest pixel-integrated temperature which can
be detected by the particular sensor.Maximum temperature is the highest pixel-integrated temperature which can be detected without achieving saturation of the
instrument detector (for TM from Flynn et al., 1994; Harris et al., 1998; Horton, 1995). For ETM+, high-gain (low gain) temperatures are listed.
L.P. Flynn et al. / Remote Sensing of Environment 78 (2001) 180–193 181

resolution panchromatic band and an improved 60-m spatial
resolution thermal IR band (Table 1). In this paper, we
describe our preliminary findings using ETM+ data to study
a number of active volcanoes. In doing this, we consider the
implications of our results in terms of both volcanology and
the performance of the instrument over high temperature
targets. We then discuss possible modifications for a follow-
on Landsat 8 instrument.
2. Landsat 7 ETM+: improvements over TM
With respect to the identification of volcanic hazards,
Landsat 7 ETM+ offers two important improvements over
Landsats 4 and 5 TM. The 15 m/pixel panchromatic band,
originally scheduled to be introduced on the Landsat 6
Enhanced Thematic Mapper (ETM), offers very high res-
olution mapping capability for volcanic features. The higher
spatial resolution thermal IR band (Table 1) allows for
spatially more accurate thermal mapping of recent flow
activity, plus improved estimation of surface heat fluxes.
Here we illustrate the utility of these improvements for the
study of active volcanoes.
2.1. Panchromatic band
The Landsat 7 ETM+ panchromatic band (Band 8) covers
the visible green to near-IR portion of the electromagnetic
spectrum (Table 1). The 15-m spatial resolution of this band
can be used for more spatially detailed mapping of lava flow
features than was possible using TM data. The capabilities of
this band are demonstrated by Fig. 1. Fig. 1a is an image of
Kilauea volcano on the island of Hawaii collected on
February 14, 2000 showing the active lava flow field. Active
lava flows appear slightly brighter in the panchromatic image
(Fig. 1b) because a glassy surface coating forms as a result of
molten lava rapidly cooling and solidifying upon exposure to
the atmosphere. The surface glass is responsible for
increased reflection of solar radiance in the panchromatic
band. Surrounding, older flows appear darker because the
glassy coating has been weathered or spalled off (Fig. 1b).
Most visible and near-IR satellite detectors are designed
with regard to the amount of reflected solar radiation that
they will encounter. The wide bandwidth of the panchro-
matic band stretches into the near-IR, which also makes it
sensitive to pixels having high fractional areas radiating at
molten lava temperatures. Fig. 1c shows a section of a
panchromatic image collected of Mt. Etna, Sicily, on Octo-
ber 28, 1999. As reported in Wright et al. (2000), the
panchromatic band can be used to map the position of a
high-temperature lava channel by virtue of its emitted
thermal radiance at these wavelengths. Molten lava flowing
in the channel results in a linear feature of anomalously
radiant pixels (Fig. 1c). The anomalous feature is at most
30 m wide and about 270 m long. Background reflected
radiance from nonanomalous, surrounding pixels is about
18 DN, while that of the channel is about 20–48 DN. At
first, we considered that the Band 8 response could be due
sunlight-reflected from condensed gas emitted by this highly
active flow. The feature, however, exactly follows the center
of the active flow channel and is not apparent in Bands 1–3,
as would be expected if the anomaly was due to enhanced
reflection from a gas plume. It also extends at 90� to the
southerly wind direction as indicated by the direction of the
gas plume emitted by the adjacent summit craters (Fig. 1c).
Flynn and Mouginis-Mark (1994) used spectral mixing
models to show that lava channels in close proximity to a
source vent can exhibit extremely high (900–1150�C)temperatures. As indicated in Wright et al. (2000), the
panchromatic band is sensitive to these high temperatures
which, due to the shape of Planck radiation distribution at
these wavelengths, would have a greater effect at the longer
wavelengths of the waveband (i.e., near 0.90 mm). Pre-
launch spectral response functions for Band 8 show that the
detector is as much as 40% more sensitive to electromag-
netic radiation toward the IR portion of the waveband than
at the visible end of the waveband (http://eosims.cr.usgs.
gov:5725/GRAPHICS/landsat7/ls7ng_spect_resp_b8.html).
The region of the image where Band 8 is anomalous is also
a region of anomalous Band 4 radiance and a location of
Bands 5 and 7 saturation (i.e., at-satellite radiance is higher
than the detector limit). Thus, Band 8 can be used to
delineate very high temperature lava flow features that
would saturate near-IR Bands 5 and 7.
The panchromatic band can also be used to map lava
dome features that would have gone previously unob-
served due to the poorer spatial resolution of the other
bands. Harris et al. (2001b) report the presence of an
arcuate feature in Band 8 data for Lascar volcano, Chile
(Fig. 1d). The feature could be due to high reflectance
from gas emitted by, and sulfurous precipitates around,
active fumaroles aligned along an arcuate fracture within
one of the summit craters. Following the model of
Matthews et al. (1997), activity at Lascar between 1984
and 1996 was characterized by cyclic extrusion and
subsidence of a lava dome. Within this model, pressure
build-up during the subsidence phase culminates in a
major explosive eruption that terminates the cycle. The
feature identified in the ETM+ Band 8 scene is no doubt
related to crater floor subsidence during one of these
cycles, either being a relict feature from a previous cycle
or a feature associated with collapse during a new phase
(Harris et al., 2001b). As we explain later, the ETM+ data
indicate that Lascar is either currently in a run-up to a
new, cycle-terminating explosive event, or has entered a
new phase of activity characterized by persistent, low-
level degassing.
2.2. Band 6
The ETM+ instrument boasts of a new 60-m thermal IR
band; yet, ironically, the decision to exclude a thermal IR
L.P. Flynn et al. / Remote Sensing of Environment 78 (2001) 180–193182

band from future Landsat missions has already been con-
sidered. Flynn et al. (1994) showed how variations in the
thermal radiance from TM Band 6 data could be used to
identify buried, but active, lava tubes (Fig. 2a). In the 120-m
TM pixels, the background pixels have a radiance of 160
DN while the active tube pixels have DNs ranging from 166
to 170 in areas above surface flows. Variations in thermal
radiance that is emitted from the surface above the tubes
have also been found to be consistent with the volume of
lava being carried within the tubes (Flynn et al., 1994).
Harris et al. (1998) used these data in a thermal model,
which allowed the volumetric flux of lava, or effusion rate,
to be constrained.
Fig. 2b shows for comparison a contrast-stretched ETM+
Band 6 image collected during an overpass on February 14,
2000, which highlights active lava flows and the lava-
bearing tubes. As in the 1991 case, the ETM+ data indicate
that the lava tube bifurcates � 2 km from the ocean, and
roughly coincident with a marked break in slope. We also
note that, with the higher spatial resolution thermal data, the
‘‘braided’’ pattern of underground lava tubes becomes
apparent. These braided features were studied in greater
detail by Horton (1995) with an airborne 3–5 mm data
collection system (SMIFTS, Spatially Modulated Infrared
Fourier Transform Spectrometer). The ETM+ background
for nonanomalous pixels in band 61 (the low gain version of
Band 6) is 150–154 DN, and again lava flows emerging
from breakouts occur between the upper and lower sections
of the lava tube. Again the upslope tubes have higher DNs
(166–174) than the lower sections (162–167).
Fig. 1. Landsat ETM+ panchromatic Band 8 images. (a and b) Data acquired on February 14, 2000 for the active lava flow field at Kilauea, Hawaii (Path 62
Row 47). Edges of fresh lava flows are highlighted in (b). (c) An image acquired on October 28, 1999 of an active lava channel at Mt. Etna, Sicily (Path 188
Row 34). The inset shows that the active channel was anomalously radiant for 270 m of its length. (d) Highlights a concentric ring fracture within the active
crater of Lascar volcano, Chile (Path 233 Row 87), on a May 1999 image.
L.P. Flynn et al. / Remote Sensing of Environment 78 (2001) 180–193 183
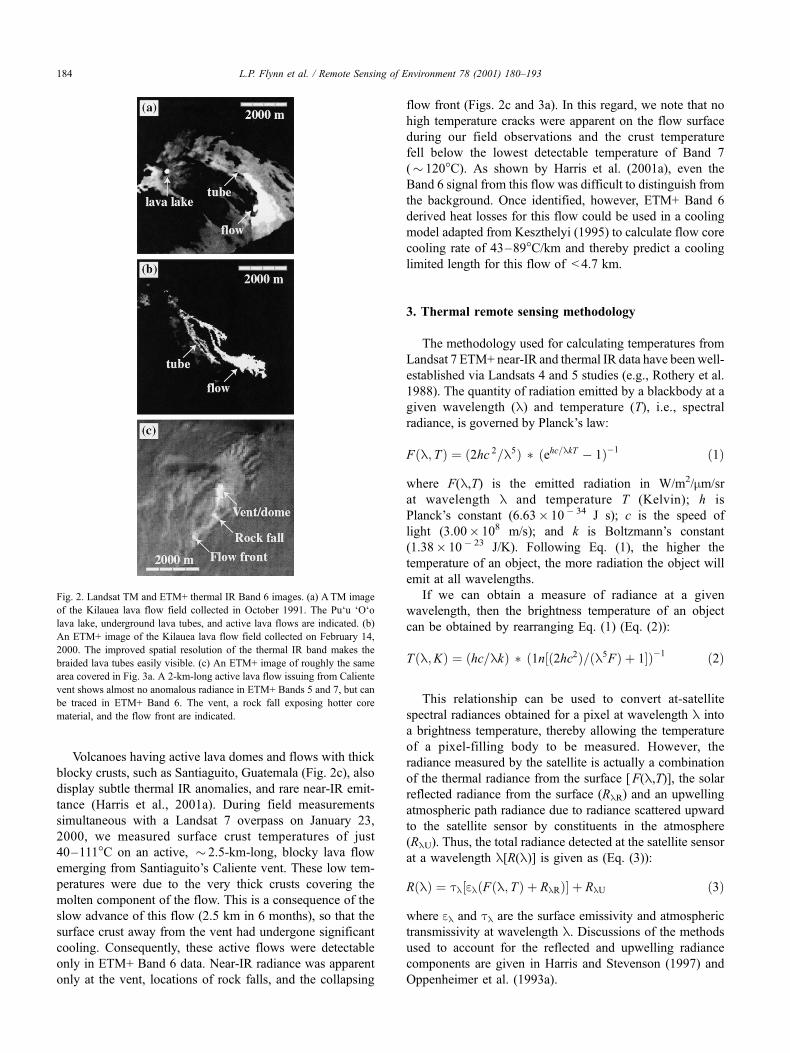
Volcanoes having active lava domes and flows with thick
blocky crusts, such as Santiaguito, Guatemala (Fig. 2c), also
display subtle thermal IR anomalies, and rare near-IR emit-
tance (Harris et al., 2001a). During field measurements
simultaneous with a Landsat 7 overpass on January 23,
2000, we measured surface crust temperatures of just
40–111�C on an active, � 2.5-km-long, blocky lava flow
emerging from Santiaguito’s Caliente vent. These low tem-
peratures were due to the very thick crusts covering the
molten component of the flow. This is a consequence of the
slow advance of this flow (2.5 km in 6 months), so that the
surface crust away from the vent had undergone significant
cooling. Consequently, these active flows were detectable
only in ETM+ Band 6 data. Near-IR radiance was apparent
only at the vent, locations of rock falls, and the collapsing
flow front (Figs. 2c and 3a). In this regard, we note that no
high temperature cracks were apparent on the flow surface
during our field observations and the crust temperature
fell below the lowest detectable temperature of Band 7
(� 120�C). As shown by Harris et al. (2001a), even the
Band 6 signal from this flow was difficult to distinguish from
the background. Once identified, however, ETM+ Band 6
derived heat losses for this flow could be used in a cooling
model adapted from Keszthelyi (1995) to calculate flow core
cooling rate of 43–89�C/km and thereby predict a cooling
limited length for this flow of < 4.7 km.
3. Thermal remote sensing methodology
The methodology used for calculating temperatures from
Landsat 7 ETM+ near-IR and thermal IR data have been well-
established via Landsats 4 and 5 studies (e.g., Rothery et al.
1988). The quantity of radiation emitted by a blackbody at a
given wavelength (l) and temperature (T), i.e., spectral
radiance, is governed by Planck’s law:
Fðl; TÞ ¼ ð2hc 2=l5Þ � ðehc=lkT � 1Þ�1 ð1Þ
where F(l,T) is the emitted radiation in W/m2/mm/sr
at wavelength l and temperature T (Kelvin); h is
Planck’s constant (6.63� 10� 34 J s); c is the speed of
light (3.00� 108 m/s); and k is Boltzmann’s constant
(1.38� 10� 23 J/K). Following Eq. (1), the higher the
temperature of an object, the more radiation the object will
emit at all wavelengths.
If we can obtain a measure of radiance at a given
wavelength, then the brightness temperature of an object
can be obtained by rearranging Eq. (1) (Eq. (2)):
Tðl;KÞ ¼ ðhc=lkÞ � ð1n½ð2hc2Þ=ðl5FÞ þ 1Þ�1 ð2Þ
This relationship can be used to convert at-satellite
spectral radiances obtained for a pixel at wavelength l into
a brightness temperature, thereby allowing the temperature
of a pixel-filling body to be measured. However, the
radiance measured by the satellite is actually a combination
of the thermal radiance from the surface [F(l,T)], the solarreflected radiance from the surface (RlR) and an upwelling
atmospheric path radiance due to radiance scattered upward
to the satellite sensor by constituents in the atmosphere
(RlU). Thus, the total radiance detected at the satellite sensor
at a wavelength l[R(l)] is given as (Eq. (3)):
RðlÞ ¼ tl½elðFðl; TÞ þ RlRÞ þ RlU ð3Þ
where el and tl are the surface emissivity and atmospheric
transmissivity at wavelength l. Discussions of the methods
used to account for the reflected and upwelling radiance
components are given in Harris and Stevenson (1997) and
Oppenheimer et al. (1993a).
Fig. 2. Landsat TM and ETM+ thermal IR Band 6 images. (a) ATM image
of the Kilauea lava flow field collected in October 1991. The Pu‘u ‘O‘o
lava lake, underground lava tubes, and active lava flows are indicated. (b)
An ETM+ image of the Kilauea lava flow field collected on February 14,
2000. The improved spatial resolution of the thermal IR band makes the
braided lava tubes easily visible. (c) An ETM+ image of roughly the same
area covered in Fig. 3a. A 2-km-long active lava flow issuing from Caliente
vent shows almost no anomalous radiance in ETM+ Bands 5 and 7, but can
be traced in ETM+ Band 6. The vent, a rock fall exposing hotter core
material, and the flow front are indicated.
L.P. Flynn et al. / Remote Sensing of Environment 78 (2001) 180–193184

A further complication is that volcanic anomalies rarely
fill an entire 30-m near-IR TM pixel with a single source
of emittance at a specific temperature. In the simplest case,
the pixel will contain two thermal components, one hot
component at a temperature Th, usually representing
freshly exposed lava, and a cooler component (Tc), which
usually represents the chilled crust on a lava flow or lake
surface. As discussed by Rothery et al. (1988), a pixel
having two or more thermal components will have differ-
ent pixel-integrated brightness temperatures at different
wavelengths because emitted radiation varies with temper-
ature as well as wavelength (Eq. (1)). If a pixel is entirely
filled with a crusted flow at 250�C, then the pixel-
integrated temperatures in Bands 5, 6, and 7 will be
Fig. 3. Landsat 7 ETM+ RGB Bands 7, 5, and 3 color composites. North is on top of the images. (a) Data acquired of Santa Maria volcano, Guatemala (Path 20
Row 50) on January 23, 2000. The inset box shows an enlargement of the currently active Caliente vent of the Santiaguito dome. (b) Represents the currently
active lava flow field on the East Rift Zone of Kilauea Volcano, Hawaii (Path 62 Row 47). The image was acquired on February 14, 2000. Active lava flows
appear red and yellow in the inset box and can be compared with the area covered in Fig. 1b. (c) A partly cloudy July 31, 1999 image of an eruption from the
Southeast Crater of Mt. Etna volcano, Sicily (Path 189, Row 34). Etna’s main summit craters are designated as follows: ‘‘NEC’’ is the Northeast Crater; ‘‘LA’’
is La Voragine; ‘‘BN’’ is the Bocca Nuova, and ‘‘SEC’’ is the Southeast Crater. (d) Shows the summit area of Lascar volcano, Chile (Path 233 Row 87). The
inset box shows the small hot spot within one of the summit craters.
L.P. Flynn et al. / Remote Sensing of Environment 78 (2001) 180–193 185
250�C. However, if the flow is broken by cracks, which
expose the molten core at 1000�C and these cracks
covered 10% of the flow (and pixel), then the differing
sensitivities of the detectors of these three bands would
result in pixel-integrated temperatures of 680�C, 340�C,and 600�C in the three bands, respectively.
Dozier (1981) and Matson and Dozier (1981) docu-
mented this principle and used these differences to determine
the sub-pixel distribution of radiative areas. This was first
applied to Landsat data of volcanic targets by Rothery et al.
(1988) who termed it ‘‘the dual-band method’’. The dual-
band method involves solving simultaneous equations:
Rðl1Þ ¼ e1t1ðAhFðl1; ThÞ þ ð1� AhÞFðl1; TcÞÞ
þ ½t1R1R þ R1U ð4Þ
Rðl2Þ ¼ e2t2ðAhFðl2; ThÞ þ ð1� AhÞFðl2; TcÞÞ
þ ½t2R2R þ R2U ð5Þ
where R(l1) and R(l2) are the measured, at-satellite spectral
radiances of the TM pixel containing two thermal
components, in two Bands 1 and 2, and Ah is the fractional
area of the pixel that is radiating at temperature Th. These
simultaneous equations are usually solved by assuming a
value for one of the unknowns Ah, Th, or Tc in order to
obtain the values for the remaining unknowns.
Eqs. (4) and (5) take into account the effects of surface
reflection, emissivity, and atmospheric contamination of
the signal. Including emissivities acknowledges that very
few terrestrial surfaces act as true blackbodies. Instead,
they act as gray bodies, where only a percentage of the
radiance incident on them is re-emitted. This percentage,
which is represented by the emissivity term, can be
derived from spectral reflectance (Rl) measurements and
Kirchoff’s Law (el = 1�Rl). Generally, spectral reflec-
tance measurements of typical volcanic surfaces have
been used to obtain Rl, and thus el, where it is assumed,
although never proved, that emissivity is not temperature-
dependent. This may be a poor assumption given that the
surface changes state (from solid to molten) as the
temperature increases. Emissivity also varies as a function
of wavelength; however, we have found emissivity meas-
urements for TM Bands 5 and 7 to be similar. Our
reflectance measurements of fresh Kilauean basaltic
pahoehoe surfaces yield el of 0.995 for Bands 5 and 7
and 0.88 for Band 6. Emissivity will also vary depending
on surface type. Our laboratory measurements of Kilauea
basalt samples have shown that el for Bands 5 and 7 is
lower (0.95–0.96) for weathered and eroded surfaces.
Measurements of fresh basaltic scoria and Etnean ‘a‘a
have yielded Bands 5 and 7 emissivities of 0.93 and 0.94,
respectively (e.g., Harris & Stevenson, 1997). Appropriate
emissivity values must therefore be used for the wave-
length and surface type.
The atmosphere will absorb, re-emit, and scatter some of
the thermal radiance and some of the solar radiance reflected
from the surface to the satellite instrument. Although the
TM bands are located in atmospheric windows where
absorption of the signal is minimal, some absorption still
occurs. This is accounted for by the transmissivity term (tl).Typically, this has been calculated using LOWTRAN
(Kneizys et al., 1988) or MODTRAN (ONTAR, 1991)
atmospheric models. Although transmissivity is similar in
Bands 5 and 7, it is strongly height-dependent: the higher
the target, the less atmosphere there is to contaminate the
emitted radiance. Therefore, tl must be set according to
altitude. For example, the Nyiragongo lava lake at an
altitude of 3465 m will require a Bands 5 and 7 trans-
missivity correction of � 0.97; whereas, the Erta ’Ale lava
lake at an altitude of 613 m will require a tl of � 0.93.
Transmissivity in Band 6 will be different again, requiring
0.95 and 0.88 for the above two examples, respectively.
Band 6 is also sensitive to thermal radiance emitted by the
atmosphere, which can account for 6–16% of the at-satellite
radiance in ETM+ Band 6 (Harris & Stevenson, 1997). This
quantity must be estimated and removed from the Band 6
pixel-integrated radiance before use in Eqs. (4) and (5).
Atmospheric corrections must therefore be set depending on
altitude and wavelength; however, we recognize that cor-
rection values may be in error due to the currently uncon-
strained effect of volcanic fumes. Lower transmissivities
than those given by applying standard atmospheric models
may result from introducing volcanogenic gases into the
path length. Although this potential error has long been
recognized, a more rigorous treatment of the atmospheric
problem is still needed.
4. Preliminary studies of three volcanoes with
Landsat ETM+
We have already qualitatively shown how the technolo-
gical advances of Landsat 7 have resulted in improved
observations of volcanoes. In this section, we provide three
case studies to show how ETM+ data may further contribute
to the study of volcanology and to assess the instrument
performance over volcanic thermal anomalies.
4.1. Kilauea volcano
Kilauea volcano, located on the Big Island of Hawaii, has
been continuously active since January 1983. Kilauea cal-
dera forms the hub of two rift zones extending southwest
and east from the summit area. Most eruptions occur within
the caldera or along the Rift Zones. Pu’u ’O’o vent, about
18 km from the summit caldera on the East Rift Zone
(Fig. 3b), has been the center of activity throughout this
period. Magma travels down the rift zone from the summit
chamber to Pu’u ’O’o, where the lava partially degasses.
Degassing at the active vent is evident by the plume of
L.P. Flynn et al. / Remote Sensing of Environment 78 (2001) 180–193186
aerosols, which typically extends south or southwest in the
prevailing trade winds (Fig. 3b). The ongoing eruption at
Pu’u ’O’o has been characterized by a wide variety of
activity including lava fountains, lava lakes, surface flows,
and lava tubes. Tubes have extended over 10 km from the
source vents to the ocean (Fig. 2b).
We monitor a number of volcanically active areas in the
Western Hemisphere, including Kilauea, with 15-min tem-
poral resolution Geostationary Operational Environmental
Satellite (GOES) data. Hot spot information is provided in
near real time via a Web site (http://hotspot.higp.hawaii.
edu/goes/) and an automated e-mail hot spot event notifica-
tion system (Harris et al., 2000a; Harris et al., 2001c).
GOES images, acquired for the island of Hawaii at 4–5
km/pixel spatial resolution, provide the high temporal
resolution imagery necessary to detect and respond to the
onset of events, to track rapidly evolving or short-lived
changes in eruptive activity, to build event chronologies
(Harris et al., 1997) and to provide observations during gaps
in cloud cover.
The higher spatial resolution of ETM+ provides less
frequent, but spatially detailed, information regarding the
surface distribution of active lava flows and the location of
shallow, sub-surface lava tubes (Fig. 3b). Unvegetated lava
flows appear black and brown in the image, whereas
vegetated areas appear green. Active flows are indicated
by red and yellow colors, a result of thermal emittance in
Bands 7 or Bands 5 and 7, respectively. A series of bright
red and yellow spots marks the locations of skylights above
lava-filled tubes that follow the tree line down the slope of
the volcano in the center of the image. The distribution of
surface flows can be mapped using the image detail dis-
played in the enlarged inset. This image shows that the lava
is transported to the coastal flats by two separate tubes that
bifurcate from one main tube at higher elevations. One of
the tubes feeds a lava flow field that is almost 2 km long and
3 km wide.
Using the thermal model described in Harris et al.
(1998), we are able to calculate the effusion rate. The
complex calculation takes into account the heat lost from
skylights, underground lava tubes, surface lava flows, and
shallow sub-marine flows. Meteorological effects, such as
wind and rain, are also factored into the model. For this
particular image, which displays abundant surface flow
activity, we obtain an ETM+-derived effusion rate of
2.6 ± 1.2 m3/s, which compares with rates of 1.8 ± 0.6 and
0.8 ± 0.3 m3/s derived from July 1991 and October 1991
TM scenes, respectively. The consistency of these results
agrees with observations that the total amount of effused
lava has stayed generally low and relatively constant (with
the exception of brief pauses) for the last 9 years (e.g.,
Heliker et al., 1998). In this regard, although we note a
decline in effusion rates during 1991 from 2.9 m3/s in April
to 0.6 m3/s in November (Kauahikaua et al., 1996), effusion
rates before and after 1991 have typically been 2.9–3.5 m3/s
(Heliker et al., 1998). The synoptic perspective of the
ETM+ instrument allows us to calculate effusion rates for
Kilauea for every clear image acquired. Monitoring changes
in these rates, supplemented with temporally frequent
GOES satellite data, will help us to assess the relative vigor
of the eruption.
4.2. Mt. Etna, Sicily
Fig. 3c shows a color composite of Bands 7 (red), 5
(green), and 3 (blue) of Landsat 7 ETM+ data acquired for
Mt. Etna, Sicily, on July 31, 1999. Using this band
combination, clouds that formed in the Valle del Bove
appear green and yellow, while previously erupted lava
flows appear black and brown. Hot spots due to active
lava flows appear yellow, red, and green. In this image,
we note the presence of an intense hot spot in Etna’s
northeast summit crater. Reports from a field visit by
Boris Behncke on July 28, 1999 describe a dense gas
plume, which made it impossible to recognize a hot spot
visually, but near-continuous detonations were heard
(GVN, 1999a). We can also recognize smaller less intense
hot spots at the other three summit craters (La Voragine,
Bocca Nuova, and South East Crater). Three days before
this image acquisition, both La Voragine and Bocca Nuova
were observed to be active with Strombolian and explos-
ive ash eruptions, respectively (GVN, 1999a). Hot spots
caused by two lava flows issuing from the South East
crater, and which were part of an eruption which began on
February 4, 1999 from a fissure at the crater base (GVN,
1999b), are also obvious in the lower center of the image.
Near-IR data indicate that the northeast-extending and
southeast-extending flows are � 480 and � 570 m long,
respectively. Band 6 thermal data show that the area
covered by cooling lava is approximately the same size
as that covered by active flows, meaning that recent flows
have remained within the currently active area to contrib-
ute to a thickening flow field. If there had been flows
erupted beyond the area of the observed flow during the
previous week, then they would still be emitting detectable
radiance in the thermal IR. Following the methodology of
Harris et al. (1998), we calculate an effusion rate for these
flows of 0.30–0.43 m3/s.
This is in marked contrast to a second image (Fig. 4a)
acquired during a brief episode of crater breach- and
overflow-fed flows on October 28, 1999. This event was
part of a series of effusive events fed by the Bocca Nuova
crater during October and November 1999 (GVN, 1999c).
This image is considered in detail by Wright et al. (2000)
and shows an intense (saturated) 1100� 290–330 m near-
IR anomaly overlying a � 5000� 145–165 m lower mag-
nitude anomaly. This cooler anomaly results from flows that
were inactive and cooling, but which must have been
emplaced hours before the overpass to account for their
relatively lower near-IR signal.
Within the Fig. 4a, 11 pixels are saturated in Bands 5
and 7, 111 in Band 7 only and 22 have malfunctioned.
L.P. Flynn et al. / Remote Sensing of Environment 78 (2001) 180–193 187

This compares with just two saturated Band 5 pixels on
the July image. This indicates that the October 1999 flow
was larger and hotter than the July 1999 flow and that
higher crust temperatures and greater areas of exposed
high temperature material at cracks forced an increased
area of saturation. The October flow yields effusion rates
(34–40 m3/s) that are two orders of magnitude above
those of the July flow.
Clearly, Mt. Etna experiences a great range of effusion
rates. Harris et al. (2000b) have used AVHRR, TM, ETM+
and ground measurement derived effusion rates to define
two typical styles of eruption at Etna, Krafla (Iceland),
Stromboli (Italy), and Kilauea volcanoes. These are pres-
surized chamber drainage-fed eruptions, characterized by
initially high effusion rates which decline with time, and
persistent eruption of the steady magma supply to the
volcano’s shallow system, which results in lower but steady
effusion rates. Following Harris et al. (2000b) the effusion
rates calculated for the July image, in combination with
ground and other satellite-based effusion rates obtained over
the duration of the eruption, show that these rates are
consistent with the waning phase of a chamber emptying
event. We note, however, that high effusion rates during the
October–November 1999 events may have resulted from
drainage of ponded lava held within the Bocca Nuova crater
following breaching of the crater walls.
4.3. Lascar volcano, Chile
Thus far, we have concentrated on volcanoes exhibiting
active basaltic and basalt–andesitic lava flows. Another
type of volcanic eruption involves the formation of lava
domes, a style of activity associated with explosive erup-
tions that generate ash clouds and devastating pyroclastic
flows. Cyclic activity involving dome extrusion, subsid-
ence, and explosive activity has been observed within one
of Lascar volcano’s active summit craters at least four
times since 1984 (Matthews et al., 1997). Due to its
remoteness, activity, and cloud-free conditions, this site
has been the subject of frequent investigation using ther-
mal remote sensing. Detection of thermal radiance from
Lascar was first reported by Francis and McAllister (1986)
using TM images collected in March and July 1985. Bands
5 and 7 pixel-integrated dome temperatures were derived
by Francis and Rothery (1987), and dual-band estimates of
the sub-pixel temperature characteristics were described in
Rothery et al. (1988). Subsequently, cyclic variations in
radiance, where decreases in radiance were followed by
explosive events, were observed by Oppenheimer et al.
(1993a) and Oppenheimer et al. (1993b) using TM data
and extended by Wooster and Rothery (1997) using Along
Track Scanning Radiometer data. These variations can be
tied to the dome extrusion–subsidence–explosion cycle of
Matthews et al. (1997).
Up to 44 GOES images per day are available for Lascar.
Between 1998 and 1999, a persistent, low-magnitude (0.3–
3.0�C) thermal anomaly was evident in GOES Band 2
(3.78–4.03 mm) data for Lascar. As described by Harris
et al. (2001b), GOES Band 2 radiances corrected for diurnal
and seasonal effects showed an increase between June and
November 1998, followed by a decline to low, stable levels
by April 1999.
An ETM+ image of Lascar, acquired on May 16, 1999,
can be used to confirm the low level of activity indicated by
the analysis of GOES data. On the ETM+ image, a small,
low-intensity hot spot was evident within Lascar’s central
summit crater (Fig. 3d). Thermal emission from high-
temperature features was sufficient to cause a thermal
Fig. 4. Landsats 5 and 7 comparison of Bands 5 and 7 malfunctioning over
highly radiant targets. Both images are approximately 10 km across with
north being on top of the image. (a) A Landsat 7 ETM+ 7, 5, and 4 false
color composite of summit region of Mt. Etna , Sicily, during the October
1999 eruption. Yellow areas mark regions where Bands 5 and 7 are
saturated or are nearly saturated. Green areas mark hotter areas where Band
7 malfunctions and reports a DN of 0 or 1 for a pixel. Black areas denote
the hottest pixels where both Bands 5 and 7 malfunction and report a DN of
0 or 1. ETM+ detector malfunction does not corrupt radiant fluxes of pixels
downscan. (b) From Rothery et al. (1992): a Landsat 5 TM Bands 7, 5, and
4 false color composite of the summit region of Mt. Etna, Sicily, during the
1991–1993 eruption. Saturated lines of pixels, which are the result of
detector saturation over highly radiant targets, obscure radiant fluxes of
downscan pixels.
L.P. Flynn et al. / Remote Sensing of Environment 78 (2001) 180–193188

anomaly occupying seven 60-m Band 6 pixels and sixteen
30-m Band 7 pixels. However, it was not sufficiently intense
to emit at shorter wavelengths, so there is no emission in
Band 5. Application of the a multi-band pixel thermal
mixture model (Harris et al., 1999a), in which a solution
is obtained by first integrating radiance from Band 7 pixels
within the larger Band 6 pixel and then applying Eqs. (4)
and (5), indicated that fumarolic activity at a temperature of
224–543�C was the most likely cause of this anomaly
(Harris et al., 2001b).
These GOES and ETM+ observations could be accom-
modated within the model of Matthews et al. (1997) where
injection of new magma would cause increased fumarolic
activity and hence higher GOES radiances. Subsequent
magma defs-vesiculation would result in crater floor sub-
sidence, fumarole conduit closure, and gas emission
decreases, and hence radiance decline to the levels observed
in post-April GOES and ETM+ data. This may have
contributed to the concentric crater floor fractures observed
in the ETM+ Band 8 data. Such activity cycles typified
activity at Lascar between 1984 and 1996, and in each case,
the phase of subsidence and reduced radiance culminated in
explosive activity. Alternatively, the anomaly’s low mag-
nitude may imply that activity has departed from such a
cyclic style and entered a quieter phase of persistent
degassing (Harris et al., 2001b).
5. Discussion of band saturation effects
It is worthwhile drawing attention to several of the
differences that exist between data acquired by ETM+ and
its predecessor TM. Fig. 4a and b show data acquired by
ETM+ and TM for two different eruptions on Mt. Etna. TM
data acquired during the 1991–1993 Etna eruption (Fig. 4b)
show long lines of yellow and red pixels trailing off the edge
of the active flow-field. These represent a downscan line of
saturated pixel values caused by overloading of the near-IR
detectors by the highly radiant flow surface. This phenom-
enon has been observed by the authors over all kinds of
high-temperature volcanic targets in much of the TM data
we have examined (see also Rothery et al., 1992). Although,
at the pixel scale, the radiant properties of the 1999 flow
field are likely to be identical to those of the 1991–1993
flow field, such features do not appear in the new ETM+
data (Fig. 4a). We also note that those ETM+ images of lava
flows on Kilauea that we have analyzed so far are free from
such saturated lines. If this detector overload problem has
indeed been resolved on ETM+, this is a welcome improve-
ment as detector saturation lines can cause important
information regarding the temperature of less radiant surfa-
ces to be lost.
From what we have observed in the October 1999 ETM+
image of an active lava channel and associated flows at Mt.
Etna (Fig. 4a), the near-IR ETM+ detectors seem to mal-
function in a consistent manner with progressively higher
temperatures. We would expect Band 7 to saturate at lower
pixel-integrated temperatures than Band 5 (Table 1). With
respect to Fig. 4a, the yellow area forms a halo of saturated
(DN= 255) or nearly saturated Bands 7 and 5 pixels around
the much hotter anomaly. The green area interior to the
yellow marks a zone of higher temperatures that is closer to
the center of the lava channel, where ETM+ Band 7
malfunctions and returns a DN of 0 or 1, while the radiance
in Band 5 remains at or near saturation. The green result is
consistent with the absence of a red component (Band 7) in
the RGB image and a significantly lower blue component
(Band 4). Finally, Band 5 also malfunctions (DN= 0 or 1)
over the active lava channel, resulting in a black color in the
absence of red (Band 7) and green (Band 5) components to
the image and a relatively low, but still anomalous, radiance
recorded in the blue (Band 4) component. Only after more
data have been acquired over active lava features will it
become apparent as to whether the gradational sensor
malfunction with increasing radiance we observe in this
example is a characteristic feature of ETM+. If so, then
although the data may provide no quantitative information
regarding lava flow temperature, they may provide previ-
ously unattainable insights into flow surface structure and
open channel distributions.
Fig. 5 shows the thermally emitted radiance from flow
surfaces detected in ETM+’s thermal IR Band 6 (Table 1). In
high-gain mode, the sensor measures up to a maximum of
� 13 W m� 2/sr/mm, while when in low-gain mode, this
increases to � 17 W m� 2/sr/mm. The high-gain data reveal
little regarding the radiance structure of the lava flow we
analyze here due to the comparative ease with which it
saturates. The low-gain data, on the other hand, provide
much more information regarding the thermal state of the
flow. We note, however, that while low-gain ETM+ Band 6
data are an improvement above high-gain ETM+ Band 6
data, other than in respect to the smaller ETM+ pixel size,
they are less suitable for the purposes of high-temperature
studies than the nominal-gain data provided by TM Band 6.
Although ETM+ Band 6 data have a larger dynamic range
than TM Band 6, the maximum temperature to which ETM+
Band 6 is sensitive, whether in high or low gain (� 51�Cand 77�C, respectively), is lower than that to which TM
Band 6 operated (� 90�C, Table 1).
6. Future design considerations
In terms of the study of active volcanic features, we
propose three design considerations for future Landsat
missions.
6.1. Increased dynamic range
A future Landsat sensor must have an improved sens-
itivity and dynamic range to handle higher spectral radian-
ces over active lava flows without saturating. Although
L.P. Flynn et al. / Remote Sensing of Environment 78 (2001) 180–193 189

launched in 1999, Landsat 7 still suffers from a rather
antiquated 8-bit dynamic range that greatly limits the
precision of individual measurements. A 12-bit system
would offer 4096 discreet radiance steps rather than the
current 256. Even if only half of that increased dynamic
range was used to extend the overall sensitivity of the IR
detectors to higher radiances, it would greatly aid model
solutions of emitted temperatures and hot fractional areas
for high-temperature pixels that are characteristic of active
volcanic features.
6.2. New near-IR band at 1.20–1.25 mm
Analysis of the October 1999 Mt. Etna ETM+ scene
(Fig. 4a) showed that highly radiant lava channels can
exhibit high-enough temperatures over a large-enough area
to be detected in Band 4 (Wright et al., 2000). This
phenomenon has previously been reported for TM Band 4
data acquired over active channels (Rothery et al., 1992;
Rothery & Pieri, 1993) and lakes (Harris et al., 1999a).
Ground-based hyperspectral studies of active lava channels
reveal that significant proportions of the channel exhibit
temperatures of 900–1150�C (Flynn & Mouginis-Mark,
1994). However, even for very active lava channels and
lakes, Harris et al. (1999a) and Wright et al. (2000) show
that Band 3 will not be thermally anomalous. To accurately
map and quantify radiance from these high-temperature
anomalies which saturate ETM+ Bands 5 and 7, an addi-
tional thermal band in the near-IR is therefore required. A
new band in the 1.20–1.25 mm range would fill the gap in
spectral coverage between ETM+ Bands 4 and 5 (Table 1).
The Earth Observing-1 (EO-1) Advanced Land Imager
(ALI) will have a band (Band 50) that will cover this
wavelength range and provide us with an insight into the
value of this waveband for modeling extremely high-
temperature events like active lava channels and flaming
forest fires.
6.3. Thermal IR band
The ETM+ instrument boasts of the highest spatial
resolution thermal IR detector on any commercial sensor
thus far; yet, without assessing the utility of this asset, plans
for future Landsat satellites do not include a thermal band.
Arguments against thermal bands include the cost of cooling
systems necessary to support a thermal imager. Once Land-
sat 7 and the Advanced Spaceborne Thermal Emission and
Reflection Radiometer (ASTER) cease to function, we will
not have the capability to collect high spatial resolution
thermal IR images from any orbital platform.
Fluid basalt eruptions tend to form long-sinuous, rel-
atively rapidly moving lava flows that can easily be recog-
nized in the near-IR to thermal IR. The two generic types of
basalt flows are thick, clinker-covered ‘a‘a flows, and thin,
smooth to ropey, surfaced pahoehoe flows. Despite the
differences in their appearance, both exhibit advancing flow
Fig. 5. A comparison of the sensitivity of high- and low-gain Band 6 data for the October 1999 Mt. Etna lava flows. High-gain data experience saturation at
much lower radiances than low-gain data.
L.P. Flynn et al. / Remote Sensing of Environment 78 (2001) 180–193190
fronts having similar temperatures and areas of 97% at
750 ± 20�C and 3% at 1150�C (Flynn & Mouginis-Mark,
1992). These flows can easily be recognized in Bands 5, 6,
and 7 and, if especially voluminous, Band 4 and the
panchromatic Band 8 (Wright et al., 2000). Nevertheless,
accurate mapping of flow units emplaced within the previous
7–10 days requires Band 6 data and has been shown to be
very useful for helping to determine lava flow emplacement
chronologies (Flynn et al., 1994; Harris et al., 1997).
In contrast to this, as indicated earlier, blocky silicic
lava flows tend to exhibit cooler surface temperatures
because very thick lava crusts inhibit heat flow from the
high-temperature molten core. The potential for cata-
strophic Merapi-style eruptions, in which the flow front
collapses to generate lethal pyroclastic flows (e.g., Rose et
al., 1976), is ever-present. However, as described for
Santiaguito, such blocky flows are extremely cool and
require a high spatial resolution thermal IR capability for
detection and measurement (Harris et al., 2001a). Cer-
tainly, the near-IR alone cannot be used to even detect
such features, let alone map, measure, and monitor them.
The same argument applies for low-temperature, but vol-
canically important, fumarolic and crater lake features
(Harris & Stevenson, 1997; Oppenheimer, 1997).
Finally, previous studies have shown that the thermal
band may be used to constrain the size of small hot
anomalies such as those due to open skylights along an
active lava tube (Flynn et al., 1994) or overturning lava
lakes (Harris et al., 1999a; Harris et al., 1999b). Sophist-
icated pixel mixture modeling techniques which build on
the original two-component approach of Rothery et al.
(1988) to allow three thermal components to be derived
have just been developed, tested, and validated. These in
turn improve the accuracy and confidence with which
quantitative volcanic data for magma and lava fluxes can
be obtained (Harris et al., 1999a; Harris et al., 1999b). For
these approaches to work, however, a thermal IR capability
is essential. It would be ironic if, after 12 years of incre-
mental study, technique development, and advance, a cru-
cial element in this progress, TM/ETM+ Band 6, was
eliminated. This would greatly affect our ability to char-
acterize activity for volcanic eruptions.
7. Conclusions
We have shown that Landsat 7 offers value-added
improvements over its Landsat predecessors in terms of
a panchromatic band and improved spatial resolution in
the IR band. Coupled with these technological improve-
ments, the collection and distribution of Landsat 7 data
are managed much more effectively than for previous
Landsat satellites. A Landsat 7 Long-Term Acquisition
Plan (LTAP, Arvidson et al., 1999) has been created to
govern the acquisition of ETM+ scenes based on numer-
ous factors including global land cover change (season-
ality), cloud cover probability, and scientific value to
investigators. As a result of the successful LTAP, almost
all of the global land areas had been imaged within the
first 6 months of Landsat 7 operation. Time series
analyses using multiple Landsat acquisitions for a single
active volcano are more economically feasible due to the
relatively low price of scenes available through the Land-
sat 7 data distribution by the United States Geological
Survey (USGS) rather than previous commercial vendors.
We have acquired Landsat 7 data from the USGS archive
within 9 days of their collection using very beneficial
features such as Web-accessible quick looks of the images
and File Transfer Protocol (ftp) of scenes directly from
USGS servers.
Despite these obvious improvements, there are more
improvements that can be made. The high- and low-gain
mode offered by the Landsat band 6 thermal band should
serve as a compromise example of how multi-spectral
satellites can be designed to be flexible enough to
accomplish many tasks. However, for volcano applica-
tions, the gain settings need to be set to accommodate
higher radiant fluxes. Landsat 7 ETM+ has a 60-m
thermal band with a low-gain mode that has a greater
dynamic range than previous Landsat imagers. Unfortu-
nately, the improved dynamic range was used to explore
cooler temperatures, rather than extend to higher temper-
atures. Hopefully, this will be corrected in the Landsat
follow-on. Above all, we argue that removal of the Band
6 capability would be a step backward. It would not be
ameliorated by addition of further near-IR bands because
none is capable of monitoring and measuring the low
magnitude thermal anomalies and background tempera-
tures necessary for successful modeling of the full suite of
volcanic activity styles.
We must move the Landsat program into the 21st
century in terms of technological improvements to
increase capability. Of critical importance, the paltry
8-bit dynamic range of Landsat must be improved to at
least a 12-bit or even a 14-bit system. EO-1 and ASTER
data will give us a glimpse at spectral band alternatives
that could improve the Landsat system of satellites. It is
ironic that despite technical advances in remote sensing
instrumentation, there is a move away to committing to
thermal bands. We have shown their utility here, and can
only hope that if not on the Landsat follow-on, that a
future satellite flying in formation with the next genera-
tion of Landsat will preserve this important resource for
volcanic hazard mitigation.
Acknowledgments
ETM+ images and support for L.P.F., A.J.L.H., and R.W.
were provided by funding from the Landsat 7 Science Team
(NAG 5-3451). We thank Dave Rothery of the Open
University for supplying the 1992 Mt. Etna TM scene for
L.P. Flynn et al. / Remote Sensing of Environment 78 (2001) 180–193 191

Fig. 4b. This is HIGP Publication no. 1168 and SOEST
Publication no. 5827.
References
Abrams, M., Glaze, L., & Sheridan, M. (1991). Monitoring Colima
Volcano, Mexico, using satellite data. Bulletin of Volcanology, 53,
571–574.
Andres, R. J., & Rose, W. I. (1995). Description of thermal anomalies on two
active Guatemalan volcanoes using Landsat Thematic Mapper imagery.
Photogrammetric Engineering and Remote Sensing, 61, 775–782.
Arvidson, T., Gasch, J., & Goward, S. N. (1999). Pleasing all of the people
most of the time . . . Planning Landsat 7 acquisitions for the U.S. archive.
Proceedings of the Pecora 14/Land Satellite Information III Conference,
1–10.
Bhattacharya, A., Reddy, C. S. S., & Srivastav, S. K. (1993). Remote
sensing for active volcano monitoring in Barren Island, India. Remote
Sensing of Environment, 59, 1293–1297.
Bonneville, A., & Gouze, P. (1992). Thermal survey of Mount Etna volcano
from space. Geophysical Research Letters, 19, 725–728.
Dean, K., Servilla, M., Roachm, A., Foster, B., & Engle, K. (1998). Satel-
lite monitoring of remote volcanoes improve study efforts in AK. EOS
— Transactions of the American Geophysical Union, 79, 413–423.
Dozier, J. (1981). A method for satellite identification of surface tempe-
rature field of subpixel resolution. Remote Sensing of Environment, 11,
221–229.
Flynn, L. P., & Mouginis-Mark, P. J. (1992). Cooling rate of an active
Hawaiian lava flow from nighttime spectroradiometer measurements.
Geophysical Research Letters, 19, 1783–1786.
Flynn, L. P., & Mouginis-Mark, P. J. (1994). Temperature of an active lava
channel from spectral measurements, Kilauea Volcano, Hawaii. Bulletin
of Volcanology, 56, 297–301.
Flynn, L. P., Mouginis-Mark, P. J., & Horton, K. A. (1994). Distribution of
thermal areas on an active lava flow field: Landsat observations of
Kilauea, Hawaii, July 1991. Bulletin of Volcanology, 56, 284–296.
Francis, P. W., & McAllister, R. (1986). Volcanology from space: using the
Landsat Thematic Mapper in the Central Andes. EOS — Transactions of
the American Geophysical Union, 67, 170–171.
Francis, P. W., & Rothery, D. A. (1987). Using Landsat Thematic Mapper
to detect and monitor volcanic activity: an example from Lascar volca-
no, North Chile. Geology, 15, 614–617.
Glaze, L., Francis, P. W., & Rothery, D. A. (1989). Measuring thermal
budgets of active volcanoes by satellite remote sensing. Nature, 338,
144–146.
Goanac’h, H., Vandemeulebrouck, J., Stix, J., & Halbwachs, M. (1994).
Thermal infrared satellite measurements of volcanic activity at Strom-
boli and Vulcano. Journal of Geophysical Research, 99, 9477–9485.
GVN. (1999a). Etna. Smithsonian Institution, Bulletin of the Global
Volcanism Network, 24, 3–7.
GVN. (1999b). Etna. Smithsonian Institution, Bulletin of the Global Vol-
canism Network, 24, 10–12.
GVN. (1999c). Etna. Smithsonian Institution, Bulletin of the Global Vol-
canism Network, 24, 13–16.
Harris, A. J. L., Flynn, L. P., Dean, K., Pilger, E., Wooster, M., Okubo, C.,
Mouginis-Mark, P., Garbeil, H., Thornber, C., De la Cruz-Reyna, S.,
Rothery, D., & Wright, R. (2000a). Real-time monitoring of volcanic
hot spots with satellites. Remote Sensing of Active Volcanism, AGU
Geophysical Monograph Series, 116, 139–159.
Harris, A. J. L., Flynn, L. P., Keszthelyi, L., Mouginis-Mark, P. J., Row-
land, S. K., & Resing, J. A. (1998). Calculation of lava effusion rates
from Landsat TM data. Bulletin of Volcanology, 60, 52–71.
Harris, A. J. L., Flynn, L. P., Matias, O., & Rose, W. I. (2001a). The
thermal stealth flows of Santiaguito: implications for the cooling and
emplacement of dacitic block lava flows. Geological Society of America
Bulletin (submitted).
Harris, A. J. L., Flynn, L. P., Pilger, E., & Matthews, S. J. (2001b). Real-
time monitoring of Lascar using GOES. Sernageomin Bulletin Series.
(in review).
Harris, A. J. L., Flynn, L. P., Rothery, D. A., Oppenheimer, C., & Sherman, S.
B. (1999a). Mass flux measurements at active lava lakes: implications for
magma recycling. Journal of Geophysical Research, 104, 7117–7136.
Harris, A. J. L., Keszthelyi, L., Flynn, L., Mouginis-Mark, P. J., Thornber,
C., Kauahikaua, J., Sherrod, D., Trusdell, F., Sawyer, M., & Flament, P.
(1997). Chronology of the episode 54 eruption of Kilauea Volcano,
Hawaii, from GOES-9 satellite data. Geophysical Research Letters,
24, 3281–3284.
Harris, A. J. L., Murray, J. B., Aries, S. E., Davies, M. A., Flynn, L. P.,
Wooster, M. J., Wright, R., & Rothery, D. A. (2000b). Effusion rate
trends at Etna and Krafla and their implications for eruptive mechanisms.
Journal of Volcanology and Geothermal Research, 102, 237–269.
Harris, A. J. L., Pilger, E., Flynn, L. P., Garbeil, H., Mouginis-Mark, P. J.,
Kauahikaua, J., & Thornber, C. (2001c). Automated, high temporal
resolution, thermal analysis of Kilauea volcano, Hawaii, using GOES-
9 satellite data. International Journal of Remote Sensing, 22, 945–967.
Harris, A. J. L., & Stevenson, D. S. (1997). Thermal observations of de-
gassing open conduits and fumaroles at Stromboli and Vulcano using
remotely sensed data. Journal of Volcanology and Geothermal Re-
search, 76, 175–198.
Harris, A. J. L., Wright, R., & Flynn, L. P. (1999b). Remote monitoring of
Mount Erebus, Antarctica, using polar orbiters: progress and prospects.
International Journal of Remote Sensing, 20, 3051–3071.
Heliker, C., Mangan, M. T., Mattox, T. N., Kauahikaua, J. P., & Helz, R. T.
(1998). The character of long-term eruptions: inferences from episodes
50–53 of the Pu‘u ‘O‘o — Kupaianaha eruption of Kilauea Volcano.
Bulletin of Volcanology, 59, 381–393.
Horton, K.A. (1995). Airborne and satellite infrared imaging spectroscopy
of active volcanism at Kilauea volcano, Hawaii. PhD Dissertation,
University of Hawaii, 343 pp.
Kauahikaua, J., Mangan, M., Heliker, C., & Mattox, T. (1996). A quanti-
tative look at the demise of a basaltic vent: the death of Kupaianaha,
Kilauea Volcano, Hawaii. Bulletin of Volcanology, 57, 641–648.
Keszthelyi, L. (1995). A preliminary thermal budget for lava tubes on
the Earth and planets. Journal of Geophysical Research, 100,
20411–20420.
Kneizys, F. X., Shettle, E. P., Abreu, L. W., Chetwynd, J. H., Anderson,
G. P., Gallery, W. O., Selby, J. E. A., & Clough, S. A. (1988). Users’
guide to LOWTRAN 7. Air Force Geophysical Laboratory. Environ-
mental Research Paper, 1010, 1–137.
Matson, M., & Dozier, J. (1981). Identification of subresolution high tem-
perature sources using a thermal IR sensor. Photogrammetric Engineer-
ing and Remote Sensing, 47, 1311–1318.
Matthews, S. J., Gardeweg, M. C., & Sparks, R. S. J. (1997). The 1984 to
1996 cyclic activity of Lascar volcano, northern Chile: cycles of dome
growth, dome subsidence, degassing, and explosive eruptions. Bulletin
of Volcanology, 59, 72–82.
ONTAR. (1991).PCModTRANatmosphericmodel software.Brookline,MA.
Oppenheimer, C. (1991). Lava flow cooling estimated from Landsat The-
matic Mapper infrared data: the Lonquimay eruption (Chile, 1989).
Journal of Geophysical Research, 96, 21865–21878.
Oppenheimer, C. (1993). Infrared surveillance of crater lakes using satellite
data. Journal of Volcanology and Geothermal Research, 55, 117–128.
Oppenheimer, C. (1996). Crater lake heat losses estimated using remote
sensing. Geophysical Research Letters, 23, 1793–1796.
Oppenheimer, C. (1997). Remote sensing of the colour and temperature of
volcanic lakes. International Journal of Remote Sensing, 18, 3–37.
Oppenheimer, C. (1998). Satellite observation of active carbonatite volcan-
ism at Ol Dionyo Lengai, Tanzania. International Journal of Remote
Sensing, 19, 55–64.
Oppenheimer, C., & Francis, P. (1997). Remote sensing of heat, lava, and
fumarole emissions from Erta ’Ale Volcano, Ethiopia. International
Journal of Remote Sensing, 18, 1661–1692.
Oppenheimer, C., Francis, P. W., Rothery, D. A., Carlton, R. W. T., &
L.P. Flynn et al. / Remote Sensing of Environment 78 (2001) 180–193192

Harris, A. J. L. (1993a). Infrared image analysis of volcanic thermal
features: Lascar Volcano, Chile, 1984–1992. Journal of Geophysical
Research, 98, 4269–4286.
Oppenheimer, C., Rothery, D. A., & Francis, P. W. (1993b). Thermal dis-
tributions at fumarole fields: implications for infrared remote sensing of
active volcanoes. Journal of Volcanology and Geothermal Research,
55, 97–115.
Oppenheimer, C. M. M., & Rothery, D. A. (1991). Infrared monitoring of
volcanoes by satellite. Journal of the Geological Society London, 148,
563–569.
Pieri, D. C., Glaze, L. S., & Abrams, M. J. (1990). Thermal radiance
observations of an active lava flow during the June 1984 eruption of
Mount Etna. Geology, 18, 1018–1022.
Rose, W. I., Pearson, T., & Bonis, S. (1976). Nuee ardente eruption from
the foot of a dacite lava flow, Santiaguito Volcano, Guatemala. Bulletin
of Volcanology, 40, 23–38.
Rothery, D. A., Borgia, A., Carlton, R. W., & Oppenheimer, C. (1992). The
1992 Etna lava flow imaged by Landsat TM. International Journal of
Remote Sensing, 13, 2759–2763.
Rothery, D. A., Francis, P. W., & Wood, C. A. (1988). Volcano monitoring
using short wavelength infrared data from satellites. Journal of Geo-
physical Research, 93, 7993–8008.
Rothery, D. A., & Pieri, D. C. (1993). Remote sensing of active lava.
In: Active lavas ( pp. 203–233). London: UCL Press.
Wooster, M. J., & Rothery, D. A. (1997). Thermal monitoring of Lascar
Volcano, Chile, using infrared data from the along-track scanning
radiometer: a 1992–1995 time series. Bulletin of Volcanology, 58,
566–579.
Wright, R., Flynn, L. P., & Harris, A. J. L. (2000). The evolution of lava
flow fields at Mount Etna, 27–28 October 1999, observed by the Land-
sat 7 ETM+ . Bulletin of Volcanology, 63, 1–7.
L.P. Flynn et al. / Remote Sensing of Environment 78 (2001) 180–193 193