Improved IDDQ Testing With Empirical Linear Prediction
10
- - -- - - ---- Improved IDDQTesting With Empirical Linear Prediction David I. Bergman National Institute of Standards and Technologyl, Gaithersburg, MD 20899 Hans Engler Georgetown University, Washington, D.C., 20057 Abstract A new linear prediction method that improves IDDQ test effectiveness is described. The method uses statistical pre-processing of exhaustive measurements on training devices to extract principal patterns in the device IDDQbehavior and to generate a prediction model. Fitting the model to device measurements accommodates variations in the fabrication process. Comparison with the Delta IODQ test method using the SEMATECH S-121 data shows that for nearly equal numbers of defective parts passed, the new method fails fewer defect-tree parts. I. INTRODUCTION An important factor in the acceptance and use of IDDQ testing as a way to detect defects in digital CMOS integrated circuits is the method's ability to enhance the fault coverage of an overall test program with a small number of additional test vectors. Although an IDDQ test makes no direct query of a device's ability to function as designed, it can uncover defects in a device that functional, stuck-at, and other tests miss. With the advent of deep submicron fabrication technologies, shrinking MOSFET geometries have caused normal quiescent current to increase. Discussions of the causes of MOSFET leakage are found in [1]-[4]. Leakage current mechanisms such as subthreshold conduction, gate oxide tunneling, and short channel effects including drain induced barrier lowering (DIBL) and gate induced drain leakage (GIDL) confound a test method that seeks to discriminate good devices trom bad devices with a simple comparison to a threshold. This paper describes an IDDQ test method that makes use of statistical analysis of the larger device population to extract information that can aid the test effort. The method uses linear prediction to discriminate between devices whose measurements indicate normal leakage current and those that have defect induced leakage currents. In prediction-based (Electricity Division, Electronics and Electrical Engineering Laboratory, Technology Administration, U.S. Department of Commerce. Official contribution of the National Institute of Standards and Technology; not subject to copyright in the United States. Paper 33.2 954 IDDQ testing, a model is developed with which device IDDQ responses may be predicted. The residuals of the predictions, the difference between actual measurements and the predictions, are used to determine if a device is defective or not. The key idea is to test exhaustively a small sample population of devices and to use information in the exhaustive sampling to enhance the test effectiveness of the small number of measurements made during on-line testing. By fitting device measurements to the model, the method can accommodate IDDQvariations arising trom variations in the fabrication process. Another way of describing the approach is that principal patterns inthe IDDQbehavior ofknown good devices are found. The goodness of fit between these patterns and measurements made on a device under test is used to make a pass or fail decision on the device whatever its absolute IODQ levels may be. Section II discusses the motivation for the work and presents a brief survey of prevailing IODQtest methods. Section III discusses the rationale behind predictive IDDQand gives a qualitative description of a new empirical linear prediction method. Section IV gives an overview of the mathematics behind the new prediction method. Section V presents results using the new method with the SEMATECH Project S-121 data [5]. Section VI summarizes the main points of the paper and describes how the method might be applied to production testing. II. BACKGROUND The traditional IDDQ test is based on two observations. One is that a digital CMOS circuit, even a large one, draws a negligibly small current trom its power supply when the circuit clock is stopped (quiescent mode). The other is that the presence of a defect anywhere in the device can cause a non-negligible supply current to be drawn if the circuit nodes associated with the defect are driven to the right states. Examples of defects that can elevate supply current include resistive metal bridges, gate oxide shorts, and MOSFET floating gates. ITC INTERNATIONALTEST CONFERENCE 0-7803-7542-4/02 $17.00 @ 2002 IEEE
Transcript of Improved IDDQ Testing With Empirical Linear Prediction
- - -- - - ----
Improved IDDQTesting With Empirical Linear Prediction
David I. BergmanNational Institute of Standards and Technologyl, Gaithersburg, MD 20899
Hans EnglerGeorgetown University, Washington, D.C., 20057
Abstract
A new linear prediction method that improves IDDQtest effectiveness is described. The method usesstatistical pre-processing of exhaustive measurementson training devices to extract principal patterns in thedevice IDDQbehavior and to generate a predictionmodel. Fitting the model to device measurementsaccommodates variations in the fabrication process.Comparison with the Delta IODQtest method using theSEMATECH S-121 data shows that for nearly equalnumbers of defective parts passed, the new methodfails fewer defect-tree parts.
I. INTRODUCTION
An important factor in the acceptance and use of IDDQtesting as a way to detect defects in digital CMOSintegrated circuits is the method's ability to enhancethe fault coverage of an overall test program with asmall number of additional test vectors. Although anIDDQtest makes no direct query of a device's abilityto function as designed, it can uncover defects in adevice that functional, stuck-at, and other tests miss.
With the advent of deep submicron fabricationtechnologies, shrinking MOSFET geometries havecaused normal quiescent current to increase.Discussions of the causes of MOSFET leakage arefound in [1]-[4]. Leakage current mechanisms suchas subthreshold conduction, gate oxide tunneling, andshort channel effects including drain induced barrierlowering (DIBL) and gate induced drain leakage(GIDL) confound a test method that seeks todiscriminate good devices trom bad devices with asimple comparison to a threshold.
This paper describes an IDDQtest method that makesuse of statistical analysis of the larger devicepopulation to extract information that can aid the testeffort. The method uses linear prediction todiscriminate between devices whose measurementsindicate normal leakage current and those that havedefect induced leakage currents. In prediction-based
(Electricity Division, Electronics and Electrical EngineeringLaboratory, Technology Administration, U.S. Department ofCommerce. Official contribution of the National Institute ofStandards and Technology; not subject to copyright in the UnitedStates.
Paper 33.2
954
IDDQtesting, a model is developed with which deviceIDDQresponses may be predicted. The residuals ofthe predictions, the difference between actualmeasurements and the predictions, are used todetermine if a device is defective or not. The keyidea is to test exhaustively a small sample populationof devices and to use information in the exhaustivesampling to enhance the test effectiveness of thesmall number of measurements made during on-linetesting. By fitting device measurements to themodel, the method can accommodate IDDQvariationsarising trom variations in the fabrication process.Another way of describing the approach is thatprincipal patterns in the IDDQbehavior of known gooddevices are found. The goodness of fit between thesepatterns and measurements made on a device undertest is used to make a pass or fail decision on thedevice whatever its absolute IODQlevels may be.
Section II discusses the motivation for the work andpresents a brief survey of prevailing IODQtestmethods. Section III discusses the rationale behind
predictive IDDQand gives a qualitative description ofa new empirical linear prediction method. Section IVgives an overview of the mathematics behind the newprediction method. Section V presents results usingthe new method with the SEMATECH Project S-121data [5]. Section VI summarizes the main points ofthe paper and describes how the method might beapplied to production testing.
II. BACKGROUND
The traditional IDDQtest is based on two observations.One is that a digital CMOS circuit, even a large one,draws a negligibly small current trom its powersupply when the circuit clock is stopped (quiescentmode). The other is that the presence of a defectanywhere in the device can cause a non-negligiblesupply current to be drawn if the circuit nodesassociated with the defect are driven to the rightstates. Examples of defects that can elevate supplycurrent include resistive metal bridges, gate oxideshorts, and MOSFET floating gates.
ITC INTERNATIONALTEST CONFERENCE
0-7803-7542-4/02 $17.00 @ 2002 IEEE

In practice, however, even a defect-free CMOScircuit does draw some current. In addition,quiescent current levels vary from device to devicedue to random variations in doping levels,lithographic dimensions, and other fabricationprocess parameters. A group of devices whoseinternal logic states have been set equal under staticconditions will display a spread of IooQvalues aroundsome mean value. As long as quiescent currentvariations in defect-free devices remain small,discrimination between normal quiescent current anddefect-induced current is a straightforward task.Establish a current threshold or limit, and declare asdefective any device whose supply current exceedsthe threshold for any of the test vectors applied.
With increased deep submicron leakage comes notjust higher nominal quiescent current but increasedvariance too both within a single device among testvectors and among many devices. The task ofdiscriminating good devices from bad is not asstraightforward, because normal quiescent currentsmay be larger than defect currents. Under theseconditions, a simple threshold test is no longerworkable.
Researchers have refined the original IooQ testmethod idea with several different approaches.Gattiker et. al. [6][7] propose a current signaturemethod that looks at the set of IooQmeasurements ona device under test after sorting the measurementsfrom smallest to largest. Discontinuities in theresulting curve are interpreted to indicate thepresence of a defect. A differential current signaturemethod is also described which compares each IOOQmeasurement to a reference current value anddeclares a device defective if any of the comparisonsexceeds a threshold. Thibeault [8][9] proposes adifferential IooQ method known as Delta IooQ inwhich the differences between successive IooQmeasurements in a set are compared to a threshold.Like the current signature method, this method isinsensitive to defects that elevate quiescent current atall test vectors. Since such defects are likely notcaused by defects in active circuit components,ignoring these kinds of defects can reduce thenumber of functional devices rejected. Thibeaultshows that the variance of Delta IooQ residuals(IoOQk+1- IooQk)is less than the variance of absoluteIooQ measurements since measurement variationsfrom chip to chip or from wafer to wafer contributeto the latter but are partly eliminated by takingdifferences. The result is that a single thresholdpass/fail criterion results in fewer misclassifications.Daasch et. al. [10] make use of spatial proximityamong devices on a wafer to predict the behavior of a
device under test from its neighbors' IooQmeasurements. The residuals of these predictions areshown to have reduced variance. Maxwell andO'Neill [11] describe a current ratio method. Themethod is based on the observation that a set ofdevices will exhibit similar current signatures whenthe IOOQvalues for each device are plotted in thesame vector order. This means that the ratio ofmaximum IooQto minimum IooQfor a set of devicesis nearly constant even if the absolute IooQ valuesamong devices are very different. By applying to thedevice under test a test vector likely to produce aminimum (or nearly minimum) IOOQvalue, themaximum IooQvalue for that device can be predicted.A single absolute measurement on a device under testcan thus provide tailored thresholds for the deviceagainst which subsequent comparison measurementscan be made. Jandhyala et. al. [12]-[14] applyclustering techniques to separate good devices frombad devices. Clustering methods attempt to classifydevices into groups with similar characteristics.Clustering methods can sort devices into "good"clusters and "bad" clusters without restriction tosimple, one-dimensional threshold comparisons.Variyam [15] describes an IooQtest method based onlinear prediction of IooQcurrents. Each IOOQvalueamong a set of values for a given device is predictedfrom the remaining IooQ values in the set. Theresiduals of these predictions are applied to athreshold test.
Each of these methods uses to a different degreeinformation from the overall set of test vectors anddevice population. All methods except the traditionalsingle threshold IOOQtest also rely on techniques toreduce the variability of IooQtest results to improvethe accuracy of discrimination procedures. Thetraditional single threshold IOOQtest makes a decisionabout a device based on whether any measurementexceeds a threshold. The current signature and DeltaIOOQmethods are based on comparisons of individualmeasurements with other measurements from thesame device. The nearest neighbor method basesdecisions on the set of measurements made over alocal population of devices in the neighborhood ofthe device under test on the wafer. The ratio IooQmethod also uses a small population of devices todetermine the maximum to minimum ratio of IooQcurrent for the set of devices to be tested. Thepredictive and clustering approaches rely onstatistical analysis of larger device populations tomake pass/fail decisions. In doing so, these last twomethods make use of additional informationcontained in the population where hidden correlationscan offer insight into device behavior. The methodproposed here uncovers the correlations among
Paper33.2955
measurements at different test vectors from ananalysis of a large device population and uses them tomake pass/fail decisions.
III. PREDICTIVE IDDQ
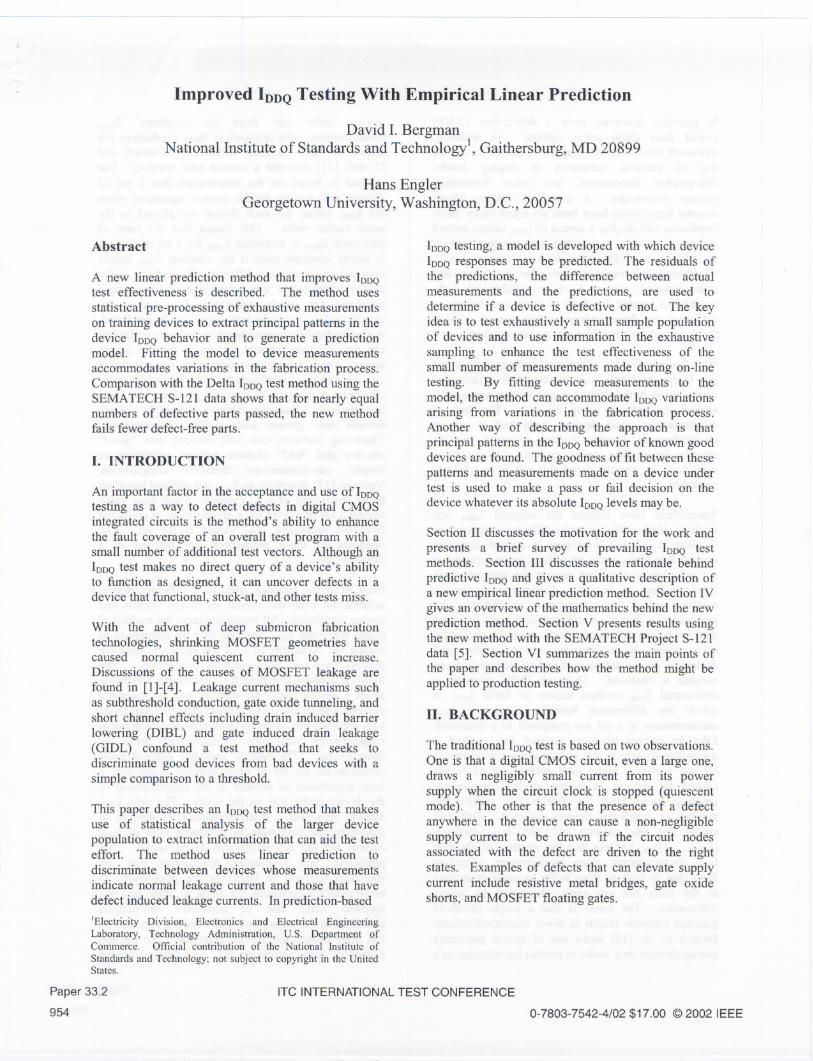
A predictive approach to IOOQtesting recognizes thatbecause device leakage currents among defect-freedevices are correlated to one another through anunderlying set of process parameters, it is possible topredict the IOOQvalue of one test vector from the looQvalues of one or more other test vectors. Fig. 1illustrates how IOOQmeasurements correlate withfabrication process parameters. Drainlsource-substrate junction areas, MOSFET gate length Leff,impurity concentrations, and gate oxide thickness area few examples of process parameters whosevariations give rise to varying leakage currents. Themechanisms behind these leakage currents werementioned in section I. The leakage mechanismscombine in state-dependent fashion to producevarying looQ levels that are correlated with theunderlying process variations.
IDDQfor each test vector
pn junction gate length dopingarea
gate oxidethickness
Fig. 1. Test vector to fabrication process correlation.
If one can predict these looQ levels well, then theresiduals, the differences between measured andpredicted values, will be small and have less variancethan the original set of looQ measurements. Aprediction method that is related in some way toprocess parameters and is based on the behavior ofdefect free devices should therefore be able to trackprocess variations. It should reduce looQvariabilitythat is due to changes in process parameters alone.On the other hand, the IOOQcurrent associated with atest vector that activates a defect will not be wellpredicted, and the prediction residual will be large.As a result, large prediction residuals among deviceswith defects will be well separated from the smallprediction residuals of defect free devices.
Paper 33.2
956
The method of prediction described in [15] predicts atest vector's IDOQvalue by taking linear combinationsof looQvalues from other test vectors. Appropriatelinear combinations are found using regressionanalysis on data from a population of devices called atraining set. The method described in this paper alsouses information from a training set population butperforms the predictions based on a mathematicalmodel derived from the training set. looQvalues arepredicted not with linear combinations of other IOOQvalues from the same device but with linearcombinations of data vectors from an empiricalmodel derived from device responses. Also, devicesin the training set are measured for a greater numberof test vectors than are measured during productiontesting. During production testing, the predictionmethod makes use of information contained in theadditional test vectors measured from the training set.The method therefore allows looQvalues for a deviceunder test to be predicted for test vectors notmeasured during production testing.
Empirical Models and Linear Prediction
Empirical models are learning-based models,obtained by numerically analyzing the data fromexhaustive testing of representative units coming offthe production line. They are based on the premisethat a selected lot of devices will manifest all of thedegrees of freedom or variability of themanufacturing process. At the National Institute ofStandards and Technology (NIST), a user-friendlysoftware toolbox for optimizing empirical linearmodel building has been developed. The toolbox,High-dimensional Empirical Linear Prediction(HELP), was developed specifically to meet therequirements of test and measurement engineers.While this paper discusses some of the methods usedby the toolbox, it does not describe the softwareitself. Interested readers may refer to [16] and [17].More detailed treatment of the methods used by thetoolbox can be found in [18]-[21]. The toolboxincorporates a new approach for optimizing thetesting of electronic devices and instruments. Theapproach is currently being used by mixed-signalintegrated circuit manufacturers to reduce the cost oftesting their products, and it is also being used atNIST to reduce customers' costs for selectedcalibration services. Examples of devices that canbenefit from the HELP approach range fromintegrated circuit analog-to-digital (AID) and digital-to-analog (D/A) converters to multi-range precisioninstruments.
The HELP approach is based on a simplemathematical model that relates device response over
all test vectors to a set of underlying variables. Oncean accurate model has been developed, algebraicoperations on the model can be used to select anoptimal set of test vectors and to predict the responseof a device under test at all test vectors. HELP placesspecial emphasis on empirical modeling usingmeasurement data collected previously on devicessimilar to the unit under test. An efficient testingstrategy tries to identify the parameters that governthe behavior of a device type and build amathematical model for it. For a given new device,these parameters are then determined from a reducedset of measurements, and the mathematical model isused to compute the device response at all testvectors. Empirical models require no detailedknowledge of the internal device architecture to beboth accurate and efficient. In addition to testoptimization, the toolbox is useful for exploring thestructures that underlie the behavior of the testeddevices. It can reveal how many variables areactually needed to explain the behavior and whattheir characteristic signatures look like. It can warnproduction engineers when the manufacturingprocess has undergone hidden changes, and it may beused to help diagnose the likely causes.
IV. APPLICATION TO IDDQDATA
Although the methods described in [18]-[21] weredeveloped for the testing and characterization ofanalog and mixed-signal devices, they can be appliedto IDDQ data analysis as well. Since IDDQmeasurements consist of ordered pairs of digital inputcodes and analog current outputs, IDDQtesting may beviewed as a mixed-signal application. The dataanalysis methods are based on a linear coefficientmatrix model A that relates the device's response y atall candidate test vectors to a set of underlyingvariables x. Once an accurate model has beendeveloped, algebraic operations are used to:
1. Estimate the parameters of the model frommeasurements made at the selected test vectors.
2. Predict the response of the device at all candidatetest vectors from measurements made at the selectedtest vectors. (The candidate test vectors are thosethat were used in the training set.)
The model matrix A is an empirical model. Itrequires no detailed design knowledge of the devicebeing tested. It is obtained numerically by analyzingthe data from exhaustive testing of devices similar tothe device being tested.
We start with an rnxp matrix of modeling (training)data A, where m is the number of test vectorsmeasured in the training set, and p is the number ofdevices in the training set. In the situation consideredhere, p is larger than m. Each of the columns of Acontains IDDQdata for a single, known good devicetaken over m test vectors. We want to extract a lowerdimensional approximation to these responsepatterns, i.e. an rnxn (n < p) model matrix A such thatthe columns of A can be approximated in terms of thecolumns of A.
To construct an empirical model matrix from themodeling set A, we take the singular valuedecomposition [22] of A so that A = USVT. Here, Uis an rnxm orthogonal matrix, V has size pxm withorthonormal columns, and S is a diagonal matrixwhose diagonal elements (Sl, S2,...,Sm)are the singularvalues Sjthat are non-negative and decreasing. Onethen chooses A=UI consisting of the n leftmostcolumns of U. It is known that no model matrix withn columns gives a better linear approximation of themodeling data A with respect to a number ofapproximation criteria. The columns of UI may beviewed as the principal patterns in the devicebehavior, and the numbers Sjdescribe the relative sizeof each of these principal patterns. The modeldimension n is set by the user with the aid of variousdiagnostic tools that are implemented in HELP. Onetypically chooses n corresponding to a knee in a plotof the logarithm of the singular values Sj if such aknee is prominent. The idea is to include only thosemodel vectors that contribute significantly toexplaining variability in the data. The method isclosely related to Principal Component Analysis [22].
This method improves upon previous IDDQpredictionmethods because the basis functions used in theprediction are orthogonal. And, as will be seen,through the training set, the method makes use ofinformation in all of the available test vectors for aparticular batch of devices, not just those used duringon-line testing.
Modeling
We now delete all rows of A except thosecorresponding to the reduced test vector set of k testvectors (the test vectors selected for on-linemeasurement). Test vectors may be selected usingestablished fault models, or they may be selectedwith HELP using an algorithm based on minimizingprediction variance. The result is a row reducedmodel matrix A, with k rows and n columns (n < k <m). With a model determined and with test vectorsselected, we first estimate the parametervector x
Paper 33.2
957

using least squares from a reduced number of IooQmeasurements ytaken from the device under test:
x::=X = (ATArl ATy. (1)
From the parameter estimate x, the predictedbehavior at all test vectors is given by
y=Ax =A(ATArIATy. (2)
In practice, one normally needs at least twice asmany test vectors as model vectors (k > 2n). While itis intuitive that more test vectors are likely to findmore defects, from a modeling perspective, more testvectors allow better sampling of device behavioroutside the space spanned by the model of gooddevices. With fewer test vectors, the non-modelbehavior of a defective device is harder to detect.
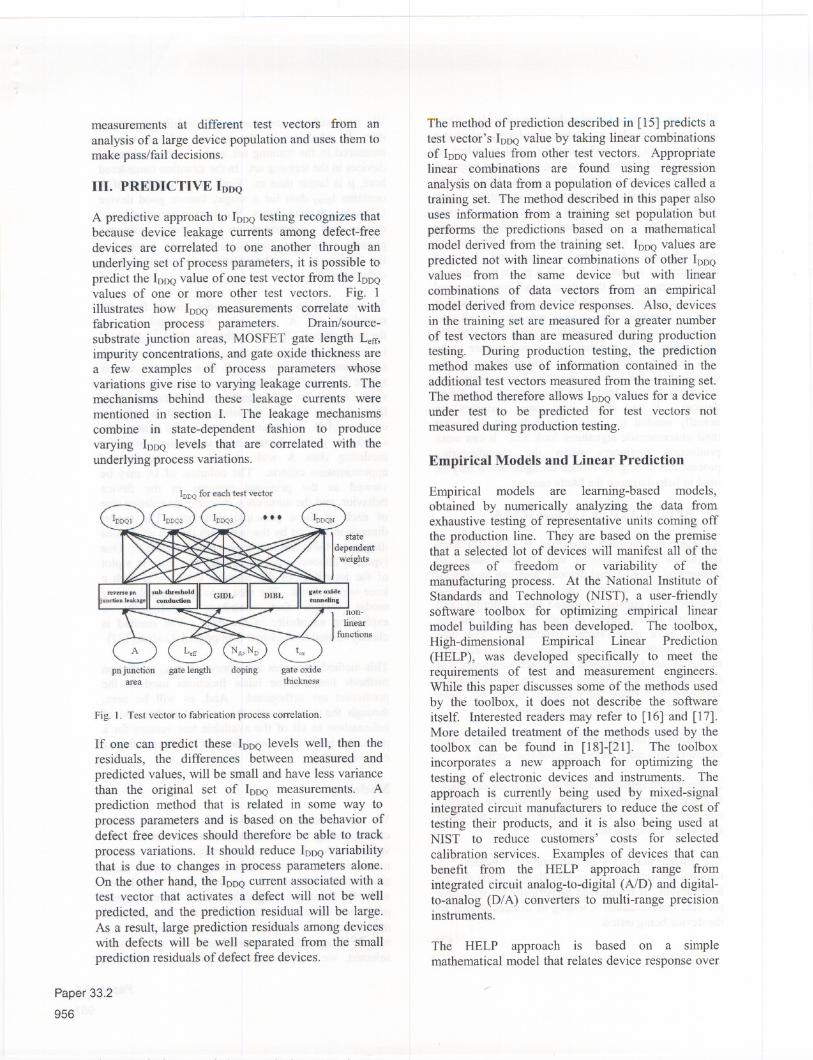
Fig. 2 illustrates with a matrix tableau how sevenmodel vectors and measurements at ten test vectorspredict the response of a device under test. Theprocedure computes model parameters x fromdevice under test IOOQvalues measured at k testvectors (big dots) and then uses x to predict thedevice response at all of the device's candidate testvectors, including those measured.
y AandA1\
X
Xl
X2
X3
X4
X5
X6
X7
C/)1-0o
......o>......C/)~
~8
n Model Vectors
Fig. 2. Pictorial representation of equation (2).
The following statements can be made about thisprocedure. 1) The regression constants aredetermined using device under test measurements.Predictions are based upon fitting the model to thedevice under test, so even wildly different currentlevels from device to device are accommodated.2) The method uses information from all test vectorsin the training set, not just those used for the deviceunder test. This means that IooQvalues at test vectorsnot measured on the device under test can be
predicted. 3) The model is nearly optimal for
Paper 33.2958
explaining the behavior of good devices. Predictionresiduals are generally smaller than for any otherlinear model with the same dimension and the samenumber of test vectors.
v. RESULTS
The last statement forms the basis for improved IooQtesting methodologies. Smaller prediction residualsallow a threshold test based on residuals todiscriminate better between normal quiescent anddefect-induced supply currents even when absolutecurrent levels are very different from device todevice. With this thought in mind, the SEMATECHdata were analyzed using a HELP-based predictionmethod. The results were compared with the DeltaIOOQ method. The two methods and theirexperimental definitions are as follows:
1. Delta IooQ: The maximum of the absolute valueof the difference between each test vector and thenext test vector is computed for each device:
Omax = max IYi- Yi-II, (3)
2. HELP Residual IooQ: The HELP predictionresiduals are computed at the selected test vectors:
r = y - A (AT Arl AT y, (4a)
wher~ A (AT Arl AT Y are the predictions at themeasured test vectors only, and the maximum of theirabsolute values is recorded:
r max= max Iril. (4b)
Note: For the data analysis described in this paper,each method was preceded by a pre-screening pass toexclude from the validation set any device for whichIooQvalues at all test vectors were elevated (> 5 J.lA)but nearly equal (ill < 0.01 J.lA). These devices arelikely bad but would pass the Delta IOOQtest asdefined above.
By taking the maximum over all IOOQtest vectorsused, each method produces a single number that isultimately compared to a threshold in order to make apass or fail decision. The threshold level is set by thetest engineer per an appropriate yield/quality costfunction.
The mathematical model used by the HELP methodto predict device response over all test vectors wasderived from training data using known good devicesonly, i.e. devices that passed all tests at the wafer
level (SEMATECH failure code $$). 500 deviceswere randomly selected from the SEMATECH job 1data to comprise the training set. 1000 different gooddevices and 900 bad devices (failure code AF) wererandomly selected for a validation set. The trainingset was then used with HELP to predict device IDDQvalues over all of the 195 SEMATECH test vectorsusing different combinations of model size, n, andnumber of test vectors, k. Model size refers to thenumber of principal component vectors in the modelwhose appropriate linear combination predicts theresponse of a device under test.
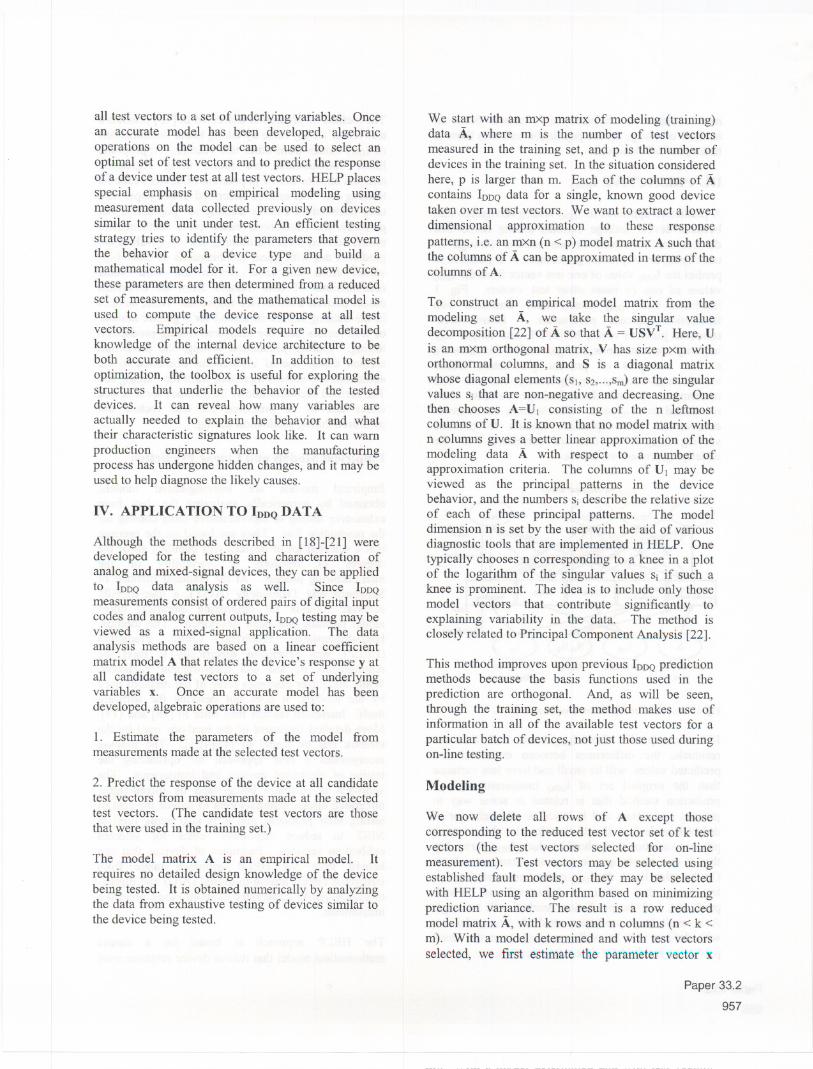
For each 'model size/test vector set' combination, theprediction data and the prediction residuals werecomputed. As an example, Fig. 3 shows measuredIDDQand HELP predicted IDDQvalues versus testvector for an arbitrary good device in the validationset. 25 model vectors and 50 test vectors were usedto predict the device response at all 195 test vectors.For clarity, only the first 60 of the 195 predictions areshown.
__ 195 validation measurements.50 device measurements. 195 predictions
10 20 30 40 50 60
Test Vector
Fig. 3. Measurements predicted with 25 model vectors and 50 testvectors (only the first 60 of all 195 predictions shown).
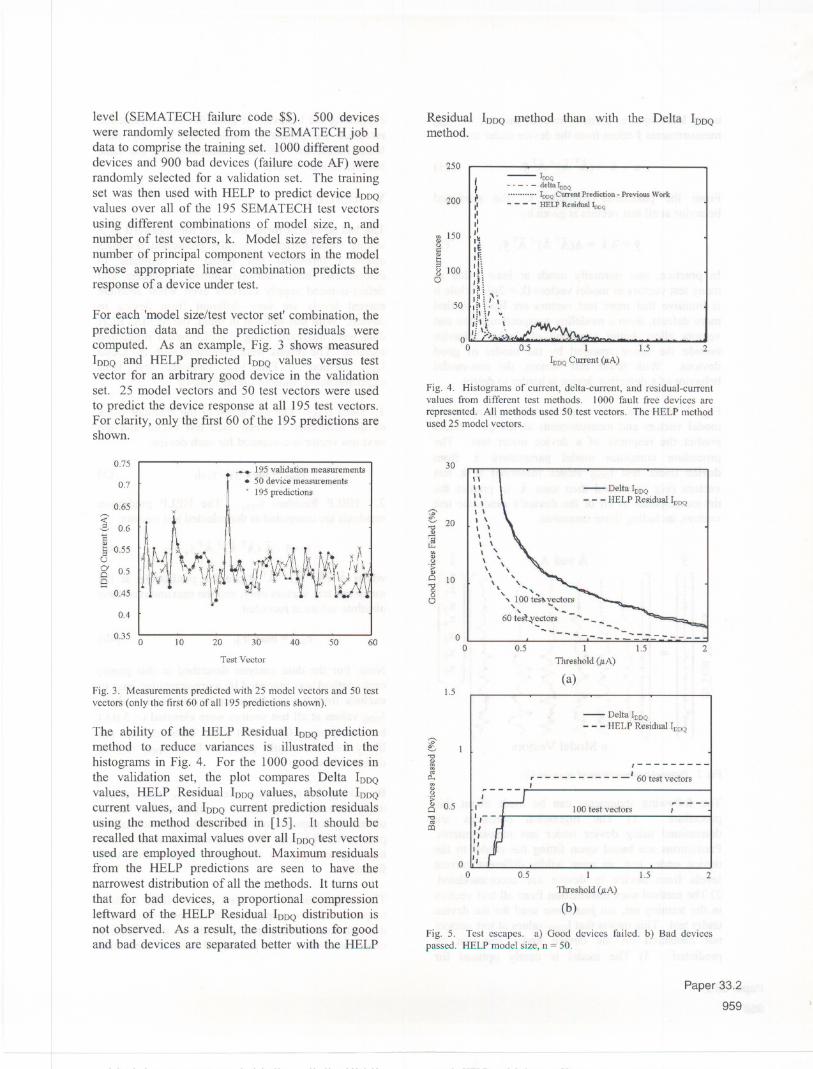
The ability of the HELP Residual IDDQpredictionmethod to reduce variances is illustrated in thehistograms in Fig. 4. For the 1000 good devices inthe validation set, the plot compares Delta IDDQvalues, HELP Residual IDDQvalues, absolute IDDQcurrent values, and IDDQcurrent prediction residualsusing the method described in [15]. It should berecalled that maximal values over all IDDQtest vectorsused are employed throughout. Maximum residualsfrom the HELP predictions are seen to have thenarrowest distribution of all the methods. It turns outthat for bad devices, a proportional compressionleftward of the HELP Residual IDDQdistribution isnot observed. As a result, the distributions for goodand bad devices are separated better with the HELP
Residual IDDQ method than with the Delta IDDQmethod.
~ 150o5ag 100o
250
200
- IoDQ- . - . - deltaIoDQ
IoDQClI1Te11tPrediction -Previous Work- - - - HELP Residua) IoDQ
I,~,IIIII,1I~lIEIf:rI:Ii!,HI~:I~: ,.
50~Il' ;! ~.:' H ",i'1 \
o ,!i ~)iI.~~o 0.5 1 1.5
IDDQ Current (p.A)
2
Fig. 4. Histograms of current, delta-current, and residual-currentvalues from different test methods. 1000 fault free devices are
represented. All methods used 50 test vectors. The HELP methodused 25 model vectors.
~ 20'"II)
~'"II).~II)
Q 10'"o8
,-.~'"~<IIQ.,U>II)o
.~o 0.5'"<II
CQ
30
o Io
1\1\III ,, \I \, \\ ,\ \, "\ "\ \,\ "\ "
\. ...'.., 100 te~ vectors" ..." '-60te~.fectors - ...- _ ...
-.....--~ :::-----
- Delta IDDQ
- - - HELP Residual IDDQ
0.5 1
Threshold (jlA)
(a)
1.5 2
1.5
- Delta IDDQ
- - - HELP Residual IDDQ
,---------r - - - - - - - - - - -' 60 test vectors,
,,-:,--I'""I
o I"o
100 test vectors
0.5 I
Threshold (IlA)
(b)
1.5 2
Fig. 5. Test escapes. a) Good devices failed. b) Bad devicespassed. HELP model size, n = 50.
Paper 33.2
959
0.75
0.7
0.65
'-' 0.61::II)
80.55
8' 0.58
0.45
0.4
0.35 0

Fig. 5 supports this statement by showing thepercentage of test escapes that occur with the DeltaIDDQand HELP Residual IDDQtest methods. Fig. 5aplots the percentage of good devices (out of 1000 inthe validation set) whose test result was greater thanthe test threshold over a threshold range from 0 to2~. The number of model vectors used by theHELP method was 50. The figure shows gooddevices failed versus threshold for cases when thenumber of test vectors used by both methods was 60and 100. It is evident that the HELP Residual IDDQmethod fails fewer good devices than does the DeltaIDDQmethod for any given threshold. The qualityperformance (bad devices passed) associated with theyield improvement seen in Fig. 5a is shown in Fig. 5bwhich plots the number of bad devices passed as afunction of test threshold. The performance of thetwo test methods is nearly identical. While the DeltaIDDQmethod does pass slightly fewer bad parts thanthe HELP method, the difference in quality is smallcompared to the increase in yield attainable with theHELP method.
30
25- DeltaIDDQ- - - HELPResidualIDDQ
00 1.5 20.5 1Threshold (/LA)
(a)
1.8
1.6
- DeltaIDDQ- - - HELPResidualIDDQ
, , 1.4~:;- 1.2
Q)
~ 1~'"~ 0.8.~Q)
Q 0.611CQ0.4
0.2
,-~ _ _ _ _ _ _ _,
0.5 1Threshold (/LA)
(b)
1.5 2
Fig. 6. Test escapes. a) Good devices failed. b) Bad devicespassed. HELP model size, n = 10.
Paper 33.2
960
Fig. 6 shows more of the same idea but usingdifferent randomly selected devices comprising themodel and validation sets and different numbers ofmodel vectors and test vectors. In the figure, theHELP Residual IDDQcurves result from using 10model vectors with 20 and 40 test vector cases. Theresults are similar to those in Fig. 5.
To illustrate how model size affects performance ofthe HELP Residual IDDQmethod, Fig. 7 shows testescapes as a function of both threshold and modelsize when 20 test vectors are used. For a fixedthreshold, the number of good devices faileddecreases with increasing model size because themodel does a better job at predicting device behavior.However, as the number of model vectors approachesthe number of test vectors, prediction residuals forbad devices decrease as -well, allowing someadditional bad devices to be passed.
30
25
, ,~~ 20-0Q)
~ 15'"Q)Q
.~ 10Q-0oc3
1.5Threshold (/LA)
(a)
Model Size
.---..---- - --- - : - -"" ~ - -"" -......, .
2.5
20
, ,~ 2-0Q)i1.5
~" ,
" ,..",' -" . I
.' .
i"::"::'L:::: ~:::::::::~:O',:::,:::::?:::,:,~;
'"Q)
.~ 1Q)
Q
110.5CQ
10
1.5 1
Threshold (p.A)
0.5 Model Size
(b)
Fig. 7. Test escapes. a) Good devices failed. b) Bad devicespassed. Number of test vectors was 20.
Another useful experiment considers the effect ofpre-sorting IDDQdata on the outcome of the Delta
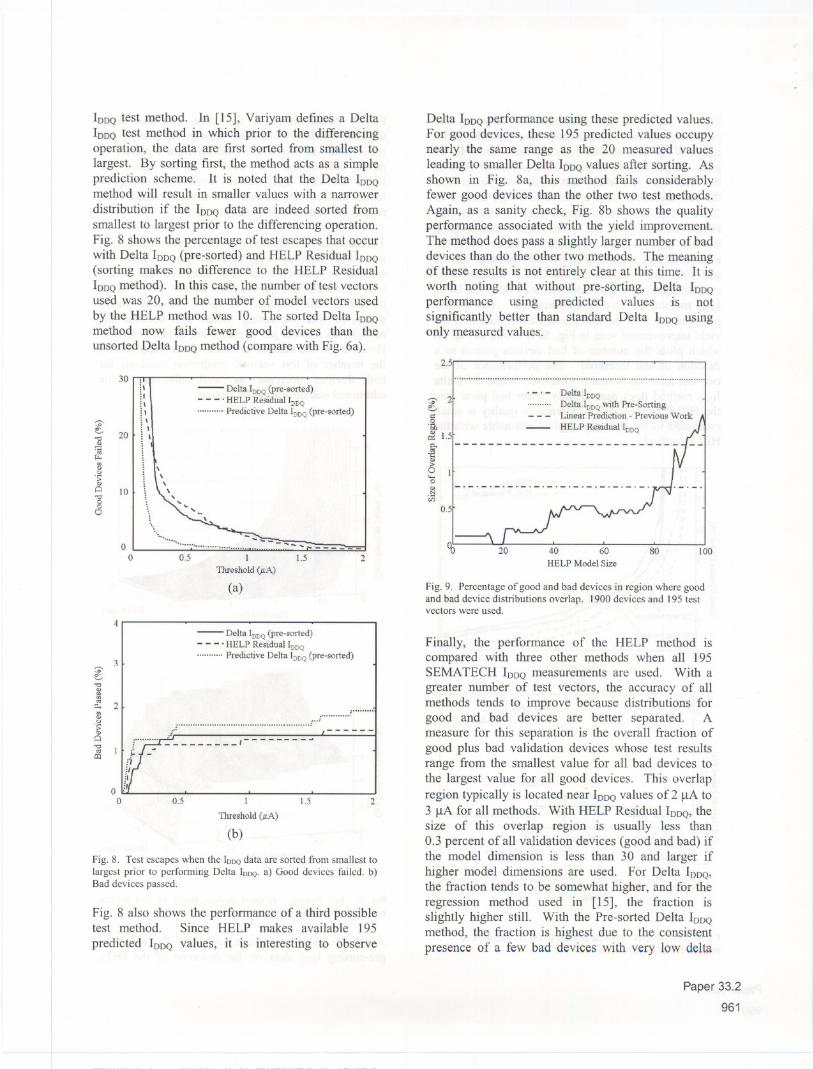
IDDQtest method. In [15], Variyam defines a DeltaIDDQtest method in which prior to the differencingoperation, the data are first sorted from smallest tolargest. By sorting first, the method acts as a simpleprediction scheme. It is noted that the Delta IDDQmethod will result in smaller values with a narrowerdistribution if the IDDQdata are indeed sorted fromsmallest to largest prior to the differencing operation.Fig. 8 shows the percentage of test escapes that occurwith Delta IDDQ(pre-sorted) and HELP Residual IDDQ(sorting makes no difference to the HELP ResidualIDDQmethod). In this case, the number of test vectorsused was 20, and the number of model vectors usedby the HELP method was 10. The sorted Delta IDDQmethod now fails fewer good devices than theunsorted Delta IDDQmethod (compare with Fig. 6a).
..-..~"d~~'"!I)<;)
'>!I)o"do
8
30. ,I,,,\
- Delta IDDQ(pre-sorted)
- - - .HELP Residual IDDQ
Predictive Delta IDDQ(pre-sorted)
20
10
oo 0.5 1
Threshold (p.A)
(a)
1.5 2
- Delta IDDQ(pre-sorted)- - - . HELP Residual IDDQ
Predictive Delta IDDQ(pre-sorted)
~......................................................................
('~- - - - - - - - ,- - - - -- - - -;i§J;1:/,
------
0.5 1
Threshold (!LA)
1.5
(b)
Fig. 8. Test escapes when the IDDQdata are sorted from smallest tolargest prior to performing Delta IDDQ.a) Good devices failed. b)Bad devices passed.
Fig. 8 also shows the performance of a third possibletest method. Since HELP makes available 195predicted IDDQvalues, it is interesting to observe
Delta IDDQperformance using these predicted values.For good devices, these 195 predicted values occupynearly the same range as the 20 measured valuesleading to smaller Delta IDDQvalues after sorting. Asshown in Fig. 8a, this method fails considerablyfewer good devices than the other two test methods.Again, as a sanity check, Fig. 8b shows the qualityperformance associated with the yield improvement.The method does pass a slightly larger number of baddevices than do the other two methods. The meaningof these results is not entirely clear at this time. It isworth noting that without pre-sorting, Delta IDDQperformance using predicted values is notsignificantly better than standard Delta IDDQusingonly measured values.
2.5........................................................................................................
~ 21
j 1.51
to.....o~i:;;)
0.5
Delta IDDQ
Delta IDDQwith Pre-SortingLinear Prediction - Previous Work
HELP Residual IDDQ
---------------------------
-.-.-.-.-.-.-.-.-.-.-.-.-.-.--
Qo 20 40 60HELP Model Size
80 100
Fig. 9. Percentage of good and bad devices in region where goodand bad device distributions overlap. 1900 devices and 195 testvectors were used.
2
Finally, the performance of the HELP method iscompared with three other methods when all 195SEMATECH IDDQmeasurements are used. With agreater number of test vectors, the accuracy of allmethods tends to improve because distributions forgood and bad devices are better separated. Ameasure for this separation is the overall fraction ofgood plus bad validation devices whose test resultsrange from the smallest value for all bad devices tothe largest value for all good devices. This overlapregion typically is located near IDDQvalues of 2 j..lAto3 j..lAfor all methods. With HELP Residual IDDQ,thesize of this overlap region is usually less than0.3 percent of all validation devices (good and bad) ifthe model dimension is less than 30 and larger ifhigher model dimensions are used. For Delta IDDQ,the fraction tends to be somewhat higher, and for theregression method used in [15], the fraction isslightly higher still. With the Pre-sorted Delta IDDQmethod, the fraction is highest due to the consistentpresence of a few bad devices with very low delta
Paper33.2961
4
..-.. 3
"d
«IIl. 2'"!I)<;)
'>Q)0"d«Ico
00
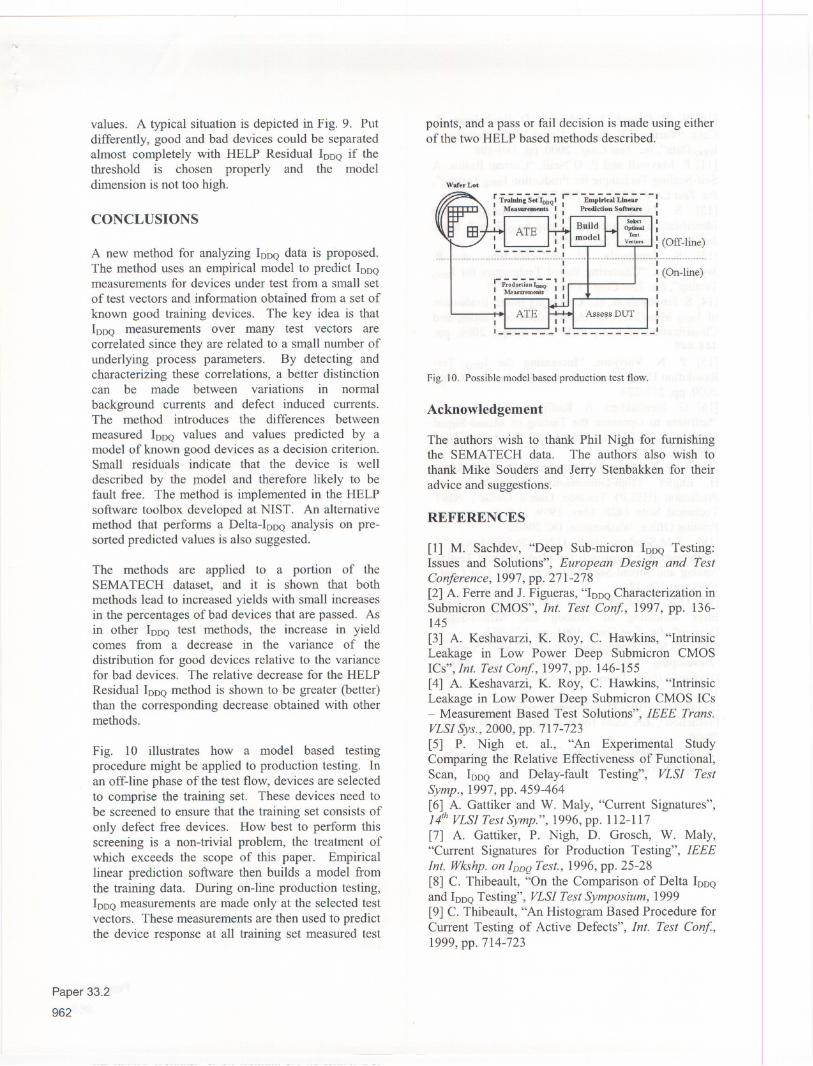
values. A typical situation is depicted in Fig. 9. Putdifferently, good and bad devices could be separatedalmost completely with HELP Residual IDDQif thethreshold is chosen properly and the modeldimension is not too high.
CONCLUSIONS
A new method for analyzing IDDQdata is proposed.The method uses an empirical model to predict IDDQmeasurements for devices under test from a small setof test vectors and infonnation obtained from a set ofknown good training devices. The key idea is thatIDDQmeasurements over many test vectors arecorrelated since they are related to a small number ofunderlying process parameters. By detecting andcharacterizing these correlations, a better distinctioncan be made between variations in nonnalbackground currents and defect induced currents.The method introduces the differences betweenmeasured IDDQvalues and values predicted by amodel of known good devices as a decision criterion.Small residuals indicate that the device is welldescribed by the Jl10deland therefore likely to befault free. The method is implemented in the HELPsoftware toolbox developed at NIST. An alternativemethod that perfonns a Delta-IDDQanalysis on pre-sorted predicted values is also suggested.
The methods are applied to a portion of theSEMATECH dataset, and it is shown that bothmethods lead to increased yields with small increasesin the percentages of bad devices that are passed. Asin other IDDQtest methods, the increase in yieldcomes from a decrease in the variance of thedistribution for good devices relative to the variancefor bad devices. The relative decrease for the HELPResidual IDDQmethod is shown to be greater (better)than the corresponding decrease obtained with othermethods.
Fig. 10 illustrates how a model based testingprocedure might be applied to production testing. Inan off-line phase of the test flow, devices are selectedto comprise the training set. These devices need tobe screened to ensure that the training set consists ofonly defect free devices. How best to perfonn thisscreening is a non-trivial problem, the treatment ofwhich exceeds the scope of this paper. Empiricallinear prediction software then builds a model fromthe training data. During on-line production testing,IDDQmeasurements are made only at the selected testvectors. These measurements are then used to predictthe device response at all training set measured test
Paper 33.2962
points, and a pass or fail decision is made using eitherof the two HELP based methods described.
Wafer Lot
Fig. 10. Possible model based production test flow.
Acknowledgement
The authors wish to thank Phil Nigh for furnishingthe SEMATECH data. The authors also wish tothank Mike Souders and Jerry Stenbakken for theiradvice and suggestions.
REFERENCES
[1] M. Sachdev, "Deep Sub-micron IDDQTesting:Issues and Solutions", European Design and TestConference, 1997,pp.271-278[2] A. Ferre and J. Figueras, "IDDQCharacterization inSubmicron CMOS", Int. Test Conf, 1997, pp. 136-145[3] A. Keshavarzi, K. Roy, C. Hawkins, "IntrinsicLeakage in Low Power Deep Submicron CMOSICs", Int. Test Conf, 1997, pp. 146-155[4] A. Keshavarzi, K. Roy, C. Hawkins, "IntrinsicLeakage in Low Power Deep Submicron CMOS ICs- Measurement Based Test Solutions", IEEE Trans.VLSISys., 2000, pp. 717-723[5] P. Nigh et. aI., "An Experimental StudyComparing the Relative Effectiveness of Functional,Scan, IDDQand Delay-fault Testing", VLSI TestSymp., 1997, pp. 459-464[6] A. Gattiker and W. Maly, "Current Signatures",llh VLSITestSymp.", 1996,pp.1l2-117[7] A. Gattiker, P. Nigh, D. Grosch, W. Maly,"Current Signatures for Production Testing", IEEEInt. Wkshp. on IDDQTest., 1996,pp. 25-28[8] C. Thibeault, "On the Comparison of Delta IDDQand IDDQTesting", VLSI Test Symposium, 1999[9] C. Thibeault, "An Histogram Based Procedure forCurrent Testing of Active Defects", Int. Test Conf.,1999, pp. 714-723

[10] W. R. Daasch, J. MeNames, D. Bockelman, K.Cota, "Variance Reduction Using Wafer Patterns inIooQData", Int. Test Conf., 2000, pp. 189-198[11] P. Maxwell and P. O'Neill, "Current Ratios: ASelf-Scaling Technique for Production IooQTesting",Int. Test Conf, 1999, pp. 738-746[12] S. JanQhyala et. aI, "Clustering BasedIdentification of faulty ICs Using IooQTests", IEEEInt. Wkshp.on IDDQTest., 1998[13] S. Jandhyala, H. Balachandran, A. P.Jayasumana, "Clustering Based Techniques for IooQTesting", Int. Test Conf, 1999, pp. 730-737[14] S. Jandhyala et. aI, "Clustering Based Evaluationof IOOQMeasurements: Applications in Testing andClassification of ICs", VLSI Test Symp., 2000, pp.444-449
[15] P. N. Variyam, "Increasing the IOOQTestResolution Using Current Prediction", Int. Test Conf.,2000, pp. 217-224[16] G. Stenbakken, A. Koffman, T.M. Souders,"Software to Optimize the Testing of Mixed-SignalDevices", IEEE Int. Mixed-Sig. Testing Wkshp.,1999, pp. 29-33[17] A. D. Koffman, T,M.Souders, G.N. Stenbakken,H. Engler "High-Dimensional Empirical LinearPrediction (HELP) Toolbox User's Guide", NISTTechnical Note 1428, May, 1999, U.S. GovernmentPrinting Office, Washington, DC 20402[18] T.M.Souders and G.N. Stenbakken, "AComprehensive Approach for Modeling and TestingAnalog and Mixed-Signal Devices", Int. Test Conf,1990, pp. 169-176[19] G.N. Stenbakken and T.M. Souders, "LinearError Modeling of Analog and Mixed-SignalDevices", Int. Test Conf, 1991,pp. 573-581[20] G.N. Stenbakken and T.M. Souders,"Developing Linear Error Models for AnalogDevices", IEEE Trans. Instr. Meas., 1994, pp. 157-163
[21] H. Liu, "High-DimensionalEmpirical LinearPrediction", Adv Math Tools in Metrol 3, 1997, pp.79-90[22] I. T. Jolliffe, "Principal Component Analysis",Springer-Verlag, New York, 1986.
Paper 33.2
963
- ---