
IMPRINT - ecreee.org · 5 -a electricite en cote ivoire. Page | 19 3.1.3 Share of ECOWAS...
49
Transcript of IMPRINT - ecreee.org · 5 -a electricite en cote ivoire. Page | 19 3.1.3 Share of ECOWAS...

Page | 2
IMPRINT
Regional Progress Report on Renewable Energy, Energy Efficiency and Energy Access in ECOWAS region
Monitoring year: 2016
August 2018 Disclaimer: This publication and the material featured herein are provided “as is”, for informational purposes. Neither ECREEE nor any of its officials, agents, data or other third-party content providers provides any warranty as to the accuracy of the information and material featured in this publication, or regarding the non-infringement of third-party rights, and they accept no responsibility or liability with regard to the use of this publication and the material featured therein. Authors: Nikos Sakellariou, Daniel Paco (ECREEE), Lucius Mayer-Tasch (GIZ), Mohamed Youba Sokona (GIZ),
Nathalie Weisman (ECREEE), Nana Bonsu Owusu-Nyantekyi (ECREEE)
Contact: ECOWAS Centre for Renewable Energy and Energy Efficiency (ECREEE) Achada Santo António, 2nd floor, Electra Building C.P. 288, Praia, Cabo Verde [email protected] www.ecreee.org
Page | 3
ABBREVIATIONS
AA Action Agenda
ABREC African Biofuel & Renewable Energy Company
ADEME Agence de l’Environnement et de la maîtrise de l’énergie (Senegal)
AEME Agence pour l’Économie et la maîtrise de l’énergie (Senegal)
AfDB African Development Bank
AMADER Agence Malienne pour le Développement de l'Energie Domestique et l'Electrification Rurale (Mali)
ARSE Autorité de Reglementation du Sous- Secteur de l'Électricité (Burkina Faso)
ARSE Autorité de Reglementation du Secteur de l'Électricité (Togo)
ASN Agence Sénégalaise de Normalisation
CEB Communauté Electrique du Bénin
CEMG Clean Energy Mini-Grid
CFL Compact Fluorescent Light (bulbs)
CIE Compagnie Ivoirienne d'Électricité
CRSE Commission de Regularisation du Secteur de l’Électricité (Senegal)
DFID Department for International Development (UK)
ECG Electricity Company of Ghana Limited
ECOSHAM ECOWAS Standards Harmonization Model
ECOWAS Economic Community of West African States
ECREEE ECOWAS Centre for Renewable Energy and Energy Efficiency
EE Energy Efficiency
EEEP ECOWAS Energy Efficiency Policy
EDG Électricité De Guinée
EDM Énergie Du Mali
ELECTRA Empresa de Electricidade e Água, SARL. (Cabo Verde)
EREP ECOWAS Renewable Energy Policy
EU European Union
FCFA Franc Communauté Financière Africaine
FONSIS Fond Souverain d’Investissement Stratégique (Senegal)
GEF Global Environmental Facility
GIZ Deutsche Gesellschaft für Internationale Zusammenarbeit (Germany)
GDP Gross Domestic Product
GNI Gross National Income
GRIDCo Ghana Grid Company Limited
GW / GWh Gigawatt / Gigawatt hour
HH Household
HV High Voltage
ICS Improved Cook-Stoves
IFI International Financial Institution
IP Investment Prospectus
IPP Independent Power Producer

Page | 4
kW / kWh Kilowatt / Kilowatt Hour
LBC Low Consumption Lights
LCL Low Consumption Lights
LEC Liberia Electricity Corporation
LED Light Emitting Diode
LMSH Large and Medium Scale Hydro
LPG Liquefied Petroleum Gas
LV Low Voltage
MEPS Minimum Energy Performance Standards
MFA Modern Fuel Alternatives
MTF Multi-Tier Framework
MV Medium Voltage
MW / MWh Megawatt / Megawatt hour
NAWEC Gambia National Water & Electric Company
NEEAP National Energy Efficiency Action Plan
NERC Nigerian Electricity Regulatory Commission
NESP Nigerian Energy Support Program
NIGELEC Société Nigerienne d'Electricité
NREAP National Renewable Energy Action Plan
PERACOD Program for the promotion of renewable energy, energy efficiency and access to energy services
PPA Purchase Power Agreement
PV Photovoltaic
RE Renewable Energy
REA Rural Electrification Agency
RREP Rural Renewable Energy Programme
SBEE Société Béninoise d'Energie Electrique (Benin)
SEFA Sustainable Energy Fund for Africa
SEforALL Sustainable Energy for All
SENELEC Société nationale d'électricité du Sénégal
SHS Solar Home System
SHP Small Hydro Power
SME Small Medium sized Enterprise
SWH Solar Water Heaters
ToR Terms of Reference
UEMOA Union Economique et Monétaire des Etats de l’Afrique de L’Ouest
UNDP United Nations Development Programme
UNEP United Nations Environment Programme
USD United States Dollars
WAPP West African Power Pool
WB World Bank

Page | 5
FOREWORD
In 2016, the ECOWAS Energy Ministers approved the Regional Monitoring and Reporting Framework for the ECOWAS Renewable Energy and Energy Efficiency Policies and the Sustainable Energy Country Action Plans. This framework was developed by the ECOWAS Centre for Renewable Energy and Energy Efficiency (ECREEE) a year earlier before its approval, had gone through extensive stakeholder consultation and validation. The agenda of universal access to energy by 2030 in ECOWAS is still achievable if all the plans that have been developed by the various countries are implemented. To ensure that the ECOWAS region attains its renewable energy, energy efficiency and energy access targets, the ECOWAS authorities mandated ECREEE to assist the member states in translating the regional policies into national targets and actions. ECREEE has been at the forefront of helping governments to adopt various initiatives and to help them plan and implement them. Some of the initiatives are Sustainable Energy For All (SEforALL), National Renewable Energy and Energy Efficiency Action Plans (NREAPs and NEEPs) as well as country initiatives. In order to assess whether these action plans
are being implemented, ECREEE was also mandated to assess and report on the status of progress based on contributions from all member states on a yearly basis. This report “Regional Progress report on Renewable Energy, Energy Efficiency and Energy Access in the ECOWAS region” is the first after the approval in 2016. It shows that great advances are being made in areas like grid-connected solar PV and the development of the market of small, affordable PV systems for lighting and other basic energy needs. The report provides the relevant information on the renewable energy, energy efficiency and energy access sector. Despite the challenge of lack of adequate data, the step taken to assess ourselves as a region is very key towards the 2030 agenda. With increased efforts to improve data availability, future editions of this report are expected to be even more informative and provide a more complete and accurate picture of where the region stands on its path towards attaining sustainable energy for all.
ECREEE remains committed to designing and implementing interventions in the broad program areas of Renewable Energy (RE) and Energy Efficiency (EE), making use of the resources that it is entrusted with, in order to support regional and national efforts at meeting RE & EE targets.
______________________________ Mr. Mahama Kappiah, Executive Director ECREEE
Mr. Mahama Kappiah, Executive Director
ECOWAS Centre for Renewable Energy and Energy
Efficiency (ECREEE)
Page | 6
ACKNOWLEDGEMENTS
ECREEE would like to thank in particular the institutions and individuals from the 15 ECOWAS countries who contributed data and information for this report, namely: Salim Mouléro Chitou (Benin - Ministère de l’Energie et de l’Eau), Abdoul Karim Kagone (Burkina Faso - Ministère des Mines et de l'Energie), Jaqueline Pina (Cabo Verde – Ministério da Economia e Emprego), Kouhie Guei Guillaume Fulbert (Côte d’Ivoire - Ministère de l’Energie), Sanna Fatajo (Gambia – Ministry of Energy), Linda Ethel Mensah and Salifu Addo (Ghana – Energy Commission), Ibrahima Diallo (Guinea - Ministère de l’Energie et de l’Hydraulique), Julio Antonio Raul (Guinea Bissau - Ministério da Energia), Nanlee Johnson (Liberia – Ministry of Lands, Mines and Energy), Mahamoud Traore (Mali – Ministère de l’Energie et de l’Eau), Moudahirou Assoumane and Rabiou Balla (Niger - Ministère de l’Energie et du Pétrole), Temitope Dina (Nigeria – Federal Ministry of Power), Fatou Thiam Sow (Senegal – Ministère du Pétrole et des Energies), Millicent Lewis-Omuju (Sierra Leone – Ministry of Energy and Water Resources) and Assih Hodabalo (Togo - Ministère des Mines et de l’Energie). In addition, we would like to thank Deutsche Gesellschaft für Internationale Zusammenarbeit (GIZ) on behalf of the German Federal Ministry of Economic Development (BMZ) and Expertise France for their technical and financial support.

Page | 7
TABLE OF CONTENTS
1 INTRODUCTION ........................................................................................................................................ 12
1.1 Background on regional targets and the regional monitoring framework ............................................... 12
2 OBJECTIVE, METHODOLOGY AND DATA COLLECTION ..................................................................... 13
3 STATUS OF ENERGY ACCESS, RENEWABLE ENERGY AND ENERGY EFFICIENCY IN THE
ECOWAS REGION ............................................................................................................................................ 15
3.1 Energy access ........................................................................................................................................ 15
3.1.1 Access to electricity ......................................................................................................................... 16
3.1.2 Access to the electricity grid ............................................................................................................ 16
3.1.3 Share of ECOWAS population served by renewable energy/hybrid mini-grids .............................. 19
3.1.4 Access to RE stand-alone systems ................................................................................................. 21
3.1.5 Access to modern cooking energy .................................................................................................. 23
3.2 Renewable energy .................................................................................................................................. 26
3.2.1 Renewable energy installed capacity .............................................................................................. 26
3.2.2 Renewable energy generation ........................................................................................................ 28
3.2.3 Solar Water Heaters ........................................................................................................................ 29
3.2.4 Bioethanol production ...................................................................................................................... 30
3.3 Energy efficiency .................................................................................................................................... 32
3.3.1 Commercial, technical and total distribution losses in the region.................................................... 32
3.3.2 Energy-efficient lighting ................................................................................................................... 33
3.3.3 Energy-efficient electric appliances ................................................................................................. 36
3.3.4 Energy efficiency in buildings .......................................................................................................... 37
3.3.5 Energy efficiency in industry ............................................................................................................ 38
4. PROGRESS ON THE IMPLEMENTATION OF THE SEFORALL INITIATIVE IN THE REGION .............. 39
5. HIGHLIGHT OF THE YEAR: SUBSTANTIAL EXPANSION OF GRID-CONNECTED RE CAPACITY IN
SENEGAL .......................................................................................................................................................... 40
6. RECOMMENDATIONS .............................................................................................................................. 42
7. REFERENCES ........................................................................................................................................... 43
ANNEX 1: DEFINITIONS .................................................................................................................................. 46
ANNEX 2: ON-GRID RE PLANTS IN THE ECOWAS REGION ....................................................................... 47
ANNEX 3: UTILITY CUSTOMERS .................................................................................................................... 49
Page | 8
LIST OF TABLES
Table 1: Main targets contained in the regional RE and EE policies ................................................................ 12
Table 2: Number and share of households connected to an electricity grid ..................................................... 18
Table 3: Number and RE capacity of CEMGs ................................................................................................... 19
Table 4: Number and share of households connected to stand-alone RE systems ......................................... 22
Table 5: Sold or distributed SHS ....................................................................................................................... 22
Table 6: Sold or distributed pico PV and SHS ................................................................................................... 23
Table 7: Census results on use of alternative fuels ........................................................................................... 23
Table 8: Improved cook-stoves efficiency/fuel use sub-tiers ............................................................................. 25
Table 9: Available power installed capacity in the ECOWAS region ................................................................. 27
Table 10: Renewable energy IPP tenders in ECOWAS region ......................................................................... 27
Table 11: On-grid renewable energy generation in the ECOWAS region ......................................................... 28
Table 12: Solar thermal capacity per sector ...................................................................................................... 29
Table 13: Bioethanol and biodiesel production in the ECOWAS region ........................................................... 30
Table 14: Distributed LED lights per country ..................................................................................................... 35
Table 15: Number of efficient lamps and solar lights in the ECOWAS region .................................................. 35
Table 16: National EE standards for electric lights ............................................................................................ 35
Table 17: Countries that have introduced national MEPS for electric appliances ............................................ 36
Table 18: Operational grid-connected solar PV plants in Senegal .................................................................... 40
LIST OF FIGURES
Figure 1: Access to energy technologies considered in the report ................................................................... 15
Figure 2: Historical evolution of electrification rates in ECOWAS countries ..................................................... 16
Figure 3: Historical evolution of access to electricity in the ECOWAS region ................................................... 17
Figure 4: Share of households connected to grid per country .......................................................................... 17
Figure 5: Access to electricity grid versus GNI per capita ................................................................................. 18
Figure 6: Existing CEMGs in the ECOWAS region ........................................................................................... 21
Figure 7: Share of households using modern cooking solutions ....................................................................... 24
Figure 8: Share of households with improved cook-stoves ............................................................................... 24
Figure 9: RE capacity (excluding medium and large hydro).............................................................................. 26
Figure 10: Technical transmission and distribution losses ................................................................................ 32
Figure 11: Non-technical losses in the ECOWAS region .................................................................................. 33
Figure 12: Access to electricity trajectories for the ECOWAS countries ........................................................... 39
Page | 9
LIST OF BOXES
BOX 1. COUNTRY INFORMATION ON RE MINI-GRIDS ................................................................................ 20
BOX 2. RENEWABLE ENERGY IPP TENDERS: A NEW TREND IN THE ECOWAS REGION ..................... 27
BOX 3. COUNTRY INFORMATION ON SOLAR WATER HEATERS .............................................................. 29
BOX 4. Bioethanol production in Sierra Leone .................................................................................................. 31
BOX 5. COUNTRY INFORMATION ON ENERGY EFFICIENT LIGHTING ..................................................... 34
BOX 6. Two Nigerian Firms Received ISO 50001:2011 Certifications ............................................................. 38

Page | 10
EXECUTIVE SUMMARY
The ECOWAS region has experienced continuous economic growth since 2000. The regional Gross Domestic Product (GDP) has risen from US $84 million in 2000 (at purchaser’s prices) to US $625 million in 2015. This represents an increase of more than 700%. Similarly, the weighted Gross National Income (GNI) per capita has increased more than 600% from US $315 in 2000 to US $1925 in 2015. This economic development has subsequently improved various quality of life indicators such as the life expectancy, which has increased approximately 10 years from 50 – 60 years since 2000. The mortality rate of children under five years old (measured per 1,000 live births) has decreased by 50% from 160 in 2000 to 80 in 2015. The per capita consumption of electricity increased from approximately 125 kWh/cap/year to 200 kWh/cap/year over the same period, which is an increase of 60%. The Sustainable Energy for All (SEforALL) objectives are high on the agenda of the ECOWAS countries. As a result, they have adopted the targets for renewable energy (RE), energy efficiency (EE) and access to energy as well as ambitious regional policies for RE and EE. The ECOWAS Renewable Energy Policy (EREP) aims to ensure a higher proportion of RE sources in the energy supply and to increase access to electricity, especially in rural areas. The policy primarily focuses on the electricity sector, but also considers other types of energy including the use of heat in the domestic energy sector and biofuels for transport. One of the key EREP goals is to increase the share of RE in the region’s overall electricity mix to 10% by 2020 and 19% in 2030. When factoring in large-hydro, the share would reach 35% in 2020 and 48% in 2030. Furthermore, it aims to serve 25% of the rural ECOWAS population with RE-based mini-grids and stand-alone systems by 2030. Large and medium scale hydropower (LMSH) plants play a significant role in the region’s electricity supply. With more than 5 GW of installed capacity, LMSH provides approximately 45% of the electricity generated. On the other hand, grid-connected RE (small hydro, solar PV, wind, biomass) still contribute to less than 2% of installed capacity. In view of the large pipeline of RE projects, all RE sources are expected to increase their capacity significantly in the coming years. The ECOWAS Energy Efficiency Policy (EEEP) looks to implement efficiency measures that free-up 2,000 MW of power generation capacity by 2020. The ECOWAS region has also pledged to achieve Sustainable Development Goal (SDG) 7, which calls for doubling the rate of energy efficiency improvement by 2030. In different sectors, planned and on-going improvements to the institutional and legislative frameworks are being made. These improvements include among others: the domestic sector (e.g. promotion of efficient lighting and efficient electrical appliances), the public and industrial sectors (energy efficiency improvements in public buildings, efficient energy usage in industrial processes) and the electricity sector (reduction of losses in the transmission and distribution networks). As electricity generation capacity increases, reducing the technical losses in the transmission and distribution networks will be of increasing importance. Although losses in the networks have been decreasing overtime, the regional generation loss range (15-40%) still falls short of the 10% target. Non-technical losses are a big burden for the financial viability of the utilities and undermine the development, maintenance and expansion of the transmission networks. Increasing the market share of efficient lighting in the region also plays a significant role in the efforts to free-up energy capacity. In this context, several million Compact Fluorescent Lights (CFL) and Light Emitting Diode (LED) lamps have been sold and/or distributed in several countries across West Africa. This document is the first Regional Progress Report that is based on the ‘Regional Monitoring and Reporting Framework for the ECOWAS Renewable Energy and Energy Efficiency Policies and the Sustainable Energy Country Action Plans’ (short: Regional Monitoring Framework).
Page | 11
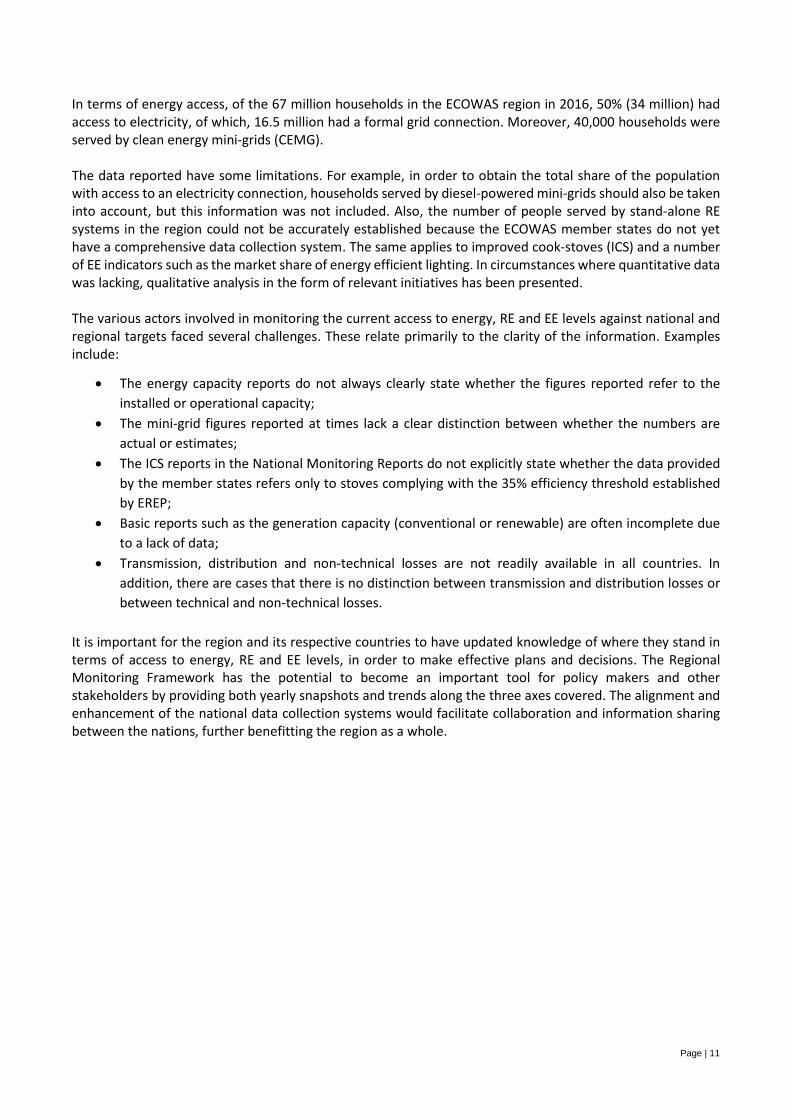
In terms of energy access, of the 67 million households in the ECOWAS region in 2016, 50% (34 million) had access to electricity, of which, 16.5 million had a formal grid connection. Moreover, 40,000 households were served by clean energy mini-grids (CEMG). The data reported have some limitations. For example, in order to obtain the total share of the population with access to an electricity connection, households served by diesel-powered mini-grids should also be taken into account, but this information was not included. Also, the number of people served by stand-alone RE systems in the region could not be accurately established because the ECOWAS member states do not yet have a comprehensive data collection system. The same applies to improved cook-stoves (ICS) and a number of EE indicators such as the market share of energy efficient lighting. In circumstances where quantitative data was lacking, qualitative analysis in the form of relevant initiatives has been presented. The various actors involved in monitoring the current access to energy, RE and EE levels against national and regional targets faced several challenges. These relate primarily to the clarity of the information. Examples include:
The energy capacity reports do not always clearly state whether the figures reported refer to the
installed or operational capacity;
The mini-grid figures reported at times lack a clear distinction between whether the numbers are
actual or estimates;
The ICS reports in the National Monitoring Reports do not explicitly state whether the data provided
by the member states refers only to stoves complying with the 35% efficiency threshold established
by EREP;
Basic reports such as the generation capacity (conventional or renewable) are often incomplete due
to a lack of data;
Transmission, distribution and non-technical losses are not readily available in all countries. In
addition, there are cases that there is no distinction between transmission and distribution losses or
between technical and non-technical losses.
It is important for the region and its respective countries to have updated knowledge of where they stand in terms of access to energy, RE and EE levels, in order to make effective plans and decisions. The Regional Monitoring Framework has the potential to become an important tool for policy makers and other stakeholders by providing both yearly snapshots and trends along the three axes covered. The alignment and enhancement of the national data collection systems would facilitate collaboration and information sharing between the nations, further benefitting the region as a whole.

Page | 12
1 INTRODUCTION
1.1 Background on regional targets and the regional monitoring framework
The ECOWAS Ministers in charge of energy have expressed their willingness to work towards the achievement of the SEforALL targets in West Africa. In October 2012, they mandated ECREEE to coordinate and implement the SEforALL initiative. In July 2013, the ECOWAS Heads of State adopted the ECOWAS Renewable Energy Policy (EREP) and the ECOWAS Energy Efficiency Policy (EEEP). ECREEE will again lead efforts to implement and monitor these policies.
The main targets contained in both policies are summarised in Table 1 below.
Table 1: Main targets contained in the regional RE and EE policies
2020 2030
Renewable energy
Installed RE capacity (excl. medium and large hydro) 2,425 MW 7,606 MW
RE in electricity mix (excl. medium and large hydro) 5% 12%
RE in electricity mix (incl. medium and large hydro) 35% 58%
Share of (rural) population served with off-grid RE systems 22% 25%
Ethanol as share of gasoline consumption 5% 15%
Biodiesel as share of diesel and fuel-oil consumption 5% 10%
Improved cook stoves penetration 100% 100%
Use of modern fuel alternatives for cooking (e.g. LPG) 36% 41%
Solar Water Heaters - Residential houses (new detached house price higher than
€75,000) - Social institutions - Agro-food industries - Hotels
At least 1/house
25% 10% 10%
At least 1/house
50% 25% 25%
Energy efficiency
Implement EE measures that free-up 2,000 MW of power generation capacity
n/a
Distribution losses in 2020 Max. 10%
Penetration rate efficient bulbs 100% 100%
EE in public buildings larger than 500 m2 (new or renovation): implement EE measures and issue energy performance certificate
100% 100%
As part of the next phase of the regional policies adoption, all ECOWAS member states developed in 2014 and 2015 National Renewable Energy Action Plans (NREAPs), National Energy Efficiency Action Plans (NEEAPs) and SEforALL Action Agendas (collectively referred to as the Sustainable Energy Country Action Plans), whose implementation is expected to contribute to the achievement of the regional targets. The Sustainable Energy Country Action Plans are based on templates proposed by ECREEE and validated by the member states. The action plans were presented for discussion at the ECOWAS Sustainable Energy Policy and Investment Forum in Abidjan in September 2015. During the meeting, ECREEE presented a draft of the ‘Regional Monitoring and Reporting Framework for the ECOWAS Renewable Energy and Energy Efficiency Policies and the Sustainable Energy Country Action Plans’. The framework was validated during the ECOWAS Sustainable Energy Workshop held in Dakar in April 2016. The Regional Monitoring Framework was also approved by the 11th Meeting of the ECOWAS Energy Ministers held in Conakry, Guinea in December 2016. In the resolution that adopted the framework, all member states were required to nominate national focal persons who are responsible for compiling and submitting annual

Page | 13
National Monitoring Reports to ECREEE. These reports should present the most recent data concerning the status of achievement of the targets stated in their NREAPs, NEEAPs and SEforALL Action Agendas, as well as a summary of the main activities implemented in pursuance of the achievement of the targets during the previous year. The reports for each year have to be submitted to ECREEE latest by August of the following year (i.e. 2016 report submitted no later than August 2017). From these reports, ECREEE will assess the implementation levels of the regional policies on an annual basis.
2 OBJECTIVE, METHODOLOGY AND DATA COLLECTION
The prime objective of this report is to provide an assessment of the renewable energy, energy efficiency and access to energy levels in the ECOWAS region at the end of 2016. It will identify gaps between trends at the end 2016 and the set targets for 2020 and 2030. In order to assess each year’s regional profile and to track progress along the three axes, data and information were collected from all 15 countries of the ECOWAS region. ECREEE collected consistent and comparable information from each country to maximise data aggregation for a regional overview. A template for the National Monitoring Reports was distributed to the national focal person of each member state and was returned to ECREEE by August 2017. To further facilitate the implementation of the Regional Monitoring Framework objectives, a workshop with the 15 national focal persons was held in Abidjan in November 2017.1 The goal of the workshop was to explain the importance and principals of the Regional Monitoring Framework to the member states’ representatives and discuss common challenges and solutions regarding the collection of data and information.
Group image of the regional workshop held in Abidjan in November 2017
There are two main types of information collected and presented:
(i) Quantitative data, such as the installed generation capacity or the population size, and
(ii) Qualitative data through surveys, such as the market penetration rate of efficient lighting or ICS.
When possible, primary data sources will take precedent but in circumstances where there is a significant lack of data, secondary sources were accepted. Examples include data from international organisations or reports published by other credible third-party institutions.
1 http://www.ecreee.org/event/regional-workshop-re-ee-and-energy-access-monitoring-and-reporting-framework

Page | 14
Demographic data such as population size, number of households and average household size were collected from the national statistics bureaus. In cases where current year census data was available, the most recent report was used. Data for the installed electricity capacity was gathered from utilities, regulators or ministries. However, aggregating and comparing the data across various sources require manipulating it as it is not provided in a consistent format. Furthermore, it is not always clear from the utility information, whether it refers to installed, available or operational capacity. Similarly, the electricity generation capacity data used is primarily provided by the utilities, but in necessary cases, data published by government institutions was preferred. A prime example is the Energy Commission of Ghana, which publishes energy generation data on a monthly basis.2 The Regional Monitoring Framework does not include imported electricity in its generation data. Access to electricity is assessed as the share of households connected to the electricity grid and is measured during the censuses. These censuses are considered credible sources of information and importantly cover the entire population of a given country. The most recent censuses in the ECOWAS countries have taken place between 2008 and 2016. Hence, the energy access data sourced from these reports does not refer to the same year for each country. In addition, the number of households served by the grid according to the censuses often does not coincide with the number of connections to the grid. In order to enable the aggregation of data, the number of utility customers has been collected and combined with population data to calculate the share (as a more credible and controllable metric of the grid electricity access rate). Such information is obtained from utility reports that are published on a yearly basis by the many utilities in the region. Access to clean cooking is measured in terms of use of ICS and use of alternative fuels, such as LPG, as a share of households. The use of alternative cooking fuels is explicitly measured in the censuses, which normally include a question on the primary household cooking fuel. On the contrary, ICS are not explicitly covered by the censuses, meaning any available data is not representative of the entire population and in many cases are only estimates. To assess the ICS market, information from relevant distribution initiatives has been collected, along with related sales figures. The disadvantage of such data is that it does not directly indicate the actual usage of ICS. In addition, the framework mandates that only ICS units with a minimum efficiency of 35%3 should be reported. These data collection methods do not permit the discerning of the minimum efficiency levels of ICS units. Off-grid electrification data should be collected by the Rural Electrification Authorities (REA) or mini-grid operators. The same applies for stand-alone RE systems. For this reason, ECREEE requested the national focal persons to provide information on the number of such systems distributed or sold. In parallel to the national focal persons’ efforts, ECREEE tried to obtain the same kind of information from different sources including donor reports. Information on sales and installation can be found from distributors or installers of stand-alone RE systems as well. Data on the number of CEMGs in the region comes mainly from the REAs, which implement the rural electrification strategies of their respective countries and disseminate relevant information. In this first report, there is no quantitative way for assessing the penetration rate of energy-efficient lights. Information has been collected based on the results of initiatives undertaken by various actors as well as on the sales of energy-efficient lights in individual countries. In addition, ECREEE provides updates on initiatives that have been launched by the governments (e.g. the legislation banning incandescent lamps, the introduction of standards and labels, etc.). These updates keep each country accountable to ensure the regional and national goals are met. In a similar manner, energy efficient buildings are being identified and
2 The Ghana wholesale electricity market bulletin, that is available for download on the Energy Commission website, reports about developments in Ghana’s wholesale electricity market on a monthly basis. 3 The ECOWAS Renewable Energy Policy (EREP) defines “improved cook-stoves” as fuelwood or charcoal stoves with a minimum efficiency of 35%.
Page | 15
recorded, although they have not yet reached a ratio comparable to the total number of buildings in the region. The same applies to Solar Water Heater (SWH) systems, which is another market segment where there is no concrete data. Since the ECOWAS member states do not use a defined system for registering all SWH sales and installations, the only collectable data is from relevant projects that are referenced in the report. A similar reporting and data collection approach is also being followed for the production of biofuels in the region. Reports on industries that have implemented energy efficiency measures are compiled via secondary data sources as there is a lack of data from primary ones. Instead of presenting the share of industries that have implemented energy efficient measures, the analysis is done using industrial energy audits and the proportion of ISO 50001 certificates awarded. Industrial energy efficiency is in its infancy in the region and would be an important topic to develop and collect thorough data on in subsequent Regional Monitoring Frameworks.
3 STATUS OF ENERGY ACCESS, RENEWABLE ENERGY AND ENERGY EFFICIENCY IN THE ECOWAS REGION
3.1 Energy access
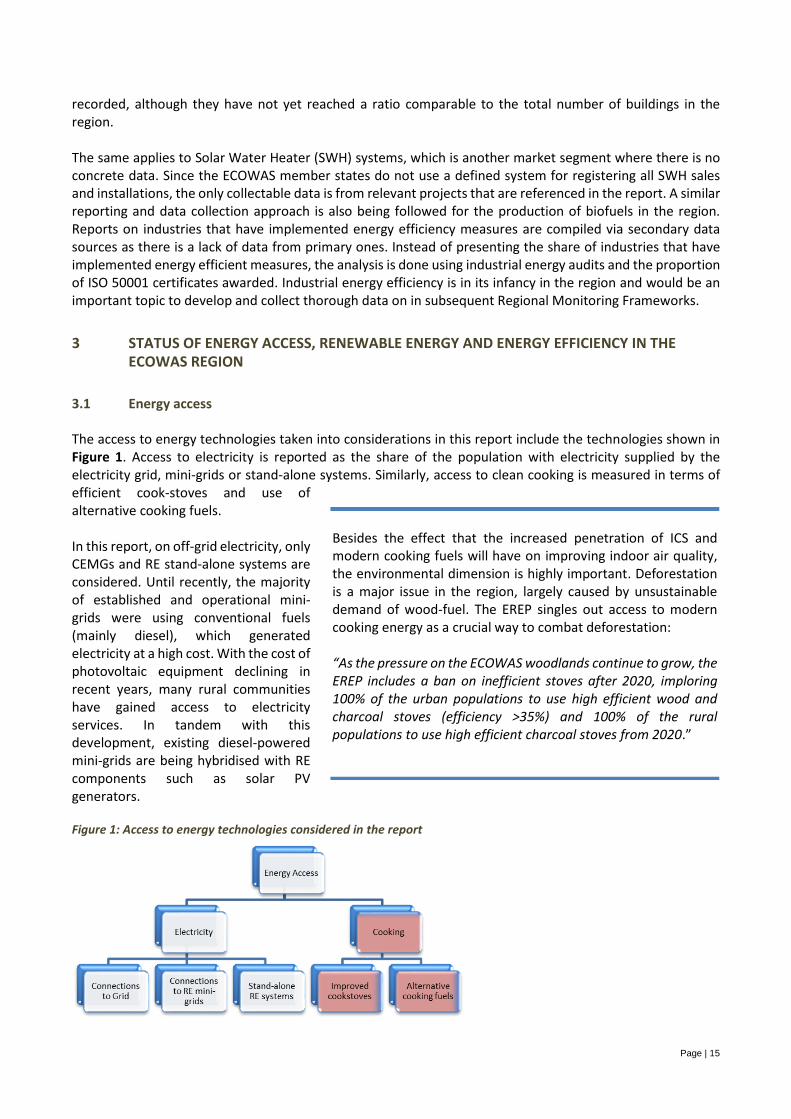
The access to energy technologies taken into considerations in this report include the technologies shown in Figure 1. Access to electricity is reported as the share of the population with electricity supplied by the electricity grid, mini-grids or stand-alone systems. Similarly, access to clean cooking is measured in terms of efficient cook-stoves and use of alternative cooking fuels. In this report, on off-grid electricity, only CEMGs and RE stand-alone systems are considered. Until recently, the majority of established and operational mini-grids were using conventional fuels (mainly diesel), which generated electricity at a high cost. With the cost of photovoltaic equipment declining in recent years, many rural communities have gained access to electricity services. In tandem with this development, existing diesel-powered mini-grids are being hybridised with RE components such as solar PV generators.
Figure 1: Access to energy technologies considered in the report
Besides the effect that the increased penetration of ICS and modern cooking fuels will have on improving indoor air quality, the environmental dimension is highly important. Deforestation is a major issue in the region, largely caused by unsustainable demand of wood-fuel. The EREP singles out access to modern cooking energy as a crucial way to combat deforestation: “As the pressure on the ECOWAS woodlands continue to grow, the EREP includes a ban on inefficient stoves after 2020, imploring 100% of the urban populations to use high efficient wood and charcoal stoves (efficiency >35%) and 100% of the rural populations to use high efficient charcoal stoves from 2020.”

Page | 16
3.1.1 Access to electricity
Access to electricity, irrespective of the type and quality of the service provided, is assessed as the share of households with electricity supplied by the national electricity grid, CEMGs and RE stand-alone systems.4 In theory, the aggregation of all three types of access should provide each country’s total rate of access to electricity. Besides the access rate as a percentage of the households, the access rate is also assessed in terms of number of connections to the national electricity grid, the number of connections to CEMGs, as well as the number of existing stand-alone systems in operation.
3.1.2 Access to the electricity grid
The overall population of the ECOWAS region is approximately 350 million people living in 65 million households. The average household size varies by country with a low of four in Cabo Verde compared to a high of nine in The Gambia. Since 1990, regional access to electricity rates has improved at 3.9% a year, as displayed in Figure 2.
Figure 2: Historical evolution of electrification rates in ECOWAS countries
Source: World Bank
The ECOWAS region added 3.9% annually to its electrification rate compared to only a 2.7% annual increase of its population, as displayed in Figure 3. These figures indicate that electrification efforts are headed in the right direction, though not quickly enough to achieve universal access by 2020.
4 It has to be noted that conventional mini-grids and stand-alone systems such as diesel or petrol generators can also provide access to electricity, but these are not covered in this report.
Page | 17
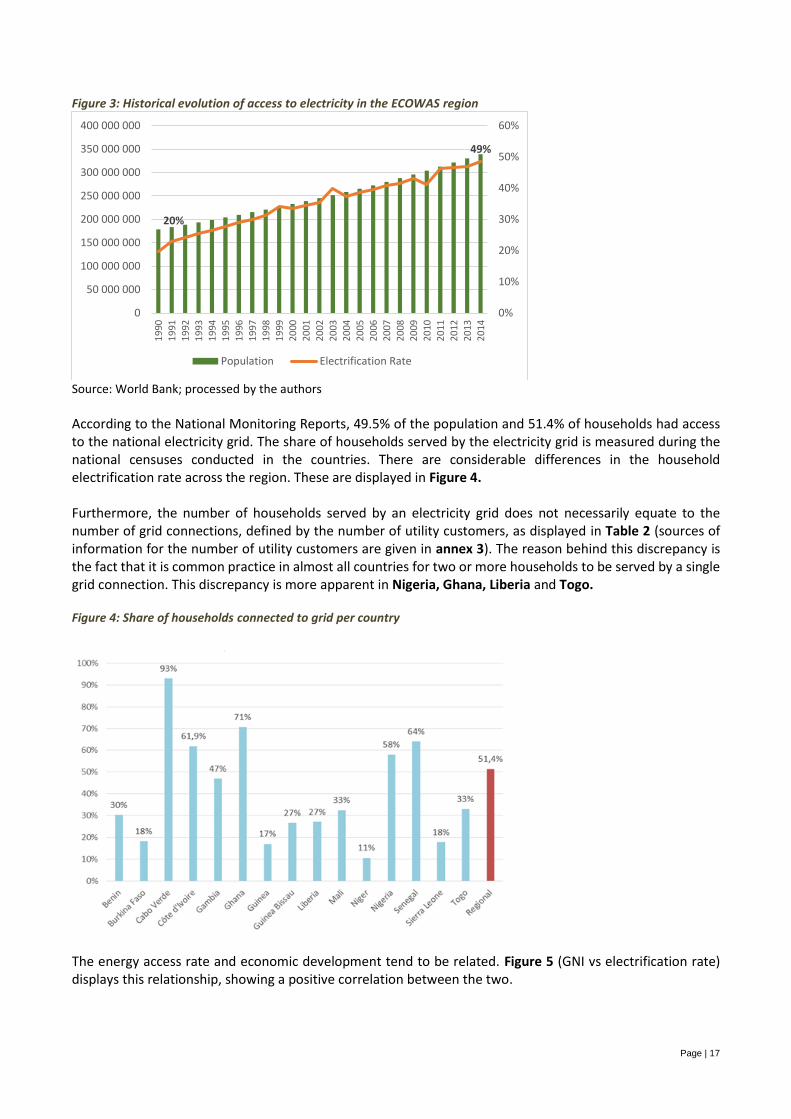
Figure 3: Historical evolution of access to electricity in the ECOWAS region
Source: World Bank; processed by the authors
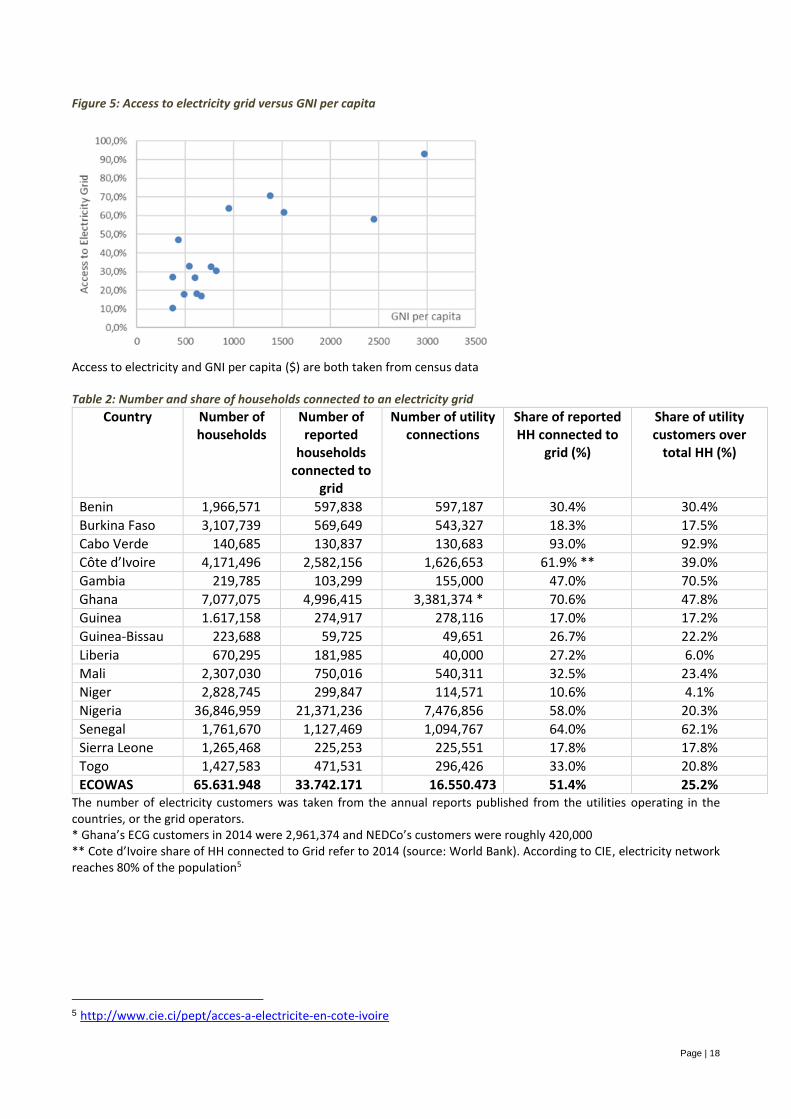
According to the National Monitoring Reports, 49.5% of the population and 51.4% of households had access to the national electricity grid. The share of households served by the electricity grid is measured during the national censuses conducted in the countries. There are considerable differences in the household electrification rate across the region. These are displayed in Figure 4. Furthermore, the number of households served by an electricity grid does not necessarily equate to the number of grid connections, defined by the number of utility customers, as displayed in Table 2 (sources of information for the number of utility customers are given in annex 3). The reason behind this discrepancy is the fact that it is common practice in almost all countries for two or more households to be served by a single grid connection. This discrepancy is more apparent in Nigeria, Ghana, Liberia and Togo.
Figure 4: Share of households connected to grid per country
The energy access rate and economic development tend to be related. Figure 5 (GNI vs electrification rate) displays this relationship, showing a positive correlation between the two.
20%
49%
0%
10%
20%
30%
40%
50%
60%
0
50 000 000
100 000 000
150 000 000
200 000 000
250 000 000
300 000 000
350 000 000
400 000 000
19
90
19
91
19
92
19
93
19
94
19
95
19
96
19
97
19
98
19
99
20
00
20
01
20
02
20
03
20
04
20
05
20
06
20
07
20
08
20
09
20
10
20
11
20
12
20
13
20
14
Population Electrification Rate
Page | 18
Figure 5: Access to electricity grid versus GNI per capita
Access to electricity and GNI per capita ($) are both taken from census data
Table 2: Number and share of households connected to an electricity grid
Country Number of households
Number of reported
households connected to
grid
Number of utility connections
Share of reported HH connected to
grid (%)
Share of utility customers over
total HH (%)
Benin 1,966,571 597,838 597,187 30.4% 30.4%
Burkina Faso 3,107,739 569,649 543,327 18.3% 17.5%
Cabo Verde 140,685 130,837 130,683 93.0% 92.9%
Côte d’Ivoire 4,171,496 2,582,156 1,626,653 61.9% ** 39.0%
Gambia 219,785 103,299 155,000 47.0% 70.5%
Ghana 7,077,075 4,996,415 3,381,374 * 70.6% 47.8%
Guinea 1.617,158 274,917 278,116 17.0% 17.2%
Guinea-Bissau 223,688 59,725 49,651 26.7% 22.2%
Liberia 670,295 181,985 40,000 27.2% 6.0%
Mali 2,307,030 750,016 540,311 32.5% 23.4%
Niger 2,828,745 299,847 114,571 10.6% 4.1%
Nigeria 36,846,959 21,371,236 7,476,856 58.0% 20.3%
Senegal 1,761,670 1,127,469 1,094,767 64.0% 62.1%
Sierra Leone 1,265,468 225,253 225,551 17.8% 17.8%
Togo 1,427,583 471,531 296,426 33.0% 20.8%
ECOWAS 65.631.948 33.742.171 16.550.473 51.4% 25.2% The number of electricity customers was taken from the annual reports published from the utilities operating in the countries, or the grid operators. * Ghana’s ECG customers in 2014 were 2,961,374 and NEDCo’s customers were roughly 420,000 ** Cote d’Ivoire share of HH connected to Grid refer to 2014 (source: World Bank). According to CIE, electricity network reaches 80% of the population5
5 http://www.cie.ci/pept/acces-a-electricite-en-cote-ivoire

Page | 19
3.1.3 Share of ECOWAS population served by renewable energy/hybrid mini-grids
In the Regional Monitoring Framework, only installed and operating Clean Energy Mini Grids (CEMGs) are counted. Table 3 displays the number of operational CEMGs6, the installed capacity, the number of households connected, and the number of people served. Only 10 countries have provided information on CEMGs. In the 10 countries, approximately 42,000 households are connected to 262 CEMGs, with a total installed capacity of 26 MW. These numbers are provided based on the best available data from the national focal persons, relevant energy institutions and CEMG operators. Updated information on the existing CEMGs is provided on ECOWREX platform (Figure 6). The role that CEMGs play for providing access to electricity in the region is limited. Not all ECOWAS member states have invested heavily in them over the past years. Senegal and Mali stand out in regards to the number of operational CEMGs with 130 and 75 respectively. Both countries launched major CEMG promotion programs more than 10 years ago. Other countries such as Benin and Sierra Leone are expected to catch up in the near future, as more focus is being placed on CEMGs (Box 1). Further aiding mini-grid electrification, diesel mini-grid developers and electric utilities companies have started hybridising them with RE systems. A key reason being lower operational costs. With these costs falling steadily, it is expected that more customers will connect to mini-grids that produce clean and affordable electricity.
Table 3: Number and RE capacity of CEMGs Number of operational
CEMGs
Installed capacity (MW)
Reported number of HH connected to a
CEMG
Number of people connected to a
CEMG (#HH)*(people/HH)
Benin 6 0.15 214 1,198
Burkina Faso 3 0.52 695 4,170
Cabo Verde 5 0.26 248 942
Côte d’Ivoire 7 0.47 698 3,790
Gambia 1 0.06 n/a n/a
Ghana 5 0.38 563 2,252
Guinea 3 2.16 22,460 158,481
Guinea-Bissau 2 0.6 872 6,104
Liberia 3 0.15 n/a 2,127
Mali 75 18 9,004 70,231
Niger 0 0 - -
Nigeria 20 0.37 n/a n/a
Senegal 130 2 7,047 57,052
Sierra Leone 2 0.05 n/a n/a
Togo 0 0 - -
ECOWAS 262 25.17 42,390 306,347 Côte d’Ivoire: Seven RE mini-grids were installed in 2016, but HHs were connected in 2017. Liberia: There is no official figure for the number of connections in Liberia. It is an estimate based from information on the Liberia Renewables platform (http://www.renewables-liberia.info/) and a CEMG study conducted by ECREEE (http://www.ecreee.org/news/mapping-and-assessment-existing-clean-energy-mini-grid-experiences). Thera are probably more HH connected to the existing CEMGs, but information is not yet available. Nigeria & Sierra Leone: No information on connections to CEMGs were reported.
6 In the following, hybrid mini-grids are also referred to as “RE mini-grids”.

Page | 20
BOX 1. COUNTRY INFORMATION ON RE MINI-GRIDS
Benin In January 2015, the Government initiated Projet de Valorisation de l’Énergie Solaire (PROVES) which aims to install 15,000 solar streetlights in major cities and provide access to RE or renewable sources of electricity to 82 localities in rural areas7. The project looks to benefit 74 of the localities from the construction of low voltage (LV) solar micro-grids and solar pumping systems. The other eight localities will benefit from solar home systems. 23 localities will be connected to the electricity network of SBEE. Six of the 74 proposed solar micro-grids are operational, while the remaining 68 await leasing contracts in order to be commissioned. Gambia The National Water and Electricity Company (NAWEC) delivers electricity through six isolated mini-grids with 13 MW of installed capacity (of which seven MW is currently available) using light fuel oil (LFO) plants as baseload power stations with very high operational costs8. Mali L'Agence Malienne pour le Développement de l'Energie Domestique et l'Electrification Rurale (AMADER) signed an Emissions Reduction Purchase Agreement (ERPA) in late December 2016. As part of this agreement, AMADER aims to support, financially and technically, PV hybridisation of 250 diesel-based mini-grids and the distribution of 750,000 solar lanterns to rural households. The Carbon Initiative for Development (Ci-Dev), which co-signed the agreement, will support AMADER in improving its regulatory and program management capacity as well as subsidise the solar lanterns. Ci-Dev, also agreed to purchase 400,000 Certified Emission Reductions (CERs) units9, an emissions unit issued by the Clean Development Mechanism (CDM), which allows industrialised countries to comply with their emission limitation targets. The funds received by the sale of these units will be used to support this project and other rural electrification initiatives in Mali. Sierra Leone The Sierra Leone Rural Renewable Energy Project (RREP) is a four-year project that looks to install mini-grids with up to 5 MW of renewable electricity capacity in rural communities. The RREP is technically implemented by the UN office for Project Services’ (UNOPS) and estimates that 100,000 direct and 500,000 indirect rural beneficiaries will gain access to clean and sustainable energy. Funded by DFID, the project will support the Ministry on Energy to create an enabling environment for the development of the renewable energy sector which will contribute to economic development of Sierra Leone. Over the next four years, RREP will implement three work packages (WP): the first WP will electrify 50 Community Health Centres (CHCs) with 6 kWp of stand-alone PV installations and connect 50 communities to mini-grids, with 16 to 36 kWp, by December 2017. The second WP will implement at least 40 larger mini-grids (40 to 200 kW) with co-funding by the private sector by 2020. The third WP will support the Ministry of Energy (PPP unit) and Electricity & Water Regulatory Commission (off-grid implementation unit) in capacity building. It will also provide technical assistance to the private sector to successfully implement projects.
7http://ibenin24.com/?media_dl=998 8 World Bank (2016) 9 https://www.ci-dev.org/MaliRE

Page | 21
Figure 6: Existing CEMGs in the ECOWAS region
The image shows location for existing CEMGs in 2018. Source: www.ecowrex.org
3.1.4 Access to RE stand-alone systems
RE stand-alone systems such as Solar Home Systems (SHS) are an important way of providing access to electricity services to rural populations. Access to these systems either is given through the open market or programs supported by governments and donors. For example, several solar home systems have been installed by the rural electrification concessionaires in Senegal with financial support from the Rural Electrification Agency (ASER). These are systems which are owned and maintained by the respective concessionaire, and the user pays a fixed monthly service fee. Other governments like Ghana are supporting the acquisition of user-owned SHS with subsidies.10 The solar PV home systems and pico PV systems11 market is growing in ECOWAS countries12. Many companies are using Pay-As-You-Go (PAYG) business models and though widespread in Eastern and Southern Africa, it is a new model for West Africa. In such models, users make a down payment followed by regular payments over a given period (often using mobile money). The systems sold by these companies are usually plug-and-play
10 The National Rooftop Programme, which has been launched in February 2016, finances the modules of residential solar PV systems with a maximum capacity of 500W, provided that the beneficiary finances the balance of system. The solar modules are either provided in kind or the Energy Commission disburses a cash subsidy. The objective of the programme is to support the installation of 200,000 solar PV systems countrywide. 11 IFC (2018) defines pico PV systems as “lanterns and simple multi-light systems (which may enable mobile charging)” with a capacity of <11 Wp. 12 http://www.ecreee.org/page/rogep-regional-off-grid-electrification-project

Page | 22
systems with small capacities. Several companies such as Azuri Technologies (Ghana, Nigeria), ARESS (Benin), PEG Africa (Ghana, Côte d’Ivoire), Nova Lumos (Nigeria) are using this model in West Africa. According to the information collected through the National Monitoring Reports, Benin, Guinea-Bissau and Senegal (Table 4) display a significant share of households with SHS. In addition, Burkina Faso, Mali and Togo have provided the number of known installations. IRENA informs that between 2015 and 2016, 16,700 SHS have been sold and/or distributed in Burkina Faso, Guinea-Bissau, Mali and Nigeria (Table 5). The lack of available information shows that there is not a systematic way for collecting relevant data and thus assessing the penetration rate of stand-alone systems based on RE.
Table 4: Number and share of households connected to stand-alone RE systems
Country Share of HH with stand-alone systems
Known RE stand-alone systems
Benin 3.5% n/a
Burkina Faso n/a 4,205
Cabo Verde 0.02% 31
Guinea 3% n/a
Guinea-Bissau 1.8% n/a
Mali n/a 5,201
Senegal 3.0% n/a
Togo n/a 2,280 Source: National Monitoring Reports
Table 5: Sold or distributed SHS
Country Technology Year Plant/Project Name No. of units
Capacity kW
People End-use
Burkina Faso SHS(>50W) 2016 Yeelen Kura (FRES) 673 48.0 3,971 Residential
Guinea-Bissau
SHS(>50W) 2016 FRES Guinea-Bissau 408 52.4 2,856 Residential
Mali SHS(>50W) 2015 Yeelen Kura (FRES) 794 108.0 4,208 Residential
Nigeria SHS (11-50W)
2016 Estimated sales Jul-Dec
8,842 150.0 39,790 Residential
Nigeria SHS (>50W) 2016 Lumos Nigeria 6,000 480.0 27,000 Residential
Source: IRENA Database13
The Global Off-Grid Lighting Association (GOGLA) and the Lighting Global programme of the World Bank are publishing semi-annual market reports with sales data from major companies distributing pico PV products (<=10Wp) and SHS14 (11-100Wp). The reports from 2016 show that West Africa is moving forward with 717,000 units sold and over US $16 million in revenue, but still far from the market level in East Africa (Table 6). Benin and Nigeria stand out, with 24% and 39% respectively of the units sold in 2016. The success of this initiative is underpinned by the fact that all ECOWAS countries have adopted favorable polices to increase the use of quality verified off-grid lighting products15. Consequently, over 90% of the systems sold in the ECOWAS region are quality verified which not only increases the longevity and use of the products but also increases customer confidence in RE powered systems.
13 IRENA, REN21. Decentralised RE Data Review. 14 The report from 2016 estimates that the GOGLA exercise captured the 50% of the total pico PV and SHS market 15 Verified Off-grid lighting products have passed IEC Technical Specification 62257-9-5. This specification is used by the IFC Lighting Global Quality Standards.

Page | 23
Table 6: Sold or distributed pico PV and SHS
Region/Country Products sold: total pico PV (<=10Wp) and
SHS (11-100Wp)
Cash sales revenue
($)
EAST AFRICA 2,878,531 87,341,928
WEST AFRICA 717,019 16,285,194
Burkina Faso 54,006 1,056,185
Benin 175,434 1,507,935
Cabo Verde n/a n/a
Côte d'Ivoire 29,538 128,856
Gambia 576 n/a
Ghana 51,006 2,293,028
Guinea n/a n/a
Guinea-Bissau n/a n/a
Liberia 13,989 217,248
Mali 41,601 1,095,169
Niger n/a n/a
Nigeria 278,251 7,802,775
Senegal 47,582 945,746
Sierra Leone 24,240 402,440
Togo 296 n/a Source: GOGLA 2016
3.1.5 Access to modern cooking energy
3.1.5.1 Share of ECOWAS population using modern fuel alternatives for cooking (e.g. LPG, biogas, solar cookers, kerosene, ethanol gel fuel)
In each country, modern cooking fuel alternatives, such as LPG, are being promoted as a cleaner and more efficient means for cooking. Unlike ICS, cooking fuels (LPG, kerosene, electricity etc.) are recorded in the national censuses. Table 7 displays census results from all 15 countries conducted in varying years between 2006 and 2014. The recorded penetration rates varied between 0.2% in Guinea-Bissau and 76% in Cabo Verde. The information indicates that over the years there has been a gradual shift from wood and charcoal to LPG or a combination of LPG with traditional fuels.
Table 7: Census results on use of alternative fuels Share HH using
LPG Electricity Kerosene Census year
Benin 5.0% 0.2% 2.8% 2013
Burkina Faso 1.3% 0.7% 0.1% 2014
Cabo Verde 74.0% 0.4% 2010/2016
Côte d’Ivoire 6.5%* 2010
Gambia 3.6% 0.0% 0.2% 2013
Ghana 18.2% 0.5% 0.5% 2010
Guinea 0.8% 0.6% 0.5% 2014
Guinea-Bissau 0.2% 4.6% 0.4% 2011
Liberia 0.95% 0.9% 0.4% 2008
Mali 0.7% 0.2% 2009
Niger 0.5% 0.0% 2012
Nigeria 2.6% 7.6% 28.7% 2006
Senegal 32.7% 0.1% 2013

Page | 24
Sierra Leone 0.8% 0.5% 0.7% 2015
Togo 6.6% 0.4% 2013-14 Source: National Monitoring Reports. * 0.16% LPG, 0.19% Gas and wood, 6.3% Gas and charcoal
According to national and independent reports from countries that provided data, modern cooking alternatives, mainly LPG, are used at a rate between 2% in Guinea and 74% in Cabo Verde with a regional weighted average of 21%.
Figure 7: Share of households using modern cooking solutions
In Mali, since 2009, there has been significant improvement in the share of households using LPG for cooking. Between 2004 and 2016, AMADER distributed approximately 130,000 LPG stoves, while the LPG imports for domestic use reached 14,000 metric tons in the same period (source: National Monitoring Report).
3.1.5.2 Share of ECOWAS population using improved cook-stoves
Access to modern cooking is assessed in terms of penetration rates and the number of units sold and distributed in each country. Although the volume of units sold may not necessarily align with the reported penetration rates, it provides an additional layer to the overall health of clean cooking market trends. The penetration rates of ICS in the region vary with a low of 0.9% in Cabo Verde and a high of 64% in Mali. According to the information collected though the National Monitoring Reports, the regional weighted average rate for ICS penetration is 25%. This variable, together with access to alternative fuels (see 3.1.5.1) and access to electricity, gives an indication of the living conditions prevailing in a typical household. As referred to above, the use of ICS, unlike the use of LPG, is not included in the data collected in the national censuses. Hence, ICS penetration rates are based on estimates extrapolated form national surveys.
Figure 8: Share of households with improved cook-stoves

Page | 25
The ECOWAS Renewable Energy Policy (EREP) includes a ban on inefficient cook-stoves from 2020. It targets the use of high-efficient wood and charcoal cook-stoves with a minimum efficiency of 35%. According to the Clean Cooking Alliance, ICS with an efficiency equal or higher than 35% are classified as tier 3 (Table 8), which means the fuel or cook-stove is operating at an efficiency level where it is making a positive environmental impact16. Whether the percentages reported by the countries include only ICS operating above the efficiency threshold cannot be confirmed, since the raw data is usually not available. This issue will require further attention in subsequent yearly Regional Monitoring Frameworks. In order to mitigate inadequacies with the data, information from supplementary sources on ICS initiatives is provided. This permits quantitative analysis of the ICS market to some degree.
Table 8: Improved cook-stoves efficiency/fuel use sub-tiers
Efficiency / fuel use sub-tiers
High power thermal efficiency (%)
Low power specific consumption (MJ/min/L)
Tier 0 <15 >0.050
Tier 1 ≥15 ≤0.050
Tier 2 ≥25 ≤0.039
Tier 3 ≥35 ≤0.028
Tier 4 ≥45 ≤0.017
Source17: CleanCookStoves.org
In Cabo Verde, which has the highest GNI per capita in the region, a significant share of the population moved directly from conventional cook stoves to LPG, completely bypassing the need for ICS. The reduction of wood as a cooking fuel is noted in a 2010 bulletin of the Statistical Service of Cabo Verde: “The consumption of gas as a source of energy for food preparation increased from 63 % in 2000 to 70 % in 2010, while the use of firewood has come down from 33 % to 25.5 % in the same period”. This downward trend of wood as cooking fuel continued into 2016 and stands at 20%. Mali on the other hand, with a high ICS penetration rate, has a long history of promoting efficient cook stoves beginning in the 1980s. One of the more recent projects that contributed to the high penetration rate was the Katene Clean Cook-Stoves Project. The project aimed to reduce fuel spending, improve indoor and outdoor air quality and create jobs through the manufacturing of improved charcoal stoves (SEWA stoves) - resulting in the manufacturing and distribution of 208,114 cook-stoves between December 2007 and December 201518.
In Liberia and Sierra Leone, a significant number of ICS were distributed under GIZ and Energizing Development (Endev) programs, with 1,000 distributed in Liberia and 7,600 in Sierra Leone. In addition, 11,600 ICS were sold in Liberia between 2014 and 2017 under the Positive Community Impact Liberia project. The actions indicated above are only a fraction of the projects undertaken in the region towards achieving the target of universal access to modern cooking energy. As previously stated, it is not clear whether all these ICS comply with the 35% efficiency threshold, set in the EEEP.
16 http://cleancookstoves.org/technology-and-fuels/standards/defining-clean-and-efficient.html 17 http://cleancookstoves.org/technology-and-fuels/standards/iwa-tiers-of-performance.html 18 CDM-MR Monitoring form. Monitoring report on improved household charcoal stoves in Mali

Page | 26
3.2 Renewable energy
3.2.1 Renewable energy installed capacity
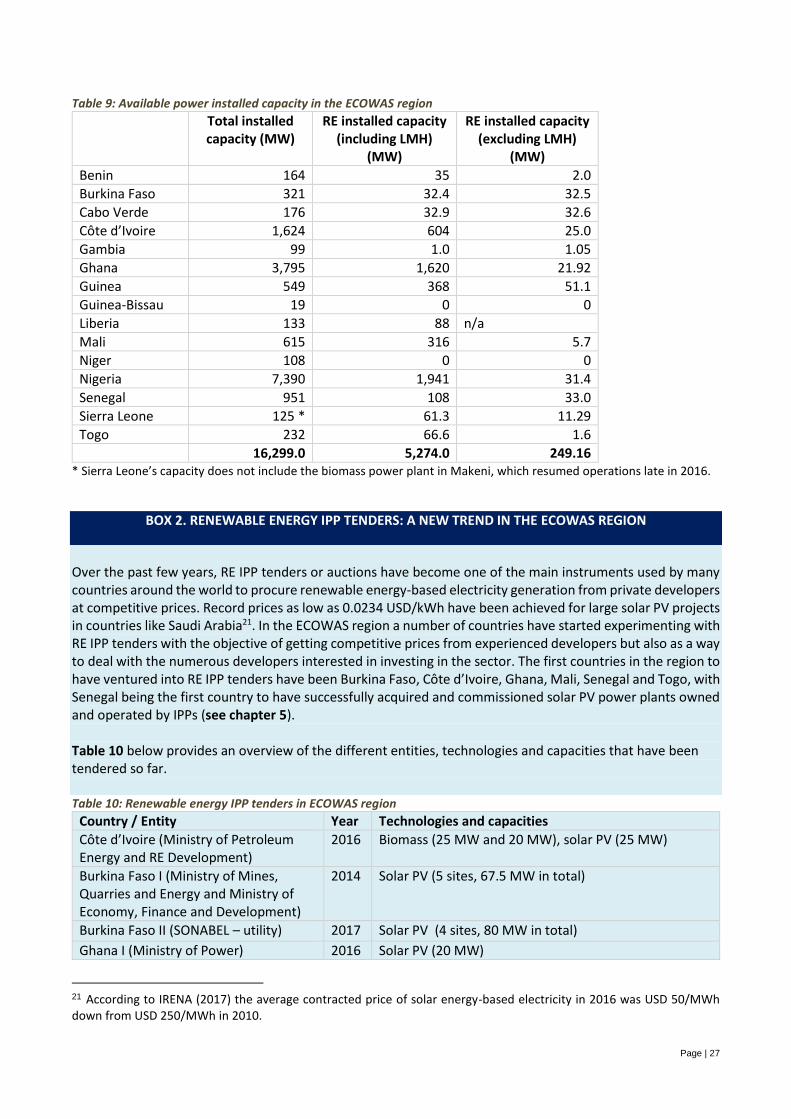
The total available installed capacity in the region (including renewable and conventional energy) is estimated
to be 16.3 GW. Renewable energy capacity accounts for approximately 32% (5.14 GW) of the capacity, as
displayed in Table 9.
Of the 5,140 MW of RE capacity, 4,887 MW (95 %) is provided by medium and large hydroelectric plants, and
the remaining 249 MW is split between small and mini hydro (158.69 MW, of which 2.39 MW are mini hydro),
photovoltaic (63.02 MW), wind energy (27 MW) and biogas (0.25 MW) plants. As noted in the ECOWAS Small
Scale Hydropower Program, small hydro plants are defined those with installed capacity between 1 and
30MW. Updated information on RE plants in the ECOWAS region can be found at the ECOWREX platform
(http://www.ecowrex.org).
The information provided on the conventional and RE capacity is based on the best available data; a
combination of data from the National Monitoring Reports, utilities, regulators and other reports. An issue
which needs to be addressed in the coming monitoring reports is the definition of capacity. I.e. whether
capacity is the installed capacity, the available capacity or the operational capacity. An apparent case is
Nigeria’s electricity installed capacity. According to NERC, the on-grid installed capacity is 12 GW, whereas
the operational capacity (as displayed in Table 9) is approximately 7 GW. According to a report by the
Advisory Power Team, from the Office of the Vice President19, the discrepancy between installed and
available capacity is a result of technical issues (availability of gas and water constraints, transmission losses,
etc.) and the need for systematic rehabilitation20. In a similar manner, Burkina Faso has 65% (200 MW) of
the installed capacity as operational. The operational capacity allows a pragmatic assessment of the
generation capacity and would potentially empower stakeholders to make critical decisions at both the
national and regional level regarding the improvement of the energy supply.
Figure 9: RE capacity (excluding medium and large hydro)
19 Federal Government of Nigeria (2015) 20 Available capacity is capacity that could be used for generation but is constrained by internal plant issues – mainly maintenance and repair requirements. Some of these are routine general maintenance and inspections, but most are the result of unplanned issues (e.g., trips, faults, leakages, burnt components, vibration and filter issues) and units needing rehabilitation/overhaul.
Page | 27
Table 9: Available power installed capacity in the ECOWAS region
Total installed capacity (MW)
RE installed capacity (including LMH)
(MW)
RE installed capacity (excluding LMH)
(MW)
Benin 164 35 2.0
Burkina Faso 321 32.4 32.5
Cabo Verde 176 32.9 32.6
Côte d’Ivoire 1,624 604 25.0
Gambia 99 1.0 1.05
Ghana 3,795 1,620 21.92
Guinea 549 368 51.1
Guinea-Bissau 19 0 0
Liberia 133 88 n/a
Mali 615 316 5.7
Niger 108 0 0
Nigeria 7,390 1,941 31.4
Senegal 951 108 33.0
Sierra Leone 125 * 61.3 11.29
Togo 232 66.6 1.6
16,299.0 5,274.0 249.16 * Sierra Leone’s capacity does not include the biomass power plant in Makeni, which resumed operations late in 2016.
BOX 2. RENEWABLE ENERGY IPP TENDERS: A NEW TREND IN THE ECOWAS REGION
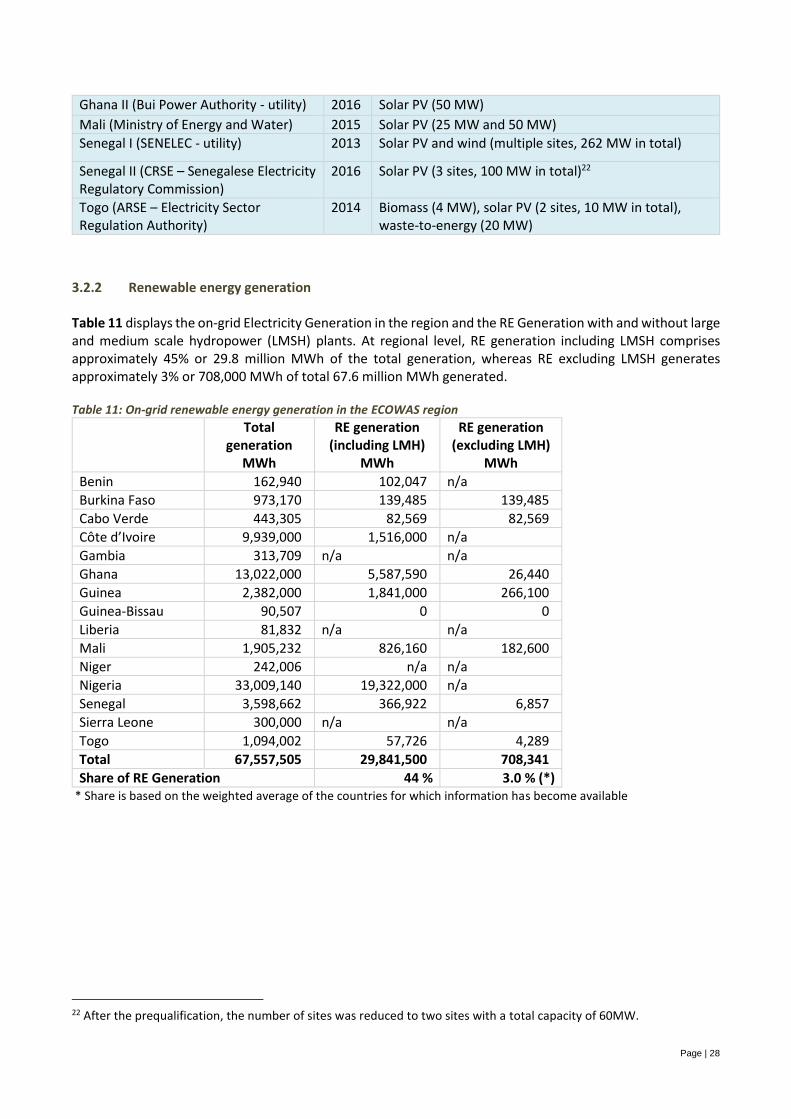
Over the past few years, RE IPP tenders or auctions have become one of the main instruments used by many countries around the world to procure renewable energy-based electricity generation from private developers at competitive prices. Record prices as low as 0.0234 USD/kWh have been achieved for large solar PV projects in countries like Saudi Arabia21. In the ECOWAS region a number of countries have started experimenting with RE IPP tenders with the objective of getting competitive prices from experienced developers but also as a way to deal with the numerous developers interested in investing in the sector. The first countries in the region to have ventured into RE IPP tenders have been Burkina Faso, Côte d’Ivoire, Ghana, Mali, Senegal and Togo, with Senegal being the first country to have successfully acquired and commissioned solar PV power plants owned and operated by IPPs (see chapter 5). Table 10 below provides an overview of the different entities, technologies and capacities that have been tendered so far. Table 10: Renewable energy IPP tenders in ECOWAS region
Country / Entity Year Technologies and capacities
Côte d’Ivoire (Ministry of Petroleum Energy and RE Development)
2016 Biomass (25 MW and 20 MW), solar PV (25 MW)
Burkina Faso I (Ministry of Mines, Quarries and Energy and Ministry of Economy, Finance and Development)
2014 Solar PV (5 sites, 67.5 MW in total)
Burkina Faso II (SONABEL – utility) 2017 Solar PV (4 sites, 80 MW in total)
Ghana I (Ministry of Power) 2016 Solar PV (20 MW)
21 According to IRENA (2017) the average contracted price of solar energy-based electricity in 2016 was USD 50/MWh down from USD 250/MWh in 2010.
Page | 28
Ghana II (Bui Power Authority - utility) 2016 Solar PV (50 MW)
Mali (Ministry of Energy and Water) 2015 Solar PV (25 MW and 50 MW)
Senegal I (SENELEC - utility) 2013 Solar PV and wind (multiple sites, 262 MW in total)
Senegal II (CRSE – Senegalese Electricity Regulatory Commission)
2016 Solar PV (3 sites, 100 MW in total)22
Togo (ARSE – Electricity Sector Regulation Authority)
2014 Biomass (4 MW), solar PV (2 sites, 10 MW in total), waste-to-energy (20 MW)
3.2.2 Renewable energy generation
Table 11 displays the on-grid Electricity Generation in the region and the RE Generation with and without large and medium scale hydropower (LMSH) plants. At regional level, RE generation including LMSH comprises approximately 45% or 29.8 million MWh of the total generation, whereas RE excluding LMSH generates approximately 3% or 708,000 MWh of total 67.6 million MWh generated.
Table 11: On-grid renewable energy generation in the ECOWAS region Total
generation MWh
RE generation (including LMH)
MWh
RE generation (excluding LMH)
MWh
Benin 162,940 102,047 n/a
Burkina Faso 973,170 139,485 139,485
Cabo Verde 443,305 82,569 82,569
Côte d’Ivoire 9,939,000 1,516,000 n/a
Gambia 313,709 n/a n/a
Ghana 13,022,000 5,587,590 26,440
Guinea 2,382,000 1,841,000 266,100
Guinea-Bissau 90,507 0 0
Liberia 81,832 n/a n/a
Mali 1,905,232 826,160 182,600
Niger 242,006 n/a n/a
Nigeria 33,009,140 19,322,000 n/a
Senegal 3,598,662 366,922 6,857
Sierra Leone 300,000 n/a n/a
Togo 1,094,002 57,726 4,289
Total 67,557,505 29,841,500 708,341
Share of RE Generation 44 % 3.0 % (*) * Share is based on the weighted average of the countries for which information has become available
22 After the prequalification, the number of sites was reduced to two sites with a total capacity of 60MW.
Page | 29
3.2.3 Solar Water Heaters
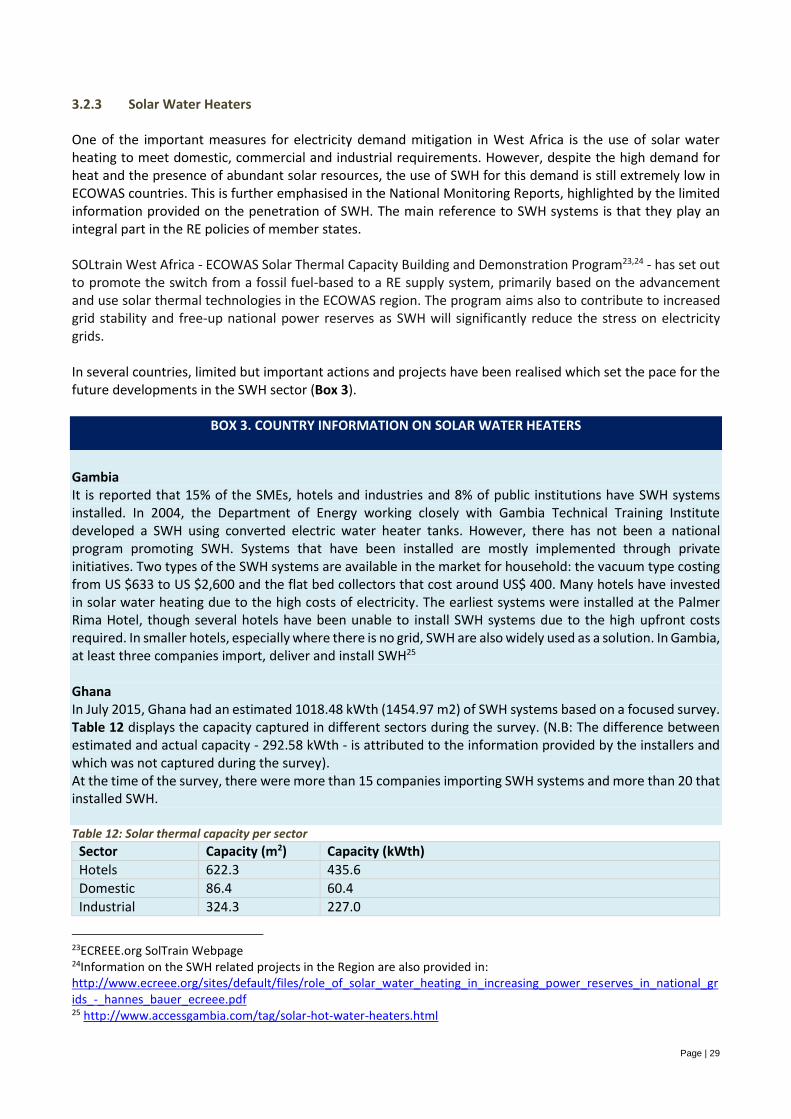
One of the important measures for electricity demand mitigation in West Africa is the use of solar water heating to meet domestic, commercial and industrial requirements. However, despite the high demand for heat and the presence of abundant solar resources, the use of SWH for this demand is still extremely low in ECOWAS countries. This is further emphasised in the National Monitoring Reports, highlighted by the limited information provided on the penetration of SWH. The main reference to SWH systems is that they play an integral part in the RE policies of member states. SOLtrain West Africa - ECOWAS Solar Thermal Capacity Building and Demonstration Program23,24 - has set out to promote the switch from a fossil fuel-based to a RE supply system, primarily based on the advancement and use solar thermal technologies in the ECOWAS region. The program aims also to contribute to increased grid stability and free-up national power reserves as SWH will significantly reduce the stress on electricity grids. In several countries, limited but important actions and projects have been realised which set the pace for the future developments in the SWH sector (Box 3).
BOX 3. COUNTRY INFORMATION ON SOLAR WATER HEATERS
Gambia It is reported that 15% of the SMEs, hotels and industries and 8% of public institutions have SWH systems installed. In 2004, the Department of Energy working closely with Gambia Technical Training Institute developed a SWH using converted electric water heater tanks. However, there has not been a national program promoting SWH. Systems that have been installed are mostly implemented through private initiatives. Two types of the SWH systems are available in the market for household: the vacuum type costing from US $633 to US $2,600 and the flat bed collectors that cost around US$ 400. Many hotels have invested in solar water heating due to the high costs of electricity. The earliest systems were installed at the Palmer Rima Hotel, though several hotels have been unable to install SWH systems due to the high upfront costs required. In smaller hotels, especially where there is no grid, SWH are also widely used as a solution. In Gambia, at least three companies import, deliver and install SWH25 Ghana In July 2015, Ghana had an estimated 1018.48 kWth (1454.97 m2) of SWH systems based on a focused survey. Table 12 displays the capacity captured in different sectors during the survey. (N.B: The difference between estimated and actual capacity - 292.58 kWth - is attributed to the information provided by the installers and which was not captured during the survey). At the time of the survey, there were more than 15 companies importing SWH systems and more than 20 that installed SWH. Table 12: Solar thermal capacity per sector
Sector Capacity (m2) Capacity (kWth)
Hotels 622.3 435.6
Domestic 86.4 60.4
Industrial 324.3 227.0
23ECREEE.org SolTrain Webpage 24Information on the SWH related projects in the Region are also provided in: http://www.ecreee.org/sites/default/files/role_of_solar_water_heating_in_increasing_power_reserves_in_national_grids_-_hannes_bauer_ecreee.pdf 25 http://www.accessgambia.com/tag/solar-hot-water-heaters.html

Page | 30
Institutions 4.1 2.8
Total 1,037.0 725.9
Senegal Senegal has seen an increase in the installation of SWH systems. According to a recent survey26 , it is estimated that 1611 m2 of flat plate collectors or 1,127.7 kWth have been installed, 70% of which in Dakar, primarily in the residential and hotel sectors. In phase 1 of the Diffusion de Chauffe-eau Solaires, implemented by the Agence Nationale des Energies Renouvelables (ANER), 20 health facilities identified by the Ministère de la Santé publique et de l’Action sociale were installed with SWH. The next phase of this project will install another 30 SWH systems in 30 public health facilities, activity that will be done in conjunction with other initiatives such as the ORIO and the PRODERE II project27 . At the time of data collection, 15 companies were involved in the import and installation of SWH systems. Mali The 2014 report from the Agence des Energies Renouvelables, informed on the installation of 10 systems. The Achievements, Challenges and Opportunities report from 201228, under the framework of the Scaling Up Renewable Energy Program in Low Income Counties (SREP), carried out by AfDB with support by the National Directorate of Energy, informed that more than 1500 SWH systems had been installed in different facilities, including hotels, hospitals and residences.
3.2.4 Bioethanol production
Bioethanol or biodiesel production has been reported in four countries (Table 13).
Table 13: Bioethanol and biodiesel production in the ECOWAS region
Country Bioethanol production (L) Biodiesel production (L)
Burkina Faso n/a 27,172
Mali 25,000,000 740,000
Niger n/a 27,360
Senegal 500,000 n/a Source: National Monitoring Reports
Specific country information is presented below:
In Ghana, the only ethanol producer, Caltech, has produced 150,000 litres of ethanol from cassava since its 3 million litres capacity facility was completed in August 2016. This company is expanding to include biogas, liquefied carbon dioxide and electricity production. Cassava is currently sourced from nearby farms in the Volta region, though in order to boost production, the company has expressed the need for more farmers in the region to supply them with cassava. This strategy falls in line with government policies to support the development of agricultural processing supply chains29. Ghana currently imports 60 million litres of ethanol annually (which does not contribute to energy generation) primarily for its beverages industry. In the last 10 years, the country has seen efforts to increase biofuel production (mainly based on Jatropha plantations). A significant push was made between 2007 and 2010. Many of these biofuel businesses have collapsed for
26 ECREEE (2016) 27 http://www.aner.sn/projets-partenariats/projets/#1499103081025-d57e4225-0df6 28 Direction Nationale de l’Energie du Mali (2011) 29http://www.biofuelsdigest.com/bdigest/2017/01/19/ghanas-first-ethanol-producer-diversifying-and-seeking-more-cassava/

Page | 31
different reasons, such as poor business planning, institutional barriers, limited community participation, unfair compensation practices, obstacles posed by civil society and unconstructive involvement of chiefs30. The Makeni bioethanol refinery, owned by Sunbird Bioenergy, in Sierra Leone has a production capacity of 85 million liters per annum. The primary source is sugarcane, with cassava as a secondary source. 100% of bioethanol produced is exported. Production ceased in 2016 due to the continuing effects of the Ebola crisis but resumed operation in March 2017. In Senegal, ethanol production data was obtained from Compagnie Sucrière Sénégalaise (CSS). Production capacity is 500,000 litres per year, of which 200,000 liters are for internal use. The oilseed sector is not yet in the biodiesel production stage except for one small-scale unit and another demonstration project. The sector is limited to vegetable oil, derived from plant species other than Jatropha. Castor and sunflower biofuels are also produced by private developers. However, production remains low and used for non-energy related uses because of an underdeveloped market.
BOX 4. Bioethanol production in Sierra Leone The Addax Bioenergy project consists of a bioethanol refinery and a biomass electricity plant in Mabilafu near Makeni, Bombali and Tonkolili Districts in Northern Sierra Leone. Commissioned in 2014, the first bioethanol exports began in 2015. All the bioethanol produced is exported while the electricity from biomass is party consumed on site and also fed into the grid (15 MW). The plant is equipped with a 32 MW turbo generator and designed to supply 90-120 GWh of electricity to the grid from steam generated from bagasse and other waste biomass in two ISGEC boilers. The Government of Sierra Leone has leased 23,500 ha of land for the project. In late 2016, Sunbird Bioenergy acquired the majority of the project and began planting cassava in addition to sugarcane. To connect the power generated to the national grid, the company constructed and commissioned 40 towers over 10km for a high voltage line. Production is yet to reach full scale in terms of plantation area, bioethanol and electricity production. A large part is due to the Ebola outbreak in 2014 which caused severe delays, increases in production costs and financial difficulties for the plant. source: sundbirdbioenergy website
30 Ahmed et. al (2017).

Page | 32
3.3 Energy efficiency
Energy Efficiency is an integral part of regional and national energy policies. EE measures aim to free-up
2,000MW of power generation capacity, hence reducing the need for further power generation investments
and negating the negative environmental impact of current energy practices. In each NREP, clear EE goals have
been set in accordance with regional targets to promote a viable environment and hold member state
accountable. The following section thus provides available information on the status of EE indicators,
measures and actions in the region, concerning:
Commercial, technical and total distribution losses
Efficient lights and efficient public lighting
Energy-efficient refrigerators
Energy-efficient air conditioning
Efficient buildings
Energy Efficiency in the industrial sector
3.3.1 Commercial, technical and total distribution losses in the region
Utility companies employ different stop-loss measures to combat commercial, technical and distribution
losses in an effort to remain profitable. In many cases, despite these measures, it is not feasible and the
financial strain is too great to bear. Technical losses stem from inefficiencies in transformers and links in
distribution cables, while non-technical losses include illegal connections (bypassing meters & manipulating
connection lines), the malfunction or absences of meters31 32 and low collection rates. The weighted regional
average for technical losses is 14.5% (Figure 10), while the non-technical losses in the region are 21% (Figure
11).
Figure 10: Technical transmission and distribution losses
Transmission losses are not reported for Cabo Verde, Gambia, Guinea, and Liberia. For Sierra Leone and Togo, only overall losses are known.
31 GIZ (2017) 32 In Nigeria, according to NERC, out of the 7.5 million customers, only 3.5 million are metered
0%
5%
10%
15%
20%
25%
Total Technical lossesTechnical Distribution lossesTransmission Losses

Page | 33
Figure 11: Non-technical losses in the ECOWAS region
There is no clear trend throughout the region in regards to transmission and distribution losses. For example,
in Burkina Faso and Ghana, technical losses have remained at the same level in the period from 2012-2016,
whereas Gambia and Côte d’Ivoire have seen a reduction of technical losses by 4-5% over the same period.
The degree of network losses positively correlates to the effort levels and effective initiatives undertaken by
the utilities. The main sources of improvement have been the introduction (or increased use) of pre-paid
meters and improvements in the distribution networks.
3.3.2 Energy-efficient lighting
Energy efficient lighting is one of the key areas being addressed at the regional level. In 2013, ECREEE, UNEP and other partners, developed a regional Efficient Lighting Strategy,33 which was adopted on the technical level in April 2014. The strategy document was later approved at the 11th Meeting of ECOWAS Energy Ministers, held in Conakry, Guinea, in December 2016. In addition to the Efficient Lighting Strategy, a regional Minimum Energy Performance Standards (MEPS) for efficient on-grid and off-grid lights was developed under the ECOWAS Standards Harmonization Model (ECOSHAM). MEPS were adopted by the Ministers in charge of quality in a meeting in Niamey in October 2017. With the current data, a regional assessment of efficient lighting penetration rates is unfeasible, as only a number of countries have provided information. Additionally, ECOWAS countries do not include efficient lighting questions in their censuses. Another limiting factor for data collection is that many users use inefficient and efficient lights in tandem. Box 4 provides an overview of the information that was collected on energy-efficient lighting in individual member states.
33 http://www.ecreee.org/news/west-africa-nations-phase-out-incandescent-lamps
N/A
21,6%
0,0%
5,0%
10,0%
15,0%
20,0%
25,0%
30,0%
35,0%
40,0%
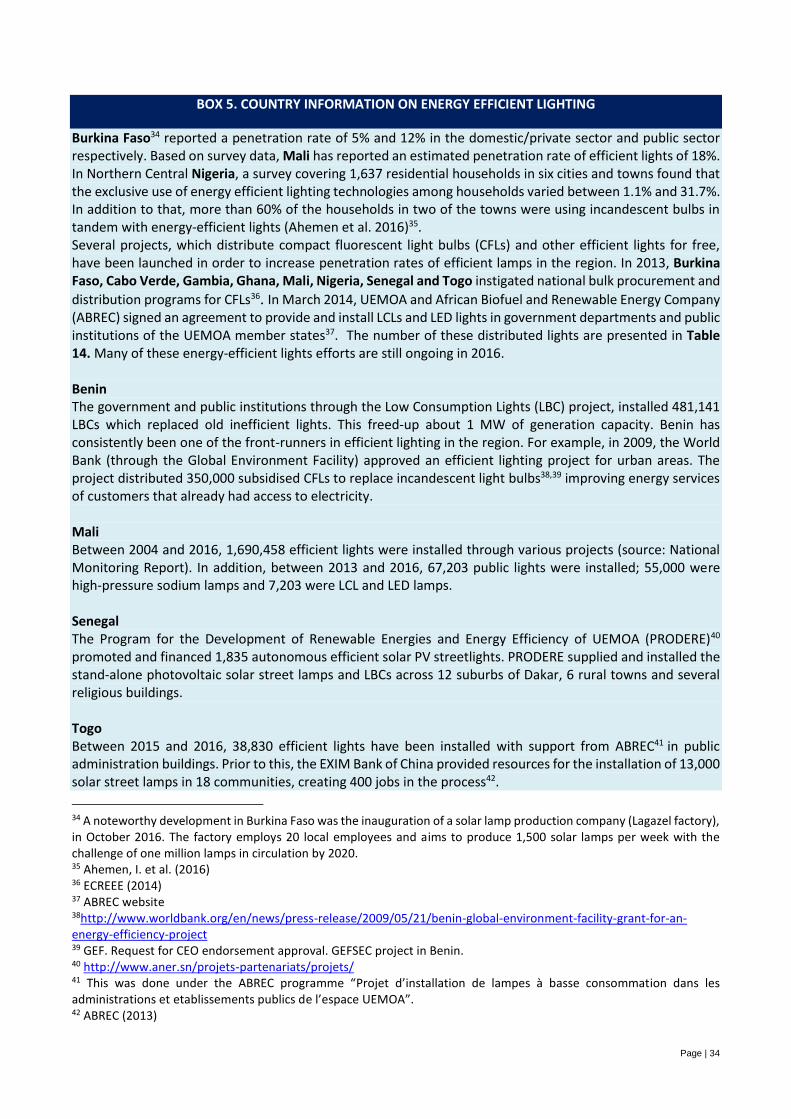
Page | 34
BOX 5. COUNTRY INFORMATION ON ENERGY EFFICIENT LIGHTING
Burkina Faso34 reported a penetration rate of 5% and 12% in the domestic/private sector and public sector respectively. Based on survey data, Mali has reported an estimated penetration rate of efficient lights of 18%. In Northern Central Nigeria, a survey covering 1,637 residential households in six cities and towns found that the exclusive use of energy efficient lighting technologies among households varied between 1.1% and 31.7%. In addition to that, more than 60% of the households in two of the towns were using incandescent bulbs in tandem with energy-efficient lights (Ahemen et al. 2016)35. Several projects, which distribute compact fluorescent light bulbs (CFLs) and other efficient lights for free, have been launched in order to increase penetration rates of efficient lamps in the region. In 2013, Burkina Faso, Cabo Verde, Gambia, Ghana, Mali, Nigeria, Senegal and Togo instigated national bulk procurement and
distribution programs for CFLs36. In March 2014, UEMOA and African Biofuel and Renewable Energy Company (ABREC) signed an agreement to provide and install LCLs and LED lights in government departments and public institutions of the UEMOA member states37. The number of these distributed lights are presented in Table 14. Many of these energy-efficient lights efforts are still ongoing in 2016. Benin The government and public institutions through the Low Consumption Lights (LBC) project, installed 481,141 LBCs which replaced old inefficient lights. This freed-up about 1 MW of generation capacity. Benin has consistently been one of the front-runners in efficient lighting in the region. For example, in 2009, the World Bank (through the Global Environment Facility) approved an efficient lighting project for urban areas. The project distributed 350,000 subsidised CFLs to replace incandescent light bulbs38,39 improving energy services of customers that already had access to electricity. Mali Between 2004 and 2016, 1,690,458 efficient lights were installed through various projects (source: National Monitoring Report). In addition, between 2013 and 2016, 67,203 public lights were installed; 55,000 were high-pressure sodium lamps and 7,203 were LCL and LED lamps. Senegal The Program for the Development of Renewable Energies and Energy Efficiency of UEMOA (PRODERE)40
promoted and financed 1,835 autonomous efficient solar PV streetlights. PRODERE supplied and installed the stand-alone photovoltaic solar street lamps and LBCs across 12 suburbs of Dakar, 6 rural towns and several religious buildings. Togo Between 2015 and 2016, 38,830 efficient lights have been installed with support from ABREC41 in public administration buildings. Prior to this, the EXIM Bank of China provided resources for the installation of 13,000 solar street lamps in 18 communities, creating 400 jobs in the process42.
34 A noteworthy development in Burkina Faso was the inauguration of a solar lamp production company (Lagazel factory), in October 2016. The factory employs 20 local employees and aims to produce 1,500 solar lamps per week with the challenge of one million lamps in circulation by 2020. 35 Ahemen, I. et al. (2016) 36 ECREEE (2014) 37 ABREC website 38http://www.worldbank.org/en/news/press-release/2009/05/21/benin-global-environment-facility-grant-for-an-energy-efficiency-project 39 GEF. Request for CEO endorsement approval. GEFSEC project in Benin. 40 http://www.aner.sn/projets-partenariats/projets/ 41 This was done under the ABREC programme “Projet d’installation de lampes à basse consommation dans les administrations et etablissements publics de l’espace UEMOA”. 42 ABREC (2013)
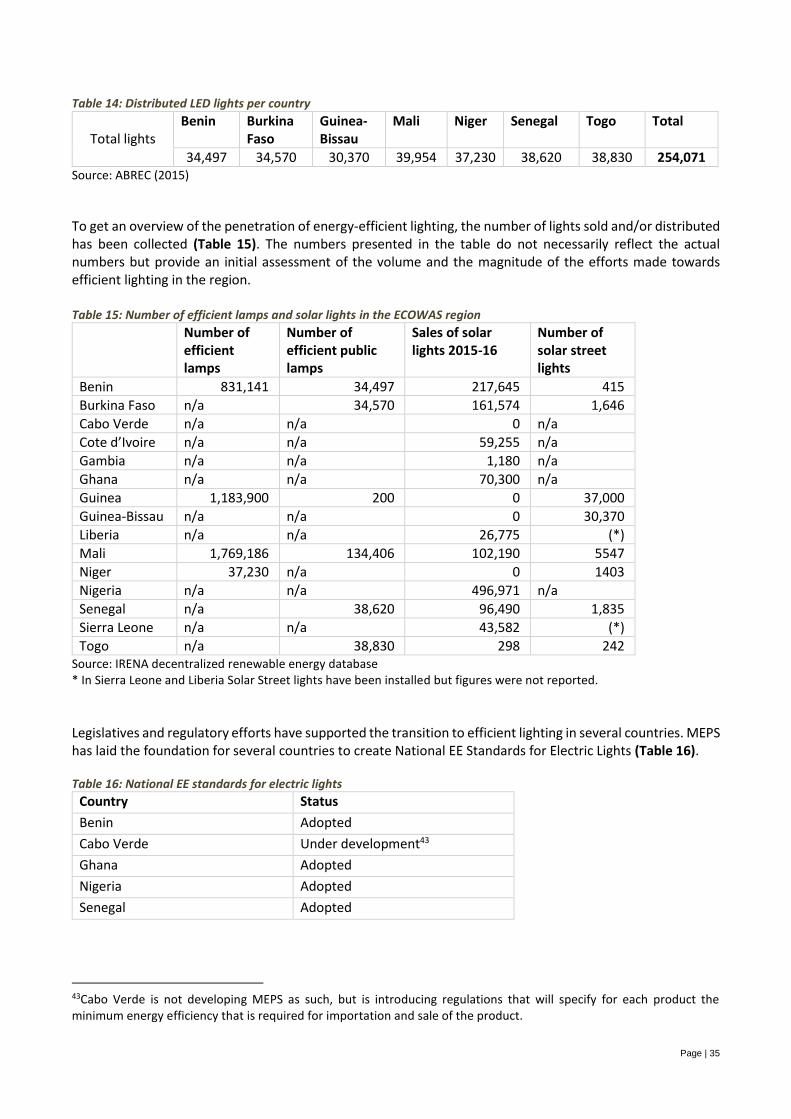
Page | 35
Table 14: Distributed LED lights per country
Total lights
Benin Burkina Faso
Guinea- Bissau
Mali Niger Senegal Togo Total
34,497 34,570 30,370 39,954 37,230 38,620 38,830 254,071 Source: ABREC (2015)
To get an overview of the penetration of energy-efficient lighting, the number of lights sold and/or distributed has been collected (Table 15). The numbers presented in the table do not necessarily reflect the actual numbers but provide an initial assessment of the volume and the magnitude of the efforts made towards efficient lighting in the region. Table 15: Number of efficient lamps and solar lights in the ECOWAS region
Number of efficient lamps
Number of efficient public lamps
Sales of solar lights 2015-16
Number of solar street lights
Benin 831,141 34,497 217,645 415
Burkina Faso n/a 34,570 161,574 1,646
Cabo Verde n/a n/a 0 n/a
Cote d’Ivoire n/a n/a 59,255 n/a
Gambia n/a n/a 1,180 n/a
Ghana n/a n/a 70,300 n/a
Guinea 1,183,900 200 0 37,000
Guinea-Bissau n/a n/a 0 30,370
Liberia n/a n/a 26,775 (*)
Mali 1,769,186 134,406 102,190 5547
Niger 37,230 n/a 0 1403
Nigeria n/a n/a 496,971 n/a
Senegal n/a 38,620 96,490 1,835
Sierra Leone n/a n/a 43,582 (*)
Togo n/a 38,830 298 242 Source: IRENA decentralized renewable energy database * In Sierra Leone and Liberia Solar Street lights have been installed but figures were not reported.
Legislatives and regulatory efforts have supported the transition to efficient lighting in several countries. MEPS has laid the foundation for several countries to create National EE Standards for Electric Lights (Table 16).
Table 16: National EE standards for electric lights
Country Status
Benin Adopted
Cabo Verde Under development43
Ghana Adopted
Nigeria Adopted
Senegal Adopted
43Cabo Verde is not developing MEPS as such, but is introducing regulations that will specify for each product the minimum energy efficiency that is required for importation and sale of the product.

Page | 36
In January 2011, Senegal passed a decree (no. 2011-160) prohibiting the import and production of incandescent lamps 44. Ghana45 also banned the import and local manufacture of incandescent lamps in 2011 with the idea first introduced in the Energy Efficiency Regulations of 2008. Furthermore, The Energy Commission Ghana has published a list of compliant energy saving lamps46 that can be sold or distributed in the country. Cabo Verde also plans to ban inefficient lamps in 2018.47 In Nigeria, the National Building Energy Efficiency Code (BEEC)48 was recently issued. Additionally, the National Energy Efficiency Action Plan (NEEAP) adopted by the Inter-Ministerial Committee on Renewable Energy and Energy Efficiency (ICREEE)49 in July 2016 which foresees the phasing out of inefficient lighting products by 2030.
3.3.3 Energy-efficient electric appliances
The promotion of energy-efficient electric appliances such as refrigerators and air-conditioners (AC) is an
important EE issue being addressed at regional level. ECREEE developed MEPS which contains standards for
energy-efficient refrigerators and ACs.
The EEEP promotes the introduction of EE labelling throughout ECOWAS. Ghana introduced mandatory EE
labels for electric appliances as early as 2005. Cabo Verde is working on a label for products that meet EE
minimum standards and a comparative label. Table 17 lists the countries that have introduced or are
introducing national MEPS for electric appliances other than lighting.
Table 17: Countries that have introduced national MEPS for electric appliances
Country Appliance Status
Benin ACs Adopted
Cabo Verde ACs, refrigerators, TVs, water heaters,
washing machines
Under development50
Ghana ACs, refrigerators Adopted
Nigeria ACs, refrigerators Adopted51
Senegal ACs, refrigerators Adopted52
44 http://www.jo.gouv.sn/spip.php?article8800 45 In Senegal, incandescent bulbs were banned through decree no. 2011-160 of 28 January 2011. In Ghana, they were banned through Legal Instrument 1932, 2008. 46 http://www.energycom.gov.gh/efficiency/energy-compliant-products 47 A draft regulation developed under the Projeto de Eficiência Energética nos Edifícios e Equipamentos (PEEE) foresees that in the future only lights that are energy efficiency class C and higher will be allowed to enter into the country. 48 Federal Ministry of Power, Works and Housing of Nigeria (Housing Sector) (2017) 49 Federal Republic of Nigeria (2016) 50 Cabo Verde is not developing MEPS as such, but is introducing regulations that will specify for each product the minimum energy efficiency that is required for importation and sale of the product. 51 The Nigerian Energy Support program (NESP) supported the Standards organisation of Nigeria (SON) in developing MEPS for AC’s and refrigerators 52 PERACOD supported AEME in the elaboration of standards for three group of products: grid lights, refrigerators and ACs. Twelve standards were homologated in 2014 in partnership with AEME and ASN.

Page | 37
3.3.4 Energy efficiency in buildings
The adoption of region-wide standards and labels and the development of energy-efficient building codes are
two of the major EEEP targets. The ECOWAS Ministers of Energy approved the regional Energy Efficiency in
Buildings (EEB) directive during their 11th meeting in Guinea in 2016. The following paragraphs show that some
ECOWAS member states are already implementing activities to promote energy efficiency in buildings.
Nigeria adopted a Building Energy Efficiency Guideline in June 201653. It was commissioned by the Federal
Ministry of Power, Works and Housing in collaboration with the Nigerian Energy Support Programme (NESP),
aiming to give practical advice to professionals on how to design, construct and operate energy efficient
buildings. It also aims to educate the general public about EE measures and provide them with information to
help with the identification of energy efficient measures in buildings.
In Senegal, the Franco-Senegalese ministerial agreement, between the French national agency for EE, ADEME,
and the Senegalese Environment Ministry, on low-carbon buildings, signed in December 2016, set-out to bring
together major Senegalese developers and urban managers. Consequently, the eco-construction industry has
grown typified by the emergence of local actors and new jobs. To further promote sustainable practices,
ADEME is taking part in the Typha Combustible Construction Afrique de l’Ouest (TyCCAO) project. It will use
Typha Australis – an invasive West African plant with thermal insulation and combustion properties – as a
construction material and for biomass. The project plans to use Typha for large scale use to fight climate
change by providing a renewable fuels and developing energy-efficient buildings.
In Cabo Verde, EE implementation in the building sector is
supported by the Cabo Verde Appliances & Building Energy-
Efficiency Project (PEEE), which is funded by GEF-UNDP54.
The project aims to mitigate GHG emissions by
implementing EE measures in building and appliances. The
key methods include creating an enabling environment
through policy, employing EE standards for appliances, pilot
demonstration projects of EE solutions in selected public
buildings and dissemination of information regarding the
best practices. The buildings listed below were built using
several EE techniques:
Ocean Science Centre Mindelo55
CERMI - Centro de Energias Renováveis e Manutenção Industrial
Hotel Terra-lodge
Hotel Aquiles
Hotel Spinguera Ecolodge na ilha de Boavista
Aldeia Manga em Santo Antão
Hotel Farinha de Pau - Eco Rural em São Nicolau
53 Federal Ministry of Power, Works and Housing of Nigeria (Housing) (2016) 54 UNDP website 55 The establishment of the Ocean Science Centre Mindelo (OSCM) in direct neighborhood to the INDP is a bilateral initiative of the cooperation partners INDP and GEOMAR.

Page | 38
3.3.5 Energy efficiency in industry
Through the NEEAPs, EE improvements in the industrial sector has been highlighted as a means for freeing-up
energy capacity generation and creating a more competitive industrial sector by substantially reducing
operational costs. The action plans also reported and quantified EE efforts and targets in this sector. Several
countries have stated that a large share of the industries will apply EE measures, based on the
recommendations of energy audits. Such audits and EE interventions will be funded through grants, state
subsidies and other viable means.
More work and capacity building are needed to present EE investments as profitable. Some countries have
taken steps to address this issue, which will lead to increased financial sector involvement.
EE information is limited within the National Monitoring Reports due to lack of a systemised data collection
approach. Nine industries in Burkina Faso have undertaken EE measures as per the Directorate General of
Electricity (DGE) of Ministry of Energy and Mineral Resources (MEMR) but further details have not been
reported. With the founding of l’Agence Nationale des Énergies Renouvelables et de l’Efficacité Énergétique,
ANEREE, in late 2016, monitoring and reporting EE actions and policies should be streamlined.
BOX 6. Two Nigerian Firms Received ISO 50001:2011 Certifications Two Nigerian companies received the International Standard for Energy Management ISO 50001:2011
certification after successfully implementing the energy management system according to the ISO Standard.
The companies, Aarti Steel Nigeria Limited, a steel roofing sheets manufacturer based in Sango Ota, Ogun
State and Grand Cereals Limited, an integrated food production company located in Jos, Plateau State, became
the first Nigerian companies to achieve the feat with support from the Nigerian Energy Support Program
(NESP), co-funded by the European Union and the German Government.
In addition, NESP through its pilot Energy Efficiency Network (EEN) provided technical support to each of the
six (6) participating companies below, who may have commenced gradual implementation of energy efficient
measures:
- Emzor Pharmaceuticals Industries Limited (Chemicals and Pharmaceuticals)
- Comart Nigeria Limited (Chemicals and Pharmaceuticals
- Vitafoam Nigeria Plc (Domestic and Industrial Plastic, Rubber and Foam)
- Conserveria Africana Limited (Food, Beverages and Tobacco)
- Nigerian Bottling Company Limited (Food, Beverages and Tobacco)
- Bel Papyrus Limited (Pulp, Paper and Paper Products, Printing and Publishing)
Source: NESP

Page | 39
4. PROGRESS ON THE IMPLEMENTATION OF THE SEFORALL INITIATIVE IN THE REGION
As a global platform, the Sustainable Energy for All (SEforALL) organisation empowers governments, development banks, the private sector, investors, civil society, and international institutions to come together and create partnerships to achieve universal access to sustainable energy in accordance with the three SEforALL objectives:
Ensure universal access to modern energy services;
Double the global rate of improvement in energy efficiency;
Double the share of renewable energy in the global energy mix.
ECREEE was mandated by the ECOWAS authorities to coordinate the implementation of the regional policies and of the SEforALL initiative in West Africa. It has also been assisting the ECOWAS member states to develop coherent and aligned roadmap processes. In March 2014, the member states approved a template for National SEforALL Action Agendas and prioritised SEforALL projects. The SEforALL National Action Agendas also included a National Renewable Energy Action Plan (NREAP) and a National Energy Efficiency Action Plan (NEEAP). By the end of 2016, 14 countries had validated their SEforALL National Action Agendas which outlined the main challenges and opportunities in achieving the three SEforALL goals. The Action Agendas are an important step towards the aligning information at technical, legislative and institutional levels. This information has been analysed and consolidated to record and track the regional progress on the SEforALL Objectives56. The compiled data showed that the region is trending in the right direction. By 2030, access to energy services should be universal, the totality of people should have access to modern cooking, and RE should contribute largely to the energy mix and by 2030. In addition, 60% of rural population is expected to have access to electricity.
Figure 12: Access to electricity trajectories for the ECOWAS countries
The next steps for actualising the action agendas will be outlined in the National SEforALL Investment Prospectus. Identified programs and projects will contain an investment analysis as a resource for potential private and public investors. By the first quarter of 2018, all 15 ECOWAS countries will have completed their Investment Prospectus, scaling up action in priority areas, to attract new investments and financial support.
56 All country documents, regional actions, news and events as well as publications related to the SEforALL initiative in West Africa can be found on http://se4all.ecreee.org/
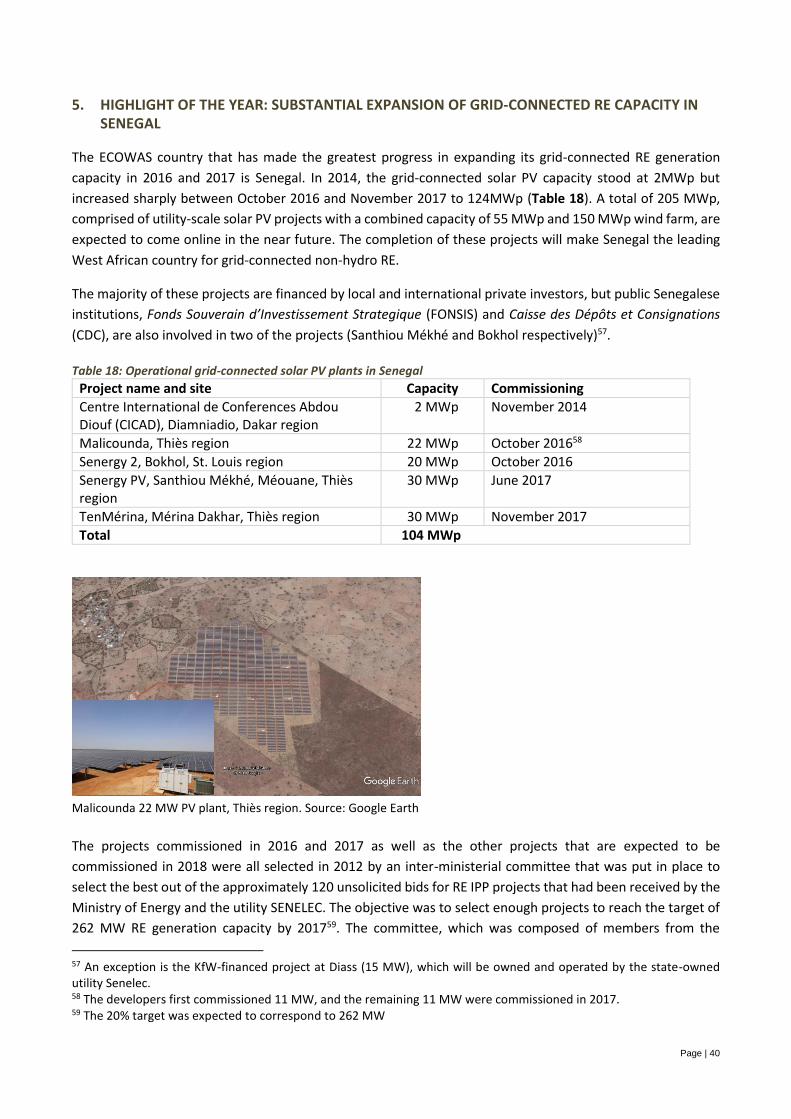
Page | 40
5. HIGHLIGHT OF THE YEAR: SUBSTANTIAL EXPANSION OF GRID-CONNECTED RE CAPACITY IN SENEGAL
The ECOWAS country that has made the greatest progress in expanding its grid-connected RE generation
capacity in 2016 and 2017 is Senegal. In 2014, the grid-connected solar PV capacity stood at 2MWp but
increased sharply between October 2016 and November 2017 to 124MWp (Table 18). A total of 205 MWp,
comprised of utility-scale solar PV projects with a combined capacity of 55 MWp and 150 MWp wind farm, are
expected to come online in the near future. The completion of these projects will make Senegal the leading
West African country for grid-connected non-hydro RE.
The majority of these projects are financed by local and international private investors, but public Senegalese
institutions, Fonds Souverain d’Investissement Strategique (FONSIS) and Caisse des Dépôts et Consignations
(CDC), are also involved in two of the projects (Santhiou Mékhé and Bokhol respectively)57.
Table 18: Operational grid-connected solar PV plants in Senegal
Project name and site Capacity Commissioning
Centre International de Conferences Abdou Diouf (CICAD), Diamniadio, Dakar region
2 MWp November 2014
Malicounda, Thiès region 22 MWp October 201658
Senergy 2, Bokhol, St. Louis region 20 MWp October 2016
Senergy PV, Santhiou Mékhé, Méouane, Thiès region
30 MWp June 2017
TenMérina, Mérina Dakhar, Thiès region 30 MWp November 2017
Total 104 MWp
Malicounda 22 MW PV plant, Thiès region. Source: Google Earth
The projects commissioned in 2016 and 2017 as well as the other projects that are expected to be
commissioned in 2018 were all selected in 2012 by an inter-ministerial committee that was put in place to
select the best out of the approximately 120 unsolicited bids for RE IPP projects that had been received by the
Ministry of Energy and the utility SENELEC. The objective was to select enough projects to reach the target of
262 MW RE generation capacity by 201759. The committee, which was composed of members from the
57 An exception is the KfW-financed project at Diass (15 MW), which will be owned and operated by the state-owned utility Senelec. 58 The developers first commissioned 11 MW, and the remaining 11 MW were commissioned in 2017. 59 The 20% target was expected to correspond to 262 MW
Page | 41
Ministry of Energy, SENELEC, the National Renewable Energy Agency, the Rural Electrification Agency, the
National Energy Efficiency Agency and the Electricity Regulatory Commission, reviewed all the offers that had
been received and selected 72 developers who were invited to start PPA negotiations with SENELEC.
To streamline the selection process, developers were chosen based on evaluation criteria including technical,
financial, organisational and planning aspects, with the energy price (FCFA/kWh) being the most important
criteria and thus having the strongest weight. Each developer received a questionnaire concerning the
characteristics and the level of maturity of the project on July 18th 2013, to which they had one month to get
back to SENELEC. Once received, only investors with an energy price of 65 FCFA/kWh (0.10 EUR/kWh) were
accepted. With the annual indexation of 1.75%, this results in an average price of 80 FCFA/kWh (approx. 0.12
EUR/kWh) over the lifetime of the PPA (25 years). PPAs were signed with 10 developers for projects with a
total generation capacity of 330 MW (180 MW solar PV and 150 MW wind), and a newly established dedicated
RE department at SENELEC provided continuous support to the project developers.
Most of the developers obtained long-term loans from bilateral and multilateral development finance
institutions such as Bio (Belgium), FMO (Netherlands) and Proparco (France). The 22 MWp Malicounda project,
however, was financed with 100 % equity. Several developers reached financial close in a relatively short time
span because the government decided to provide sovereign guarantees to minimise off-taker risk. The
involvement of CDC and FONSIS in two of the project also provided assurances to the investors and lenders
involved in those projects.
With the commissioned and on-going projects, Senegal has leapt forward and reached its objective of
increasing the installed RE capacity to 20% of the total installed capacity by 2017, set in 2012.60 As a result, the
target was raised to 30% in 2020. However, the government does not intend to stop there and joined the
World Bank/IFC “Scaling Solar” initiative, which aims to promote private investment in utility-scale solar PV
projects. The preliminary bids for the first 100 MW61 began in August 2016 and the respective Request for
Proposals (RfP) were sent to 13 pre-qualified companies in October 2017. The tender process produced at the
end of the submission period February 2018 one of the lowest electricity costs in Africa, as two bids offered
to produce electricity for 0.038 EUR/KWh and 0.039 EUR/KWh.
In addition to the utility-scale grid-connected systems, there is large growing number of small battery-
powered solar PV systems installed in supermarkets and hotels in grid-connected areas in Dakar and other
coastal areas. Once the provisions of decree no. 2011-2014 are made for consumer feed-in tariffs for surplus
RE electricity, it is expected that businesses and households will invest in battery-less small and medium-size
grid-connected systems. ECREEE in cooperation with GIZ has provided technical assistance to the regulatory
commission CRSE to fix the tariff that will be used to credit the feed-in electricity. SENELEC is planning a pilot
to gain experience with this type of distributed RE generation.
Additional information on the first three solar PV IPP projects in Senegal is provided in a case study published
by ECREEE that is available for download at the following link: http://www.ecreee.org/page/grid-connected-
renewable-energy-flagship-projects
60 Energy Sector Development Policy Letter of October 2012. 61 According to the scaling solar website, Senegal intends to develop “up to 200 MW” under Scaling Solar.

Page | 42
6. RECOMMENDATIONS
Quantification of the energy efficiency achievements has faced important challenges in data gathering in most of the countries due to the lack of proper functioning RE and EE data and information collection systems. There have been some initiatives in the region towards systematisation of data collection and processing. For instance, the EU has supported Benin in putting in place a data collection system entitled SINEB, and is going to support also UEMOA in re-establishing the Energy Information System (SIE in French) of the UEMOA member states. The monitoring framework exercise should be aligned to the data collection process of the member states’ Energy Information Systems. To do that, it is recommendable that the SIEs incorporate the missing indicators of the monitoring framework to their data collection exercise. Finally, technical and financial support should be given to the ECOWAS member states in improving their capacities in RE and EE data collection in order to be able to monitor their progress at the national level and supply the information to regional and international institutions (UEMOA, ECREEE, IRENA, AFREC, IEA, etc.).
Page | 43
7. REFERENCES
AEME. Stratégie de Maîtrise de l’Energie du Sénégal (SMES). Rapport Final.
ABREC (2013). Annual report 2013.
ABREC (2016). Rapport Annuel 2015.
ABREC (2017). Projet de Valorisation de l’Energie Solaire En République Du Benin.
Ahemen, I. et al. (2016): A survey of power supply and lighting patterns in North Central Nigeria - The
energy saving potentials through efficient lighting systems. Energy and Buildings 133 (2016) 770–776.
Ahmed, A.; Betey, B.C.; Gasparatos, A. (2017). Biofuel development in Ghana: policies of expansion and
drivers of failure in the Jatropha sector. Volume 70, April 2017, Pages 133-149.
ANSD (2014) – Agence Nationale de la Statistique et de la Démographie. RGPHAE 2013.
ARSE (2016). Rapport d’activité 2015, Burkina Faso.
ARSE (2017). Rapport d’activité 2016, Burkina Faso.
ARSE (2017). Rapport d’activité 2016, Togo.
Beaman, L.; Dillon, A. (2012). Do household definitions matter in survey design? Results from a
randomized survey experiment in Mali. Journal of Development Economics, Volume 98, 124-135.
CEB (2013). Rapport annuel 2012.
CIE (2017). Rapport annuel 2016.
Direction Nationale de l’Energie du Mali (2011). Energies renouvelables au Mali: réalisations, défis et
opportunités.
ECREEE (2013). ECOWAS Energy Efficiency Policy.
ECREEE (2013). ECOWAS Renewable Energy Policy.
ECREEE (2014). ECOWAS Regional Status Report on Efficient Lighting.
ECREEE (2016). Market report on solar thermal water heating and drying of agricultural products, Cabo
Verde report.
ECREEE (2016). Market report on solar thermal water heating and drying of agricultural products, Ghana
report.
ECREEE (2016). Market report on solar thermal water heating and drying of agricultural products, Senegal
report.
ECG (2014). Annual Report & Financial Statements.
EDG (2017). Rapport annuel 2016.
EDM (2017). Rapport Annuel d'activités.
ELECTRA (2017). Relatório e Contas, Exercício de 2016.
Energy Commission of Ghana (2015). Energy (supply and demand) outlook for Ghana, Final.
Energy Commission of Ghana (2017). Energy Supply and Demand Outlook for Ghana, Final.
Energy Commission of Ghana (2017). Electricity Supply Plan for the Ghana Power System.
Energy Commission of Ghana (2017). National Energy Statistics 2007 – 2016.
Federal Government of Nigeria (2015). Nigeria power baseline report.
Federal Republic of Nigeria (2016). National energy efficiency action plans (NEEAP).
Federal Ministry of Power, Works and Housing of Nigeria (2016). Building energy efficiency guideline for
Nigeria.
Federal Ministry of Power, Works and Housing of Nigeria (2017). Development of the National Building
Energy Efficiency Code (BEEC).
FONDEM – Fondation Énergies pour le Monde. 10 Centrales Solaires pour 40 000 Ruraux dans la Région
Nord du Burkina Faso. On-line publication.
GBOS (2014) – The Gambia Bureau of Statistics. The Gambia demographic and health survey 2013.

Page | 44
GIZ (2005-2006). Modèle d’électrification rurale pour localités de moins de 500 habitants au Sénégal.
GIZ (2015). The Nigerian Energy Sector. An overview with a special emphasis on renewable energy, energy
efficiency and rural electrification, 2nd edition.
GIZ (2017). Promoting a climate-friendly interconnected power system in West Africa.
GOGLA (2016). Global off-grid solar market report – semi-annual sales and impact data, January-June 2016.
GOGLA (2016). Global off-grid solar market report – semi-annual sales and impact data, July-December
2016.
Government of the Gambia (2013). Population and Housing Census Preliminary Results.
GRIDCo (2017). Annual report 2016.
GSS (2013) – Ghana Statistical Service. Population and housing census 2010.
GTAI (2017) – German Trade & Invest. Emergency water and electricity services project (Guinea Bissau).
IEA (2014). Africa Energy Outlook. A Focus on Energy Prospects in Sub-Saharan Africa.
IFC (2018). Off-Grid Solar Market Trends Report.
INE (2017) – Instituto Nacional de Estadística de Cabo Verde. Estadísticas das famílias e condições de vida.
Inquérito multi-objetivo contínuo 2016.
INE (2011) - Instituto Nacional de Estadística de Guinea Bissau. Inquérito ligeiro para avaliação da pobreza.
ILAP2, 2010.
INS (2014) – Institut National de la Statistique Côte d’Ivoire. Recensement de la population et du logement.
INS (2017) - Institut National de la Statistique de Guinée. Troisième recensement général de la population
et de l’habitation. RGPH3.
INS (2013) - Institut National de la Statistique de Niger. Enquête démographique et de santé dans les zones
d’intervention du programme de coopération de l’UNICEF au Niger, 2012.
INSAE (2016) – Institut Nacional de la Statistique et de l’Analyse Economique du Benin. Principaux
indicateurs socio demographiques et economiques. RGPH-4, 2013.
INSD (2017) – Institut National de la Statistique et de la Démographie du Burkina Faso. Annuaire statistique
2016.
INSEED (2010) – Institut National de la Statistique et des Études Economiques et Démographiques.
Quatrième recensement général de la population et de l’habitat.
INSTAT (2012) - Institut National de la Statistique de Mali. Quatrième recensement general de la population
et de l’habitat du Mali. RGPH 2009.
Institute of Current World Affairs (1989). PJW-35, Women and Cookstoves.
IRENA (2017) : Renewable Energy Auctions Analysis 2016.
IRENA, REN21. Decentralised RE Data Review.
LISGIS (2009) – Liberia Institute of Statistics and Geo-Information Services. 2008 population and housing
census.
Ministry of Power, Federal Republic of Nigeria (2015). National Renewable Energy and Energy Efficiency
Policy.
NAWEC (2017). The Gambia Electricity Sector Roadmap.
NBS (2006) – National Bureau of Statistics of Nigeria. Distribution of regular households 2006.
NERC (2017). Metering Initiatives for the NESI.
NIGELEC (2015). Rapport d’Activités 2014.
Nyarko, E.K. (2017). The Electricity Situation in Ghana: Challenges and Opportunities, CGD Policy Paper.
Washington, DC: Center for Global Development.
Ogunbiyi, D; Abiodun, M. (2015). Nigeria Power Baseline Report, Nigerian Electricity Supply Industry.
Rysankova, D. ; Portale, E. ; Carletto G. ; (2016). Measuring Energy Access, Introduction to the Multi-Tier
Framework.
Page | 45
Prasd, T et al. (2009). Monitoring Performance of Electric Utilities, Indicators and Benchmarking in Sub-
Saharan Africa.
Statistics Sierra Leone (2016). 2015 Population and housing census. Summary of final results.
SENELEC (2013). Lettre aux promoteurs de centrales à énergies renouvelables agréés.
UNEP. Document Repository. Energy country profile Côte d’Ivoire.
United Capital (2016). Nigerian Power Sector. Is there light at the end of the tunnel?
UNDP, SEforALL (2012). Rapid Assessment Gap Analysis, Gambia.
UNDP, GEF (2015). Promotion de la production durable de biomasse électricité au Bénin.
UNOPS (2016). Sierra Leone Rural Renewable Energy Program Factsheet.
World Bank (2014). Clean and Improved Cooking in Sub-Saharan Africa.
World Bank (2016). Project Appraisal Document to the Republic of The Gambia for the Gambia electricity
support project.
World Bank. Beyond Connections: Energy Access Redefined, Introducing Multi-Tier Approach to
Measuring Energy Access.

Page | 46
ANNEX 1: DEFINITIONS
Energy-efficient building: An energy-efficient building is defined as a building that is designed and built in a way that minimises demand for and consumption of energy/electricity for cooling. Buildings considered are old and new public buildings with a total useful area over 500 m2 with at least one energy audit conducted. GDP: Gross Domestic Product at purchaser's prices is the sum of gross value added by all resident producers in the economy plus any product taxes and minus any subsidies not included in the value of the products. It is calculated without making deductions for depreciation of fabricated assets or for depletion and GDP degradation of natural resources. Data are in current U.S. dollars. Dollar figures for GDP are converted from domestic currencies using single year official exchange rates. Household: A household is defined as a person or group of persons who normally live together, eat from the same pot and recognise a particular person as the head. Improved cook-stove: An improved cook-stove is characterised by having a particular feature that reduces the amount of wood, charcoal, animal or crop residue used by the cook-stove. Their use in developing countries has been promoted considering two main challenges: reducing the negative health impacts associated with exposure to toxic smoke from traditional stoves (women and children are generally more affected) and reducing the pressure placed on local forests. Losses in electricity supply: In electricity supply to final consumers, losses refer to the amounts of electricity injected into the transmission and distribution grids that are not paid for by users. Total losses have two components: technical and non-technical. Technical losses occur naturally and consist mainly of power dissipation in electricity system components such as transmission and distribution lines, transformers, and measurement systems. Non-technical losses are caused by actions external to the power system and consist primarily of electricity theft, non-payment by customers, and errors in accounting and record keeping. These three categories of losses are sometimes referred to as commercial, non-payment and administrative losses respectively, although their definitions vary in the literature. Medium and large hydro: According to the ECOWAS Small Scale Hydropower Program, medium and large hydropower plants are defined as hydropower plants with a capacity exceeding 30MW. On-grid lights: On-grid lights are defined as lights connected to the national grid or mini-grids. Penetration rate (%) of efficient lights: penetration rate of efficient light is defined as the number of efficient lights sold or installed as a share of the total number of lights (efficient + inefficient) sold or installed. RE mini-grid, hybrid mini-grid (or Clean Energy Mini Grid - CEMG): it is defined as a mini-grid where at least 10% of the total installed capacity is RE-based. Small Hydropower Plants: according to the ECOWAS Small Scale Hydropower Program, small hydro plants are defined as those plants with installed capacity between 1 and 30MW. Stand-alone renewable energy systems: they are defined as off-grid RE systems for lighting and powering electric appliances. These should provide at the minimum, electricity services such as lighting and phone charging (tier 1 of the SEforALL multi-tier framework for access to electricity).62 This excludes solar lamps that are for lighting only.
62 Further information: World Bank/International Energy Agency (2014): SEforALL Global Tracking Framework.

Page | 47
ANNEX 2: ON-GRID RE PLANTS IN THE ECOWAS REGION
The following list includes on-grid RE plants (excl. medium and large hydro) that were connected to the grid in 2016.
Country/RE on-grid power plant Technology Installed capacity
(MW)
Total
BENIN 2 249.16
Yéripao Small hydro 0.5
Djougou (it was not connected to the grid in 2016) PV 1.5*
BURKINA FASO 32.5
Kompienga Small hydro 14
Bagre Small hydro 16
Tourni Small hydro 0.6
Niofila Small hydro 1.5
Ouagadougou (FasoBiogaz) Biogas 0.25
CABO VERDE 32.6
Cabeolica Santiago - Monte São Filipe Wind 9.35
Cabeolica São Vicente - Selada do Flamengo Wind 5.95
Cabeolica Sal - Lajedo da Ribeira de Tarrafe Wind 7.65
Cabeolica Boa Vista - Morro da Vigia - Ponta do Sol Wind 2.55
Parque Eolico de Santo Antão Wind 0.5
Murdeira (Sal) PV 2.2
Praia (Santiago) PV 4.4
CÔTE D’IVOIRE 25
Ayamé 1 Small hydro 20
Faye Small hydro 5
GAMBIA 1.05
Gamwind Wind 0.9
Batokunku Wind 0.15
GHANA 21.92
Navrongo PV 1.92
Oyandze PV 20
GUINEA 51.1
Grandes Chutes Small hydro 27.60
Donkéa Small hydro 15.00
Banéah Small hydro 5.00
Kinkon Small hydro 3.50
MALI 5.7
Sotuba Small hydro 5.7
NIGERIA 31.4
Ankwil 1 (Bagel 1) Small hydro 1
Ankwil 2 (Bagel 2) Small hydro 2
Bakolori Small hydro 3
Challawa Gorge Small hydro 3
Ouree Small hydro 2
Tunga Small hydro 0.4
Kwall (Kwali Falls) Small hydro 2
Ngell Small hydro 2
Jabi Small hydro n/a

Page | 48
Jekko 1 Small hydro 4
Jekko 2 Small hydro 4
Kurra (Kurra Falls) Small hydro 8
SENEGAL 33
Bokhol (Senergy 2) PV 20
Malicounda (N.B.: 11 MW were operational in 2016) PV 11**
Diamniado (CICAD) PV 2
SIERRA LEONE 11.29
Goma 1 Small hydro 6
Charlotte Small hydro 2
Guma Small hydro 2.4
Makali Small hydro 0.64
Yele Small hydro 0.25
TOGO 1.6
Kpime Small hydro 1.6 Source: ECOWREX. * The total planned capacity of the Djougou solar PV plant in Benin is 5MW, but in 2016 only 1.5 MW were installed. ** The full capacity of the Malicounda solar PV plant in Senegal is 22 MW, but in 2016 the installed capacity was 11MW.

Page | 49
ANNEX 3: UTILITY CUSTOMERS
Country Number of customers
Source of information
Benin 597,187 2016 - National Monitoring Report
Burkina Faso 543,327 ARSE (2016)
Cabo Verde 130,683 2016 - National Monitoring Report
Côte d’Ivoire 1,626,653 CIE (2017)
Gambia 155,000 NAWEC (2017)
Ghana 3,381,374 ECG (2014)
Guinea 278,116 EDG (2017)
Guinea Bissau 49,651 GTAI (2017)
Liberia 40,000 LEC official website
Mali 540,311 EDM (2017)
Niger 114,571 NIGELEC (2015)
Nigeria 7,476,856 NERC (2017)
Senegal 1,094,767 SENELEC (2017)
Sierra Leone 225,551 Statistics Sierra Leone (2016)
Togo 296,426 ARSE (2016)
Total 16,550,473 Share of households with connection to grid
25.2%


