Gideon Galu (USGS/FEWS NET) ( ggalu@fews ) Mohammed AwDahir (FEWS NET/FSAU)
FEWS NET Washington 1717 H St NW Washington DC 20006 [email protected]
FEWS NET is a USAID-funded activity. This publication was authored by Athur Mabiso. The authors’ views expressed in this publication do not necessarily reflect the view of the United States Agency for International Development or the United States Government.
Import/Export Parity Price Analysis FEWS NET Markets Guidance, No 1 May 2008 INTRODUCTION
Import and export parity prices are used to assess the incentives to trade as well as the incentives to produce where local producers are in competition with producers and suppliers from outside the country or across the border. Parity price analysis is an important tool for food security and early warning analysts in that it can be used to determine the incentives to produce food and the potential for profitable importation of food and agricultural inputs through primary ports of entry or across internal regional borders. Parity prices are used to compare prices of a commodity in two different locations, when the two locations are in different countries.
www.fews.net
A complete food security analysis requires that analysts account for events that have potential food security implications whether they occur within or outside their country. Markets and trade act as important transmission mechanisms for these external events and are, therefore, essential to understanding food security. Events can be related to commercial market activity as well as government policies and programs that affect markets and trade, which in turn affects food security. Food security monitoring and analysis for early warning purposes entails forecasting or setting expectations about significant events that may happen in the coming months and their implications on food security;
regularly monitoring the conditions that underlie the expectations, and periodically validating, updating or modifying the expectations. Forming expectations involves asking questions about what will likely happen in the near and medium term such as what will the rainfall pattern look like over the coming growing season, will there be adequate availability of food commodities in various parts of the country and throughout a broader region, and how will prices behave over the pending hunger season.
TABLE OF CONTENTS
Introduction................................................ 1 What is parity pricing?................................ 2 Calculating the parity price......................... 2 How is parity price analysis relevant to food security analysis and early warning? .......... 2 Two types of parity prices........................... 3 Choosing the right parity price ................... 6 Important economic concepts and assumptions................................................ 8 Examples of use for FEWS NET work ........ 10 Some important aspects of parity price calculations ............................................... 12 Data needs and sources for computing parity prices .............................................. 20 Conclusions............................................... 24 References ................................................ 25 Useful websites......................................... 26 Glossary .................................................... 27
Some typical questions a food security and early warning analyst might ask regarding markets include:
Will traders holding large stocks of maize and millet in Kano, Nigeria release their stocks to provision markets in Niger where prices are currently elevated and consequently improve availability and relieve the upward pressure on prices?
Will Afghan farmers have incentives to invest in and expand wheat production given a particularly low wholesale price for wheat flour across the border in Pakistan, from where 70 to 80 percent of all imported wheat flour to Afghanistan originates?
Will plummeting beef prices in Nairobi create disincentives to trade for Tanzanian pastoralists who typically sell their livestock in Namanga Market across the border in Kenya?
Given Haitian bakers’ reliance on foreign markets for wheat flour, will the soaring international prices lead to a shortage of bread in Port‐au‐Prince?
FEWS NET Markets Guidance, No. 1 May 2008
Famine Early Warning Systems Network
2
Parity price calculations and analysis can help answer these typical and very important food security and early warning questions. This guidance covers what parity prices are, how they relate to food security analysis and early warning, how to calculate import and export parity prices using several examples, and additional literature and sources of international commodity prices. WHAT IS PARITY PRICING? Parity means equal or equivalent. Parity pricing is making the price of a particular commodity equal or equivalent to a reference price for the same commodity in another location (e.g., making the price of one ton of wheat in Maputo, Mozambique equivalent to the price of an identical ton of wheat in Durban, South Africa). Another way to look at parity pricing is that it is a way of accounting for differences in prices of a particular commodity in two different locations. In this sense, parity pricing helps us explain why the price of a commodity (e.g., maize meal) in one market is different than the price of the same commodity in another market. By attributing the difference in prices to costs like transport, taxes and so forth, we can then say the prices are equivalent or at par. In accounting terms, the prices balance (not equal) after considering all relevant adjustments. CALCULATING THE PARITY PRICE Calculating a parity price involves taking the price of a commodity at a border post or port of entry and adjusting it for the transport, marketing and transaction costs1 that are incurred when bringing the commodity to the geographic location under consideration. Policy effects such as taxes, subsidies and tariffs on the commodity are also included in these adjustments, and if we are interested in expressing the parity price in local currency terms, a currency conversion must be made using the appropriate2 foreign exchange rate. The end result is a unit price referred to as the parity price, which reflects the cash or financial value of the commodity in the location under consideration. HOW IS PARITY PRICE ANALYSIS RELEVANT TO FOOD SECURITY ANALYSIS AND EARLY WARNING? 1. Parity prices measure the incentives3 or disincentives for agricultural production, given competition from international
trade and/or cross border flows 2. Parity prices measure the incentives or disincentives for moving commodities from one location to another, specifically
across borders 3. Parity prices can help detect unfair commodity pricing 4. Parity prices can be analyzed over time to assess the dynamics of food security in a given location (1) Parity prices measure incentives or disincentives for agricultural production, given competition from international or
cross border trade Parity prices inform us about the market incentives and/or disincentives for local production of food crops, cash crops and livestock—particularly for agricultural exports. Incentives for local production are important to analyze because they give an indication of likely food availability and farm income derived from export markets. Farm income is subsequently used by households to buy food and/or farm inputs in support of the next season’s production. Related to this, we can analyze parity prices of farm inputs such as fertilizer and seed just as we do for outputs like maize and wheat. This can be useful in instances of input shortages in a country because it gives us an indication of the likely production for the next season. For example, if fertilizer manufacturers in Malawi face a problem in meeting the
1 Transaction costs are those charges incurred in order to facilitate a trade, e.g. if negotiation took place before the trade deal was reached and there were administrative costs that the buyer had to pay or broker processing fees. 2 Appropriate in the sense that it is the exchange rate exporters and importers face when changing currencies in their day‐to‐day business or the effective exchange rate (EER). Sometimes official exchange rates are not the effective exchange rates. 3 An incentive is something that incites an action; it provides a motive. In the context of this guidance it will mean potential profits or gain from performing a certain economic activity e.g. transporting food for sale from one place to another. In this sense an incentive is a measure of whether doing something is worthwhile or not.
FEWS NET Markets Guidance, No. 1 May 2008
Famine Early Warning Systems Network
3
country’s fertilizer requirements for the growing season, farmers may have to rely on imported fertilizer. However, this can only happen if import parity prices of fertilizer are not too high, otherwise farmers may not be able to afford it. Therefore, if we calculate parity prices of imported fertilizer and determine that they are very high, it might mean farmers will grow crops with less or no fertilizer and in turn get lower yields. This is clearly something that can affect food security in a country and is, therefore, important to analyze.
(2) Parity prices measure incentives or disincentives to move food Parity prices provide information about the incentives or disincentives to move food across borders (as measured from the border post). By comparing calculated parity prices at the local market to the prevailing prices at the border, food security analysts can tell how divergent the two prices are and attribute the divergence to various cost components based on the adjustments they made when calculating the parity price. This gives richer information about the sources of incentives or disincentives to move food from a border post to a local market. As an example, if we calculate the parity price of a ton of wheat in Maputo, Mozambique to be 10,000 Meticals while the price of the same ton of wheat in Durban, South Africa is 6,000 Meticals (after foreign currency conversion); we might ask what constitutes the 4,000 Meticals difference. It could be that transport costs are too high and constitutes 80 percent of the difference, that there are high insurance costs involved, or that the excise tax on imported wheat is too high. Computing parity prices helps uncover the cause(s), and allows us to make a better analysis of the incentives to food inflows.
(3) Parity prices can help detect unfair pricing
Calculating parity prices can help reveal whether market participants such as traders are extracting excessive profits and limiting households’ access to food. For example, suppliers of locally‐produced maize meal can sell at prices below or equal to the parity price for imported maize meal (a practice also known as import parity pricing). If the cost of producing locally, plus marketing the maize meal is much lower than that of importing the maize meal then the suppliers would be overcharging. This would make buyers less capable of accessing the maize meal. It should, however, be noted that just because a trader is practicing parity pricing does not necessarily mean s(he)makes excessive profits (Parr, 2005). One needs to compare the costs of producing locally, plus marketing to the costs of importing in order to assess if the practice of import parity pricing is limiting food access and availability.
(4) Assessing dynamics in incentives or disincentives Another reason why we might want to know about parity prices is to analyze changes in incentives to move food4 or farm inputs over time. By calculating parity prices for several time periods and graphing them with time on the horizontal axis, we can track changes and trends in the parity prices. We can also forecast changes based on historical trends5. When we track the differences in import parity prices across different regions over time, changing incentives for food movement between different locations can be seen. This allows us to say something about what is likely to happen to regional market supply and market prices in future. Such information is vital in monitoring likely food availability and accessibility for different regions in a country.
TWO TYPES OF PARITY PRICES: (i) Import parity price (IPP) – the value of a unit of product bought from a foreign country, valued at a geographic
location of interest in the importing country. (ii) Export parity price (XPP) – the value of a product sold at a specific location in a foreign country, but valued from a
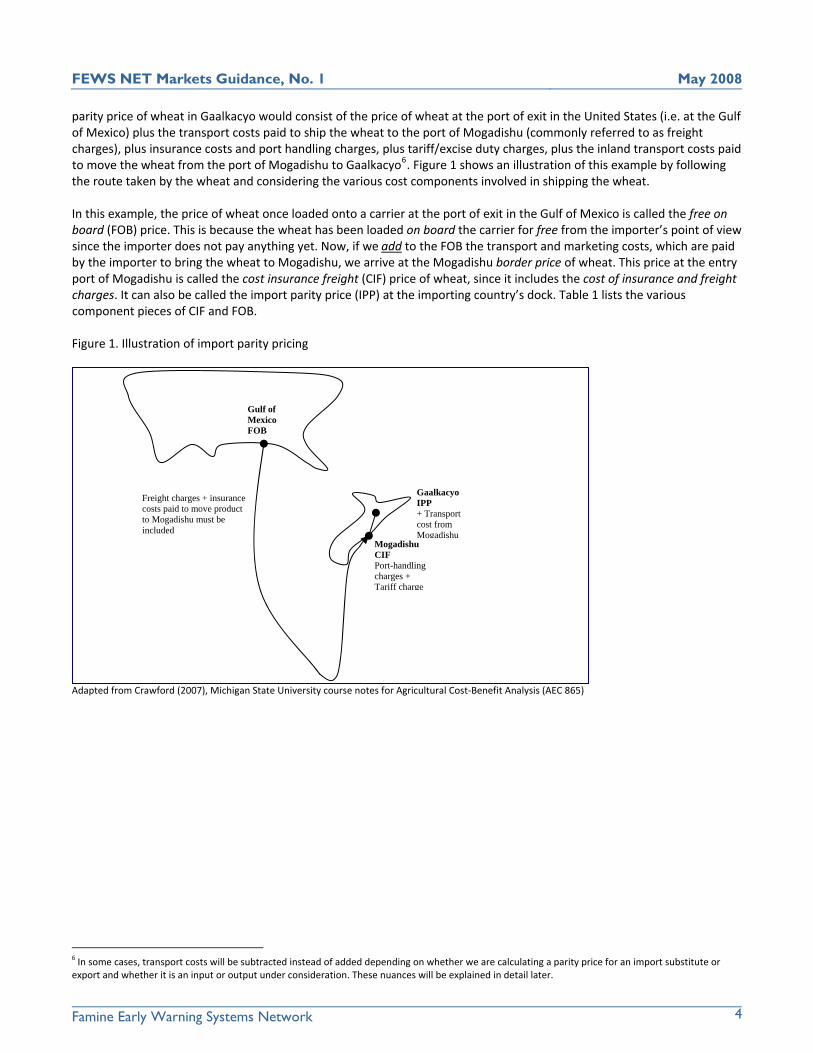
specific location in the exporting country. Import parity price (IPP) The import parity price is the value of a unit of product bought from a foreign country, valued at a geographic location of interest in the importing country. Suppose we import wheat into Gaalkacyo, Somalia from the United States. The import
4 Typically food will be moved by market participants such as traders from a surplus area to a deficit area. However this occurs when it is profitable for traders and market participants to move the food. 5 An example of this is shown in the section titled “illustrative price graphs and tables”.
FEWS NET Markets Guidance, No. 1 May 2008
Famine Early Warning Systems Network
parity price of wheat in Gaalkacyo would consist of the price of wheat at the port of exit in the United States (i.e. at the Gulf of Mexico) plus the transport costs paid to ship the wheat to the port of Mogadishu (commonly referred to as freight charges), plus insurance costs and port handling charges, plus tariff/excise duty charges, plus the inland transport costs paid to move the wheat from the port of Mogadishu to Gaalkacyo6. Figure 1 shows an illustration of this example by following the route taken by the wheat and considering the various cost components involved in shipping the wheat. In this example, the price of wheat once loaded onto a carrier at the port of exit in the Gulf of Mexico is called the free on board (FOB) price. This is because the wheat has been loaded on board the carrier for free from the importer’s point of view since the importer does not pay anything yet. Now, if we add to the FOB the transport and marketing costs, which are paid by the importer to bring the wheat to Mogadishu, we arrive at the Mogadishu border price of wheat. This price at the entry port of Mogadishu is called the cost insurance freight (CIF) price of wheat, since it includes the cost of insurance and freight charges. It can also be called the import parity price (IPP) at the importing country’s dock. Table 1 lists the various component pieces of CIF and FOB. Figure 1. Illustration of import parity pricing
Mogadishu CIF Port-handling charges + Tariff charge
Freight charges + insurance costs paid to move product to Mogadishu must be included
Gulf of Mexico FOB
Gaalkacyo IPP + Transport cost from Mogadishu
Adapted from Crawford (2007), Michigan State University course notes for Agricultural Cost‐Benefit Analysis (AEC 865)
6 In some cases, transport costs will be subtracted instead of added depending on whether we are calculating a parity price for an import substitute or export and whether it is an input or output under consideration. These nuances will be explained in detail later.
4
FEWS NET Markets Guidance, No. 1 May 2008
Famine Early Warning Systems Network
5
Table 1. Components of CIF (Cost Insurance Freight) and FOB (Free on Board) Item Element CIF
Includes:
FOB cost at point of export Freight charges to point of import Insurance charges Unloading from ship to pier at port Excludes: Import duties and subsidies Port charges at port of entry for taxes, handling, storage, agents’ fees, and the like FOB Includes: All costs to get goods on board – but still in harbor of exporting country: Local marketing and transport costs Local port charges including taxes, storage, loading, fumigation, agents’ fees and the like Export taxes and subsidies Project boundary price Farm‐gate price7
Source: William A. Ward, “Calculating Import and Export Parity Prices,” Training material of the Economic Development Institute, CN‐3 (Washington D.C.: World Bank, 1977), p.8.
Export Parity Price (XPP) Let us now consider cotton being exported from Ouagadougou, Burkina Faso to Liverpool, England. To calculate the XPP in Ouagadougou we start with the CIF price in Liverpool (which is the selected world price) and subtract freight and insurance charges that importers will have to pay to ship cotton to Liverpool. We must then convert the resulting price into local currency terms using the exchange rate cotton exporters will actually face when changing their foreign currency earnings to local currency; this foreign exchange rate is referred to as the Effective Exchange Rate (EER) which is different from the Official Exchange Rate (OER) which is the exchange rate quoted by the government but may not necessarily be the actual rate that foreign currency is exchanged in day‐to‐day business transactions. After converting the resulting price to the local currency, we must subtract local port charges (say at the port in Cote d’Ivoire) but must then add any export subsidies. Why are we deducting and not adding some of the costs associated with trade when we calculate the XPP? The answer lies in the purpose of the parity price calculation and the perspective we take. In the example just discussed, there can be two different perspectives regarding the cotton parity price: • From the perspective of an importer in Liverpool, the IPP of cotton is the local price of cotton in Ouagadougou plus all
transport and insurance costs to ship the cotton to Liverpool plus unloading charges at the port. In this perspective we add and do not subtract the costs when making the parity price calculation because the importer will have to pay for them.
• However, from the perspective of an exporter in Burkina Faso’s it is more useful to calculate the XPP valued at
Ouagadougou, because s/he wants to compare it with other cotton prices in Liverpool and see if his/her export price is competitive, after adjusting for shipping costs. Also, the exporter wants to compare it with domestic prices and determine if it is more profitable to export cotton to Liverpool than to sell in the domestic market. Note that the transport and insurance costs are neither incurred by the exporter nor paid to the exporter so they do not show up as
7 The farm gate price is the price that the farmer or producer receives at the farm or location of production. It is the price of the product available at the farm, excluding any marketing costs or transport and delivery charges.
FEWS NET Markets Guidance, No. 1 May 2008
Famine Early Warning Systems Network
6
benefits or costs to the exporter. This is why we subtract them from the CIF when calculating the XPP (the same applies for the port charges). However the export subsidies are a benefit to the exporter and this is why we add them.
CHOOSING THE RIGHT PARITY PRICE The appropriate parity price used depends on the situation at hand and the perspective taken by the individual, as it relates to their interest and/or business. FOR IMPORTERS: they will tend to be concerned about the IPP because it helps them figure out the costs of importing goods. The IPP helps importers find out if it will be profitable to import and resell goods in the domestic market. It also helps importers assess potential business competition from both locals and foreigners who may also want to sell in the domestic market. Should cotton be imported? Regarding the cotton example previously discussed, cotton should be imported if the IPP is lower than the domestic price. For the cotton to be competitively priced, an importer, after paying shipping costs, must find it cheaper than alternative cotton imports in Liverpool. The importer in Liverpool must also find it profitable to then resell the cotton to textile companies. Thus the importer will be interested in knowing the cost components of the IPP that we add when calculating the IPP. FOR EXPORTERS: they are more likely to be interested in the XPP because this too allows them to figure out profitability in terms of selling a product in a foreign market. It allows the exporters to gauge the benefits of exporting versus selling in the domestic market and enables them to compare different export markets and determine the most lucrative one. If the XPP is higher than the domestic price then it makes sense to export and make a higher profit. Should cotton be exported? In the cotton XPP example, if the XPP in Ouagadougou is higher than the local price of cotton then it is worthwhile exporting to Liverpool, otherwise the exporter might as well sell the cotton locally. Since we are taking the exporter’s perspective and assessing if it is profitable for the exporter to ship cotton to Liverpool, we have to subtract the shipping costs (that an importer will pay) from the CIF at Liverpool when calculating the XPP at Ouagadougou. FOR FOOD SECURITY ANALYSTS: both perspectives are important because both determine whether a particular food product/commodity will be available and accessible for consumption in a specific location in the country. However, when calculating a parity price one perspective has to be taken at a time and that perspective will dictate whether we have to add or subtract different components/items. Whenever we calculate XPP or IPP in the context of food security analysis, it is critical to first determine whose food security we are analyzing (i.e. the importing or exporting country) and then take this perspective as the relevant perspective. If the country exports cotton, it is important to determine the cotton XPP and establish if the export market is lucrative enough to provide higher incomes to domestic farmers thereby allowing them to purchase other goods that they do not produce. When calculating the XPP the transport costs have to be subtracted because the transport cost is not incurred by the exporter (see table 2). If a country imports wheat, for example, it will be important to establish the wheat IPP to determine if there are incentives for importers to make wheat available in the local market by buying from foreign markets and thereby avert potential wheat shortages. Now, when calculating this IPP, transport costs will have to be added to the FOB since the importer views these as a cost they pay to bring the wheat to the domestic market. In both cases, calculating XPP and IPP would allow the analyst to determine the costs of transport and profit margins associated with the good in question thereby further elucidating the price structure; this price structure is critical because it affects food security in a location. Table 2 gives a summary of the exporter and importer perspectives vis‐à‐vis the parity prices of cotton.
FEWS NET Markets Guidance, No. 1 May 2008
Famine Early Warning Systems Network
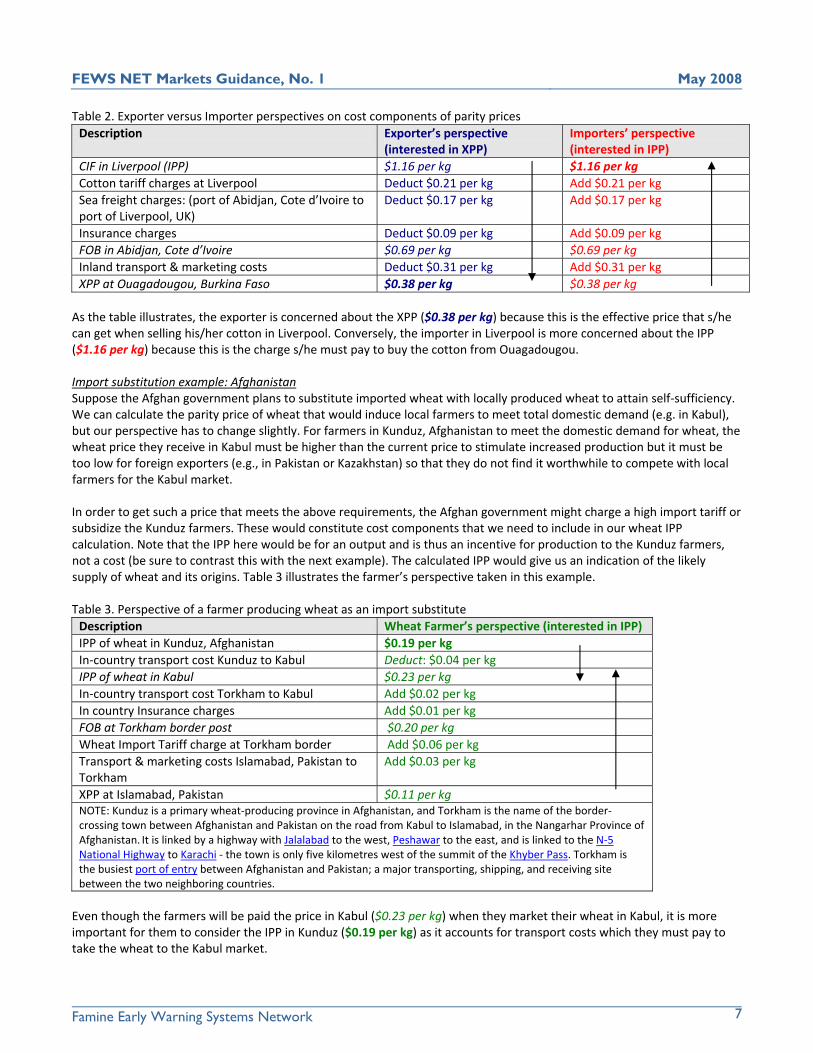
Table 2. Exporter versus Importer perspectives on cost components of parity prices Description Exporter’s perspective Importers’ perspective
(interested in XPP) (interested in IPP) CIF in Liverpool (IPP) $1.16 per kg $1.16 per kg
7
Cotton tariff charges at Liverpool Deduct $0.21 per kg Add $0.21 per kg Sea freight charges: (port of Abidjan, Cote d’Ivoire to port of Liverpool, UK)
Deduct $0.17 per kg Add $0.17 per kg
Insurance charges Deduct $0.09 per kg Add $0.09 per kg FOB in Abidjan, Cote d’Ivoire $0.69 per kg $0.69 per kg Inland transport & marketing costs Deduct $0.31 per kg Add $0.31 per kg XPP at Ouagadougou, Burkina Faso $0.38 per kg $0.38 per kg
As the table illustrates, the exporter is concerned about the XPP ($0.38 per kg) because this is the effective price that s/he can get when selling his/her cotton in Liverpool. Conversely, the importer in Liverpool is more concerned about the IPP ($1.16 per kg) because this is the charge s/he must pay to buy the cotton from Ouagadougou. Import substitution example: Afghanistan Suppose the Afghan government plans to substitute imported wheat with locally produced wheat to attain self‐sufficiency. We can calculate the parity price of wheat that would induce local farmers to meet total domestic demand (e.g. in Kabul), but our perspective has to change slightly. For farmers in Kunduz, Afghanistan to meet the domestic demand for wheat, the wheat price they receive in Kabul must be higher than the current price to stimulate increased production but it must be too low for foreign exporters (e.g., in Pakistan or Kazakhstan) so that they do not find it worthwhile to compete with local farmers for the Kabul market. In order to get such a price that meets the above requirements, the Afghan government might charge a high import tariff or subsidize the Kunduz farmers. These would constitute cost components that we need to include in our wheat IPP calculation. Note that the IPP here would be for an output and is thus an incentive for production to the Kunduz farmers, not a cost (be sure to contrast this with the next example). The calculated IPP would give us an indication of the likely supply of wheat and its origins. Table 3 illustrates the farmer’s perspective taken in this example. Table 3. Perspective of a farmer producing wheat as an import substitute Description Wheat Farmer’s perspective (interested in IPP) IPP of wheat in Kunduz, Afghanistan $0.19 per kg In‐country transport cost Kunduz to Kabul Deduct: $0.04 per kg IPP of wheat in Kabul $0.23 per kg In‐country transport cost Torkham to Kabul Add $0.02 per kg In country Insurance charges Add $0.01 per kg FOB at Torkham border post $0.20 per kg Wheat Import Tariff charge at Torkham border Add $0.06 per kg Transport & marketing costs Islamabad, Pakistan to Torkham
Add $0.03 per kg
XPP at Islamabad, Pakistan $0.11 per kg NOTE: Kunduz is a primary wheat‐producing province in Afghanistan, and Torkham is the name of the border‐ crossing town between Afghanistan and Pakistan on the road from Kabul to Islamabad, in the Nangarhar Province of Afghanistan. It is linked by a highway with Jalalabad to the west, Peshawar to the east, and is linked to the N‐5 National Highway to Karachi ‐ the town is only five kilometres west of the summit of the Khyber Pass. Torkham is the busiest port of entry between Afghanistan and Pakistan; a major transporting, shipping, and receiving site between the two neighboring countries.
Even though the farmers will be paid the price in Kabul ($0.23 per kg) when they market their wheat in Kabul, it is more important for them to consider the IPP in Kunduz ($0.19 per kg) as it accounts for transport costs which they must pay to take the wheat to the Kabul market.
FEWS NET Markets Guidance, No. 1 May 2008
Famine Early Warning Systems Network
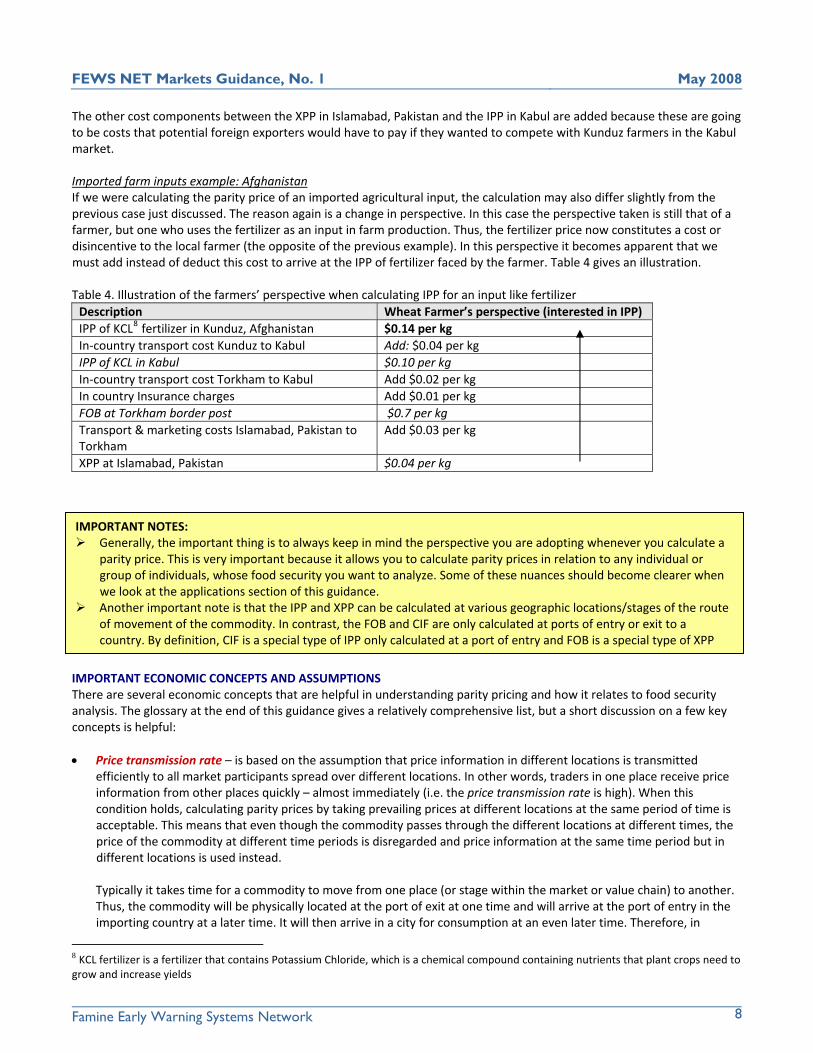
The other cost components between the XPP in Islamabad, Pakistan and the IPP in Kabul are added because these are going to be costs that potential foreign exporters would have to pay if they wanted to compete with Kunduz farmers in the Kabul market. Imported farm inputs example: Afghanistan If we were calculating the parity price of an imported agricultural input, the calculation may also differ slightly from the previous case just discussed. The reason again is a change in perspective. In this case the perspective taken is still that of a farmer, but one who uses the fertilizer as an input in farm production. Thus, the fertilizer price now constitutes a cost or disincentive to the local farmer (the opposite of the previous example). In this perspective it becomes apparent that we must add instead of deduct this cost to arrive at the IPP of fertilizer faced by the farmer. Table 4 gives an illustration. Table 4. Illustration of the farmers’ perspective when calculating IPP for an input like fertilizer Description Wheat Farmer’s perspective (interested in IPP)
8IPP of KCL fertilizer in Kunduz, Afghanistan $0.14 per kg In‐country transport cost Kunduz to Kabul Add: $0.04 per kg IPP of KCL in Kabul $0.10 per kg In‐country transport cost Torkham to Kabul Add $0.02 per kg In country Insurance charges Add $0.01 per kg FOB at Torkham border post $0.7 per kg Transport & marketing costs Islamabad, Pakistan to Torkham
Add $0.03 per kg
XPP at Islamabad, Pakistan $0.04 per kg
8
IMPORTANT NOTES: Generally, the important thing is to always keep in mind the perspective you are adopting whenever you calculate a
parity price. This is very important because it allows you to calculate parity prices in relation to any individual or group of individuals, whose food security you want to analyze. Some of these nuances should become clearer when we look at the applications section of this guidance.
Another important note is that the IPP and XPP can be calculated at various geographic locations/stages of the route of movement of the commodity. In contrast, the FOB and CIF are only calculated at ports of entry or exit to a country. By definition, CIF is a special type of IPP only calculated at a port of entry and FOB is a special type of XPP
IMPORTANT ECONOMIC CONCEPTS AND ASSUMPTIONS There are several economic concepts that are helpful in understanding parity pricing and how it relates to food security analysis. The glossary at the end of this guidance gives a relatively comprehensive list, but a short discussion on a few key concepts is helpful: • Price transmission rate – is based on the assumption that price information in different locations is transmitted
efficiently to all market participants spread over different locations. In other words, traders in one place receive price information from other places quickly – almost immediately (i.e. the price transmission rate is high). When this condition holds, calculating parity prices by taking prevailing prices at different locations at the same period of time is acceptable. This means that even though the commodity passes through the different locations at different times, the price of the commodity at different time periods is disregarded and price information at the same time period but in different locations is used instead.
Typically it takes time for a commodity to move from one place (or stage within the market or value chain) to another. Thus, the commodity will be physically located at the port of exit at one time and will arrive at the port of entry in the importing country at a later time. It will then arrive in a city for consumption at an even later time. Therefore, in
8 KCL fertilizer is a fertilizer that contains Potassium Chloride, which is a chemical compound containing nutrients that plant crops need to grow and increase yields
FEWS NET Markets Guidance, No. 1 May 2008
Famine Early Warning Systems Network
9
principle, calculations of parity prices based on prevailing prices and costs observed at one time point are somewhat unrealistic and inaccurate. If it were possible, one ought to trace back the movement of the commodity over time and through different stages in the supply chain and use corresponding prices for the different line items in the parity price calculation. However, this can be tedious and very difficult, especially if data are hard to come by. This is why most calculations simply assume a high rate of price transmission. Therefore, it is standard to assume a high price transmission rate unless:
prices and exchange rates fluctuate a lot within a very short period of time the country under consideration has very high levels of inflation price information is not easily communicated from one location to another.
The reality on the ground can be very different – delays can be substantial (e.g., clearing customs can take several days, bad roads and severe weather conditions such as floods and storm can cause delays). Because of this, the price transmission rate should always be assessed by the analyst to determine the validity of his/her parity price calculations. To gain a sense of how high or low the rate of price transmission is, one can compare the changes in prices in one location to those in other locations and determine whether they are generally increasing or decreasing at the same times and if the changes between time periods are very high or not. For example, the border price of wheat in a country for the last 120 days can be graphed with the price of wheat in a market center. It can then be observed if the price changes more or less coincide with when the border price changes and how drastic these changes were over a short space of time). This is a relatively crude but rapid assessment method. There are other more complex techniques that can be used to analyze price transmission rates in detail but these take more time and data to execute and are beyond the scope of this guidance.
• Traded versus non‐traded goods ‐ Traded goods are defined as those products that can be exported or imported (e.g., KCL fertilizer and agricultural commodities), while non‐traded goods are those that cannot (e.g., domestic transport services). Non‐traded goods cannot be traded either because of their nature (e.g., if they cannot be transported into or out of a country such grain milling services) or due to restraining production and marketing costs or due to restrictive trade policies and regulations. In the context of food security analysis, it only makes sense to calculate import and export parity prices for traded goods because non‐traded goods can only be made available in a country through local production. Of course, some goods are officially non‐traded only because of restrictive trade policies but through so‐called “black markets” these goods might still be traded. In such cases it may still make sense to calculate IPP and XPP. In addition, parity price calculations can be made for non‐traded goods that are found in different locations within a country. This may be done to compare prices in different areas in a country and thus ascertain incentives or disincentives to move the non‐traded good from one part of the country to another, even though the good is not moved across country borders. However, these party prices are not what are typically referred to as IPP or XPP, but rather relevant to general spatial price analysis, which is important in food security analysis and can be tied in with Import and Export Parity Price Analysis.
• Law of one price ‐ In calculating parity prices, it is assumed that prices of the same commodity in different locations are
only different because of transport, marketing and transaction costs. This is sometimes referred to as the law of one price (LOOP). It is assumed that no individual or firm can persistently earn excessive profits just by buying a product in one market and selling it in another because other individuals will see the opportunity and do the same, thereby increasing the quantity sold in the lucrative market and in turn lowering prices.
The law of one price is based on the assumption that domestic country markets are competitive and well‐integrated with world markets and people can freely enter the market. However, it is possible, and often the case in the real world, that domestic country markets are not competitive (e.g., a monopoly controlling a grain market). Thus while the assumption underlies our calculations we ought to assess the different components of our calculated parity prices, and see what proportion of the price might be attributed to excessive profiteering.
FEWS NET Markets Guidance, No. 1 May 2008
Famine Early Warning Systems Network
10
This can be done by market analysts and researchers using techniques that are beyond the scope of this guide. Nevertheless, a rudimentary assessment can be done by finding out the number of firms or market players who buy and sell the product between the different stages in the supply chain and assessing to what extent these firms are able to withhold market information and if these firms or market players are able to make excessive profits over and above the marketing cost (including labor, processing and transport etc.) for a prolonged time period (e.g. 3 months) without facing competition that will drive these profits down. If the case is that such firms are few and are able to control market information and maintain excessive profits then these profit margins may have to be estimated and included in the parity price calculation. This can be very difficult because such information is often private and confidential. However, profit margin estimates that we can rely on are often based on estimated costs of inputs used by these firms less the selling prices for their products.
For more detailed discussions on other important economic concepts related to parity pricing, a list of references and websites are provided in the annexes of the guidance.
APPLICATIONS (EXAMPLES OF USE) FOR FEWS NET WORK The following are examples of parity price calculations to illustrate how you might go about calculating parity prices and presenting them to decision makers and other users of food security analysis. An effort has been made to make them as real as possible. Nevertheless, the accuracy of the figures presented here is not the important point. Rather the layout used and order of line items presented in calculating the parity price is the main focus. It is imperative that the order of line items from top to bottom follow the geographic movement of the commodity whose parity price is being calculated. If you are familiar with accounting, bookkeeping or budgeting you will realize some similarities with the parity price calculations. In practice, the calculations of parity prices in these applications can be done in an Excel spreadsheet or any budgeting/accounting framework or computer program that the analyst is familiar with (even a table in a word processor). This is done so that different prices, costs and line items can be neatly organized, making it easy for the reader to follow and understand the calculations and numbers. A spreadsheet of parity price calculations can provide some additional detail and insights on the different costs of trading and marketing goods and you may want to keep track of this over time. This has implications on how you set up your spreadsheet of calculations. So you might have a row above the two rows as shown in table 5, or one which indicates the time period for each number as shown in table 6. This is just one way of organizing your spreadsheets. The important thing is that they are easy to read and follow. Table 5. Illustrating the format in a spreadsheet: Words Currency Number Border price at Limpopo, South Africa US$ 239
Table 6. Illustrating the format in a spreadsheet for several time periods Dec 15th Dec 17th Dec 20th Words Currency Number Number Number Border price at Limpopo, South Africa US$ 239 217 224
In the applications that follow, only one time period is shown to avoid confusion. The applications use different settings to show the variety of issues that may arise for different parity price calculations. The data and information needed to calculate the parity prices is assumed to have already been collected thus the applications start by listing the data and information then show how to put the data together in the correct order, to calculate the parity prices. Also, the applications make use of city and port names from different parts of the world. If the reader is not familiar with the geography of the places or names and locations alluded to, a few footnotes have been included at the bottom of each parity price calculation in order to inform the reader and hopefully avoid confusion about names and places.
FEWS NET Markets Guidance, No. 1 May 2008
Famine Early Warning Systems Network
11
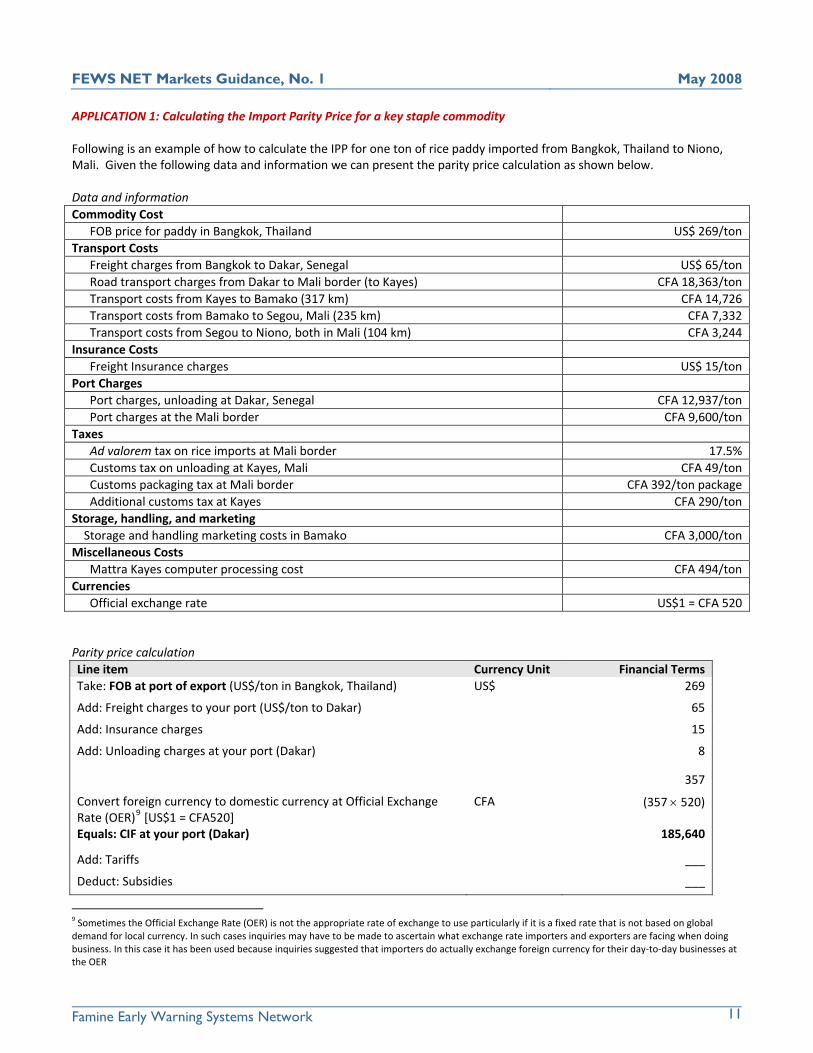
APPLICATION 1: Calculating the Import Parity Price for a key staple commodity Following is an example of how to calculate the IPP for one ton of rice paddy imported from Bangkok, Thailand to Niono, Mali. Given the following data and information we can present the parity price calculation as shown below. Data and information Commodity Cost
FOB price for paddy in Bangkok, Thailand US$ 269/ton Transport Costs
Freight charges from Bangkok to Dakar, Senegal US$ 65/ton Road transport charges from Dakar to Mali border (to Kayes) CFA 18,363/ton Transport costs from Kayes to Bamako (317 km) CFA 14,726 Transport costs from Bamako to Segou, Mali (235 km) CFA 7,332 Transport costs from Segou to Niono, both in Mali (104 km) CFA 3,244
Insurance Costs Freight Insurance charges US$ 15/ton
Port Charges Port charges, unloading at Dakar, Senegal CFA 12,937/ton Port charges at the Mali border CFA 9,600/ton
Taxes Ad valorem tax on rice imports at Mali border 17.5% Customs tax on unloading at Kayes, Mali CFA 49/ton Customs packaging tax at Mali border CFA 392/ton package Additional customs tax at Kayes CFA 290/ton
Storage, handling, and marketing Storage and handling marketing costs in Bamako CFA 3,000/ton Miscellaneous Costs
Mattra Kayes computer processing cost CFA 494/ton Currencies
Official exchange rate US$1 = CFA 520 Parity price calculation Line item Currency Unit Financial Terms Take: FOB at port of export (US$/ton in Bangkok, Thailand) US$ 269
Add: Freight charges to your port (US$/ton to Dakar) 65
Add: Insurance charges 15
Add: Unloading charges at your port (Dakar) 8
357
Convert foreign currency to domestic currency at Official Exchange Rate (OER)9 [US$1 = CFA520]
CFA (357 × 520)
Equals: CIF at your port (Dakar) 185,640
Add: Tariffs ___
Deduct: Subsidies ___
9 Sometimes the Official Exchange Rate (OER) is not the appropriate rate of exchange to use particularly if it is a fixed rate that is not based on global demand for local currency. In such cases inquiries may have to be made to ascertain what exchange rate importers and exporters are facing when doing business. In this case it has been used because inquiries suggested that importers do actually exchange foreign currency for their day‐to‐day businesses at the OER
FEWS NET Markets Guidance, No. 1 May 2008
Famine Early Warning Systems Network
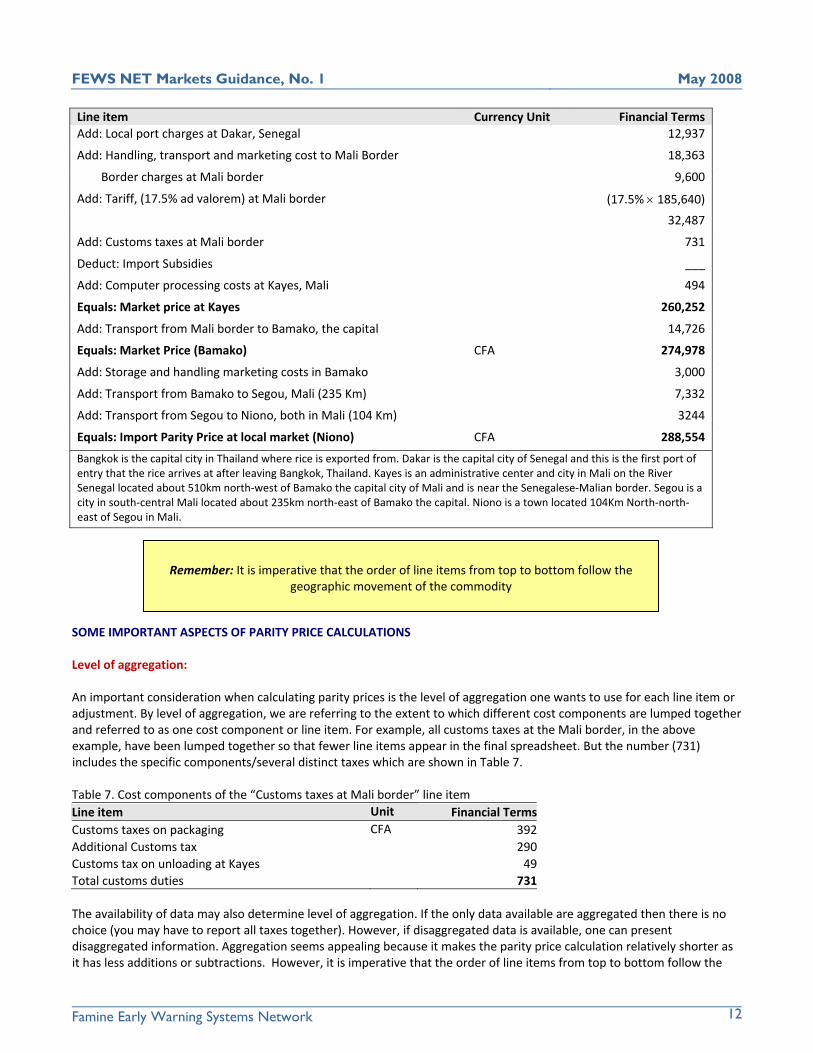
Line item Currency Unit Financial Terms Add: Local port charges at Dakar, Senegal 12,937
Add: Handling, transport and marketing cost to Mali Border 18,363
Border charges at Mali border 9,600
Add: Tariff, (17.5% ad valorem) at Mali border (17.5% × 185,640)
32,487
Add: Customs taxes at Mali border 731
Deduct: Import Subsidies ___
Add: Computer processing costs at Kayes, Mali 494
Equals: Market price at Kayes 260,252
Add: Transport from Mali border to Bamako, the capital 14,726
Equals: Market Price (Bamako) CFA 274,978
Add: Storage and handling marketing costs in Bamako 3,000
Add: Transport from Bamako to Segou, Mali (235 Km) 7,332
Add: Transport from Segou to Niono, both in Mali (104 Km) 3244
Equals: Import Parity Price at local market (Niono) CFA 288,554
Bangkok is the capital city in Thailand where rice is exported from. Dakar is the capital city of Senegal and this is the first port of entry that the rice arrives at after leaving Bangkok, Thailand. Kayes is an administrative center and city in Mali on the River Senegal located about 510km north‐west of Bamako the capital city of Mali and is near the Senegalese‐Malian border. Segou is a city in south‐central Mali located about 235km north‐east of Bamako the capital. Niono is a town located 104Km North‐north‐east of Segou in Mali.
Remember: It is imperative that the order of line items from top to bottom follow the geographic movement of the commodity
SOME IMPORTANT ASPECTS OF PARITY PRICE CALCULATIONS Level of aggregation: An important consideration when calculating parity prices is the level of aggregation one wants to use for each line item or adjustment. By level of aggregation, we are referring to the extent to which different cost components are lumped together and referred to as one cost component or line item. For example, all customs taxes at the Mali border, in the above example, have been lumped together so that fewer line items appear in the final spreadsheet. But the number (731) includes the specific components/several distinct taxes which are shown in Table 7.
Table 7. Cost components of the “Customs taxes at Mali border” line item
Unit Line item Financial TermsCFA Customs taxes on packaging 392 Additional Customs tax 290 Customs tax on unloading at Kayes 49 Total customs duties 731
The availability of data may also determine level of aggregation. If the only data available are aggregated then there is no choice (you may have to report all taxes together). However, if disaggregated data is available, one can present disaggregated information. Aggregation seems appealing because it makes the parity price calculation relatively shorter as it has less additions or subtractions. However, it is imperative that the order of line items from top to bottom follow the
12
FEWS NET Markets Guidance, No. 1 May 2008
Famine Early Warning Systems Network
geographic movement of the commodity. This prevents lumping the customs charges at the Dakar port together with those charged at the Mali border, even though they are all customs related costs. The reason you want to list the customs charges separately is that it allows you to follow the movement of the commodity and when costs are incurred and which country has levied the taxes. A summary calculation or spreadsheet of costs can list information about the parity price at different geographic locations/levels in the delivery system of the commodity without giving details about what are the largest costs and where are they incurred. It provides a simple comparison of prices between two points. So, for the summarized spreadsheet example above, we can tell that the import parity price of rice in Segou is the sum of all line items except the transport cost between Segou and Niono (i.e. CFA 288,554 – 3,244 = CFA 285,310). This allows us to say something about the food security situation in various places using the same IPP or XPP calculation (in this case Segou and Niono). For example, we can say that transport costs between Segou and Niono only constitute about 1% of the total IPP of rice in Niono such that food security in Niono is less likely to depend on that transport cost. Food security in Niono is more dependent on the world FOB price of rice in Bangkok, Thailand which constitutes about 48% of the IPP of rice in Niono. We can also use this information about the calculated IPP together with other information that we might collect from Niono to find out if Thai rice is relatively affordable or not, and which segments of the populations would be able to afford it. This would give us an indication of how accessible imported Thai rice is. Transport routes: Traders can transport the commodity to a location using multiple routes. For instance we might have information that the rice in our example is also being transported directly from the border of Mali and Senegal to Segou, rather than passing through Bamako:
� Transport, border to Segou (via Sikasso & Koutiala) CFA12,342/ton
In such a case we have the option of calculating several parity prices depending on the route we choose. It is generally more useful to calculate the parity price based on the most used routes, which will tend to be the cheapest for obvious reasons. However, in some cases a route may be used more often even though it is relatively more expensive because it passes through a major city where a large urban consumer population resides. So for our Malian example (Table 7), the IPP for rice has been calculated based on the route that passes through Bamako because Bamako is the capital city of Mali; hence most rice imports will pass through this route. It can be seen in our example that had we calculated the IPP based on the direct route that does not pass through Bamako the IPP would have been lower. Processing Conversion Factor (PCF): The IPP we want to calculate may involve a processed product. So for our Malian example, we might want to calculate the IPP for processed rice, not paddy. To do this, we need to know what is called the processing conversion factor (PCF)10 for processing paddy to rice
Definition: The Processing Conversion Factor (PCF) is a ratio of the quantity of a processed product to the quantity of the unprocessed product that the processed product was derived from. It basically tells us how much of the processed product will result from processing one unit of the unprocessed product.
This is the quantity of rice that 1 unit of paddy will yield after being processed (i.e. after taking into account processing/refinery losses how much rice is left from the 1 unit of paddy). In addition, we will need to know the actual cost of processing the paddy into rice in order to calculate the IPP for the processed rice:
� Processing conversion factor (PCF) from paddy to rice: 1 kg paddy = 0.64 kg rice � Paddy processing costs in Bamako CFA50/kg
10 The Processing Conversion Factor (PCF) is usually a number between zero and one because some of the unprocessed good is lost or comes out as a by‐product during the processing (e.g. the rough parts of the maize grain and chaff – the protective casing of the maize grain)
13
FEWS NET Markets Guidance, No. 1 May 2008
Famine Early Warning Systems Network
Given this information, we can take the IPP for one ton of paddy in the location where it will be processed and divide it by 0.64 then add the processing cost to get the IPP for one ton of processed rice in the same processing location. To avoid confusion on whether we should divide or multiply by the PCF, always ask yourself if you would expect one ton of processed rice to cost more or less than 0.64 tons of processed rice (which is equivalent to one ton of unprocessed paddy). The answer is obvious; one ton of processed rice will cost more than 0.64 tons of processed rice. So the parity price of a ton of processed rice should be higher and it can only be higher if we divide by a fraction (which is the processing conversion factor). So to illustrate, if the IPP of one ton of unprocessed paddy in Bamako, Mali is CFA 274,978 and the processing conversion factor for paddy to rice is 0.64 then the IPP for one ton of processed rice in Bamako, Mali is: (CFA274,978÷0.64)+paddy processing cost = CFA 429,653.12 + (CFA50/kg × 1000kg)=CFA 479,653.12 .
14
Paradoxing to find that no trade occurs for a particular commodity even if prices suggest that it would
t,
t
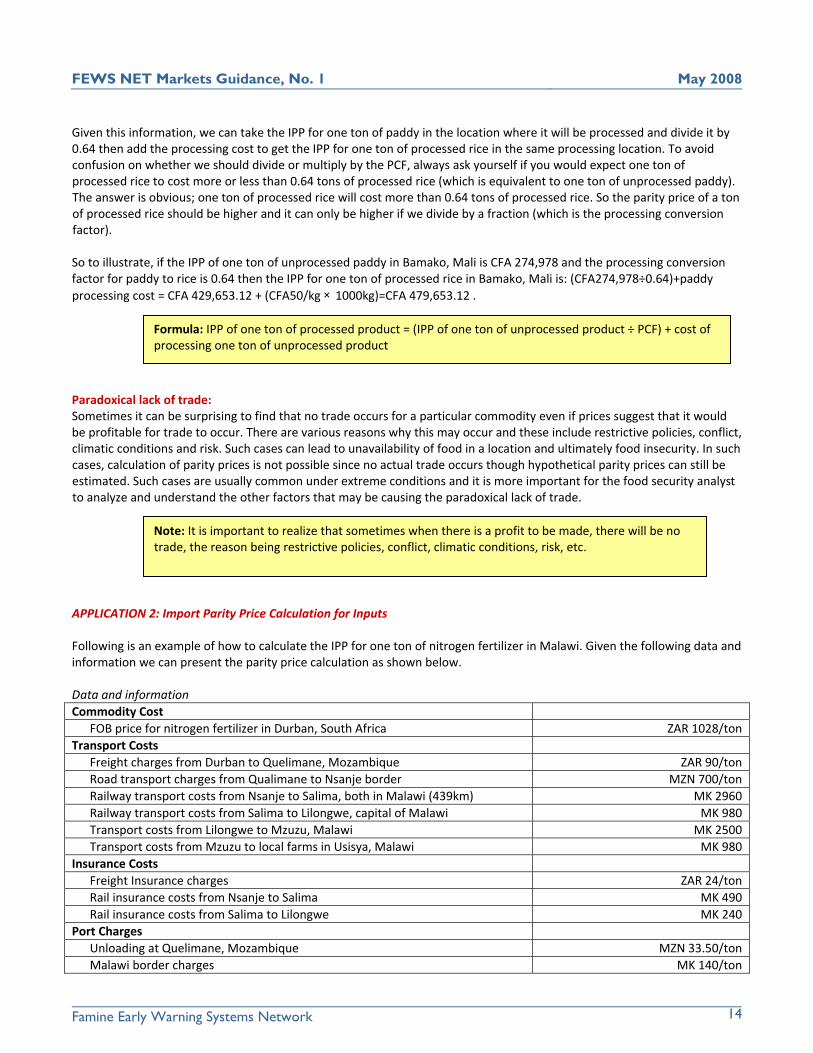
ICATION 2: Import Parity Price Calculation for Inputs
ollowing is an example of how to calculate the IPP for one ton of nitrogen fertilizer in Malawi. Given the following data and
ata and information
ical lack of trade: Sometimes it can be surprisbe profitable for trade to occur. There are various reasons why this may occur and these include restrictive policies, conflicclimatic conditions and risk. Such cases can lead to unavailability of food in a location and ultimately food insecurity. In such cases, calculation of parity prices is not possible since no actual trade occurs though hypothetical parity prices can still be estimated. Such cases are usually common under extreme conditions and it is more important for the food security analysto analyze and understand the other factors that may be causing the paradoxical lack of trade.
PPLA
Finformation we can present the parity price calculation as shown below. DCommodity Cost
FOB price for nitrogen fertilizer in Durban, South Africa ZAR 1028/ton Transport Costs
Freight charges from Durban to Quelimane, Mozambique ZAR 90/ton Road transport charges from Qualimane to Nsanje border MZN 700/ton Railway transport costs from Nsanje to Salima, both in Malawi (439km) MK 2960 Railway transport costs from Salima to Lilongwe, capital of Malawi MK 980 Transport costs from Lilongwe to Mzuzu, Malawi MK 2500 Transport costs from Mzuzu to local farms in Usisya, Malawi MK 980
Insurance Costs Freight Insurance charges ZAR 24/ton Rail insurance costs from Nsanje to Salima MK 490 Rail insurance costs from Salima to Lilongwe MK 240
Port Charges Unloading at Quelimane, Mozambique MZN 33.50/ton Malawi border charges MK 140/ton
Formula: IPP of one ton of processed product = (IPP of one ton of unprocessed product ÷ PCF) + cost of processing one ton of unprocessed product
Note: It is important to realize that sometimes when there is a profit to be made, there will be no trade, the reason being restrictive policies, conflict, climatic conditions, risk, etc.
FEWS NET Markets Guidance, No. 1 May 2008
Famine Early Warning Systems Network
15
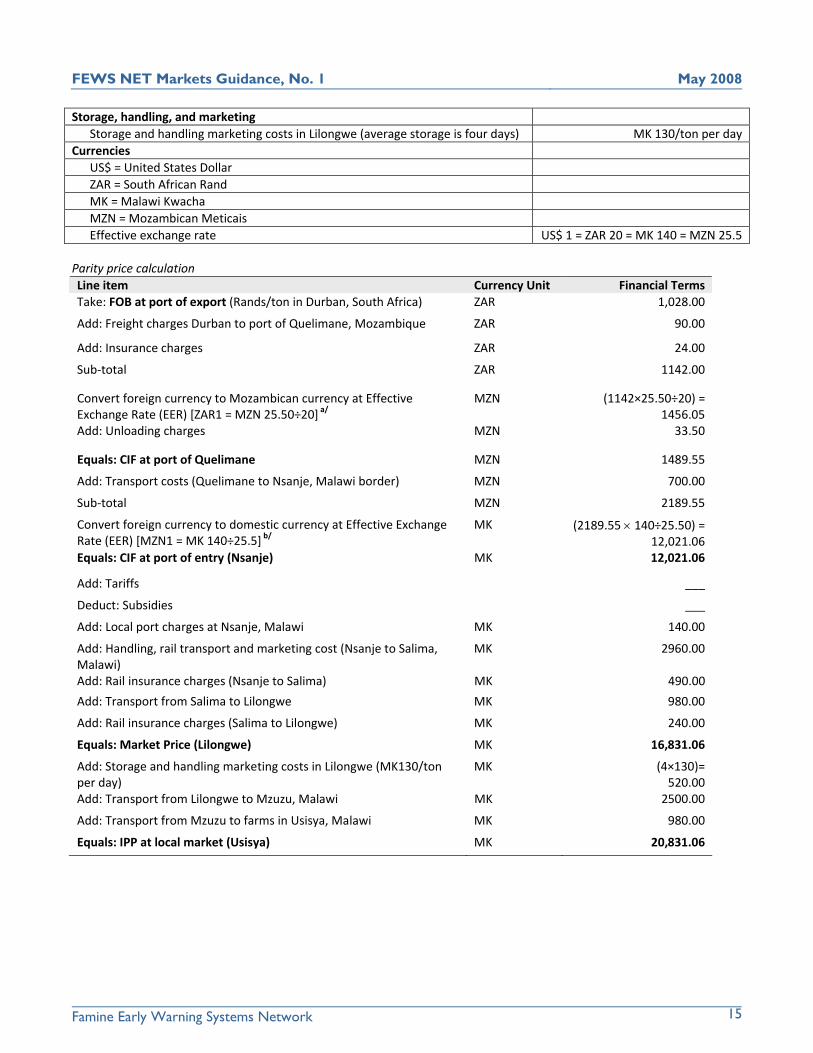
Sto keting rage, handling, and mar Storage and handling marketing costs in Lilongwe (average storage is four days) MK 130/ton per day
Currencies US$ = United States Dollar ZAR = South African Rand MK = Malawi Kwacha MZN = Mozambican Meticais Effective exchange rate US$ 1 = ZAR 20 = MK 140 = MZN 25.5
arity price calculation PLine item Currency Unit Financial Terms Take: FOB at port of export (Rands/ton in Durban, South Africa)
11
Convert foreign currency to Mozambican currency at Effective MZN (1142×25.50÷20) =
MZN
Equals: CIF at port of Quelimane MZN 1489.55
Nsanje, Malawi border)
2
reign currency to domestic currency at Effective Exchange (2189.55 × 140÷
MK
idies
rges at Nsanje, Malawi K 14
cost (Nsanje to Salima, 2
insurance charges (Nsanje to Salima) MK 490.00
ongwe)
16,
ting costs in Lilongwe (MK130/ton
sport from Lilongwe to Mzuzu, Malawi MK 2
lawi
20,
ZAR 1,028.00
Add: Freight charges Durban to port of Quelimane, Mozambique ZAR 90.00
Add: Insurance charges ZAR 24.00
Sub‐total ZAR 42.00
Exchange Rate (EER) [ZAR1 = MZN 25.50÷20] a/ 1456.05 33.50 Add: Unloading charges
Add: Transport costs (Quelimane to MZN 700.00
Sub‐total MZN 189.55
Convert foRate (EER) [MZN1 = MK 140÷25.5] b/
MK 25.50) = 12,021.06 12,021.06 Equals: CIF at port of entry (Nsanje)
Add: Tariffs ___
Deduct: Subs ___
Add: Local port cha M 0.00
Add: Handling, rail transport and marketingMalawi) Add: Rail
MK 960.00
Add: Transport from Salima to Lilongwe MK 980.00
Add: Rail insurance charges (Salima to Lil MK 240.00
Equals: Market Price (Lilongwe) MK 831.06
Add: Storage and handling markeper day) Add: Tran
MK (4×130)= 520.00 500.00
Add: Transport from Mzuzu to farms in Usisya, Ma MK 980.00
Equals: IPP at local market (Usisya) MK 831.06
FEWS NET Markets Guidance, No. 1 May 2008
Famine Early Warning Systems Network
16
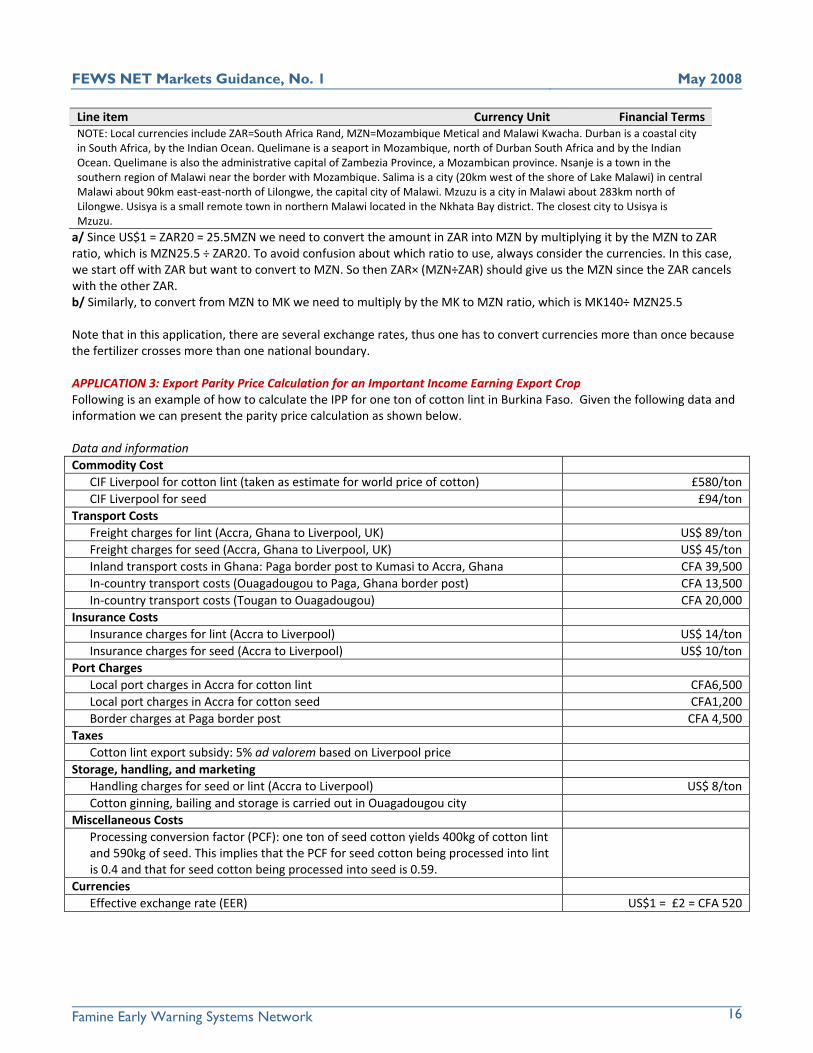
Line item Currency Unit Financial Terms NOTE: Local currencies include ZAR=South Africa Rand, MZN=Mozambique Metical and Malawi Kwacha. Durban is a coastal city in South Africa, by the Indian Ocean. Quelimane is a seaport in Mozambique, north of Durban South Africa and by the Indian Ocean. Quelimane is also the administrative capital of Zambezia Province, a Mozambican province. Nsanje is a town in the southern region of Malawi near the border with Mozambique. Salima is a city (20km west of the shore of Lake Malawi) in central Malawi about 90km east‐east‐north of Lilongwe, the capital city of Malawi. Mzuzu is a city in Malawi about 283km north of Lilongwe. Usisya is a small remote town in northern Malawi located in the Nkhata Bay district. The closest city to Usisya is Mzuzu. a/ Since US$1 = ZAR20 = 25.5MZN we need to convert the amount in ZAR into MZN by multiplying it by the MZN to ZAR ratio, which is MZN25.5 ÷ ZAR20. To avoid confusion about which ratio to use, always consider the currencies. In this case, we start off with ZAR but want to convert to MZN. So then ZAR× (MZN÷ZAR) should give us the MZN since the ZAR cancels with the other ZAR. b/ Similarly, to convert from MZN to MK we need to multiply by the MK to MZN ratio, which is MK140÷ MZN25.5 Note that in this application, there are several exchange rates, thus one has to convert currencies more than once because the fertilizer crosses more than one national boundary. APPLICATION 3: Export Parity Price Calculation for an Important Income Earning Export Crop Following is an example of how to calculate the IPP for one ton of cotton lint in Burkina Faso. Given the following data and information we can present the parity price calculation as shown below. Data and information Commodity Cost
CIF Liverpool for cotton lint (taken as estimate for world price of cotton) £580/ton CIF Liverpool for seed £94/ton
Transport Costs Freight charges for lint (Accra, Ghana to Liverpool, UK) US$ 89/ton Freight charges for seed (Accra, Ghana to Liverpool, UK) US$ 45/ton Inland transport costs in Ghana: Paga border post to Kumasi to Accra, Ghana CFA 39,500 In‐country transport costs (Ouagadougou to Paga, Ghana border post) CFA 13,500 In‐country transport costs (Tougan to Ouagadougou) CFA 20,000
Insurance Costs Insurance charges for lint (Accra to Liverpool) US$ 14/ton Insurance charges for seed (Accra to Liverpool) US$ 10/ton
Port Charges Local port charges in Accra for cotton lint CFA6,500 Local port charges in Accra for cotton seed CFA1,200 Border charges at Paga border post CFA 4,500
Taxes Cotton lint export subsidy: 5% ad valorem based on Liverpool price
Storage, handling, and marketing Handling charges for seed or lint (Accra to Liverpool) US$ 8/ton Cotton ginning, bailing and storage is carried out in Ouagadougou city
Miscellaneous Costs Processing conversion factor (PCF): one ton of seed cotton yields 400kg of cotton lint and 590kg of seed. This implies that the PCF for seed cotton being processed into lint is 0.4 and that for seed cotton being processed into seed is 0.59.
Currencies Effective exchange rate (EER) US$1 = £2 = CFA 520
FEWS NET Markets Guidance, No. 1 May 2008
Famine Early Warning Systems Network
17
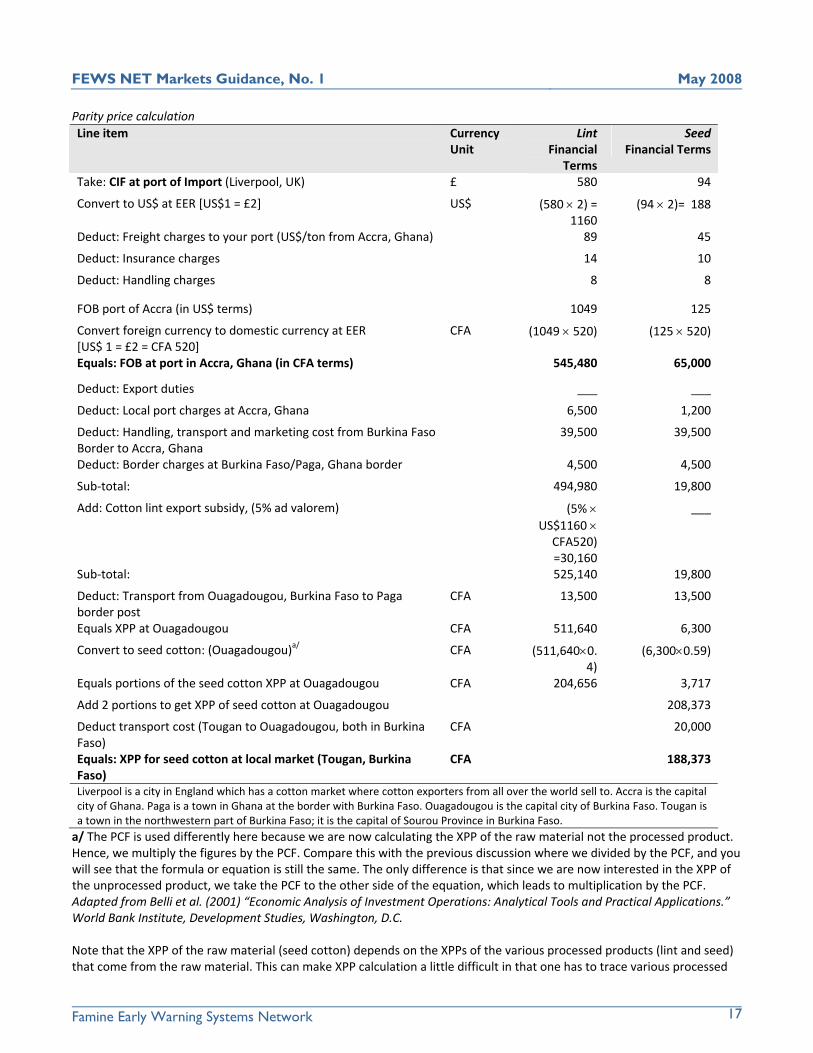
Parity price calculation Line item
Currency Unit
Lint Financial
Terms
SeedFinancial Terms
Take: CIF at port of Import (Liverpool, UK) £ 580 94
Convert to US$ at EER [US$1 = £2] US$ (580 × 2) = 1160
(94 × 2)= 188
Deduct: Freight charges to your port (US$/ton from Accra, Ghana) 89 45
Deduct: Insurance charges 14 10
Deduct: Handling charges 8 8
FOB port of Accra (in US$ terms) 1049 125
Convert foreign currency to domestic currency at EER [US$ 1 = £2 = CFA 520]
CFA (1049 × 520) (125 × 520)
Equals: FOB at port in Accra, Ghana (in CFA terms) 545,480 65,000
Deduct: Export duties ___ ___
Deduct: Local port charges at Accra, Ghana 6,500 1,200
Deduct: Handling, transport and marketing cost from Burkina Faso Border to Accra, Ghana
39,500 39,500
Deduct: Border charges at Burkina Faso/Paga, Ghana border 4,500 4,500
Sub‐total: 494,980 19,800
Add: Cotton lint export subsidy, (5% ad valorem) (5% × US$1160 ×
CFA520) =30,160
___
Sub‐total: 525,140 19,800
Deduct: Transport from Ouagadougou, Burkina Faso to Paga border post
CFA 13,500 13,500
Equals XPP at Ouagadougou CFA 511,640 6,300
Convert to seed cotton: (Ouagadougou)a/ CFA (511,640×0.4)
(6,300×0.59)
Equals portions of the seed cotton XPP at Ouagadougou CFA 204,656 3,717
Add 2 portions to get XPP of seed cotton at Ouagadougou 208,373
Deduct transport cost (Tougan to Ouagadougou, both in Burkina Faso)
CFA 20,000
Equals: XPP for seed cotton at local market (Tougan, Burkina Faso)
CFA 188,373
Liverpool is a city in England which has a cotton market where cotton exporters from all over the world sell to. Accra is the capital city of Ghana. Paga is a town in Ghana at the border with Burkina Faso. Ouagadougou is the capital city of Burkina Faso. Tougan is a town in the northwestern part of Burkina Faso; it is the capital of Sourou Province in Burkina Faso. a/ The PCF is used differently here because we are now calculating the XPP of the raw material not the processed product. Hence, we multiply the figures by the PCF. Compare this with the previous discussion where we divided by the PCF, and you will see that the formula or equation is still the same. The only difference is that since we are now interested in the XPP of the unprocessed product, we take the PCF to the other side of the equation, which leads to multiplication by the PCF. Adapted from Belli et al. (2001) “Economic Analysis of Investment Operations: Analytical Tools and Practical Applications.” World Bank Institute, Development Studies, Washington, D.C. Note that the XPP of the raw material (seed cotton) depends on the XPPs of the various processed products (lint and seed) that come from the raw material. This can make XPP calculation a little difficult in that one has to trace various processed
FEWS NET Markets Guidance, No. 1 May 2008
Famine Early Warning Systems Network
18
product components of the raw material. In practice, it is common to only consider those components that are traded and those that represent a fair share of the raw material in processing. In the case of the preceding cotton example, another by‐product of called scarto (which is a very short soiled fiber not suitable for export) has been left out. The reason for this is that it is non‐traded and it constitutes only 1% of the raw seed cotton’s uses. Typically the magnitude of the PCF will give an indication of the importance of the processed product vis‐à‐vis the XPP for the raw material. In the case of scarto, the PCF for processing one ton of seed cotton to scarto is only 0.01 implying that only 10kg of scarto is yielded from one ton of seed cotton (Gittinger, 1982). This is negligible and is thus left out. Another complicating factor is that different exporters will have their products processed at different locations. So, in principle, one ought to follow‐up the exact location of processing to apply the PCF in the respective processing locations. In practice, this can be tedious and so it suffices to compute the conversion in the location where most processing occurs. Typically this would be a major city or manufacturing center in the country. Clearly, an important assumption here is that data on the PCF is available. This kind of data is often a rough estimate gathered from the major processors of the product in question. It is obvious that different processors may have different PCFs depending on their level of processing efficiency and even a single processor will have varying PFCs from one time to another. This level of detail about the PCF is often assumed away by simply taking the PCF of the major processor in a country as the reference PCF.
FEWS NET Markets Guidance, No. 1 May 2008
Famine Early Warning Systems Network
19
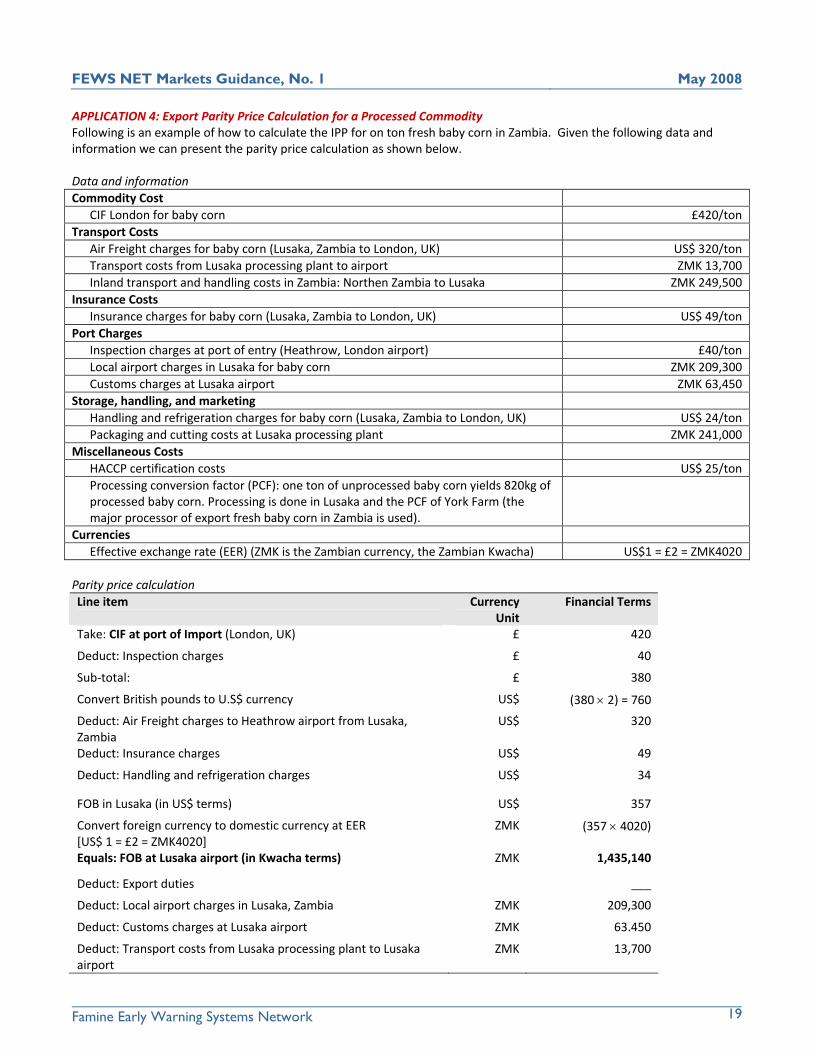
APPLICATION 4: Export Parity Price Calculation for a Processed Commodity Following is an example of how to calculate the IPP for on ton fresh baby corn in Zambia. Given the following data and information we can present the parity price calculation as shown below. Data and information Commodity Cost
CIF London for baby corn £420/ton Transport Costs
Air Freight charges for baby corn (Lusaka, Zambia to London, UK) US$ 320/ton Transport costs from Lusaka processing plant to airport ZMK 13,700 Inland transport and handling costs in Zambia: Northen Zambia to Lusaka ZMK 249,500
Insurance Costs Insurance charges for baby corn (Lusaka, Zambia to London, UK) US$ 49/ton
Port Charges Inspection charges at port of entry (Heathrow, London airport) £40/ton Local airport charges in Lusaka for baby corn ZMK 209,300 Customs charges at Lusaka airport ZMK 63,450
Storage, handling, and marketing Handling and refrigeration charges for baby corn (Lusaka, Zambia to London, UK) US$ 24/ton Packaging and cutting costs at Lusaka processing plant ZMK 241,000
Miscellaneous Costs HACCP certification costs US$ 25/ton Processing conversion factor (PCF): one ton of unprocessed baby corn yields 820kg of processed baby corn. Processing is done in Lusaka and the PCF of York Farm (the major processor of export fresh baby corn in Zambia is used).
Currencies Effective exchange rate (EER) (ZMK is the Zambian currency, the Zambian Kwacha) US$1 = £2 = ZMK4020
Parity price calculation Line item
Currency Unit
Financial Terms
Take: CIF at port of Import (London, UK) £ 420
Deduct: Inspection charges £ 40
Sub‐total: £ 380
Convert British pounds to U.S$ currency US$ (380 × 2) = 760
Deduct: Air Freight charges to Heathrow airport from Lusaka, Zambia
US$ 320
Deduct: Insurance charges US$ 49
Deduct: Handling and refrigeration charges US$ 34
FOB in Lusaka (in US$ terms) US$ 357
Convert foreign currency to domestic currency at EER [US$ 1 = £2 = ZMK4020]
ZMK (357 × 4020)
Equals: FOB at Lusaka airport (in Kwacha terms) ZMK 1,435,140
Deduct: Export duties ___
Deduct: Local airport charges in Lusaka, Zambia ZMK 209,300
Deduct: Customs charges at Lusaka airport ZMK 63.450
Deduct: Transport costs from Lusaka processing plant to Lusaka airport
ZMK 13,700
FEWS NET Markets Guidance, No. 1 May 2008
Famine Early Warning Systems Network
20
Line item
Currency Unit
Financial Terms
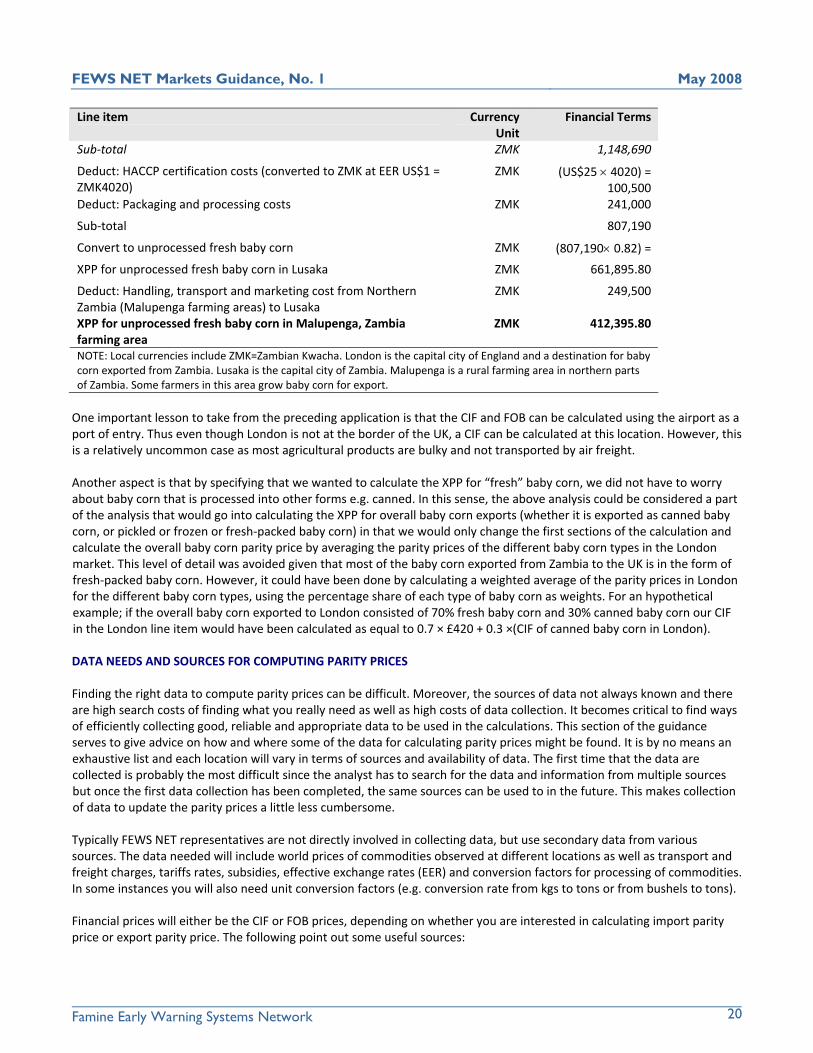
Sub‐total ZMK 1,148,690
Deduct: HACCP certification costs (converted to ZMK at EER US$1 = ZMK4020)
ZMK (US$25 × 4020) = 100,500
Deduct: Packaging and processing costs ZMK 241,000
Sub‐total 807,190
Convert to unprocessed fresh baby corn ZMK (807,190× 0.82) =
XPP for unprocessed fresh baby corn in Lusaka ZMK 661,895.80
Deduct: Handling, transport and marketing cost from Northern Zambia (Malupenga farming areas) to Lusaka
ZMK 249,500
XPP for unprocessed fresh baby corn in Malupenga, Zambia farming area
ZMK 412,395.80
NOTE: Local currencies include ZMK=Zambian Kwacha. London is the capital city of England and a destination for baby corn exported from Zambia. Lusaka is the capital city of Zambia. Malupenga is a rural farming area in northern parts of Zambia. Some farmers in this area grow baby corn for export. One important lesson to take from the preceding application is that the CIF and FOB can be calculated using the airport as a port of entry. Thus even though London is not at the border of the UK, a CIF can be calculated at this location. However, this is a relatively uncommon case as most agricultural products are bulky and not transported by air freight. Another aspect is that by specifying that we wanted to calculate the XPP for “fresh” baby corn, we did not have to worry about baby corn that is processed into other forms e.g. canned. In this sense, the above analysis could be considered a part of the analysis that would go into calculating the XPP for overall baby corn exports (whether it is exported as canned baby corn, or pickled or frozen or fresh‐packed baby corn) in that we would only change the first sections of the calculation and calculate the overall baby corn parity price by averaging the parity prices of the different baby corn types in the London market. This level of detail was avoided given that most of the baby corn exported from Zambia to the UK is in the form of fresh‐packed baby corn. However, it could have been done by calculating a weighted average of the parity prices in London for the different baby corn types, using the percentage share of each type of baby corn as weights. For an hypothetical example; if the overall baby corn exported to London consisted of 70% fresh baby corn and 30% canned baby corn our CIF in the London line item would have been calculated as equal to 0.7 × £420 + 0.3 ×(CIF of canned baby corn in London). DATA NEEDS AND SOURCES FOR COMPUTING PARITY PRICES Finding the right data to compute parity prices can be difficult. Moreover, the sources of data not always known and there are high search costs of finding what you really need as well as high costs of data collection. It becomes critical to find ways of efficiently collecting good, reliable and appropriate data to be used in the calculations. This section of the guidance serves to give advice on how and where some of the data for calculating parity prices might be found. It is by no means an exhaustive list and each location will vary in terms of sources and availability of data. The first time that the data are collected is probably the most difficult since the analyst has to search for the data and information from multiple sources but once the first data collection has been completed, the same sources can be used to in the future. This makes collection of data to update the parity prices a little less cumbersome. Typically FEWS NET representatives are not directly involved in collecting data, but use secondary data from various sources. The data needed will include world prices of commodities observed at different locations as well as transport and freight charges, tariffs rates, subsidies, effective exchange rates (EER) and conversion factors for processing of commodities. In some instances you will also need unit conversion factors (e.g. conversion rate from kgs to tons or from bushels to tons). Financial prices will either be the CIF or FOB prices, depending on whether you are interested in calculating import parity price or export parity price. The following point out some useful sources:
FEWS NET Markets Guidance, No. 1 May 2008
Famine Early Warning Systems Network
21
• A good starting place for online agricultural market data sources is a comprehensive compilation by Levallee (1996), (see http://aec.msu.edu/fs2/market_information.htm). Here you will find links to several online databases particularly for world commodity prices. Some are regularly updated such as the pink sheets from the World Bank website, while others may not be as up to date. A few of these websites are included at the end of this guidance in the “useful websites” section.
• Data that are relatively more difficult to access are ocean and air freight rates as well as local transport and
marketing costs. Typically these will vary by specifications of each type of shipment and country under consideration. Thus, using country specific rather than international sources of such data is better. In some countries, there are public reporting agencies that may have estimates of such data, e.g. the national or central statistical offices or Ministries of Agriculture or Ministries of Trade. One has to make enquiries by phone or e‐mail and search for them. Public reporting agencies will tend to have publications such as statistical bulletins, newsletters or online publications that one can consult (e.g. SAFEX in South Africa; www.safex.co.za). In some instances, private agencies and central markets will provide these data as public information (though usually for a fee). Generally, for ocean freight rates, private companies involved in the import‐export business will have data on these and may provide free regular updates (the same applies for in‐country transport costs).
• Where informal trade constitutes a significant portion of the trade in the product you are considering, data may be
very difficult to get so that the analyst must use ballpark estimates based on key‐informant interviews or conversations with informal importers and exporters. Consulting local farmer groups such as cooperatives and traders may be a very helpful exercise and particularly where data are not available and ballpark estimates have to be used. In many instances you will be forced to rely more on the key‐informant farmers and processors of the products to access data. The following box contains a list of some of the most important data that would tend to represent the bulk of the costs
Important Data to Collect Data Source Transport and freight costs Trucking companies and local transporters Local marketing margins Traders Exchange rates Importers and exporters as well as government trade offices
in the case of the OER Processing costs and processing conversion factors Processors Packaging Packing companies or sellers of packing materials Local output prices Local markets Local taxes and subsidies (e.g., sales tax, transport taxes, export subsidies, etc., depending on the area and type of taxes levied or subsidies paid by the government)
Local government offices and agencies
In the case that information is not available and no data can be found, calculating the IPP and or XPP at certain specific locations will not be possible but qualitative information about prices and trade can still be solicited for from traders and consumers in a location. In addition, it is usually the case that parity prices will still be calculable for major cities and centers that smaller towns are close to and are connected to. Such secondary markets can play the role of a proxy and still inform the analyst (though less so) about the expected parity price in the smaller/remote town.
FEWS NET Markets Guidance, No. 1 May 2008
Famine Early Warning Systems Network
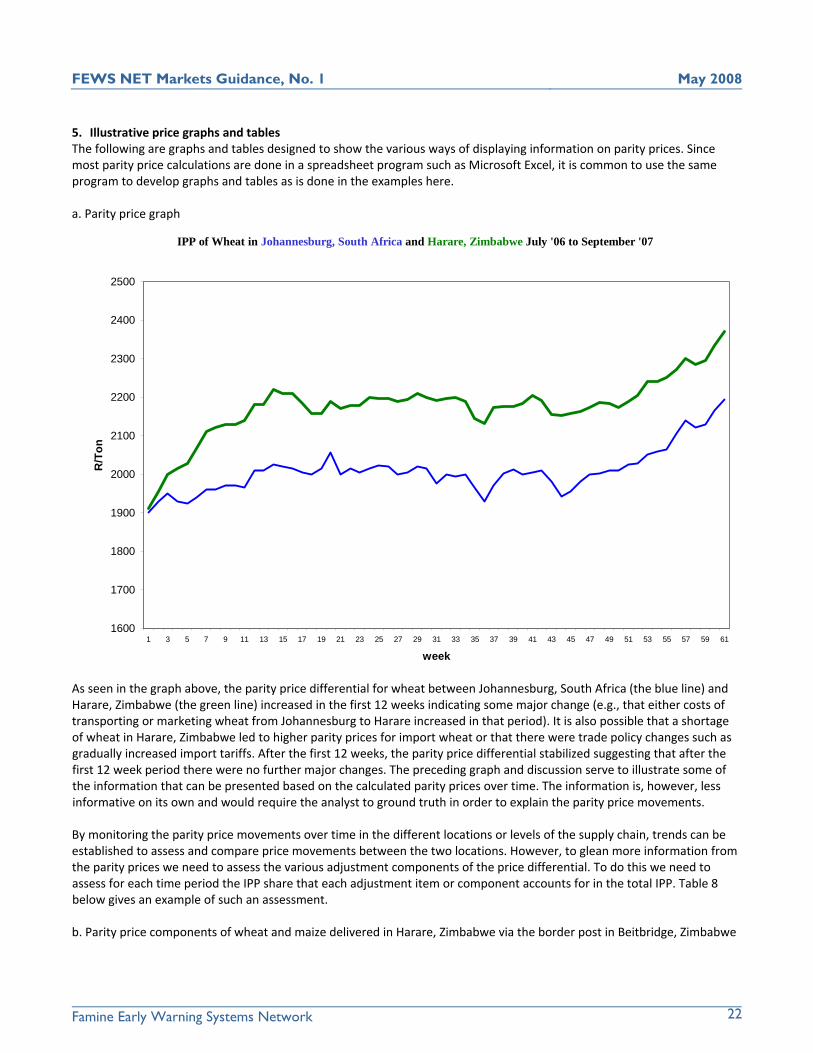
5. Illustrative price graphs and tables The following are graphs and tables designed to show the various ways of displaying information on parity prices. Since most parity price calculations are done in a spreadsheet program such as Microsoft Excel, it is common to use the same program to develop graphs and tables as is done in the examples here. a. Parity price graph
IPP of Wheat in Johannesburg, South Africa and Harare, Zimbabwe July '06 to September '07
1600
1700
1800
1900
2000
2100
2200
2300
2400
2500
1 3 5 7 9 11 13 15 17 19 21 23 25 27 29 31 33 35 37 39 41 43 45 47 49 51 53 55 57 59 61
week
R/T
on
As seen in the graph above, the parity price differential for wheat between Johannesburg, South Africa (the blue line) and Harare, Zimbabwe (the green line) increased in the first 12 weeks indicating some major change (e.g., that either costs of transporting or marketing wheat from Johannesburg to Harare increased in that period). It is also possible that a shortage of wheat in Harare, Zimbabwe led to higher parity prices for import wheat or that there were trade policy changes such as gradually increased import tariffs. After the first 12 weeks, the parity price differential stabilized suggesting that after the first 12 week period there were no further major changes. The preceding graph and discussion serve to illustrate some of the information that can be presented based on the calculated parity prices over time. The information is, however, less informative on its own and would require the analyst to ground truth in order to explain the parity price movements. By monitoring the parity price movements over time in the different locations or levels of the supply chain, trends can be established to assess and compare price movements between the two locations. However, to glean more information from the parity prices we need to assess the various adjustment components of the price differential. To do this we need to assess for each time period the IPP share that each adjustment item or component accounts for in the total IPP. Table 8 below gives an example of such an assessment. b. Parity price components of wheat and maize delivered in Harare, Zimbabwe via the border post in Beitbridge, Zimbabwe
22
FEWS NET Markets Guidance, No. 1 May 2008
Famine Early Warning Systems Network
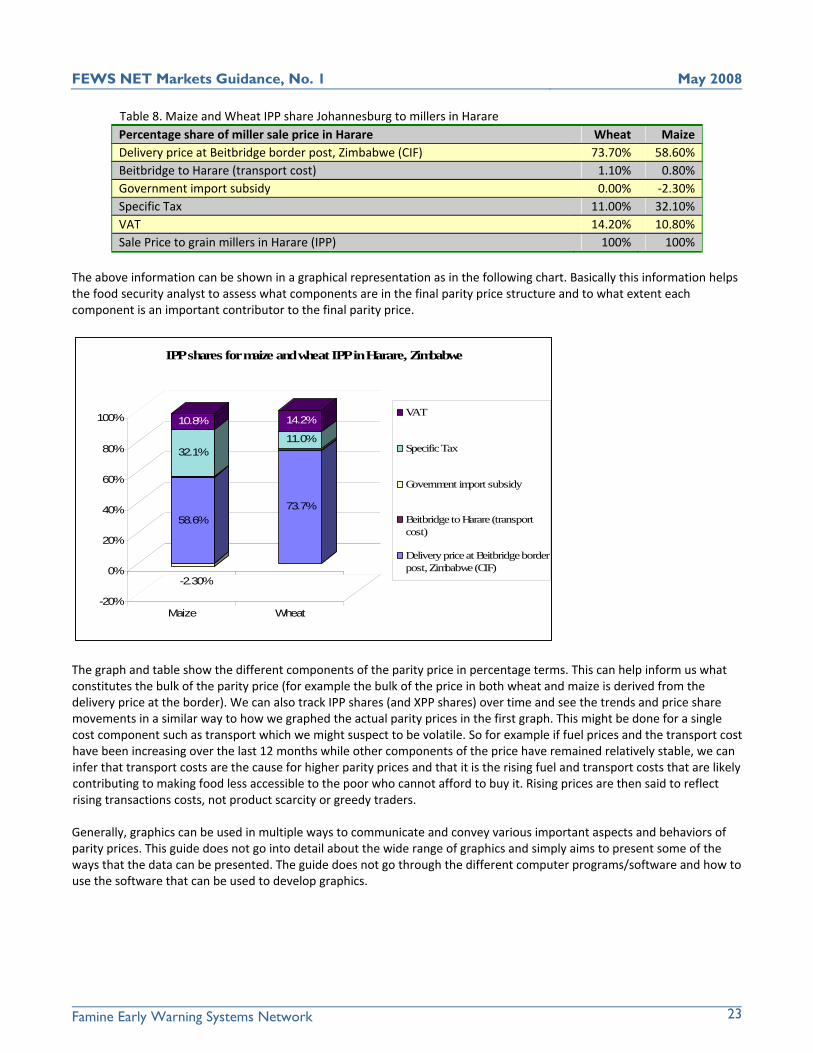
Table 8. Maize and Wheat IPP share Johannesburg to millers in Harare Percentage share of miller sale price in Harare Wheat Maize Delivery price at Beitbridge border post, Zimbabwe (CIF) 73.70% 58.60% Beitbridge to Harare (transport cost) 1.10% 0.80% Government import subsidy 0.00% ‐2.30% Specific Tax 11.00% 32.10% VAT 14.20% 10.80% Sale Price to grain millers in Harare (IPP) 100% 100%
The above information can be shown in a graphical representation as in the following chart. Basically this information helps the food security analyst to assess what components are in the final parity price structure and to what extent each component is an important contributor to the final parity price.
58.6%
-2.30%
32.1%
10.8%
73.7%
11.0%
14.2%
-20%
0%
20%
40%
60%
80%
100%
Maize Wheat
IPP shares for maize and wheat IPP in Harare, Zimbabwe
VAT
Specific Tax
Government import subsidy
Beitbridge to Harare (transportcost)
Delivery price at Beitbridge borderpost, Zimbabwe (CIF)
The graph and table show the different components of the parity price in percentage terms. This can help inform us what constitutes the bulk of the parity price (for example the bulk of the price in both wheat and maize is derived from the delivery price at the border). We can also track IPP shares (and XPP shares) over time and see the trends and price share movements in a similar way to how we graphed the actual parity prices in the first graph. This might be done for a single cost component such as transport which we might suspect to be volatile. So for example if fuel prices and the transport cost have been increasing over the last 12 months while other components of the price have remained relatively stable, we can infer that transport costs are the cause for higher parity prices and that it is the rising fuel and transport costs that are likely contributing to making food less accessible to the poor who cannot afford to buy it. Rising prices are then said to reflect rising transactions costs, not product scarcity or greedy traders. Generally, graphics can be used in multiple ways to communicate and convey various important aspects and behaviors of parity prices. This guide does not go into detail about the wide range of graphics and simply aims to present some of the ways that the data can be presented. The guide does not go through the different computer programs/software and how to use the software that can be used to develop graphics.
23
FEWS NET Markets Guidance, No. 1 May 2008
Famine Early Warning Systems Network
24
CONCLUSIONS This guidance illustrated how parity price analysis is an important tool for food security and early warning analysts in that it can be used to determine the incentives to produce food and the potential for profitable importation of food and agricultural inputs through primary ports of entry or across internal regional borders. A complete food security analysis requires that analysts account for events that have potential food security implications whether they occur within or outside their country. Markets and trade act as important transmission mechanisms for these external events and are, therefore, essential to understanding food security. These events can be related to commercial market activity as well as government policies and programs that affect markets and trade, which in turn affects food security. Parity price analysis provides a tool to compare prices in different locations to derive meaningful economic and social interpretation of those differences. Food security monitoring and analysis for early warning purposes entails forecasting or setting expectations about significant events that may happen in the coming months and their implications on food security; regularly monitoring the conditions that underlie the expectations, and periodically validating, updating or modifying the expectations. Forming expectations involves asking questions about what will likely happen in the near and medium term such as what will the rainfall pattern look like over the coming growing season, will there be adequate availability of food commodities in various parts of the country and throughout a broader region, and how will prices behave over the pending hunger season. Parity price calculations and analysis can help answer these typical and very important food security and early warning questions.
FEWS NET Markets Guidance, No. 1 May 2008
Famine Early Warning Systems Network
25
REFERENCES Belli, P., J.R. Anderson, H.N. Barnum, J.A. Dixon and Tan, J‐P. (2001), “Economic Analysis of Investment Operations: Analytical Tools and Practical Applications” The International Bank for Reconstruction and Development/ The World Bank, Washington, D.C. Crawford, E. “Agricultural Benefit Cost Analysis Hand out” Spring 2007 Semester Gittinger, J.P., (1982) “Economic Analysis of Agricultural Projects” John Hopkins University Press, Baltimore, Maryland Holden, M. “The Economics of Import Parity Pricing: A Pedagogical Note” South African Journal of Economics, vol. 73:3 September, 2005 Parr, G, “Import Parity Pricing: A Competitive Constraint or a Source of Market Power?” Annual Forum (2005), Trade and Uneven Development: Opportunities and Challenges, Economic Society of South Africa, Durban Solnik, B (1996), International Investments, 3rd edition. Addison‐Wesley Publishing Company, Reading, MA Ward, W.A. “Calculating Import and Export Parity Prices,” Training material of the Economic Development Institute, CN‐3 (Washington D.C.: World Bank, 1977), p.8.
FEWS NET Markets Guidance, No. 1 May 2008
Famine Early Warning Systems Network
26
USEFUL WEBSITES FAO: www.fao.org FAO Trade and Markets: www.fao.org/es/esc/en/20953/21032/index.html, Accessed Septermber 3rd 2007
Levallee, Jean‐Charles, 1996, “Market Information Sources Available Through the Internet: Daily to Yearly Market and Outlook Reports, Prices, Commodities and Quote” Michigan State University, Department of Agricultural Economics Working Paper, No. 64, East Lansing, MI. http://aec.msu.edu/fs2/market_information.htm
SAFEX: www.safex.co.za, Accessed Septemer 3rd 2007 South African Competition Commission, http://www.compcom.co.za/resources/Comp%20Comm%20March%20HTML/3%20Importparity.html Accessed, June 14th, 2007 Stanford University, http://www.stanford.edu/group/FRI/indonesia/courses/manuals/pam/pam‐book/Output/chap6.html#wp432059, Accessed June 14th, 2007 University of Pretoria, Department of Agricultural Economics and Extension, http://www.up.ac.za/academic/ecoagric/pdfs/theme3.1.pdf, Accessed, June 14th, 2007 XE.com http://www.xe.com/ucc/convert.cgi, Accessed July 1st, 2007 World Bank www.worldbank.org World Bank Pink Sheets http://econ.worldbank.org/WBSITE/EXTERNAL/EXTDEC/EXTDECPROSPECTS/0,,contentMDK:21148472~menuPK:476941~pagePK:64165401~piPK:64165026~theSitePK:476883,00.html
FEWS NET Markets Guidance, No. 1 May 2008
Famine Early Warning Systems Network
27
GLOSSARY
Arbitrage – is taking advantage of a price differential. It is the act of making a profit by purchasing a product in one market and selling it in another market for a higher price. The two most common types of arbitrage related to food security are spatial arbitrage (where commodities are moved from areas or markets with lower prices to areas or markets with higher prices where the difference in prices is expected to exceed the transfer costs), and temporal arbitrage (where commodities are obtained, stored and sold at a point in the future when prices are expected to be higher where the difference is expected to exceed the costs associated with the temporal transfer. Parity price analysis deals with spatial arbitrage. Border price – the price of good at a country’s port of entry or exit. Cost insurance freight (CIF) – the landed cost of an import on the dock or other entry port in the importing or receiving country. Economic value – the equivalent financial or monetary value of a unit of resource accounting for its opportunity cost (other potential uses) and not including market distortions such as those resulting from government policies. Effective exchange rate (EER) ‐ the rate at which currency is actually being exchanged. Export parity price (XPP) – the value of a product sold at a specific location in a foreign country, but valued from a specific location in the exporting country. FOB (Free on board) – the price of an export loaded on the ship or other conveyance that will carry it to foreign buyers Financial price – the prevailing cost paid by a buyer for a unit of a product when purchasing it in the market. This price includes market distortions such as those resulting from government policies. Import parity price (IPP) – the value of a unit of product bought from a foreign country, valued at a geographic location of interest in the importing country Law of One Price – states that the unit price of a product is the same in all geographic locations after adjusting for transport, transaction and marketing costs as well as exchange rate conversions. The only reason for differences in prices are the foreign exchange conversion, marketing, transport and transaction costs necessary to bring the product from the lower price country. So, if the price is not different in two countries, people will not buy it in the lower priced country and sell in the higher priced country because it is not profitable to do so. Opportunity cost – most resources can be used in multiple but mutual exclusive ways. The opportunity cost is the value of the best alternative use forgone for a particular scarce resource because it is being used in a certain way. Processing Conversion Factor (PCF) – this is a ratio of the quantity of a processed product to the quantity of the unprocessed product (raw material) that the processed product was derived from. It basically tells us how much of the processed product will result from processing one unit of the unprocessed product, e.g. the PCF of paddy to rice is 0.64 (i.e. 1 kg paddy = 0.64 kg rice) implying that if you process 1 kilogram of paddy you will get 640 grams of processed rice. Purchasing power parity (PPP) – the economic theory that links currency exchange rates to prices paid for goods and services in any two countries. Basically, the PPP links exchange rate adjustments to inflation rate movements in either country so that no arbitrage is possible. For example, if a ton of maize can be bought with $400 in the United States or CFAF 200,000 in Niger, the parity of the US Dollar to the CFAF is 400/200,000 which is 1‐to‐500. If either currency were to gain purchasing power, it would be better for buyers to convert CFAF into dollars, for instance, and buy in the US. The theory usually applies to tradable goods with low transport costs and is based on the premise of free markets (i.e. unrestricted trade, a floating exchange rate and the Law of One Price). Sometimes there is a distinction made between absolute PPP and
FEWS NET Markets Guidance, No. 1 May 2008
Famine Early Warning Systems Network
28
relative PPP. The difference is that relative PPP includes changes in the inflation rates between countries while absolute only looks at the ratio of exchange rates. Traded good –is one whose domestic production cost is either lower than its FOB price or greater than the CIF price. Basically this implies that there exist economic incentives to move the good from one country to another for profitable sale and gains in welfare. (Gittinger, 1982) Non‐traded good – is one whose domestic production cost is above its FOB price but below its CIF price (assuming no taxes or subsidies). Essentially, there are no incentives to buy (sell) the product from (to) another country. (Gittinger, 1982)