Imported capital goods and the income adjustment process ...
Imported Intermediate Goods and Product Innovation:
Evidence from India
Murat Seker and Jose Daniel Rodriguez-Delgado∗
May 2011(First Version February 2011)
Abstract
In this study, we build a structural model of multi-product firms that illustrates how
access to new foreign intermediate goods contributes to the introduction of new product
varieties. We establish a stochastic dynamic model of firm evolution allowing firms to be
heterogeneous in their efficiency levels. Introducing importing decision to this dynamic
framework, we show that the effects of importing intermediate goods are twofold: i) it
increases the revenues per each product created and ii) through the knowledge spillovers
obtained from importing, firms get more likely to introduce new varieties. Calibration
of the model to Indian data shows that the model can successfully explain the dynamics
of product evolution and other moments related to importing and product distribution.
Finally the comparison of autarky with trade equilibrium shows how liberalizing trade
increases innovation performances and product growth.
JEL Classification: F12, F13, L11, O31
Keywords: Firm dynamics, heterogeneous firms, innovation, endogenous product scope,
importing intermediate goods, trade liberalization, Indian manufacturing sector.
∗We would like to thank to Gene Grossman, seminar participants in Royal Economic Society Annual confer-ence, and in Bureau of Economic Analysis for their suggestions and comments. Correspondence: Murat Seker:
Enterprise Analysis Unit, Finace and Private Sector Vice Presidency, World Bank, [email protected]. Ad-
dress: 1818 H Street NW, MSN F4K-411, Washington DC 20433; J. Daniel Rodriguez-Delgado: Western
Hemisphere Department/Caribbean II, IMF, [email protected].
1 Introduction
An important role of international trade is the exposure of firms to new goods. The purpose of
this study is to build an analytical framework to illustrate the potential gains in an economy
that international trade can generate as new products are introduced resulting from the access
to new foreign intermediate goods. We illustrate this mechanism through a trade liberalization
episode. We show how aggregate innovation rates as well as individual firm’s dynamics change
after the liberalization period.
The role of trade expanding the set of traded goods has been the subject of recent studies.
Kehoe and Ruhl (2009) find that trade liberalization episodes are characterized by a significant
increase in the traded volume of goods not previously traded. They further document that
such role of the extensive margin of trade seems proper of structural changes in the economy
(e.g. trade liberalization) and absent from events like business cycles. Arkolakis (2009) derives
a similar result within his model of heterogeneous firms and costly access to trade. In our
framework, trade brings access to new intermediate goods previously unavailable to firms,
provided they find it profitable to pay the fixed costs associated with international trade.
At the firm level, Goldberg et al. (2010b) establish a robust relationship between the access
to new foreign intermediate inputs and the introduction of new products by domestic firms.
Using data for India, they find that 31 percent of the expansion of products by firms could
be explained by declining input tariffs. Similar to their empirical specification, at the center
of our theoretical framework is a set of heterogeneous multi-product firms that endogenously
decide on investing in the development of new product varieties. In our model access to new
intermediate inputs increase firms’ revenues of existing products and they also improve firms’
innovation technologies.
The concept of innovation used throughout the paper is one of horizontal product inno-
vation; that is, an innovation or discovery consists of the knowledge required to manufacture
a new final good that does not displace existing ones. This type of framework is a natural
complement to models of vertical innovation where the “creative destruction” process makes
existing products obsolete. Horizontal innovation models have been extensively used in growth
theory, where Romer (1990) and Grossman and Helpman (1991) represent seminal studies.
Furthermore, it has been applied in trade theory to explain wage inequality, cross-country
1

productivity differences among other topics (see Gancia and Zilibotti (2005)). Among disag-
gregated firm-level models, Luttmer (2010) and Seker (2009) are relevant references. Both of
these papers follow from Klette and Kortum (2004) which present a stylized model that explains
the regularities in firm and industry evolution. In their model, an establishment is defined as
a collection of products and each product evolves independently. Every product owned by an
establishment can give rise to a new product as a result of a stochastic innovation process or
can be lost to a competitor. This birth and death process of the products is the source of firm
evolution. Through this model of innovation, they explain various stylized facts that relate
R&D, productivity, and growth. The extension introduced by Seker (2009) allows exogenous
heterogeneity in firms’ efficiency levels which provides a better fit to the data on explaining
firm size distribution as well as correlations between size, age, exit and firm growth1. Our
basic framework, which draws extensively from Seker (2009), is meant to illustrate the role of
international trade in the introduction of new products. It is also relevant to mention that in
contrast to frameworks of learning externalities, ours is one in which firms fully internalize the
dynamic consequences of their innovation efforts.
In our framework international trade affects both the marginal benefit and the marginal
cost of innovation efforts. As in Seker (2009), each firm decides how much resource to invest
into innovation, where a higher investment increases the probability of successfully introducing
a new product and consequently enjoying a new stream of revenue. In the model higher variety
of intermediate goods benefits a given firm with larger returns to scale (productivity) both in
its existing products as well as in any new product. Within the empirical literature, Kasahara
and Rodrigue (2008) find a robust and significant increase in productivity among Chilean firms
that import intermediate goods. Halpern et al. (2009) find that such gain comes mostly from
increased variety of intermediates and to a lesser extent from quality improvements among
Hungarian firms.
Our model also assumes that the exposure to foreign intermediate goods reduces, ceteris
paribus, the cost of innovation. As firms learn from the knowledge embodied in such goods, they
could obtain a higher probability of success investing the same amount of resources. Empirical
support for this assumption can be found in Goldberg et al. (2010b). They find that: 1) firms
1Lentz and Mortensen (2008) present a model that also introduces heterogeneity in firms’ innovation capac-
ities. See Seker (2009) for a comparison of both models.
2

that faced stronger input tariff reductions were found, ceteris paribus, more likely to introduce
new products; 2) such firms were more likely to invest in R&D; and 3) the main channel of these
effects was through new varieties of intermediate goods and not through the trade expansion
of previously traded ones.
A central element of our analysis is the heterogeneity among firms. Besides their exoge-
nous component of productivity level, firms also differ in their portfolio of goods currently in
production. A seminal work in the area of heterogeneous firms and trade is Melitz (2003). In
his framework, more productive firms are self-selected into export markets as only they find
it profitable to pay the fixed costs associated with exporting. In our study, we focus on the
importing side of trade rather than exporting. However the mechanism is quite similar to the
one presented in Melitz (2003). Firms face fixed costs of importing. Only the efficient ones can
compensate these costs and import goods. In line with Melitz (2003) our analysis highlights
that trade liberalization can have a redistribution effect, where some firms could end worse-off
(lower profits) after the trade liberalization episode even if they import intermediate goods. We
further document a similar redistribution of innovation efforts toward most productive firms
away from the least productive.
In the model, producers own multiple products. Evolution of these firms is the sum of the
evolution of each of their products. In this respect, the model complements several existing
models explaining product scope. Bernard, Redding, and Schott (2006a,b) provide empirical
evidence on how multi-product producers dominate total production in the U.S. economy2.
Contribution of firms’ product margin towards output growth significantly exceeds the contri-
bution of entry and exit. They also construct a static model of multi-product firms and analyze
their behavior during trade liberalization. They introduce two margins (intensive and exten-
sive) to expand size, and these margins are positively correlated with each other. However,
their model lacks a dynamic framework of firm evolution.
The remainder of the paper is organized as follows. Section 2 describes the model economy
in two main parts: 1) selection of the mix of intermediate goods and labor, as well as firm’s
decision whether to import intermediate goods from abroad; 2) dynamic problem where the
optimal level of innovation rate is selected. Section 3 describes the data source and section 4
2Some other studies on multi-product firms are Nocke and Yeaple (2006), Eckel and Neary (2006), and
Baldwin and Gu (2006).
3

presents the quantitative model and the calibration exercise. Section 5 concludes. We further
present in the appendix, detailed derivations of some of the key equilibrium conditions of the
model.
2 Model
Recent empirical evidence presented in Goldberg et al. (2009, 2010b) show that imported
intermediate goods lead to higher innovation rates of new products and hence faster growth.
In this study, we present a structural model of firm evolution that can explain this evidence as
well as other evidences on the dynamics of multi-product firms. Following Klette and Kortum
(2004) and their extensions by Lentz and Mortensen (2008) and Seker (2009) we introduce a
model of firm growth that accounts for the heterogeneity in producers’ efficiency levels as well as
entry and exit decisions. In introducing the heterogeneity in efficiency levels, we follow Melitz
(2003). There is a continuum of final good producers each of which produce a different variety.
Unlike Melitz (2003), here firms produce multiple products. The dynamic nature of the model
with heterogeneous firms allows us to capture the differences in the evolution of importers and
non-importers and contribution of importing to the aggregate growth.
The model is presented in a general equilibrium framework. First, we discuss the demand
side of the economy. Then following Kasahara and Lapham (2008), we introduce the static
profit maximization problem of producers. We incorporate this static problem into a dynamic
framework to discuss the growth patterns of firms distinguishing the differences between im-
porters and non-importers.
2.1 Consumers
Consider an economy with +1 identical countries. In a continuous time setup, each country
consists of a representative consumer with an intertemporal utility function given as
=
Z ∞
−(−) ln
where is the discount rate and is the aggregate consumption of the composite good at time
. Instantaneous utility obtained from consumption at time is ln The consumer is free to
4

borrow or lend at the interest rate Aggregate expenditure at time is = where is
the price of the composite good. The optimization problem of the consumer yields = −
We let total expenditure be the numeraire and set it to a constant for every period.
In each country there is a mass of available products each of which is indexed by . The total
mass of products is represented by Consumers have a taste for variety and consume ()
units of variety Goods are substitutes with elasticity of substitution 1 The composite
good is determined by the following constant elasticity of substitution production function
=
µZ∈
()−1
¶ −1
(1)
Composite good producer makes zero profit. Solution of this problem yields
() =
µ ()
¶−
Price of the composite good can be found as follows
=
Z () ()
=
µZ∈
()1−
¶ 11−
(2)
2.2 Intermediate Goods Producers
In the intermediate goods sector, firms are perfectly competitive. All firms have identical linear
technologies and have the same productivities which are set as one. Labor is the only input
used in the production. There is a unit continuum of domestic intermediate goods produced
within a country. There is also free entry in this sector. Each intermediate good producer
is a price taker hence price of these products equals to marginal cost which is the wage rate
. Interaction among the intermediate goods producers (and between intermediate and final
goods producers, as explained below) happens through the labor market as they compete for
the same resource.
5

2.3 Final Goods Producers: Import Decision
Producers are characterized by their efficiency level , the number of products in their portfolio
and by their importing status: if they decide to import some of their intermediate goods
or if they decide not to import intermediate goods. There are two main decisions a given
firm takes, 1) whether to import or not, and 2) the amount of resources to invest in innovation,
having as its ultimate goal to maximize the present discounted value of profits, (). We
assume that firms decide whether to import when they introduce their first product and that
such decision is permanent. This assumption is analogous to deciding to import in every period
for every product variety produced.
In this section, we solve the producer’s decision problem regarding its importing status.
Our specification of the production function follows from Kasahara and Lapham (2008) which
extends Melitz (2003) by incorporating importing decision to the firm’s optimization problem.
The difference in our model is that here firms produce multiple products. The final goods sector
is combined of a continuum of monopolistically competitive firms producing horizontally differ-
entiated goods. The production of each variety requires employment of labor and intermediate
goods which might be either domestically produced or imported. Producers of the final goods
are distinguished from each other by their efficiency levels, indexed by 0 which is randomly
drawn from a continuous cumulative distribution () As in Melitz (2003) higher efficiency
level means producing a symmetric variety at a lower marginal cost. We assume that efficiency
levels exogenously grow at rate for all firms. Solution of the monopolistic competition model
yields revenue () and profit () from each product as follows3
() = () () =
µ ()
¶1−for ∀ ∈ (3)
() = ()
Each product is produced by a single producer, hence we can write the equilibrium levels of
revenue and profit from each product as a function of firm’s efficiency level
Firms employ labor and intermediate goods in the production of final goods. We follow
3Since in this section we only solve for firm’s static optimization problem, we exclude the time subscript
from the variables for brevity.
6

the macro-growth and trade literatures and assume that there is increasing returns to variety
in intermediate goods. All intermediate goods enter symmetrically in the production function,
implying that none of them is intrinsically better or worse than any other. Similar approach
has been used in Ethier (1982) and Romer (1987) among many others4. This specification is
consistent with the empirical findings in Amiti and Konings (2008), Halpern et al. (2009),
and Kasahara and Rodrigue (2008) which associate the use of foreign intermediate goods with
higher productivities.
Importing firms incur a fixed cost and iceberg transport cost 1. Let ∈ {0 1} referto the import status of the firm. Production function for final goods is given as
( ) = ∙Z 1
0
()−1 +
Z
0
()−1
¸ (1−)−1
(4)
where shows the labor, () shows the domestic and () shows the imported intermediate
goods employed in production of variety and is equal to one if the firm imports. The output
elasticity of labor in production is represented by 0 1 and the elasticity of substitution
between intermediate inputs is 1. is the number of partner countries that are traded
with.
The solution of the final good producer’s static optimization problem is given in the ap-
pendix. In the solution we get () = , () = for ∀ and = − This finding
simplifies the production function to
( ) = ¡1 + 1−
¢ 1−−1 [ + ]
1−
Here (1 + 1−)1−−1 could be interpreted as a total factor productivity term5. Price of a
final good which only uses domestic intermediate goods is () for a −type producer. Thisprice is found as
() =
− 1
(1− )1−
If imported intermediates are used in production of the good, then the price is () =
4See Kasahara and Lapham (2008) for a discussion of the benefits of using this specification.5This interpretation of imported intermediate goods increasing productivity of firms is used in Kasahara
and Lapham (2008).
7
() (1 + 1−)1−−1 Since (1 + 1−)
1−−1 1 () () for ∀ Once the prices
are determined, it is straightforward to find revenues gained by importing and non-importing
firms. Define () as the per-product revenue generated by a −type firm that does not
import which is calculated as
() =
µ ()
¶1− =
µ
− 1
(1− )1−
¶1− (5)
Similarly, per-product revenue of an importing firm () is
() =
Ã1
µ
− 1¶Ã
(1− )1−
(1 + 1−)(1−)−1
!!1−
=¡1 + 1−
¢ (1−)(−1)−1
µ
− 1
(1− )1−
¶1−
=¡1 + 1−
¢ (1−)(−1)−1 ()
= () (6)
where = (1 + 1− )(1−)(−1)
−1 1 From equations 5 and 6 we see that revenue is pro-
portional to the firm’s efficiency level. Defining () and () as the profit level of a
non-importing and an importing firm respectively (the latter net of the fixed cost of importing
) we are now ready to describe the importing decision problem.
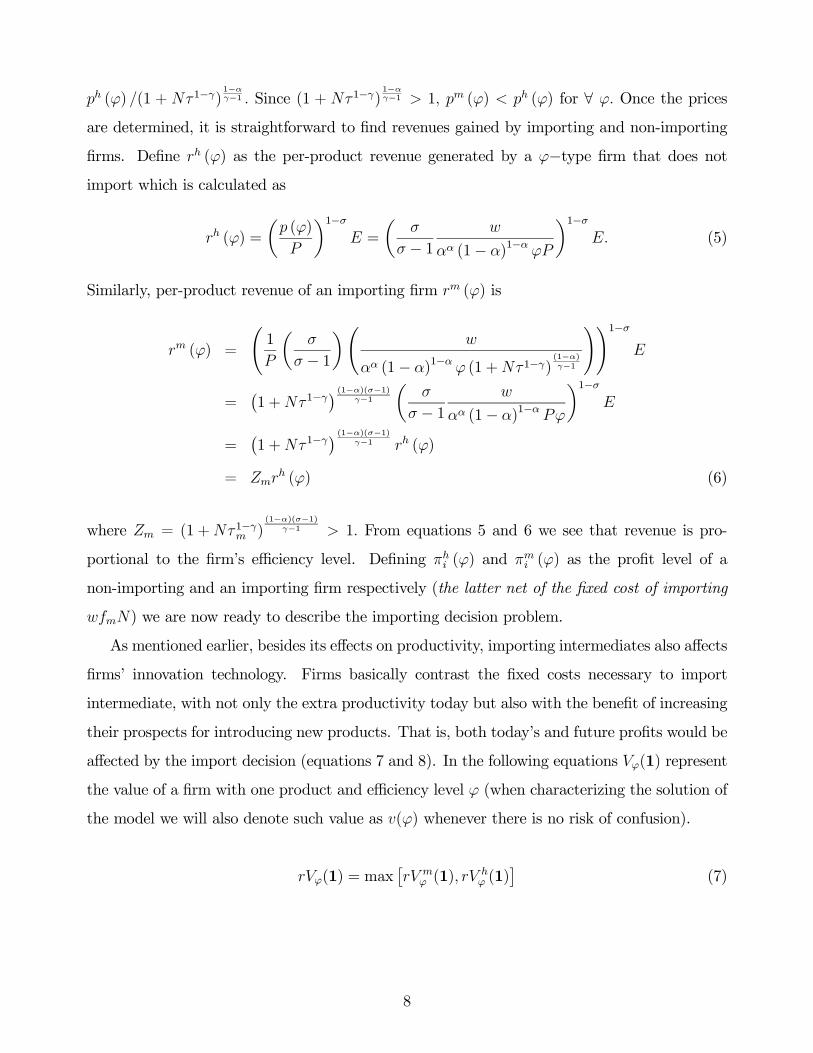
As mentioned earlier, besides its effects on productivity, importing intermediates also affects
firms’ innovation technology. Firms basically contrast the fixed costs necessary to import
intermediate, with not only the extra productivity today but also with the benefit of increasing
their prospects for introducing new products. That is, both today’s and future profits would be
affected by the import decision (equations 7 and 8). In the following equations (1) represent
the value of a firm with one product and efficiency level (when characterizing the solution of
the model we will also denote such value as () whenever there is no risk of confusion).
(1) = max£
(1) (1)
¤(7)
8

(1) = max
≥0
⎧⎪⎪⎪⎨⎪⎪⎪⎩ ()− ()+
[(2)− (1)]
+ [−(1)]
⎫⎪⎪⎪⎬⎪⎪⎪⎭ = (8)
The nature of the problem does not offer analytical solutions, but numerical simulations indicate
the existence of a cutoff in terms of efficiency levels ∗ so that firms for which ≥ ∗ will
find it profitable to import.
2.4 Final Goods Producers: Innovation Decision
The dynamic optimization problem of the firm follows from Klette and Kortum (2004) and their
extension in Seker (2009). The monopolistic competition in the final goods sector results in each
product being produced by a single firm. Firms can produce multiple varieties. The number
of products determines the portfolio of the producer. This portfolio increases by innovating
new product varieties and it decreases by destruction of the existing products6. This process
determines evolution of the firm. Firm’s innovation rate depends on investment in research and
development (R&D) which is measured in labor units and knowledge capital. The innovation
production function is strictly increasing and strictly concave in 7 It is strictly increasing in
the knowledge capital and homogeneous of degree one in and knowledge capital. For non-
importing firms knowledge capital is measured by the total knowledge accumulated through
past innovations. We use the number of products innovated to represent this capital stock.
For the importing firms, it is the product of (1 +) Here (1 +)
represents the spillover
from the knowledge embodied in the imported intermediate goods. Grossman and Helpman
(1991) discuss several ways in which international knowledge spillover are possible. They argue
that residents of a country may find occasions to learn technical information from meeting
with foreign counterparts that contributes to their stock of general knowledge. Also the use
of differentiated intermediate goods that are not available in the domestic market can increase
the insights that local researchers gain from inspecting and using these goods. Grossman and
Helpman (1991) use the cumulative volume of trade between countries as the international
6An alternative way of how innovations materialize in the economy is quality improvements. In Klette and
Kortum (2004) and Lentz and Mortensen (2008) innovations arrive in this way.7The properties of this type of an innovation production function is discussed in Klette and Kortum (2004).
9

spillover for innovation. We use a function of the total flow of intermediate goods that are
imported. We measure the magnitude of the spillover by 0.
Goldberg et at. (2010b) provide empirical evidence that motivates the inclusion of imported
intermediate goods in the innovation function. They show that increase in the availability
of foreign intermediate products have increased the innovation capacities of firms in Indian
manufacturing sector. They find that reduction of input tariffs led to imports of new varieties
in the economy and this has led to an expansion of within-firm product scope by almost 8
percent.
As a result of firm’s R&D investment and knowledge capital new products arrive at a Poisson
rate of where is the innovation rate. The innovation function for an importing firm can
be formalized as
= ³(1 +)
´1−
where 0 1 and 0
= 1− (1 +)(1−)
=
Ã
(1 +)(1−)
! 1
If we define = 1 1 then 1−
= − 1 0 We can rewrite R&D investment as
=
(1 +)(−1)
In this equation higher use of imported intermediate goods reduces the cost of R&D and
increases the probability of innovating new varieties. In parameterizing the R&D cost, we use
() = 01+1
(1+)1 for 0 1 0 The R&D cost for the non-importing firm is same as
the cost for importing firm without the spillover term () = 01+1
Each producer faces a Poisson hazard rate of losing any of its products. Products get
obsolete and firms lose them over time. A similar interpretation is presented in Luttmer (2010).
He assumes that producer of a differentiated commodity needs a blueprint to produce and these
blueprints depreciate in a one-hoss-shay fashion. The hazard rate is same for all firms and
all products. Each firm takes the value of as given. However its value is determined by the
aggregate creation in the economy which will be discussed below. Firms exit if all of their
10

products are destroyed. There is no re-entering once exit occurs.
The state of a producer is determined by its current portfolio of products For a particular
−type producer and a constant interest rate , the Bellman equation is formulated as follows8
(n) = max
≥0
⎧⎪⎪⎪⎪⎪⎨⎪⎪⎪⎪⎪⎩
P=1
()− ()+
£ (n+ 1)−
(n)¤
+
∙P=1
¡ (n− 1)−
(n¢)
¸⎫⎪⎪⎪⎪⎪⎬⎪⎪⎪⎪⎪⎭ = (9)
This equation shows that current value of firm is equal to the sum of three terms. The first term
on the right hand side shows the current profit net of R&D costs. The other two terms show
the net future value of the firm. The second one is the gain in value caused by the innovation of
a new variety and the last one is the expected loss associated with a loss of a randomly chosen
product9.
Since the value function is linear in the number of products, it is possible to obtain an ana-
lytical solution to optimization problem. Following Lentz and Mortensen (2008), we conjecture
that the value function is
(n) =
X=1
()
+ + Θ () (10)
where Θ () is the type conditional continuation value of innovation. Then we incorporate this
conjecture into the Bellman equation which simplifies to
( + )Θ () = max≥0
½
µ ()
+ +Θ ()
¶− ()
¾Θ () = max
≥ 0
(()
+− ()
+ −
) (11)
In order to have the conjectured value function solve this problem, all variables have to be
stationary. In the appendix we show how the economy grows on a balanced growth path.
8Constancy of interest rate is obtained from the consumer’s optimization problem.9Existence of a solution for this dynamic optimization problem under heterogeneous firms is proven in Lentz
and Mortensen (2005).
11

Solving the simplified Bellman equation, we get
()
+ +Θ () = 0() (12)
We define () =()
++ Θ () as the expected value of a single product for a −type
producer. It is the sum of the discounted stream of the profits and the innovation option value.
Using the value of Θ () from equation 11 and implementing it into equation 12 we get
0 () = ()− ()
+ − (13)
Klette and Kortum (2004) show that the optimal value of is an increasing function of profit
level. Since the profit level monotonically increases in this result shows firms with high
efficiencies are more likely to innovate. Plugging the value of () = 01+1
(1+)1for an importing
firm into this equation we get,
0 (1 + 1)1
(1 +)1
= ()− 0
1+1
(1+)1
+ −
0 (1 + 1)1 =
(1 +)1 ()− 0
1+1
+ − for ∗ (14)
Similarly for the non-importing firm the solution is
0 (1 + 1)1 =
()− 01+1
+ − for ≤ ∗
The difference between the solution for importing and non-importing firms is the spillover term
which is captured by (1 +)1 1 It enters into the equation as a positive multiplier of
the profit level. Hence importing gives extra advantage to firms to innovate. To guarantee
the existence of a stationary size distribution in equilibrium the condition () for all
efficiency levels must hold. If the innovation rate of a firm exceeds or becomes equal to
the aggregate destruction rate, size and age of some firms diverge to infinity which precludes
having a stationary size distribution10. This condition can be written as an upper bound on
the efficiency type distribution which is presented in the appendix.
10The condition needed to guarantee () for ∀ is 0 () −()
which follows from equation 13.
12

2.5 Entrant’s Problem
From a constant potential pool of entrants, successful ones enter the economy as a result of an
innovation of a new variety. Firms discover their efficiency types immediately after they enter.
Entrants face the same innovation cost function as incumbent firms and they innovate at rate
Entry rate is determined by the free entry condition given as
0 ()| {z }marginal cost of innovation
=
Z () () | {z }
net gain from innovation
(15)
Here (·) is type distribution for entrants and () is the value of a single product for a −typeproducer. Entry rate is the product of mass of potential entrants and innovation rate of
entrants = From incumbent firm’s optimization problemwe had0 ( ()) = ()
Incorporating this result in equation 15 we can solve for the innovation rate of entrants as a
function of innovation rates of incumbent firms
0 (1 + 1)1 =
Z0 ( ()) ()
=
∙Z ()
1 ()
¸11=
"Z ∗
0
()1 () +
Z ∞
∗
()1
(1 +)1
()
#11
This result shows that keeping all else constant, higher knowledge spillover from trade decrease
the innovation rate of entrants, hence reduces the entry rate.
2.6 General Equilibrium
Firms evolve as a result of a birth and death process of products. We define () as total mass
of -type firms with products. () =P∞
=1 () is total mass of -type firms. Then
() = () is defined as the steady state type distribution where is the total mass of
firms. Mass of products produced by −type firms is represented as Λ () = P∞=1 ().
In steady state, the rate of product destruction should be equal to the sum of the product
13

creation rates of entrants and incumbent firms
= +
Z ()Λ () () (16)
In equilibrium, total mass of products produced by −type firms is found as11
Λ () = ()
− () (17)
In the appendix, we also derive the entry type distribution (·) as a function of the steadystate type distribution (·) The final equilibrium condition is labor market clearing condition.There is a fixed measure of workers in the economy which is denoted as Labor is allocated
across four activities for every -type incumbent firm: final good production , intermediate
good production , and R&D investment (), and fixed cost of importing . There is also
a part of the labor force allocated to research and development for potential entrants ()
The labor market clearing condition is stated as
=
Z ∞
0
( () + () + ( ()) + ())Λ () () + () (18)
where () = 1 if ∗ Given these equilibrium conditions, a stationary equilibrium for
this economy consists of aggregate destruction rate , wage rate and interest rate such
that for given values of ( ) ) any −type incumbent producer chooses the optimalinnovation rate () decides on whether to import or not, and solves equation 13 to maximize
its value, ) potential entrants choose in solving equation 15 and break even in expectation,
) representative consumer maximizes utility subject to budget constraint, ) labor market
clears as in equation 18, and ) equations 16 and 17 hold. The equilibrium level of aggregate
price index is derived in the appendix.
11Derivation of this equation which can be found in Lentz and Mortensen (2008) is reproduced in the
appendix.
14

3 Data
The data used for the analysis is obtained from the Prowess database which is collected by
Center for Monitoring the Indian Economy (CMIE). The data is constructed as a panel of
relatively large firms spanning the period from 1989 to 1997. These firms account for 60%
to 70% of the all economic activity in India. We restrict our analysis to manufacturing firms.
Prowess records detailed product-level information at firm level and it enables us to track firm’s
product mix over time. This information is available for 2927 firms which correspond to 85%
of the manufacturing firms and 90% of total output in Prowess. The data on product mix of
firms allows us to test the model’s ability to explain product evolution of firms.
Definition of a product is based on the CMIE’s internal product classification which is based
on the Harmonized System and National Industry Classification. This data on product-mix of
firms has been used in several studies by Goldberg et al (2009, 2010a, 2010b). Goldberg et
al. (2010a) in an unpublished appendix explain data cleaning process in obtaining the product
level data. We follow their methodology in getting this information. They define 1886 products
linked to 108 four-digit NIC industries. In the data multi-product firms account for almost half
of the firms and they account for 80% of the output.
4 Quantitative Model and Calibration
The model is calibrated to match the data from Indian manufacturing sector for 1989-1997
time period. The novel contribution of the model is explaining the product evolution of firms
and how this evolution is related to importing. To test the model’s ability to explain the data
we choose eight data moments as presented in Table 1. The moments that relate to product
distribution help identify efficiency-type distribution and innovation cost parameters. First two
moments are the mean and standard deviation of product distribution12. Since the model is
capable of explaining firm evolution, we include three moments that relate to firm dynamics:
mean and standard deviation of product growth distribution for surviving firms and percentage
of firms that do not change their product scope in a year. Data show that 90% of firms are
12In the data maximum number of products obtained by any firm is 35. In the calibration we use this value
as the maximum number of products that any firm can produce.
15

in-active in the sense that they do not add or subtract products in a given year13. In order to
highlight the model’s capacity in explaining the significance of multi-product firms in economic
activity, we include the contribution of their sales to aggregate output (82%). All these data
moments are obtained from the Prowess database. Since the model is estimated at steady state,
average values of these moments are obtained between 1989 and 199714.
Table 1: Data MomentsDefinition Value
Average number of products 1.9
Standard deviation of number of products 1.7
Average of product growth (conditional on survival) 1.9%
Standard deviation of product growth (conditional on survival) 0.17
Fraction of firms with no net annual change in products 90%
Contribution of multi-product firms to total sales 82%
Fraction of firms importing intermediates 19%
Import intensity (Cost of foreign inputs/Sales) 19%
Two moments that relate to the decision of importing identify fixed cost of importing as
well as the elasticity of substitution between intermediate inputs. The Prowess database does
not include any information about importing. Hence these moments are obtained from Annual
Survey of Industries for 2001-2002 period. In India during this period roughly 19% of the firms
participate in import activity. We also compute average import intensity of the importing firms
as 19%. For each firm, import intensity is computed as the share of total foreign input costs
to total sales.
We assume that exogenous efficiency type distribution is lognormal (˜¡
¢) where
and are the mean and standard deviation of this distribution. The parameter vector
that is chosen for identification is ∆1 =©0 1
ª. Innovation cost has three
parameters: scaling factor 0 the convexity of the cost 1 and spillover parameter from im-
ports There are two parameters from the production function which are the labor share of
production and the elasticity of substitution between intermediate products We estimate
analytically from the model to match average import intensity of firms. Cost of imported inter-
mediates for a product is Dividing this value by the revenue obtained from a product
13Using five year averages of firm activity instead of one year, Goldberg et al. (2010a) show that the share
of in-active firms are 72%.14India went through a balance of payments crisis at the end of 1991. We exclude this year in computation
of the moments.
16

which is derived in equation 6, we get import intensity = −1(1− ) 1−
(1+1−) This
equation allows us to get the value of once the other parameters are determined. The final
parameter to calibrate is the fixed cost of importing
Rest of the parameters ∆2 = { } are determined in various ways. In themodel there are two components of growth: growth of efficiency levels which is exogenously set
and evolution of products which is endogenously determined. The data allow us to compute
the contribution of each part to the aggregate growth. Average growth rate of sales per product
(the intensive margin) over the sample period is 8.9%. This value corresponds to the value of
Number of trading partner countries is set to one as a normalization. Similarly mass of
potential entrants is set to unity. As in Lentz and Mortensen (2008) real interest rate is set
as 5%. Elasticity of substitution between final goods is set as 2.8 which is the median value
of elasticities calculated by Broda and Weinsten (2006). Tariff rate on intermediate inputs is
computed as 24%which yields the iceberg cost as 1.24. Computation of input tariffs is explained
in Goldberg et al.(2010b). They compute input tariffs by running industry-level tariffs through
India’s input-output table for 1993-1994 period.
Solution of the model requires lengthy fixed point iterations for each choice of model para-
meter candidates. To avoid these iterations, we follow Lentz and Mortensen (2008) who propose
directly estimating wage rate from the data. For any given estimate of we can always find
total labor supply that would satisfy the labor market clearing condition in equation 18 and
make the estimate consistent with the equilibrium. In our calibration we set to 20015.
Finally aggregate expenditure is normalized to 10,000.
To solve the model, we simulate a panel of 10,000 firms for two periods to obtain the
moment values. Then we seek for the parameter vector that minimizes the distance between
the simulated moments and the data moments. Since the model is highly nonlinear, we use
down-hill simplex method (amoeba) for optimization. The steps to computationally solve the
equilibrium and calibrate the model are described in the appendix.
15The value of 200 is arbitrarily chosen. In the calibration exercise we do not match any data moment like
total sales, productivity, or total compensation that relies on the scale of the economy. Thus the wage value
used in estimation is not critical for the values of simulated moments chosen for calibration.
17
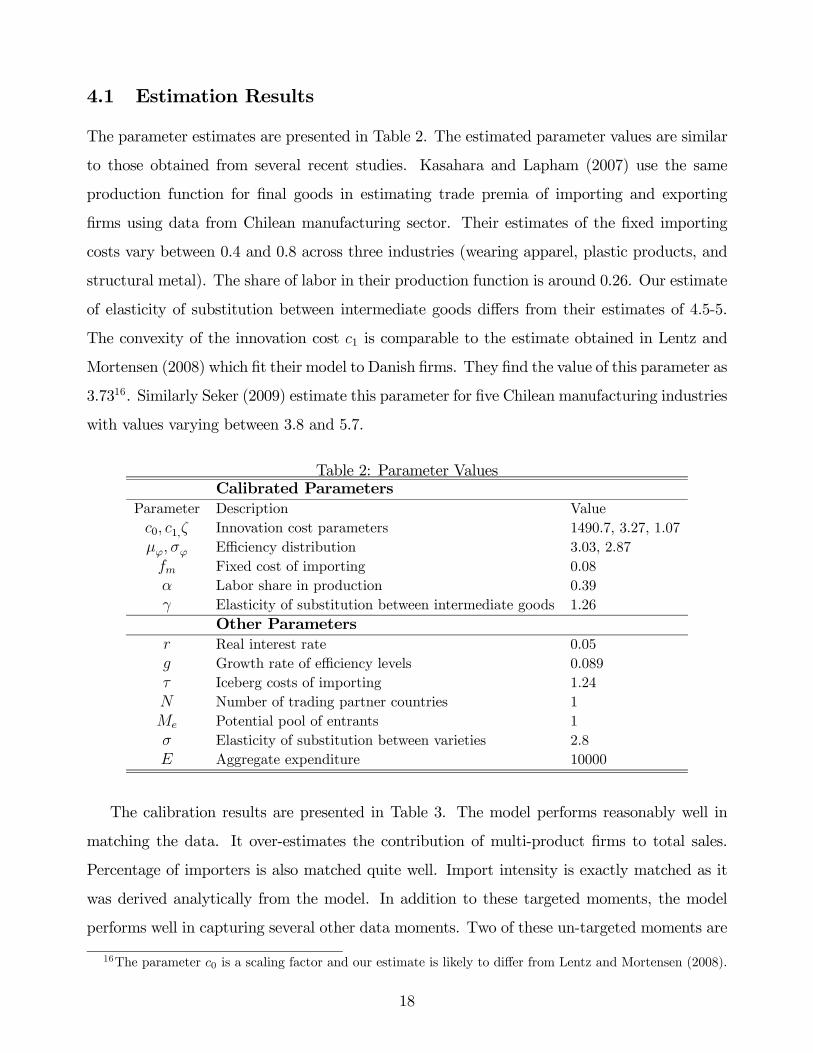
4.1 Estimation Results
The parameter estimates are presented in Table 2. The estimated parameter values are similar
to those obtained from several recent studies. Kasahara and Lapham (2007) use the same
production function for final goods in estimating trade premia of importing and exporting
firms using data from Chilean manufacturing sector. Their estimates of the fixed importing
costs vary between 0.4 and 0.8 across three industries (wearing apparel, plastic products, and
structural metal). The share of labor in their production function is around 0.26. Our estimate
of elasticity of substitution between intermediate goods differs from their estimates of 4.5-5.
The convexity of the innovation cost 1 is comparable to the estimate obtained in Lentz and
Mortensen (2008) which fit their model to Danish firms. They find the value of this parameter as
3.7316. Similarly Seker (2009) estimate this parameter for five Chilean manufacturing industries
with values varying between 3.8 and 5.7.
Table 2: Parameter ValuesCalibrated Parameters
Parameter Description Value
0 1 Innovation cost parameters 1490.7, 3.27, 1.07
Efficiency distribution 3.03, 2.87
Fixed cost of importing 0.08
Labor share in production 0.39
Elasticity of substitution between intermediate goods 1.26
Other Parameters
Real interest rate 0.05
Growth rate of efficiency levels 0.089
Iceberg costs of importing 1.24
Number of trading partner countries 1
Potential pool of entrants 1
Elasticity of substitution between varieties 2.8
Aggregate expenditure 10000
The calibration results are presented in Table 3. The model performs reasonably well in
matching the data. It over-estimates the contribution of multi-product firms to total sales.
Percentage of importers is also matched quite well. Import intensity is exactly matched as it
was derived analytically from the model. In addition to these targeted moments, the model
performs well in capturing several other data moments. Two of these un-targeted moments are
16The parameter 0 is a scaling factor and our estimate is likely to differ from Lentz and Mortensen (2008).
18

presented at the bottom of the table. Goldberg et al. (2010a) show that approximately 8.5%
to 11.5 % of the variation in output across firms can be attributed to the variation in extensive
margin which is defined as the number of products firms produce. This statistics could be
produced by the model. Number of products at steady state has a logarithmic distribution
which is derived in Klette and Kortum (2004). Using the formulas for the mean and variance
of this distribution, we can decompose the total variation in total sales into its components
of intensive and extensive margins. Total sales is =R [ ()|] () where () was
defined as the efficiency type distribution of firms at steady state, () is revenue per product
derived in equation 3 and [·] is the expectation operator. Total variation in size is determinedas
=
Z [ ()|] () | {z }
+
Z ¡ [ ()|]−
¢2 () | {z }
(19)
Using the estimated parameter values, total variation decomposition shows that almost 12% of
the variation in output is attributed to the variation in the extensive margin. Another moment is
decomposition of aggregate growth. Following Goldberg et al. (2010a) we decompose aggregate
annual change in output of continuing firms into the changes in product mix (extensive margin),
and changes in output of existing products (intensive margin). The contribution of extensive
margin to aggregate growth is 15% in the data where it is 11.8% in the model. Close accordance
with the data in these moments relies on a novel feature of the model. The model incorporates
two forces that generate persistent differences in firm performance. In his review of models on
firm evolution, Sutton (1997) lists these forces as: () intrinsic efficiency differences that are
determined before entering the economy () differences that are generated through idiosyncratic
innovations that accumulate through the life of the establishment. Both forces have drawn great
attention in the literature17. Our model incorporates both types of forces which allows it to
produce rich firm dynamics.
Finally we look at the model’s ability to explain product distribution of multi-product firms.
The model slightly underestimates the product distribution in mean and standard deviation
of the product distribution when all firms are included. Restricting the comparison to multi-
product firms we get the results presented in Table 4. The product distribution that emerges
17For a review and comparison of both types of models see Klette and Raknerud (2002) and Seker(2009).
19

Table 3: Model Fit to the DataTargeted Moments Data Model
Average number of products 1.95 1.13
Standard deviation of number of products 1.68 1.19
Average of product growth (conditional on survival) 1.9% 1.18%
Standard deviation of product growth (conditional on survival) 0.17 0.18
Fraction of firms with no net change in products 90% 94%
Contribution of multi-product firms to total sales 82% 92%
Fraction of firms importing intermediates 19% 17%
Import intensity (Cost of foreign inputs/Sales) 19% 19%
Other Moments (Un-targeted)
Variation of output wrt extensive margin 8.5-11.5% 12%
Between share of annual aggregate growth 15% 11.8%
from the simulation has a longer right tail than the one observed in the data. Although mean,
median, and some of the percentiles are quiet comparable, the 99 percentile is much higher
in the model.
Table 4: Product Distribution of Multi-Product FirmsMean Percentiles
25 50 75 90 99
Data 3.1 2 2 3.2 5 10
Model 3.9 2 2 3 7 28
4.2 Autarky versus Trade
Goldberg et al. (2010a, b) show the significant contribution of trade liberalization to innovation
performance of Indian firms. In order to show the success of these policy reforms in the model,
we take an extreme case and compare autarky with free trade equilibrium. In order to make
this comparison, we let the wage rate be determined by the labor market clearing condition.
We randomly draw 10,000 efficiency values and use the same set of firms in both autarky and
trade.
First, we compare the profit levels of importing firms in autarky and trade. We define
(), as profit, aggregate price, and equilibrium wage in trade equilibrium. Replacing
superscripts to refers to the same variables in autarky. Profit levels () and () are
20
calculated as
() =
∙ − 1
(1− )
1− ¡1 + 1−
¢ (1−)−1
¸−1−
() =
∙ − 1
(1− )
1−
¸−1
For an importing firm, the comparison of these profit levels yield
() ()− ,
∙ − 1
(1− )1−
¸−1 "½¡1 + 1−
¢ (1−)−1
¾−1−½
¾−1#
Recall that the cutoff efficiency level for the decision of importing ∗ was determined in 7. As
long as =
∙n(1 + 1− )
(1−)−1
o−1− ©
ª−1¸ 0 in the equation above, there is an
efficiency level ∗ such that all firms with efficiency levels greater than are going to gain
higher profits in trade. Unlike the setup in Melitz (2003) it is not analytically possible to prove
that 0. Hence we simulate the model to compare the autarky and trade equilibrium.
Using the parameter values obtained from the calibration exercise, we compute average
profit level () per product and innovation rates () for each efficiency level Figure 1
shows the relationship between efficiency levels and profit levels. Cutoff efficiency level ∗ is
160 The graph shows that not all importers gain from trade in profit due to higher costs of
production. This finding is in accordance with Melitz (2003). He shows that among exporting
firms only the most efficient ones gain from trade ( ≥ ). In our simulation this threshold
value of efficiency levels is ∼= 351 Trade induces reallocation of resources toward the moreefficient firms through competing for labor.
Next in figure 2, we look at how innovation rates are affected by trade. In trade
equilibrium importing firms innovate at higher rates than they would in autarky. Importing
increases firms’ profits and the knowledge spillover from using new input varieties reduce the
cost of innovation. When both factors are combined we observe a faster innovation rate of
importers in trade equilibrium. This finding is in accordance with the empirical evidence
presented in Goldberg et al. (2010b). They show that as a result of the tariff liberalization in
1990’s, India experienced a surge in imported inputs mostly in inputs that were not available
21

Figure 1: Profit levels () versus efficiency levels()
before the liberalization. Higher usage of new input varieties has led to introduction of new
products in the domestic market. Another result that can be obtained from the graph is that
although some of importers with efficiency levels such that ∗ observe drops in
their per-product profits () relative to autarky, they may still gain higher aggregate profits
() in trade equilibrium because they are likely to innovate more products when trade is
allowed.
Table 5 presents a comparison of autarky and trade equilibrium. In trade equilibrium
average innovation rate of incumbent firms increase facilitated by the spillover from the use
of imported intermediate goods and increase in profit levels. This leads to an increase in
product portfolio of multi-product firms from 2.95 to 3.89. It also increases the average and
aggregate innovation rates in the economy. Since prices decrease and wage rate increases in
trade, innovation gets costlier which reduces the entry of new firms.
5 Conclusion
In this study we develop a general equilibrium model of multi-product firms to explain the
relationship between importing, innovation, and firm growth. Following the structural model
22

Figure 2: Innovation rates () versus efficiency levels ()
Table 5: Autarky and Trade Comparison
Moments Autarky Trade
Ave # of products (multi-product firms) 2.95 3.89
Ave innovation rate 3.3% 3.5%
Aggregate Innovation (by Incumbents) 19.2% 34.8%
Entry Rate 5.9% 4.6%
Average product growth rate 1.15% 1.18%
Aggregate price level 0.21 0.07
Equilibrium wage 150.5 200
of Klette and Kortum (2004) and their extension in Seker (2009), we present a stochastic
dynamic model of firm and industry evolution. In the model we introduce heterogeneity in
firms’ efficiency levels as in Melitz (2003). The novel feature of our model is that unlike many
of the recent trade models that follow Melitz (2003), our model has a dynamic feature. Firms
invest in R&D which results in introduction of new varieties to the economy. Each period
these products face a probability of being destructed. The birth and death process of products
yield the stochastic growth process of firms. Incorporating the importing decision in this setup
allows us to relate trade with innovation and growth.
Firm’s efficiency is the main driver of its evolution. Only the most efficient firms can
23

participate in import markets as they can compensate the sunk costs of trade. These firms are
also more innovative. With the learning they obtain through knowledge spillover from the use
of foreign intermediates, their innovation rates increase even further relative to non-importing
firms. With the additional benefits of importing on their revenues and innovation rates, these
firms grow faster and exit less often.
We test the model’s ability to explain product distribution, dynamics of firm evolution,
and the relationship between importing and innovation through a calibration exercise. We
fit the model to Indian panel of firms for 1989-1997 time period. The model explains the
targeted moments in the data relatively well. It also produces reasonable estimates of some
un-targeted moments such as the variation in output with respect to extensive margin, between
share of annual growth, and product distribution of multi-product firms. Finally we present a
comparison of autarky and trade equilibrium. This exercise shows that as in Melitz (2003), in
trade resources are reallocated to more efficient firms and this leads to an increase in average size
and number of products produced by firms. Moreover, average product creation rate increases
which leads to faster growth. Higher innovation rates of importing firms cause a reduction in
the entry rate.
24
References
[1] Amiti, Mary and Jozef Konings (2007), "Trade Liberalization, Intermediate Inputs, and
Productivity: Evidence from Indonesia," American Economic Review, 97(5): 1611-1638.
[2] Arkolakis, Costas (2009), "Market Penetration Costs and the New Consumers Margin in
International Trade," NBER Working Paper No.14214.
[3] Baldwin, John R. and Wulong Gu (2006), “The Impact of Trade on Plant Scale,
Production-Run Length and Diversification,” Economic Analysis Research Paper 38, Sta-
tistics Canada.
[4] Bernard, Andrew B., Stephen J. Redding, Peter K. Schott (2006a), "Multi-Product Firms
and Product Switching," NBER Working Paper No. 12293.
[5] –– (2006b), "Multi-Product Firms and Trade Liberalization," NBER Working Paper
No. 12782.
[6] Broda, Christian and David E. Weinstein (2006), "Globalization and the Gains from Va-
riety," The Quarterly Journal of Economics, 121(2): 541-585.
[7] Eckel, Carsten and J. Peter Neary (2006), “Multi-product Firms and Flexible Manufac-
turing in the Global Economy,” Mimeograph, University College Dublin.
[8] Ethier, Wilfred J. (1982), “National and International Returns to Scale in the Modern
Theory of International Trade," American Economic Review, 72(3): 389-405.
[9] Theory of International Trade,” American Economic Review, 72, 3: 389-405.
[10] Gancia, Gino and Fabrizio Zilibotti (2005), "Horizontal Innovation in the Theory of
Growth and Development," Handbook of Economic Growth, Chapter 3, Vol (1a), ed.
by Philippe Aghion and Steven N. Durlauf.
[11] Goldberg, Pinelopi, Amit Khandelwal, Nina Pavcnik, and Petia Topalova (2010a), "Multi-
product Firms and Product Turnover in the Developing World: Evidence from India,"
Forthcoming in Review of Economics and Statistics.
[12] –– (2010b), "Imported Intermediate Inputs and Domestic Product Growth: Evidence
from India," Forthcoming in Quarterly Journal of Economics.
[13] –– (2009), "Trade Liberalization and New Imported Inputs," American Economic Re-
view, 99(2): 494-500.
[14] Grossman, Gene M. and Elhanan Helpman (1991) Innovation and Growth in the Global
Economy, Cambridge: MIT Press 1991.
[15] Halpern, Laszlo, Miklos Koren, and Adam Szeidl (2009), "Imported Inputs and Produc-
tivity," Mimeograph, Department of Economics, University of Berkeley.
[16] Kasahara, Hiroyuki and Beverly Lapham (2008), “Productivity and the Decision to Import
and Export: Theory and Evidence,” CESifo Working Paper Series No.2240.
25

[17] Kasahara, Hiroyuki and Joel Rodrigue (2008), "Does the Use of Imported Intermediates
Increase Productivity? Plant-level Evidence," Journal of Development Economics, 87:
106-118.
[18] Kehoe, Timothy J. and Kim J. Ruhl (2009), "How Important is the New Goods Margin
in International Trade?" Federal Reserve Bank of Minneapolis Staff Report 324.
[19] Klette, Tor J, and Samuel S. Kortum (2004), "Innovating Firms and Aggregate Innova-
tion," Journal of Political Economy, 112(5): 986-1018.
[20] Klette, Tor J. and A. Raknerud (2002), "How and why do firms differ?," Mimeograph,
Oslo University, Department of Economics.
[21] Lentz, Rasmus and Dale T. Mortensen (2005), "Productivity Growth and Worker Reallo-
cation," International Economic Review, 46(3): 731-751.
[22] –– (2008), "An Empirical Model of Growth through Product Innovation," Econometrica,
76(6): 1317-73.
[23] Luttmer, Erzo G. J. (2010), "On the Mechanics of Firm Growth," Forthcoming in Review
of Economic Studies.
[24] Melitz, Marc J. (2003), "The Impact of Trade on Intra-industry Reallocation and Aggre-
gate Industry Productivity," Econometrica, 71(6): 1695-1725.
[25] Nocke, Volker and Stephen Yeaple (2006), "Globalization and Endogenous Firm Scope,"
NBER Working Paper, 12322
[26] Romer, Paul (1987) “Growth Based on Increasing Returns Due to Specialization,” Amer-
ican Economic Review, 77(2): 56-62.
[27] ––(1990), "Endogenous Technological Change," Journal of Political Economy, 98(5):
S71-S102.
[28] Seker, Murat (2009), “A Structural Model of Establishment and Industry Evolution: Ev-
idence from Chile,” World Bank Policy Research Working Paper No. 4947.
[29] Sutton, John (1997), "Gibrat’s Legacy," Journal of Economic Literature, 35:40-59.
A Solving Firm’s Static Problem
In a symmetric equilibrium, the static profit maximization problem of a final good producer
can be formalized as follows
1
−1 −
Z 1
0
() −
Z
0
() −
= ∙Z 1
0
()−1 +
Z
0
()−1
¸ (1−)−1
26
The first order conditions of this maximization problem with respect to (), () for ∀
and in respective order are given as follows:
= (20)
1 − 1
−1−1
(1− )
− 1∙Z 1
0
()−1 +
Z
0
()−1
¸ (1−)−1 −1
− 1
()−1−1
= (21)
1 − 1
−1−1
(1− )
− 1∙Z 1
0
()−1 +
Z
0
()−1
¸ (1−)−1 −1
− 1
()−1−1
= 1 − 1
−1−1−1
∙Z 1
0
()−1 +
Z
0
()−1
¸ (1−)−1
(22)
From equation 20, we get () = for all and from equation 21 we get () = for ∀ .Then, taking ratios of equations 20 and 21, for all firms that import intermediate products we
get
1
=
µ
¶− 1
(23)
= − for ∀
Total output of a final good is found as
( ) = h
−1 +
¡−
¢−1
i (1−)−1
= h¡1 + 1−
¢
−1
i (1−)−1
= ¡1 + 1−
¢ (1−)−1 1− (24)
This equation could further be simplified. Taking the ratios of equations 20 and 22 and using
the results that and are constant, we get
(1−)−1
∙−1
+ −1
¸ (1−)−1 −1
−1
−1−1
−1∙
−1 +
−1
¸ (1−)−1
= 1
27

Simplifying this ratio and using the finding = − we get
(1− ) − 1
∙
−1 +
−1
¸ = 1
(1− ) − 1
h(1 + 1−)
−1
i = 1
(1 + 1−)−1
1
=
µ1−
¶(1 + 1−)
µ
1−
¶= (25)
Now combining the result from equation 22, the finding that () =¡
¢− 1 and the result
in equation 25, we get an equation that gives the relationship between price and wage rate
= − 1
−1∙Z 1
0
()−1 +
Z
0
()−1
¸ (1−)−1
= − 1
−1¡1 + 1−
¢ (1−)−1 1−
=
− 1
−1 (1 + 1−)(1−)−1 1−
=
− 1
¡(1 + 1−)
¡1−¢¢−1
(1 + 1−)(1−)−1 1−
=
− 1
(1− )1−
(1 + 1−)−1 (1 + 1−)(1−)−1
=
− 1
(1− )1−
(1 + 1−)1−−1
(26)
The result obtained from equation 26 shows that the final good price for a good that only uses
domestic intermediate goods is () = −1
(1−)1− If imported intermediate goods are
used in production, then the price is () = () (1 +1−)1−−1
Next we derive the equilibrium values of and From the solution of the profit maxi-
mization problem of the final good producer, replacing the equilibrium value of labor from
equation 25 into equation 24 we get
( ) =
µ(1 + 1−)
µ
1−
¶¶ ¡1 + 1−
¢ (1−)−1 1−
( ) = ¡1 + 1−
¢ −−1
µ
1−
(27)
28

Recall that from composite good producer’s maximization problem we had
() = ()−
1− (28)
Combining equations 27 and 28, we get
()−
1− = ¡1 + 1−
¢−−1
µ
1−
= ()
− 1−
(1 + 1−)−−1¡
1−¢
We can get rid of the price in this equation by plugging in the value of () from equation 26
=
1−
µ
1−
¶− h¡1 + 1−
¢−−1i−1 "
− 1
(1− )1−
(1 + 1−)1−−1
#−
=
1−
µ
1−
¶−−1 ¡1 + 1−
¢ (1−)−+−1
à − 1
(1− )1−
!
Finally labor value can be found by incorporating into equation 25
=
1−
µ
1−
¶1−−1 ¡1 + 1−
¢ (1−)(−1)−1
à − 1
(1− )1−
!
B Balanced Growth in the Economy
We assume that efficiency levels grow at rate ( = ). Since there is no population growth,
is constant. Then from equation 4 we get ( ) ( ) = Equation 1 gives
=
− 1µZ
∈
()−1
¶ −1−1µZ
∈
− 1
()−1−1
() ()
()
¶ =
− 1 − 1
=
29

Since we normalize aggregate expenditure to a constant in the model = implies that
and () for ∀ decreases at rate .
=
µZ∈
()1−
¶ 11−
=1
1−
µZ∈
()1−
¶ 11−−1µZ
(1− ) ()− ()
() ()
= − = ()
()for ∀
From the final good producer’s optimization problem we found that
() =
− 1
Since () decreases at rate and grows at rate , wage is constant. Then profit per product
() =³()
´1−is constant. This allows us to get the stationary solution in the Bellman
equation. Note that although wage is constant, real wage which is and real output()
grow at rate .
C Steady State Size Distribution of Firms
Lentz and Mortensen (2008) follow closely Klette and Kortum (2004) in deriving the steady
state size distribution. Klette and Kortum (2004) show that in steady state mass of firms of
any type converges to
() = ()
µ ()
¶−1 (29)
Using this equation, we can derive total mass of firms of type as
() =
∞X=1
() = ()
∞X=1
1
µ ()
¶−1
= ()
()ln
µ
− ()
¶ (30)
Here, convergence to a stationary size distribution requires () for all Taking the ratio
of equations 29 and 30 gives the steady state size distribution for the number of products
()
()=
1
³()
´ln³
−()
´
30

This is probability distribution for the logarithmic distribution with parameter value of ()
Finally total mass of products produced by −type firms is found as
Λ () =
∞X=1
() =
∞X=1
()
µ ()
¶−1=
()
− () (31)
D Deriving Entry Type Distribution in Steady State
From equation 30 we get
() = () ()
ln³
−()
´=
() ()
ln³
−()
´
Taking the integrals of both sides and using the fact thatR () = 1 we get
=
Z () =
Z () ()
ln³
−()
´ () =
()()
ln( −())R
()()
ln( −())
(32)
E Deriving Aggregate Price Index
We defined Λ () as total mass of products produced by −type firms. Plugging the value of () from equation 26 into aggregate price index from equation 2, we get
1− =
Z ∗
0
()1−
Λ () +
Z ∞
∗
()1−
Λ ()
=
µ
− 1
(1− )1−
¶µZ ∗
0
−1Λ () +Z ∞
∗
³(1 + 1−)
1−−1´−1
Λ ()
¶− 1−1
In the simulation exercise, aggregate price index can be computed by replacing Λ () by its
value in equation 31 and () by its value in equation 32 which yields to
1− =
Z ∞
0
()1−
Λ ()
=
Z ∞
0
()1−
()()
(−()) ln( −())R
()()
ln( −())
31

F Maximum Attainable Level of Efficiency
Let’s define max as the maximum attainable level of profit that would satisfy () for all
max − 01+1
(1+)1
+ − =
0 (1 + 1)1
(1 +)1
max =0
1
(1 +)1( (1 + 1) + )
The efficiency level that would correspond to this profit level can be found as follows
= max −
=
" − 1
(1− )1−
(1 + 1−)1−−1
#−1−
max =h( + )
i 1−1
− 1
(1− )1−(1 + 1−)
1−−1
G Algorithm Steps for the Model Solution
For a given set of model parameters ∆ = { ∆1∆2} we simulate a panel of 10,000 firms whichare identified by their unique efficiency levels. Using this panel, we compute the simulated
moments and seek for the parameter vector that minimizes the distance between the simulated
moments and the data moments. The steps to compute the equilibrium are described as follows:
1. The parameter vector is initialized and the vertices of the simplex are determined.
2. For each parameter vector, equilibrium level of aggregate price index and aggregate
destruction rate are computed.
3. For each of the 10,000 efficiency level draws, Bellman equation is solved and innovation
rates are found.
4. Using these values, moment are computed.
5. The value of the criterion function is checked and using the amoeba routine, the simplex
of parameter vectors is updated.
6. The system is iterated until either the value of the criterion function or the parameter
vector converges.
32