Importance of Sport in Northern Ireland - Home - Sport NI · Economic Importance of Sport in...
44
Economic Importance of Sport in Northern Ireland The lead public body for the development of sport in Northern Ireland
Transcript of Importance of Sport in Northern Ireland - Home - Sport NI · Economic Importance of Sport in...

Economic Importance of Sport in Northern Ireland
The lead public body for the development of sport in Northern Ireland

Contents
Prepared for Sport Northern Ireland by the Sports Industry Research Centre of Sheffield Hallam University.

Executive Summary 2
Chapter 1: Introduction 5
1.1: Terms of Reference 5 1.2: Methodology 5
Chapter 2: The Sport Economy in Northern Ireland 7
2.1: Summary of Key Indicators 7 2.2: Consumer Expenditure 9 2.3: Sport-related Output 10 2.4: Sport-related Employment 11 2.5: Summary of Income and Expenditure Flows 12
Chapter 3: Comparisons with the English Regions 13 Appendices 20 A1: Statistical Sources 21 A2: Model Output 22 A3: Definitions 36 A4: Sources and Methods 37
1

2
EXECUTIVE SUMMARY
• This report is part of Sport Northern Ireland’s effort to build the evidence of the economic value of sport. The research has been carried out by the Sport Industry Research Centre (SIRC) at Sheffield Hallam University.
• This report focuses on the economic importance of sport to Northern Ireland in 2008, providing additional comparisons with estimates from 1998 and 2004.
• The methodology employed is based on national income accounting and the income and expenditure flows between sub-sectors of the economy. By using the latter we can derive a monetary value for the sport production (value added) which is consistent with the national statistics framework and crucially avoids the problem of double counting.
• £688m was spent by consumers on sport-related goods and services in 2008 in Northern Ireland. Consumer expenditure on sport as a percentage of total expenditure is estimated as follows:
Northern Ireland: 2.8% England: 2.3% • In consumer spending terms, despite the recession, the contribution of sport to the
economy has remained unchanged.
3
• There has been a 54% increase in sport-related consumer expenditure during the period 2004-2008. This corresponds to a 43% growth using constant prices.
• Sport related activity adds £638.6m to the Northern Ireland economy, corresponding to almost 2.3% of total value added in the region.
• 17,900 people are employed in sport related employment, corresponding to 2.3% of total employment in the region (assuming total in employment 791,000).
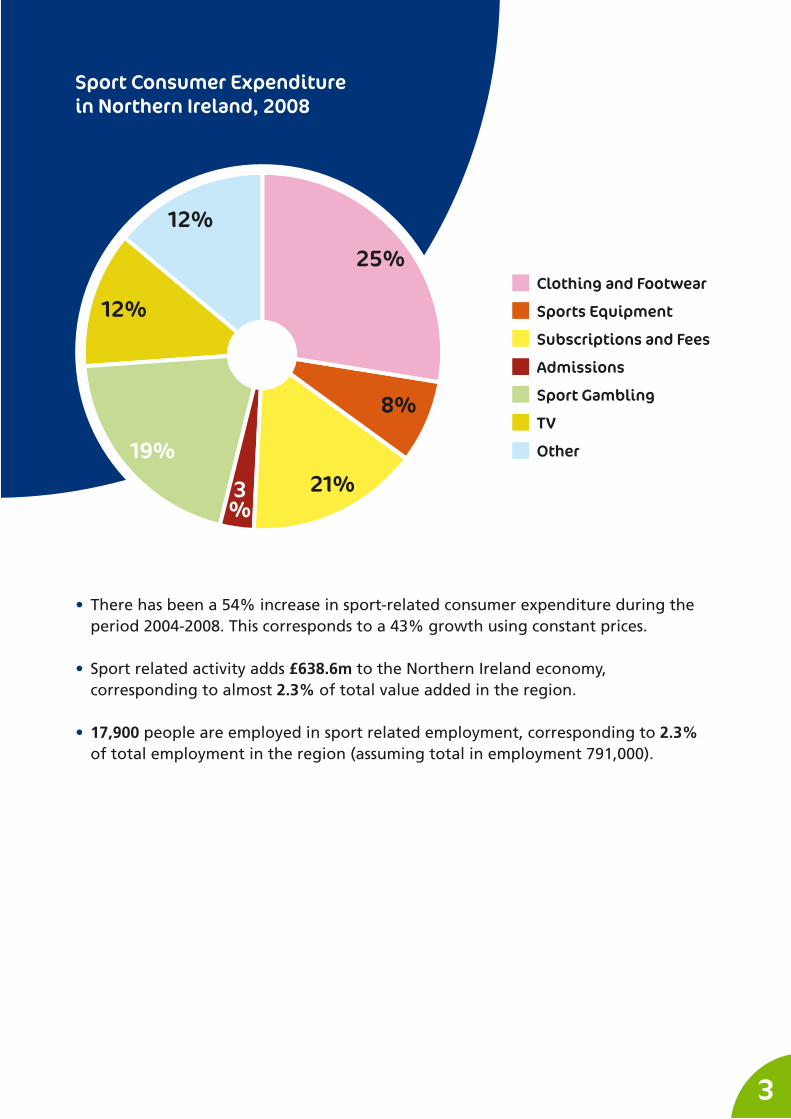
Sport Consumer Expenditurein Northern Ireland, 2008
Clothing and Footwear
Sports Equipment
Subscriptions and Fees
Admissions
Sport Gambling
TV
Other
12%
25%
8%
21%3%
19%
12%

4
Commercial sector
Voluntary sector
Public sector
Sport Employment in Northern Ireland, 2008
• During the period 2004-2008, expenditure on sport clothing and footwear, subscription and fees, and sport equipment increased, in real terms, by 46%, 95% and 81% respectively.
• The sport economy in Northern Ireland is driven by consumer expenditure and sport participation. The London Olympics in 2012 will become a significant force for sport development. Despite average earnings being below the average of the UK (85%), the popularity of sport has resulted in sport-related expenditure at 2.8% of total spending, higher than the English average. In 2008, Northern Ireland had not yet been significantly affected by the recession, showing, in actual fact, the overall greatest spending per household compared to the other home countries.
70%
18%
12%

1. INTRODUCTION
1.1 Terms of ReferenceThis report has been prepared by the Sport Industry Research Centre (SIRC) at Sheffield Hallam University on behalf of Sport Northern Ireland. The purpose of the report is to provide an estimate of the economic importance of sport in Northern Ireland as well as to inform about its direct economic contribution.
1.2 MethodologyThe SIRC model of economic impact assessment uses as its basic input – where possible - economic variables from official statistics. Hence, with the sole exception of the voluntary sector, there is no need for collection of primary data. National income accounting provides the framework for this model, which is consistent with the UK National Accounts. It allows for a division of the sports economy into the seven sectors below:
• Consumers including the personal or household sector. Shows mainly sport-related expenditure, eg, spending on sports clothing and footwear.
• Commercial Sport including spectator sport clubs, sports good manufacturers and retailers. In this sector we would classify companies such as Nike, JJB and football clubs. We also include a section of the media where a sport product/service is produced, such as sport TV, sport publications etc.
• Commercial Non-Sport including suppliers for the production of sport-related goods and services. This sector includes all companies of the commercial sector that do not provide a sport product, but which assist through supply of inputs or revenue in its production. The size of these inputs is determined by the National Accounts and the Annual Business Inquiry (ABI) survey. Examples include a beer company sponsoring a football club, energy required for the operation of a Leisure Club etc. The advertising revenue received by the club represents a flow from the commercial non-sport to the commercial sport sector. Within Commercial Non-sport two large sub-sectors are gambling and satellite TV; however, the largest part is the general unidentified component derived from the demand of inputs in the sports economy.
• Voluntary including non-profit making sport organisations such as amateur clubs run by their participants.
5

6
Professional football clubs are not included in this category even if they are managed on a non-profit basis.
• Local Government including income from local government sport facilities, sport-related grants from Central Government and rates from the commercial and voluntary sector. The sector has expenses such as wages for labour (a flow towards consumers) and grants to the voluntary sector.
• Central Government, including taxes, grants and wages on sport-related activities. For example, a person buying a ticket for a football match records two flows: one towards the Government sector as VAT and another towards the commercial sport sector for the remainder of the price.
• Outside the Area sector. This includes all transactions with economies outside the region.
Income and expenditure flows are recorded between the seven sectors above. As a result a set of income and expenditure accounts can be drawn up for each sector. The ‘double entry’ accounting principle is applied, so every expenditure flow from sector A to sector B is also an income flow in the sector B accounts. The income and expenditure accounts are then used to derive estimates for the following economic impact indicators of the sport economy.
• Sport-related consumers’ expenditure• Sport-related employment• Sport-related value added
Sport-related value added is the most comprehensive statistic of economic value as it corresponds to the gross value added (GVA) in the economy as a whole. It shows the contribution of the sport industry to the regional economy. It is measured as the sum of wages and profit surplus in the sector, adjusted for the inclusion of value contributed from National Lottery projects.
The method used is consistent with the Office for National Statistics (ONS) estimate, as reported in the publication Consumer Trends1. The sport-generated product (GVA), as a percentage of the total regional product, is usually the most important statistic to consider.
1 Consumer Trends Quarter 1 2010 (ONS)

2. THE SPORT ECONOMY IN NORTHERN IRELAND
2.1 Summary of Key IndicatorsTable 2.1 summarises the most important sport-related indicators for Northern Ireland, namely Consumer Expenditure, Gross Value Added and Employment. The table also draws comparisons for the region, focusing on the years 1998, 2004 and 2008 and on the situation in England as a whole. The estimate for total consumption expenditure is consistent with the European System of Accounts 1995. In the case of Gross Value Added and Sport Related Employment, the 2004 statistics have been re-estimated to reflect the official sources used in 2008 (ASHE instead of New Earnings Survey, Annual Business Inquiry instead of Business monitors).
According to Table 2.1, over £688 million was spent on sport-related goods and services in Northern Ireland in 2008, accounting for 2.8% of total consumer expenditure in the region. This compares favourably to the national average for England (2.3%). Compared with 2004, there was an increase of 54% in sport-related consumption.
TABLE 2.1: MAIN SPORT-RELATED INDICATORS FOR NORTHERN IRELAND
1998 2004 2008
Consumer Expenditure on sport (£million) 254.7 446.2 688.1 percentage of Northern Ireland total 2.2% 2.8% 2.8% national average (England) 2.2% 2.4% 2.3%
Gross Value Added by sport (£million) 274.0 521.9 638.6 percentage of Northern Ireland total 1.6% 2.3% 2.3% national average (England) 1.5% 1.7% 1.5%
Sport-related Employment (thousands) 11.6 16.0 17.9 percentage of Northern Ireland total 1.7% 2.2% 2.3% national average (England) 1.5% 1.8% 1.8% The proportion of total consumer expenditure on sport has also increased from 2.2% in 1998 to 2.8% in 2008. It has not been affected by the early signs of recession in 2008 for the UK as a whole. Sport-related economic activity in Northern Ireland adds close to £639 million, which represents an increase of 22% over the year 2004. The contribution to GVA by sport in the region has also grown - from 1.6% in 1998 to 2.0% in 2004, to 2.3% in 2008.
Sport-related employment in Northern Ireland grew from 16,000 in the year 2004 to 17,900 in 2008. As a percentage of total employment, it increased from 2.2% to 2.3% respectively. This compares favourably with the situation in England as a whole.
7

8
Sport-related value added grew at a faster rate than sport employment. During the period 2004-2008, sport related GVA and employment grew by 22% and 12% respectively. The 10% gap is explained in terms of inflation (9% overall, during 2004-2008), and an increase in real wages (2% rise in real wages in the aforementioned period).
The following table can be considered, which compares wages and expenditure in general to establish, from a different angle, the argument that the Northern Ireland performed better in relative terms than the rest of the UK:
TABLE 2.2: WAGES AGAINST EXPENDITURE, 2008
Average Family weekly weekly wage expenditure
£ £ England 482.5 465.2 Scotland 441.4 432.8 Northern Ireland 406.4 479.7 Wales 405.2 406.7
Sources: ASHE 2008, Family Spending a report on the 2008 Living Costs and Food Survey -Table A35.
In Table 2.2, Northern Ireland has third position in terms of average wages per week; yet in terms of overall expenditure per week (categories 1-13 in Family Spending) it occupies the first position. This implies that the recessionary impact was much slower in arriving compared to the rest of the UK. This important factor affects the way the sports economy behaves.

1 Family Spending: A report on the 2008 Living Costs and Food Survey
(ONS), Essex Archives
2.2 Consumer ExpenditureTable 2.3 summarises the value of sport-related expenditure in Northern Ireland. It shows that the total value of sport-related consumer expenditure was £688 million in 2008, representing an increase of 54% over the year 2004. Based on Family Spending evidence, sport clothing and footwear is the largest category of consumer spending on sport, accounting for £175 million or 25% of the market in 2008. Participation subscriptions and fees is the second largest category, replacing sport gambling, and accounting for £144 million or 21% of the market in 2008. The substantial increase (149%) in sport-related participation subscription and fees expenditure during the period 2004-08 can be explained by a greater willingness to participate, even if this is at a non-regular level. After participation, the major categories of expenditure are sport gambling (£130 million) and TV rental, cable and satellite subscriptions (£71 million). According to Family Spending1, weekly household expenditure on ‘participant sports’ in Northern Ireland increased from £2.6 in 2004 to £4 in 2008, representing an increase of 56%.
TABLE 2.3: SPORT-RELATED CONSUMER EXPENDITURE IN NORTHERN IRELAND
1998 2004 2008
£m £m £m Sport clothing and footwear 84 130 175 Sports equipment 15 31 56 Participation subscriptions and fees 43 67 144 Admissions to events 10 15 22 Sport-related gambling 56 103 130 TV rental, cable and satellite subscriptions 39 71 Other sport-related expenditure 57 75 90
Total 255 446 688
The role of sport in creating output and employment in the commercial non-sport sector is illustrated by the sports-related spending on ‘TV and video rental, cable and satellite subscriptions’ - accounting for 10% of the market. Other expenditure categories include publications, sport-related BBC licence fee, and sport travel.
9

10
Table 2.4 below, represents the pattern of consumer spending in sport in constant 2008 prices. The total amount is based on the Consumer Price Index as derived from the database of Consumer Trends (ONS), while the individual sport categories are based on the sports indices of the publication Sport Market Forecasts 2009-2013. The latter is using a selected filtering of official indicators to derive the aforementioned statistics. According to Table 2.4, during the period 1998-2008, sports-related consumer spending increased in real terms by 121%. Significant increases over the same period occurred in sports equipment (300%) and in sports clothing and footwear (162%). These were followed by sports gambling (132%) and participation subscription and fees (112%). The sports clothing and footwear sector experienced a significant decline in the price index over the aforementioned ten-year period.
TABLE 2.4: SPORT-RELATED CONSUMER EXPENDITURE IN NORTHERN IRELAND, CONSTANT PRICES
1998 2004 2008
£m £m £m Sports clothing and footwear 67 120 175 Sports equipment 14 31 56 Participation subscriptions and fees 68 74 144 Admissions to events 15 18 22 Sport-related gambling 56 103 130 TV rental, cable and satellite subscriptions 45 71 Other sport-related expenditure 91 105 90
Total 311 496 688
2.3 Sport-related OutputEstimates of sport-related output are based on value added by the sport sector. Value added is calculated as the sum of wages and profits generated in the sector. Table 2.5 summarises the value added by sport in Northern Ireland. According to the table, sport-related economic activity increased from £522 million in 2004 to £639 million in 2008. The largest part of this economic activity (£326 million, 51%) is generated by the commercial non-sport sector. The commercial sport sector is the second largest in terms of value added, generating £120 million (19% of total). Most of the valued added in this sector is attributable to spectator sports and retailing. The latter includes sport-related clothing and footwear, equipment and publications. The next sector in size is the voluntary sector (£106 million, 17%); followed by the public sector (£87 million, 14%). Both of these sectors are expected to grow under the sport-economic drive generated by the 2012 Olympics.

11
TABLE 2.5: SPORT-RELATED VALUE ADDED IN NORTHERN IRELAND
1998 2004 2008
(‘000) (‘000) (‘000) Commercial sport 62 112 120 of which: Spectator sports 6 21 26 Retailing 45 54 49 Commercial non-sport 133 244 326 Voluntary sector 21 96 106 Public sector 58 71 87
Total 274 522 639
Within the commercial sport sector, retailing increased from £45 million in 1998 to £54 million in 2004, reflecting the increasing trend for sports wear to be used as fashion wear. Consequently, manufacturers of sport shirts, such as Umbro, have managed to decrease the seasonality of their trading, reporting healthy profits in seasons without international football tournaments. This trend was not as prominent in 2008, influenced by the first signs of recession.
2.4 Sport-related EmploymentTable 2.6 provides estimates for sport-related employment in Northern Ireland. The employment estimates for 2008 are based on wage payments and average salaries per sector. In general, employment is derived by dividing the sport-related wage bill by the average salary. Regional average weekly pay is provided by the Annual Survey of Hours and Earnings (ASHE). As in the case of GVA, 2004 figures have been re-estimated to reflect the ABI survey economic structures and the ASHE average wages. Sport and associated industries are estimated to employ 17,900 people in Northern Ireland, accounting for 2.3% of all employment in the region in 2008. This represents an increase of 12% since the year 2004.
TABLE 2.6: SPORT-RELATED EMPLOYMENT IN NORTHERN IRELAND
1998 2004 2008
(‘000) (‘000) (‘000) Commercial sport 2.7 3.92 4.1 of which: Spectator sports 0.6 0.9 1.3 Retailing 1.5 1.67 1.4 Commercial non-sport 4.9 7.4 8.4 Voluntary sector 0.9 1.9 2.2 Public sector 3.1 2.7 3.3
Total 11.6 16.0 17.9

12
As in the case of value added, the largest sector is commercial non-sport, supporting 8,400 jobs or 47% of all sport-related employment in Northern Ireland. This is followed by the commercial sport sector, public and voluntary sectors supporting 23%, 18% and 12% of the region’s sport-related jobs respectively.
2.5 Summary of Income and Expenditure FlowsTable 2.7 below summarises the income and expenditure flows for the seven sport-related sectors in 2008. The largest portion of income is generated in the commercial non-sport sector, accounting for £438 million. This is followed by the consumer sector (£347 million) and the commercial sport sector (£316 million).
Within the commercial sport sector, 62% of generated income comes from retailing. This consists mainly of sport equipment, clothing and footwear and sales of sport-related books, magazines, newspapers and DVDs.
On the expenditure side, by far the most important category is the consumer sector, accounts for £688 million of expenditure. This is followed by the commercial non-sport (£403 million) and commercial sport (£329 million) sectors. The table indicates that, under the current economic structure, the central government generates more income (mainly from taxes) than it spends within the national economy on sport.
TABLE 2.7: SPORT-RELATED INCOME AND EXPENDITURE FLOWS, 2008 Income Expenditure
£m £m Consumer 316 688 Commercial sport 347 329 of which: Spectator sports 39 38 Participation sports 25 23 Retailing 214 197 Voluntary 155 84 Commercial non-sport 438 403 Central government 253 84 Local government 129 156 Outside the area 184 52
* Current factor expenditure (wages, other inputs)
13
3. COMPARISON WITH THE ENGLISH REGIONS
Tables 3.1 to 3.3 compare Northern Ireland’s sport statistics to the equivalent statistics of the English Regions in the cases of Consumer Spending, Gross Value Added and Employment. As mentioned before, sport-related expenditure in Northern Ireland is above the average English trend, with 2.8% of total consumer expenditure in Northern Ireland being sport-related (compared with 2.3% in England overall). Among the ten economies considered in Table 3.1, Northern Ireland is third in terms of absolute sport-related consumer spending per capita, but second, following West Midlands, in terms of the share of sport in the overall spending. It is important to emphasise the recessionary pattern of the English Regions in 2008 was not followed in the case of Northern Ireland. For example, the 2008 data from Family Spending indicates that the average spend per household per week was £480 in the case of Northern Ireland, compared to £465 for England, £407 for Wales and £433 for Scotland1, making Northern Ireland the highest spending nation in the UK. This is more impressive given that, according to ASHE, Northern Ireland is generally underperforming in comparison to the UK in terms of wages per employee (85% of the UK level in 2008).
Table 3.2 indicates that Northern Ireland is the first economy among the ten considered in terms of the share of sport related GVA in the economy. This corresponds to 2.3% of its total output. The same order is reproduced in the case of employment in Table 3.3. In terms of sport-related employment out of total employment, at 2.3% Northern Ireland is the best performing economy out of the ten considered.
1 Family Spending: A report on the 2008 Living Costs and Food Survey
(ONS), Table A35

14
TABLE 3.1: SUMMARY OF SPORT-RELATED CONSUMER SPENDING IN NORTHERN IRELAND AND THE ENGLISH REGIONS IN 2008 East East London North North South South West Yorkshire Northern Midlands East West East West Midlands & Humber Ireland (£m) (£m) (£m) (£m) (£m) (£m) (£m) (£m) (£m) (£m) Sport clothing and footwear (£m) 429.6 293.0 633.0 164.9 417.6 520.2 347.6 441.4 290.6 175.3 Sports goods (£m) 155.6 118.2 229.2 44.3 133.9 137.0 115.7 100.6 81.0 55.5 Participation subscriptions and fees (£m) 443.6 248.1 518.8 126.1 379.0 524.2 396.2 279.6 258.9 144.0 Admissions to events (£m) 82.1 45.9 96.1 23.4 70.2 97.1 73.4 51.8 47.9 21.5 Sport-related gambling (£m) 350.13 237.5 369.5 214.6 350.2 385.8 278.0 610.7 303.7 129.7 Other sport-related spending (£m) 854.6 455.6 882.5 255.2 710.1 904.2 600.6 651.9 553.0 162.1 Total expenditure on sport (£m) 2,315.6 1,398.4 2,729.1 828.5 2,060.9 2,568.4 1,811.6 2,135.9 1,535.2 688.1 Per capita sport spending (£) 404.2 315.5 358.1 321.7 299.7 306.5 347.8 394.7 294.5 387.7 Proportion (%) of total consumer expenditure 2.6% 2.4% 2.1% 2.6% 2.2% 1.9% 2.3% 2.9% 2.2% 2.8%

TABLE 3.1: SUMMARY OF SPORT-RELATED CONSUMER SPENDING IN NORTHERN IRELAND AND THE ENGLISH REGIONS IN 2008 East East London North North South South West Yorkshire Northern Midlands East West East West Midlands & Humber Ireland (£m) (£m) (£m) (£m) (£m) (£m) (£m) (£m) (£m) (£m) Sport clothing and footwear (£m) 429.6 293.0 633.0 164.9 417.6 520.2 347.6 441.4 290.6 175.3 Sports goods (£m) 155.6 118.2 229.2 44.3 133.9 137.0 115.7 100.6 81.0 55.5 Participation subscriptions and fees (£m) 443.6 248.1 518.8 126.1 379.0 524.2 396.2 279.6 258.9 144.0 Admissions to events (£m) 82.1 45.9 96.1 23.4 70.2 97.1 73.4 51.8 47.9 21.5 Sport-related gambling (£m) 350.13 237.5 369.5 214.6 350.2 385.8 278.0 610.7 303.7 129.7 Other sport-related spending (£m) 854.6 455.6 882.5 255.2 710.1 904.2 600.6 651.9 553.0 162.1 Total expenditure on sport (£m) 2,315.6 1,398.4 2,729.1 828.5 2,060.9 2,568.4 1,811.6 2,135.9 1,535.2 688.1 Per capita sport spending (£) 404.2 315.5 358.1 321.7 299.7 306.5 347.8 394.7 294.5 387.7 Proportion (%) of total consumer expenditure 2.6% 2.4% 2.1% 2.6% 2.2% 1.9% 2.3% 2.9% 2.2% 2.8%
15

16
Table 3.2: SUMMARY OF SPORT-RELATED OUTPUT IN NORTHERN IRELAND AND THE ENGLISH REGIONS IN 2008
East East London North North South South West Yorkshire Northern Midlands East West East West Midlands & Humber Ireland (£m) (£m) (£m) (£m) (£m) (£m) (£m) (£m) (£m) (£m)
Commercial sport 664.9 358.8 740.3 190.9 496.0 752.0 344.2 470.1 309.8 119.9
of which: Spectator sports 83.9 66.8 178.7 73.7 187.2 135.5 75.64 90.0 55.7 26.4 Participation sports 67.4 31.5 121.9 15.4 55.9 80.6 60.43 43.7 26.3 13.5 Retailing 215.7 112.6 282.1 60.3 149.6 194.6 135.82 180.6 136.7 49.5 Manufacturing 77.2 46.2 75.6 24.7 58.9 65.8 39.5 54.9 58.5 20.6 TV and Radio 34.6 27.0 81.2 15.9 42.6 50.0 32.3 32.4 31.6 9.7 Commercial non-sport 1,085.6 705.8 1,294.8 444.7 1,085.5 1,273.4 858.1 1,115.2 772.5 325.9 Voluntary sector 302.6 160.7 333.4 91.6 247.7 332.4 260.6 214.4 166.5 106.0 Public sector 187.4 150.1 222.1 90.6 253.0 233.9 143.1 139.9 175.6 86.7
Total sport-related economic activity 2,240.5 1,375.3 2,590.5 817.8 2,082.3 2,591.6 1,606.0 1,939.6 1,424.5 638.6
Sport GVA as % of total GVA 2.0% 1.7% 1.0% 2.0% 1.7% 1.4% 1.6% 2.0% 1.6% 2.3%
17

TABLE 3.3: SUMMARY OF SPORT-RELATED EMPLOYMENT IN NORTHERN IRELAND AND THE ENGLISH REGIONS IN 2008
East East London North North South South West Yorkshire Northern Midlands East West East West Midlands & Humber Ireland (‘000) (‘000) (‘000) (‘000) (‘000) (‘000) (‘000) (‘000) (‘000) (‘000) Commercial sport 25.2 12.5 20.9 7.2 18.8 25.5 12.7 18.1 9.8 4.1
of which: Spectator sports 3.9 2.9 5.5 3.7 9.0 5.9 3.7 4.2 2.9 1.3 Participation sports 3.0 1.3 3.6 0.7 2.5 3.3 2.8 1.9 1.3 0.6 Retailers 6.5 3.4 8.6 1.8 4.5 5.8 4.1 5.4 4.0 1.4 Manufacturing 2.3 1.0 1.5 0.6 1.6 1.3 0.9 1.8 0.5 0.6 TV and Radio 0.8 0.8 1.7 0.5 1.2 1.2 1.2 1.2 1.2 0.3 Commercial non-sport 23.8 16.5 20.7 11.1 25.3 26.0 20.1 26.1 18.5 8.4 Voluntary sport 6.2 3.4 4.9 2.2 5.8 7.0 5.7 4.9 4.5 2.2 Public sector 6.8 5.4 6.3 3.4 9.7 8.1 5.5 5.1 7.0 3.3
Total jobs in sport 62.1 37.9 52.8 24.0 59.5 66.7 44.0 54.2 39.8 17.9 Proportion (%) of total employment in sport 2.2% 1.8% 1.4% 2.1% 1.9% 1.6% 1.7% 2.2% 1.6% 2.3%
18

TABLE 3.3: SUMMARY OF SPORT-RELATED EMPLOYMENT IN NORTHERN IRELAND AND THE ENGLISH REGIONS IN 2008
East East London North North South South West Yorkshire Northern Midlands East West East West Midlands & Humber Ireland (‘000) (‘000) (‘000) (‘000) (‘000) (‘000) (‘000) (‘000) (‘000) (‘000) Commercial sport 25.2 12.5 20.9 7.2 18.8 25.5 12.7 18.1 9.8 4.1
of which: Spectator sports 3.9 2.9 5.5 3.7 9.0 5.9 3.7 4.2 2.9 1.3 Participation sports 3.0 1.3 3.6 0.7 2.5 3.3 2.8 1.9 1.3 0.6 Retailers 6.5 3.4 8.6 1.8 4.5 5.8 4.1 5.4 4.0 1.4 Manufacturing 2.3 1.0 1.5 0.6 1.6 1.3 0.9 1.8 0.5 0.6 TV and Radio 0.8 0.8 1.7 0.5 1.2 1.2 1.2 1.2 1.2 0.3 Commercial non-sport 23.8 16.5 20.7 11.1 25.3 26.0 20.1 26.1 18.5 8.4 Voluntary sport 6.2 3.4 4.9 2.2 5.8 7.0 5.7 4.9 4.5 2.2 Public sector 6.8 5.4 6.3 3.4 9.7 8.1 5.5 5.1 7.0 3.3
Total jobs in sport 62.1 37.9 52.8 24.0 59.5 66.7 44.0 54.2 39.8 17.9 Proportion (%) of total employment in sport 2.2% 1.8% 1.4% 2.1% 1.9% 1.6% 1.7% 2.2% 1.6% 2.3%
19

Appendices
20

Appendices
• Consumer Trends
• Travel Trends
• Family Spending
• Regional Trends
• Annual Business Inquiry
• Annual Survey of Hours and Earnings
• Regional Accounts
• Leisure and Recreation Statistics
• Sports Council for Northern Ireland, Annual Report and Accounts
• Department of Culture, Arts and Leisure Resources Accounts
• Housing and Construction Statistics
• National Accounts
• BBC Annual Report and Accounts
• UK Markets
•HM Customs and Excise Report
• Monthly Digest of Statistics
• Financial Statement and Budget Report
• Horse Race and Betting Levy Board Report
• Government’s Expenditure Plans
• BSkyB Annual Report
• National Travel Survey
• Labour Trends
A1: STATISTICAL SOURCES
Sources of data used in the model include the following publications:
21

22
A2: MODEL OUTPUT
CONSUMER EXPENDITURE ON SPORT-RELATED GOODS AND SERVICES, 2008 £million Admissions 21.5
Sports goods 55.5
Bicycles 0.3
Boats 13.0 Participants’ sports subscriptions & fees 144.0
Clothing sales 114.0
Footwear sales 61.3
Repairs and laundry 0.6
Travel 26.3
Books and magazines 4.5 Newspapers 12.7
Video: purchase and rental 0.7
BBC licence 9.7
TV and video rental, cable & satellite subscriptions 70.5
Internet subscriptions 0.2
Skiing holidays 21.1
Public schools 2.5
Gambling: football pools 1.9
Horse racing 115.6
Raffles and gaming 12.1 Total 688.1

23
COMMERCIAL SPORT INCOME, 2008 £million
Spectator clubs:
Admissions 20.4
Sponsorship & advertising 5.1
Corporate entertainment 4.8
Horse Race Betting Levy 2.6
Cost of the TV rights to top football matches 5.6 Participation clubs:
Subscriptions & fees 24.5 Retailers (net of Vat):
Equipment 42.5
Clothing and footwear 154.1
Books, newspapers and magazines & videos 17.7 Exports and manufacturers’ sales of: Clothing, footwear & equipment 46.4 TV and radio:
BBC 9.7 Commercial 8.9
Exports 0.7 Internet subscriptions 0.2
Total income 344.0

24
COMMERCIAL SPORT EXPENDITURE, 2008 £million Current factor expenditure
Spectator clubs:
Wages 25.6
Other inputs 12.8
Participation:
Wages 12.3
Other inputs 11.0 Retailers:
Wages 32.2
Other inputs 164.8 Manufacturers:
Wages 9.9
Other inputs 25.8 TV and radio:
Wages 9.3
Other inputs 5.1 Total factor expenditure made up of:
Total wages 89.2
Total other inputs 219.6 Total factor surplus 30.4
Total value added 119.6 Current transfers
Corporation tax 3.6
Rates 3.6 Capital expenditure
Investment 12.7
Total expenditure leaving sector 328.7

VOLUNTARY SECTOR INCOME, 2008 £million Factor income (monetary) Players’ subscriptions and match fees 80.7
Equipment 0.3
Sponsorship and advertising 3.5
Raffles and gaming machines 12.1
Bar receipts 96.6 Subtotal (factor income) 193.2 Other monetary income Grants 13.4
Foundation for Sport and Arts 0.7
Employers’ subsidies 8.6
Interest 2.4 Lottery awards 2.5
Lottery partnerships 2.2 Total monetary income (excluding bar receipts) 126.4
25

26
VOLUNTARY SECTOR EXPENDITURE, 2008 £million Factor expenditure Wages 50.2
Ground hire and rents 7.8
Equipment 0.3
Other 13.1
(Bar purchases) 67.6 Subtotal (factor expenditure) 139.0 Rates 3.1
Interest 0.7 Investment 8.7 Total monetary expenditure (excluding bar purchases) 84.0

27
COMMERCIAL NON-SPORT INCOME, 2008 £million Receipts net of tax from consumer spending:
Travel 10.2
Gambling 104.2
Skiing 9.6
Public schools 2.1
TV rental, cable and satellite subscriptions 58.1 Sales of current inputs to:
Central government 7.5
Local government 28.8
Commercial sport 161.8
Voluntary sector 14.7 Interest from voluntary sector 0.7 Sales of capital inputs to:
Local government 25.2
Commercial sport 7.9
Voluntary 7.2 Promotion expenditure for sponsorship (intra-sectoral flow) 11.9 Total income 438.0

28
COMMERCIAL NON-SPORT EXPENDITURE, 2008 £million Producers of inputs to sport:
Wages 205.3
Imports 116.0 (factor surplus) 120.6
(value added) 325.9
Corporation tax 14.2
Rates 9.8 Purchases of inputs from sport:
Sponsorship and advertising 14.8
ITV and radio advertising 8.9
Corporate entertainment at sports events 4.8 Employees’ sports subsidies 2.8
Horse Race Betting Levy 2.6
Interest payments to voluntary sector 2.4 Promotion expenditure for sponsorship (to elsewhere in CNS sector) 11.9
Cost to the rights of TV matches 5.6 Lottery awards 7.1
Lottery partnerships 8.4 Total expenditure leaving sector 402.6

29
CENTRAL GOVERNMENT INCOME, 2008 £million Taxes:
On expenditure 112.1
On incomes generated in:
Commercial sport 28.3
Voluntary sector 14.3
Commercial non-sport 75.2
Local government 22.6 Total income 253.2 Lottery awards 1.1
Lottery partnerships 0.7
CENTRAL GOVERNMENT EXPENDITURE, 2008 £million Transfer payments Grants via Sport England 8.3
Grant support for local government expenditure on:
Sport (net spending) 36.5
Education 20.1
Foundation for Sport and Arts 1.0
Factor expenditure
Wages capital spending and other inputs 11.9
Total 83.6

30
LOCAL GOVERNMENT INCOME, 2008 £million Local authority sports facilities:
Fees and charges 27.7
Sales of equipment 14.3
Ground hire 3.9 Grants from central government:
To fund net expenditure on sport 36.5
Sport education 20.1
Via Sports Council 1.2
Via FSA 0.2 Rates:
Voluntary sector 3.1
Commercial sport 3.6
Commercial non-sport 9.8 Payments for policing 0.4 Lottery awards 2.9
Lottery partnerships 5.3 Total income 129.2

LOCAL GOVERNMENT EXPENDITURE, 2008 £million Current expenditure Direct gross expenditure:
Wages 45.6
Other current expenditure 38.9 Education:
Wages 24.9
Research 0.2 Local transport and policing:
Wages and other inputs 9.1 Grants to voluntary clubs 6.4 Capital expenditure Investment 30.5 Total expenditure 155.6
31

32
OUTSIDE THE AREA INCOME, 2008 £million Sports clothing, footwear and equipment 43.6
Skiing spending outside area 7.8
TV imports 1.4
Prize income 5.5 Import content of UK production of:
Sport-related goods and services 9.5
Commercial non-sport sector output 116.0 Total income 183.7
OUTSIDE THE AREA EXPENDITURE, 2008 £million Sports clothing, footwear and equipment 42.2
Admissions to sports events 3.3
TV exports 0.7
Prize income 5.5 Total expenditure 51.6

33
VALUE ADDED BY SPORT-RELATED ECONOMIC ACTIVITY, 2008 £million Index Commercial sport: Wages 89.2
Surplus 30.4
Total 119.9 18.8 Voluntary sector: Wages 50.2
Surplus 54.1
Lottery projects 1.6
Total 106.0 16.6 Commercial non-sport: Wages 205.3
Surplus 120.6
Total 325.9 51.0 Central government: Wages 3.6
Lottery projects 0.6
Total 4.2 0.7 Local government: Wages (education) 24.9
Wages (sports facilities) 45.6
Wages (transport and policing) 9.1
Lottery projects 2.9
Total: 82.5 12.9 TOTAL VALUE ADDED 638.6 100.0

34
EMPLOYMENT, 2008 Sector Employment (‘000s) COMMERCIAL SPORT
Spectator clubs 1.3
Participation clubs 0.6
Retailers 1.4
Manufacturing 0.6
TV and radio 0.3 Subtotal 4.1 Voluntary sector 2.2
Commercial non-sport 8.4 CENTRAL GOVERNMENT
Administration 0.1 Subtotal 0.1 LOCAL GOVERNMENT
Sports facilities 2.2
Education 0.7 Subtotal 3.2 TOTAL 17.9

THE EXPENDITURE FLOWS MATRIX, 2008 (£million) Flows from: Flows to: CON CS VOL CNS CG LG OV Consumer sector 0.0 266.2 93.1 184.2 93.4 42.0 7.8
Commercial sport 63.9 0.0 0.0 169.7 31.1 4.0 59.9
Voluntary sector 36.0 0.3 0.0 22.7 18.1 7.0 0.0
Commercial non-sport 149.5 30.7 13.3 0.0 75.2 18.0 116.0
Central government 3.6 0.9 13.6 7.5 0.0 58.1 0.0
Local government 57.2 3.3 6.4 54.0 34.8 0.0 0.0
Overseas 5.5 45.6 0.0 0.0 0.6 0.0 0.0
35
36
A3: DEFINITIONS
1. National Income AccountingThe concepts of National Income Accounting were developed for macro-economic analysis in the 1930s and 1940s. The basic principle is that there is accounting equality between total output, total income and total expenditure. The most common definitions of total output in the economy as a whole are the Gross Domestic Product and Gross Value Added. For example, assume that the total output in a factory producing football shoes is £100m. This is equivalent to the income generated as wages (say £60m) as profits (say 10m) and as flow to the companies selling inputs (£30m) required in the production. Further, total income will also be identical to total expenditure because output that is not sold in the current financial year is treated as investment expenditure.
2. Gross Value Added (GVA)GVA (based on wages and profits) is the difference between total income and the cost of inputs used in the production process (raw materials and services). Alternatively it can be expressed as:
GVA = GDP - taxes on products + subsidies on products. GVA shows the contribution of the sports sector to the economy as a whole.
3. SportWe follow the definition employed in the publication Sport Market Forecasts. Sport is divided into the following sectors: sport clothing and footwear, sport equipment, health and fitness, other participant sports, boats, spectator sports, sport gambling, sport TV and video, sport-related publications and sport-related travel.
4. EmploymentThis is full-time equivalent (FTE) jobs. In this case two half-time jobs are measured as one full-time equivalent.

A4: SOURCES AND METHODS
This section attempts to explain how the estimates are derived. Many are generated through the flows in the model. The flows among the sectors in the SIRC model are based on a double entry principle between income and expenditure. Data sources mostly relate to the expenditure side, especially in the case of consumers. The Outside the Area sector is treated as residual in the flow system. No current data exists to adequately describe the voluntary sector. For this reason we use relationships that arise from previous studies and surveys to relate the voluntary sector to the sport economy. The estimation of the remaining five sectors is explained below:
Consumer ExpenditureMany items of sport-related consumer expenditure are located in the Family Expenditure Survey (FES) at the UK level. Only broader categories of spending exist for UK regions. The latter are used to extract the relative statistics from the UK figures in a proportionate manner or directly, as in this report, using the Essex Archives.
Admissions: These are estimated from Family Spending. Data exists for ‘Spectator sports - admission charges’ for the UK as a whole and for ‘Sports admissions and subscriptions’ for the regions. Our estimate for 2008 comes directly from the database deposited in the Essex Archives.
Sports goods: Expenditure is estimated from Family Spending ‘Sports and camping equipment’ and annual reports of major sports companies.
Bicycles: The basis of the estimate comes from Consumer Trends. This is filtered regionally according to Family Spending and the proportion of sport related bicycle journeys form the National Travel Survey (NTS).
Boats: The estimate is derived from a SIRC model for the sector based on statistics from the British Marine Federation.
Participant sports subscriptions and fees: Expenditure is estimated using the Family Spending categories: ‘participant sports excluding subscriptions’ and ‘subscriptions to sports and social clubs’.
Clothing and footwear sales: The estimate is based on a SIRC model, annual reports from sports companies and statistics from Consumer Trends and Family Spending. In general, where possible, we assume that sports clothing and footwear are consumed in the same proportions (out of total clothing and footwear) as in the UK imports statistics.
Sport-related travel: This is derived from a SIRC model based on NTS statistics.
Books, magazines and newspapers: Statistics are based on Family Spending and Consumer Trends. The sport share is derived according to the sport content in publications.
37

38
Video and DVDs purchase and rental: Based on statistics from Family Spending and the British Video Association.
BBC licence: Expenditure is derived from the sport-related content of the BBC licence. It is based on data from the BBC annual report, a SIRC model and the number of households.
TV rental, cable and satellite subscriptions: The basic estimate is derived from Family Spending. A basic sport-related estimate is filtered by using BSkyB and BBC statistics on the basis of programming expenditure.
Sport related gambling: The basis of the estimates is the UK figure, which is derived from official HM Customs and Excise data. A model by SIRC is used to ensure that the value of the overall gambling sector corresponds to the Consumer Trends statistics. Subsequently the regional element is derived by using Family Spending weights and the population estimates. The overall gambling spending is not taken from Family Spending. The derived figures relate to net gambling. We do not double count winnings. For example, according to our methodology, in 2008, total gambling in the UK was £9.9bn. In the same year, the stakes in general betting alone approached £38bn.
Commercial Sport IncomeSpectator Club Admissions: This is a flow of income coming from the domestic consumer sector and the overseas visitors to Northern Ireland. Data from FES and HM Customs and Excise have been used. Income from tourists is estimated from Travel Trends and the Digest of Tourist Statistics.
Sponsorship: Most of this income comes from the Commercial Non Sport sector. Various sources are used from the SIRC archive. We also assume that the sponsorship market is associated with the size of the spectator sports industry.
Horse race betting levy: These statistics are calculated using data from the Horse race Betting Levy Board Annual Report and population statistics from Population Trends.
Cost of the rights to top league matches: The basic estimate is derived from BSkyB statistics.
Subscriptions and fees: This is derived from the income and expenditure flows in the model.
Retailing: Income from retailing is associated with consumer expenditure on sport related equipment, clothing, footwear, books, newspapers, magazines and DVDs. A part of this expenditure is flowing towards Local Authorities, while VAT is going to the Central Government.
Exports: Income from exports is estimated using trade assumptions based on Input-Output tables for wider (than sport) sections of the economy. These ratios are applied on the sport-related consumer spending.

39
TV and radio: Income in the case of BBC comes directly from the licence fee. Only the sports-related part is considered.
Commercial Sport ExpenditureWages: The calculation of wages is based on the flow of income to the sector and estimated statistics (on the basis of the old Business Monitors and the Annual Business Inquiry) that relate wages to total income. This method of calculating wages is repeated in all sectors at a UK regional level.
Other inputs: In the case of spectator and participation clubs an estimation of profits is required. Then ‘other inputs’ is the residual income after profits and wages have been accounted for. In the case of retailers, ‘other inputs’ can be estimated directly through statistics from the Input-Output tables and the ABI at a UK regional level.
Investment: In a similar way investment is estimated as a ratio of the generated value added in each sub sector. We do some assumptions so that we end up with the best possible estimates given the existing information. For example, the share of investment out of value added in the sport retailing sector is assumed to be the same as in the retailing sector as a whole.
Commercial Non-Sport IncomeIncome coming from consumer spending (net of tax): This is determined according to the flows of consumer expenditure. For example, in the case of gambling, consumer spending is directed towards the Government as taxes and towards the Commercial Non-Sport sector as income.
Sales of current inputs to other sectors: These are determined again from the flows of the model. For example, sales to the commercial sport sector are identified from a part of the commercial sport spending. The latter is directed either to the Commercial Non-Sport sector or to overseas. This distribution is determined from the Input-Output tables.
Sales of capital inputs to other sectors: These are related to the capital expenditure of the Local Government, Commercial Sector and Voluntary sectors.
Commercial Non-Sport ExpenditureWages: Spending on wages is calculated as a percentage of total income accruing to the sector. This income can be expressed as wages, profits, or imports (before tax and investment decisions). The part of turnover directed towards wages can be estimated from a SIRC model based on Input-Output tables and the Annual Business Inquiry.
Imports: These are estimated using the same method as above (wages).
Corporation tax: This is derived from the profits accruing to the sector (factor surplus, estimated as above) and the tax rate, estimated from the National Accounts (Blue Book).

40
Rates: The estimate is based on the value added generated in the sector and a model estimating rates as a percentage of value added for the two commercial sectors.
Sponsorship and advertising: These are estimated using non-official statistics and a SIRC model.
Lottery awards: These are estimated using data from DCMS and the Lottery Fund Accounts of the Sports Council.
Central Government IncomeIncome accruing to the Central Government is mainly in the form of taxation. These estimates are determined from the tax rates and the flows within the SIRC model.
Central Government ExpenditureGrants via Sports Council: Data are provided by the Sports Council’s annual accounts.
Wages: Estimates are provided from the Sport Council’s annual accounts.
Support for local government expenditure: This is determined in the local government income below.
Local Government IncomeFees and charges: The estimates are based on the Local Government Financial Statistics and on a SIRC model for the sector.
Sales of equipment: This is derived from a part of consumer spending on sport equipment above.
Grants from Central Government: Using the HM Treasury Budget Report, an estimate of grants from Central Government as a percentage of Local Authority receipts is derived. This is then applied to Local Government expenditure categories.
Rates: This is tax income received from the voluntary, commercial sport and commercial non-sport sectors. The estimates are derived from the flows of the SIRC model.
Local Government ExpenditureTotal expenditure on sport services: This is derived from the Local Government Financial Statistics and a SIRC model for processing the data. This is then distributed into wages and other inputs.
Education: Spending on Education is derived from the Blue Book and the Government’s Expenditure Plans (DES).
Capital Expenditure: This is based on statistics from the Blue Book (table 5.3.7).

NOTES:
_________________________________________________________________________________
_________________________________________________________________________________
_________________________________________________________________________________
_________________________________________________________________________________
_________________________________________________________________________________
_________________________________________________________________________________
_________________________________________________________________________________
_________________________________________________________________________________
_________________________________________________________________________________
_________________________________________________________________________________
_________________________________________________________________________________
_________________________________________________________________________________
_________________________________________________________________________________
_________________________________________________________________________________
_________________________________________________________________________________
_________________________________________________________________________________
_________________________________________________________________________________
_________________________________________________________________________________
_________________________________________________________________________________
_________________________________________________________________________________

House of SportUpper Malone Road
Belfast BT9 5LA
Telephone (028) 9038 1222Facsimile (028) 9068 2757Minicom (028) 9068 2593
E-mail [email protected] site www.sportni.net
This document is available in other accessible formats on request, and online at www.sportni.net
Sport Northern Ireland is the leading public body for the development of sport in Northern Ireland. Its corporate vision is: “a culture of lifelong enjoyment and success in sport which contributes to a peaceful, fair and prosperous society”.