The Link between Successful Implementation of Managerial ...

Importance of Managerial Accounting for a Successful Lean Transformation:
A practical study at a large aerospace OEM
Ismail Mokabel
A Thesis
in
The Department
of
Mechanical and Industrial Engineering
Presented in Partial Fulfillment of the Requirements
for the Degree of Master of Applied Science (Industrial Engineering) at
Concordia University
Montreal, Quebec, Canada
March 2016
© Ismail Mokabel, 2016

CONCORDIA UNIVERSITY
School of Graduate Studies
This is to certify that the thesis prepared
By: Ismail Mokabel
Entitled: Importance of Managerial Accounting for a Successful Lean Transformation:
A practical study at a large aerospace OEM
and submitted in partial fulfillment of the requirements for the degree of
Master of Applied Science (Industrial Engineering)
complies with the regulations of the University and meets the accepted standards with respect to
originality and quality.
Singed by the final Examining Committee:
Chair
Ali Akgunduz
Examiner
Onur Kuzgunkaya
Examiner
Chun Wang
Supervisor
Kudret Demirli
Approved by
Chair of Department or Graduate Program Director
2016
Dean of Faculty

III
ABSTRACT
Importance of Managerial Accounting for a Successful Lean Transformation:
A practical study at a large aerospace OEM
Ismail Mokabel
The lean approach goes beyond a set of continuous improvement tools. Lean implementation
requires a management system that drives organizational behaviors and institutes a culture that
relentlessly seeks continuous improvement. It is crucial not to overlook the management function
systems during lean implementation. A comprehensive management system is essential to
successful lean transformation and sustainability. This thesis will tackle the financial and
accounting systems; one of the important elements of a management function system. It will
expose the weakness of the traditionally used financial and accounting systems. Based on a
practical study of large aerospace OEM in North America, the thesis will elaborate and analyze
the current traditional cost accounting system’s impact on decision making and the fundamental
conflict it has with lean thinking. The thesis will also provide recommendations on alternative
management accounting systems in quest for creating a management system that will help enable
manufacturing companies successfully implement lean.
Keywords: Lean, Managerial accounting, Traditional standard cost accounting, Activity based costing, Throughput accounting, Lean accounting.

Table of Contents List of Tables …………………………………………………………………………V List of Figures ……………………………………………………………………… VI Chapter 1: Introduction ………...…………………………………………………… 01 Chapter 2: Literature Review ……………………………………………………….. 07 Chapter 3: Company Background. …………………………………………………. 12 Chapter 4: Overview of Traditional Accounting System .………………………...... 19 Chapter 5: Research Hypotheses and Empirical Findings .…………..………...…… 31 Chapter 6: Alternatives Solutions to Traditional Cost Accounting ……….…….….. 55 Chapter 7: Comparison of the Accounting Alternatives …………………………… 68 Chapter 8: Proposed Solutions ….………………………….…………………..…… 83 Chapter 9: Summary and Conclusions ………………………………….………….. 90 References ……………………………………………………………….….……… 92
IV

List of Tables
Table 1 Seven types of waste
Table 2 Summary of pertinent lean literature
Table 3 Standard costing
Table 4 Inventory reduction impact as viewed by cost accounting
Table 5 Value stream Box Score measurements
Table 6 ABC impact on overproducing
Table 7 ABC impact on overproducing II
Table 8 Throughput Accounting impact on overproduction
Table 9 Lean Accounting impact on overproduction
Table 10 ABC impact on rework vs overproducing
Table 11 Throughput accounting impact on rework vs overproducing
Table 12 Lean accounting impact on rework vs overproducing
Table 13 Summary of alternate methods behavior to hypothesis 1
Table 14 Summary of alternate methods behavior to hypothesis 2
Table 15 Starter set for value stream measurement
V

List of Figures
Figure 1 Five lean principles
Figure 2 Standard and other costs
Figure 3 Production facility hierarchy of cost allocation
Figure 4 Relationship between line rate and standard hours
Figure 6 Work in progress aging
Figure 7 Manufacturing sites work in progress aging
Figure 8 Quality disposition aging
Figure 9 Manufacturing quality disposition aging
Figure 10 Cost drivers that are not reflected in standard cost
Figure 11 Value stream current state
Figure 12 Value stream future state
Figure 13 Work Center 1 cycle reduction
Figure 14 Activity-based cost allocation
Figure 15 Survey findings
VI

1
1.0 Introduction
Over the past 25 years there has been significant dialog about the lean philosophies, its guiding
principles and its implementation benefits. Centric around creating customer value and
relentlessly eliminating waste; the lean philosophies are essential in helping companies remain
viable in today’s global, dynamic and competitive markets. There are hundreds of books and
thousands of articles about lean. The increase of consciousness around the subject continues to
generate a greater demand for further enhancing our knowledge and understanding of the lean
system.
Jim Womack and Dan Jones’s contribution in spreading the lean values has been
overwhelmingly influential during the past 25 years. They have respectively founded the Lean
Enterprise Institute and the Lean Enterprise Academy in the UK. The two major institutes are
dedicated to educate, research and spread the lean principles and thinking to all industries. Their
first book published in 1990, The Machine That Changed the World co-written with Dan Roos,
has received stimulating reception. Their research has exploited the gaps and shortfalls of the
mass production system relative to the lean approach. They have elaborated on the fundamental
strategic benefits of the Toyota lean methodology and predicted that the lean philosophy will
prevail over the conventional mass production systems. They have also predicted that lean will
spread from the automotive world to other industries (Womack et al. 1991).
Today lean has spread to almost every industry from manufacturing to retail, healthcare, service,
IT and government (Jones 2014). Toyota is the world’s largest car manufacturer ranked by
Forbes in their global automakers listing in 2015, triumphing over German and American
automotive giants (Murphy 2015). This is a manifestation of how lean philosophies can help
transform organizations and propel companies to the highest world stage. The continued triumph
of lean is fuelling a growing appetite worldwide to further evolve our understanding of the lean
philosophies and the keys to its success.

2
1.1 History
In the late 1980s, a research team at MIT’s International Motor Vehicle Program led by Jim
Womack coined the term “lean” in their effort to decipher the Toyota Production System (Jones
2014). However the roots of moving assembly line and production flow are traced back to Henry
Ford in his effort to standardise the production of the Model T in 1913. Henry Ford’s
revolutionary manufacturing approach helped improve inventory turns and throughput velocity
but it had one major limitation; it lacked agility to provide customers variety. The Ford system
was countered by other automakers, including General Motors, providing variety and options
through process versus product manufacturing focus, mass production and high inventories
leveraging economies of scale (N.p. What is Lean? 2015).
In the 1950s, Taiichi Ohno the founding father of the Toyota Production System, embarked on
designing an integrated production system that provided variety while utilizing limited resources
that Toyota could afford post world war two (Ohno, 1988). Taiichi Ohno’s efforts have resulted
in many innovative lean tools including Single Minute Exchange of Die (SMED), Kanban pull
systems, Andon alert systems, Standard work and Root Cause Corrective Action. He was highly
focused on driving the employees including the front line workers to develop the capabilities to
continually improve their work through rigorous practice of problem solving methods like
Deming’s Plan Do Act Control (PDCA) fostering an inclusive Kaizen culture (Jones 2014).
Those innovation tools and continuous improvement focus has helped build a production system
that can effectively react to customer demand, produce high quality products and provide
customers with variety at relative speed. The Toyota Production System (TPS) evolved beyond a
set innovative of tools, it is a management system with management principles and business
philosophies that integrates the whole corporation and its stakeholders around continuous
improvement (Liker, 2004). TPS principles and Taiichi Ohno’s continuous improvement tools
are widely studied and currently used in various industries worldwide by numerous companies in
quest for lean implementation.

3
1.2 Waste (Muda)
Relentless waste or Muda, the Japanese term for waste, elimination is a fundamental mission of
the lean. Toyota’s Taiichi Ohno was a prominent waste elimination activist. He was also
accredited for categorizing waste in the seven types helping companies give perspective to what
they need to relentlessly address during their lean journeys.
Ohno’s seven types of waste (Ohno, 1988):
Table 1 Seven types of waste
Waste Description
Overproduction Producing more, earlier or faster than the customer requires or needs.
This is the number one type of waste as it hides real issues and
generates all other types of waste.
Transportation Unnecessary transportation of goods between locations. Transportation
increases the probability of damage, loss or delay.
Inventory Raw material, finished goods or works in progress that are not being
worked at to add value to the customer and generate turnover.
Motion Unnecessary movement of resources. Also excess movement does not
add value and wasteful.
Waiting Resources downstream waiting for upstream deliveries not met on-time.
Idle products not being processed or transported are not creating value.
Over-processing Unnecessary processing steps that do not add value to the customer or
over processing beyond customers’ needs.
Defects A product or a service that does not meet customer requirements or
needs.
Understanding waste is a vital step to successful lean implementation. It gives a platform to help
the change agents reflect on what is true value added steps in process by exploiting what is not.

4
Doing more with less, requires a coordinated focus on eliminating non-value activities. Lean
thinking drives us to the fundamental mission of focusing on what the customer really wants and
values.
1.3 Lean Principles
In their second highly accredited book Lean Thinking, Jim Womack and Dan Jones specified five
principles to lean implementation gathered from their continued learnings of Toyota’s practices.
They were able to extract these principles providing the building blocks to a lean system and
helping deliver a guide or formula for lean implementation.
Figure 1 Five lean principles
The principles start with identifying value. Value is defined by customers and created by
producers. This is a critical steps to pave the way to providing the right product or service to the
customer at the right price and the right time utilizing the least amount of resources. Secondly
identify the value stream of the actions, activities and stakeholders required to deliver the value
to the customers. This includes the design flow, information flow and physical transformation
Specify Value
Identify Value
Stream
Flow Pull
Seek Perfection

5
flow. This step helps expose all the wasteful and non-value added activities that need to be
eliminated. After defining the value and mapping the stream that delivers the value, it is
important to make the value continuously flow. Where the flow has to be disrupted, link the
continuous flow streams via pull. Finally continuously seek perfection and improvement of the
stream challenging waste and increasing value (Womack and Jones 2003). The five lean
principles provide a framework for lean implementation.
However, it is important to note that foundation of a true lean enterprise in much more
fundamental than a framework or an implementation recipe. It has to be complemented with a
management system that will ensure sustainability.
1.4 Lean Management System
Driving cultural changes within organizations requires a comprehensive management approach.
Lean philosophy entails a different mindset to managing an organization, production systems and
stakeholders (such as employees, suppliers and customers). As previously mentioned the lean
approach goes beyond a set of continuous improvement tools. Lean implementation requires a
management system that drives organizational behaviors and institutes a culture that relentlessly
seeks continuous improvement.
Satoshi Hino, a 30 years automotive veteran, studied and elaborated on the comprehensive
management system that supported Toyota’s production system growth. In his book Inside the
Mind of Toyota, he explained that there are two sub-systems that shape a management system: a
production function system and a management function system. These systems respectively drive
the way a company generates products and run the organization. He observed that the Toyota’s
management system success is attributed to its approach to Total Quality Control (TQC)
encompassing all important management functions beyond product. Management functions such
as business planning, quality assurance, cost management, financial accounting, labor
management and information systems are all vital to Toyota’s TQC (Hino 2006). A

6
management function system that is in sync with the production system is a core enabler to a
lean enterprise such as Toyota.
It is important not to under estimate or overlook the management function systems during lean
implementation. A comprehensive management system is essential to successful lean
transformation and sustainability.
1.5 Thesis Objectives
The thesis will tackle one of the integral elements of the management function system; the
financial and accounting systems. This thesis’s research and observations were based on the
findings from a practical study of a lean transformation in a large North American aerospace
original equipment manufacturer (OEM). The thesis was set to drive three main objectives:
1. Expose the weakness of the traditionally used managerial cost accounting systems,
demonstrate their impact on decision making and accentuate the fundamental conflict
they have with lean thinking.
2. Study alternative management accounting systems and identify the most suitable
managerial accounting system that will address the deficiencies of traditional cost
accounting and enable lean transformation.
3. Provide holistic system recommendations to the aerospace OEM in support of
overcoming its current customer on-time delivery and inventory turnover stagnation.
This thesis will use practical examples and empirical evidence to demonstrate, analyze and
support recommendations.
7
2.0 Literature Review
An extensive literature review was done to study the fundamentals of successful lean
transformation. The goal was to appreciate the areas where the lean literature has been
concentrating and learn about the areas that require further contribution. In almost every relevant
lean literature, Toyota’s success story is quoted or referenced. Many authors used Toyota as a
case study to decipher the recipe of lean success.
In Table 2 is a summary of the most pertinent lean literature where authors expanded on the
various enablers to successful lean implementation.
Table 2 Summary of pertinent lean literature
Author/s Publication Title Year Relevant findings
Spear &
Bowen
Decoding the
DNA of the
Toyota
Production
System
1999
Four rules focused on how people in Toyota work, how they connect, how production lines are constructed and how they drive improvements:
Highly specified work content sequence, timing and outcome. Clear direct customer supplier connection. Product flow is simple, direct and specified. Inclusion of the lowest level of the organization in improvements using scientific methods.
Womack &
Jones
Lean Thinking:
Banish Waste and
Create Wealth in
your Corporation
2003
Fives lean principles defining a framework for lean implementation:
Identify value in the eyes of the customers. Define the value stream. Flow the value. Pull if you cannot flow. Seek perfection continuous cycle of improvement.
Examples and case studies from various industries

8
Liker
The Toyota Way:
14 Management
Principles from
the World's
Greatest
Manufacturer
2004
14 principles that defines Toyota’s continuous improvement management approach and production system.
The principles are summed into 4 segments:
Long-term always prevails in decision making. Designing the right process will produce the right results. Developing your people will always add value to the organization. Continuous root cause problem solving drives organizational learning.
Flinchbaugh
& Carlino
The Hitchhiker’s
Guide to Lean:
Lessons from the
Road
2006
Five principles in addition to leadership, transformation, lean accounting and material management content. Five principles of lean:
Observe work as activities, connections and flows. Systematic waste elimination. Agreement on what and how. Systematic problem solving. Learning organization.
Examples and case studies from various industries.
Hino
Inside the Mind of
Toyota:
Management
Principles of
Enduring Growth
2006
Toyota’s encompassing Management system ties its Production Function System and Management Function System in a total quality control approach. The historical milestones are prudent to help understand the drive behind the depth of Toyota’s evolving management system.

9
As summarized above, most literature emphasized on a system approach to lean implementation.
A common theme is that true lean implementation goes beyond a set of tools but rather a system
approach that drives material, people and information management. Most authors decoded
various methodologies that were effective in driving lean transformations. One area that needed
further contribution is the financial and managerial accounting systems that supported a
successful lean transformation. The managerial accounting systems are rather fundamental to any
successful management system. They influence and drive decisions across the various levels of
the organization including management and executives.
In their renounced book, Relevance Lost, Johnson and Kaplan concluded that the expansion of
information technology, global competition, shortened product life cycle coupled with
innovation in the organization and technology of operations have rendered the traditional
management accounting systems obsolete and created new demands for evolved management
accounting systems (Johnson and Kaplan 1987). It is also worth mentioning that there is general
acknowledgement in various literatures that traditional standard cost accounting systems have
severe shortfalls and can lead management to make detrimental decisions to their bottom line
(Bakke and Hellberg 1991, Johnson 1991, Kaplan 1991, O’Guin 1991, Maskell 1993).
Traditional cost accounting allocates overhead and variable cost using volume based cost drivers
such as direct labor or machine hours (Horngren el al. 2000). Such volume based cost allocation
model was designed in an era of mass production where labor was a major cost driver of the total
manufacturing cost (Bakke and Hellberg 1991). Boyd and Cox (2002) concluded that cost
accounting had to consider production constraints and not use allocated cost in order to provide a
platform for optimal decisions.
In regard of the impact of traditional managerial accounting on lean implementation; Ahlstrom
and Karlsson (1996) explicated the notion that the traditional management accounting system is
ill equipped to reflect the changes of a complex production strategy such as lean. As a result the
traditional management accounting system can negatively affect lean adoption. They
demonstrated in their research that the management accounting system played an integral role in
the adoption process. They also stressed the importance of changing the management accounting
system to accurately reflect results of lean changes in order for the system not to be an impeding

10
factor to lean adoption. They highlighted three concurrent ways that the managerial accounting
systems affect the adoption process: technically; through its design, formally, through its role in
the organization and cognitively, through the way it is being used and thought about (Ahlstrom
and Karlsson 1996). Lea and Min (2003) research results suggested that; a managerial
accounting system that portrayed the manufacturing process tended to provide more accurate
product cost information and resulted in a better system performance.
While the literature review revealed that there is general acknowledgement among scholars and
researchers of the shortfalls of traditional managerial accounting systems; there are still ongoing
debates on alternative costing and managerial accounting solutions to support the ongoing
evolution of manufacturing systems and increased adoption of lean principles. Activity Based
Costing was presented as an alternate solution addressing various gaps of traditional cost
accounting and enhancing allocation methods using activity based allocations (Cooper and
Kaplan 1988, Johnson 1991, O’Guin 1991, Kaplan and Cooper 1997, Kaplan and Anderson
2007). Throughput accounting based on Theory of Constraints manufacturing philosophy was
introduced eliminating the notion of overhead allocation and focusing on maximizing profit
while viewing operating expenses as a fixed constraint in the short term (Spencer 1994, Corbett
1998). Lean accounting was introduced as a new evolving method of managerial accounting
based on lean principles driving a value stream focus and complementing financial performance
with operational measurements (Womack and Jones 2003, Flinchbaugh and Carlino 2006,
Maskell et al. 2012). It amalgamates lean and accounting methods in a new context to manage,
control and measure the enterprise (Maskell et al. 2012). Li el al. (2012) comparative research
concluded that it was essential that operational measures and financial measures are aligned to
effectively capture the enterprise benefits of lean production. Camacho-Minano el al. (2013)
found in their study of empirical findings on lean management implementation in literature; that
the most comprehensive models that considered financial and operational indicators and
contextual factors, revealed favorable impact of lean management on financial performance.
As the interest in lean continues to grow, production methods and philosophies have been
evolving rapidly; however, more consideration is needed around changing the accounting
systems that supports them (Maskell et al. 2012). A complementary lean accounting system

11
would be essential to help drive a complete lean transformation (Womack and Jones 2003). The
field of lean accounting continues to evolve with today’s business environment and management
innovation. The need for more contribution around the evolution and implementation of new
management accounting systems inclusive of lean accounting is paramount. The continued
research will help build a platform for better decision making in support companies’ profitability
objectives and lean transformation journeys.

12
3.0 Company Background
The research in this thesis was based on practical field experience studying a pronounced
aerospace company’s lean transformation. Practical observations throughout the company
highlighted the dilemmas that managers face during their lean implementation and substantiated
the root cause behind the conflicts that drove the company’s lean stagnation. It also revealed the
behavior induced by the traditional cost centered managerial accounting systems and exposed its
fundamental conflict with lean thinking.
3.1 The Company under Review
As discussed in the literature review chapter; one of the areas that needed to be explored further
is the implication of the commonly used traditional cost centered managerial accounting systems
on large companies’ lean transformation efforts. It is vital that the supporting management
system of any company is compatible and supportive to the lean efforts in order to ensure a
successful and sustainable lean implementation. This goes beyond the leadership buy-in and
support. Large companies are highly dependent on systems and performance metrics to govern
and influence the masses. The core systems that guides decision making are mostly influenced
by financial metrics and performance measurement. If these systems are in conflict with the lean
philosophy they might hamper lean implementation and drive suboptimal results. In order to
study this phenomena; it was vital to select a large company that applied traditional cost
managerial accounting and is well vested in its lean journey.
The company selected for this research is a North American aerospace OEM. The company can
be categorized as a large company based on its number of employees in accordance with
Statistics Canada reference. Statistics Canada categorizes companies with over 500 employees as
large. The company currently utilizes traditional managerial cost accounting and also had years
of expertise and investments in lean and continuous improvement efforts. The combination of
both criteria created the perfect setting to study in depth the practical elements that sway decision
making and faces the company’s employees and change agents during their lean implementation.

13
3.2 Company Lean History
The aerospace industry has adopted lean practices about a decade following the automotive
industry. The main factors that catalyzed lean adoption in aerospace during the late 1990s and
the early 2000s were post-cold war reduction in military spending, the inability of the industry to
react to demand cycles due to long lead times and the rise of globalization (V. Crute et al. 2003).
Similarly the company in study officially inaugurated its continuous improvement operating
system in the late 1990s and launched its lean transformation journey in the early 2000s. The
lean journey was mainly driven to reduce total value chain lead-time, improve the company’s
agility to demand shocks, drive inventory reduction and bottom line improvement.
Since the early 2000s the company has invested significant efforts towards its lean
implementation. They worked with worldwide pronounced lean consultants including the
prominent Japanese firm Shingijutsu to build their continuous improvement operating system.
They based their lean operational methodology on Jim Womack and Dan Jones five lean
principles that were explained elaborately in Chapter 1of this thesis. They also incorporated and
implemented various lean tools including value stream mapping, SMED, 5S, mistake proofing
and root-cause corrective plans. In their lean journey they have also launched extensive mapping
sessions and kaizen events focused on driving operational excellence with multi-disciplinary
dedicated teams. They have built an in house core team that governed, facilitated and advised the
organization on lean implementation. They have also invested in companywide lean training and
rolled out various lean curriculums with different level of lean proficiency certifying and
developing lean experts throughout the company. These resident lean experts within the various
departments work closely with the core continuous improvement team and help drive the lean
initiatives in the company’s various departments and sites. There is an authentic sense of belief
in continuous improvement that is vibrant in the company’s culture.

14
3.3 Structure and Overview
Understanding the company’s structure and culture was an important element of this research.
Organizational behaviors are vital to successful lean implementation. All parameters of an
organization can find its finger prints in the results of a transformation.
3.3.1 Material Flow
As an OEM the company has extensive manufacturing, assembly and maintenance capabilities. It
has multiple facilities worldwide supporting its various capabilities, mostly divided as center of
excellences per product. The manufacturing facilities are divided by component types. Each
manufacturing facility worldwide is a designated center of excellence for a family or families of
components. These manufacturing facilities then ship their finished components to the assembly
facilities and the company’s aftermarket distribution network that supports its maintenance
facilities. The assembly facilities support new production requirements and the maintenance
facilities support the aftermarket requirements for the OEM final product.
The assembly and maintenance facilities are divided by product type. Each facility has a group of
lines divided by product type. There are some redundant capabilities between the various
assembly facilities to provide agility and cope with surge demand; however, each facility is
focused as a center of excellence for a product or a group of similar products. Similarly, the
maintenance facilities are focused as center of excellences for a product or a group of similar
products with some overlapping capabilities for customer reach and surge demand needs.
The company also manages a diverse global supply chain of partners and third party suppliers.
These suppliers range from raw material producers to complex component final machining
suppliers. Depending on their position in the value stream these suppliers will feed the
company’s manufacturing facilities’ needs and also deliver finished components to the assembly
facilities. The model in production is a build to order model with various supermarkets along the
stream to de-couple the supply variability.

15
In the aftermarket the model is a build to stock model, where all suppliers including the
company’s own manufacturing units deliver to a main stocking location. This stocking location
is responsible of feeding all the company’s maintenance facilities with the components they need
to perform the maintenance operations. Their inventory pooled super markets are responsible for
managing demand variability in the aftermarket.
3.3.2 Information Flow
Each site as described in the previous section has its own operational leadership structure.
Usually there is a Director, General Manager or Unit Manager in-charge of these facilities. All
support organizations report through the site leadership with the exception of finance, human
resources and quality they also have dual reporting streams to the site leadership and vertical
reporting to the headquarters functional leadership.
As a division of a publicly traded company, the need for rigorous financial controls and
standardization are paramount. The company has a robust financial reporting system that is
efficient and standardized. The system feeds the reporting needs for the regulatory authorities
and is used to oversee and manage the vast operations of the company. The company also has a
strong governing structure for all financial impacting decisions. They rely heavily on their
existing managerial accounting system to drive the operational leadership to improve
profitability and measure the performance. The financial performance indicators strongly
influence the leadership decisions on various aspects of the business including make and buy
strategies, supplier selections, allocation of resources and investments.
The company’s procurement, supply chain management, logistics, demand planning and material
planning are centralized at the head office. The company produces a three year forecast and gives
its supply base a demand outlook on the component level for the same period covering their
production and aftermarket forecasted requirements. The company’s centralized material
management is supported through an enterprise resource planning (ERP) system that utilizes
material requirement planning (MRP) for demand management, production planning and

16
inventory management. There are various pockets throughout the company that use pull systems
for material replenishment. This can be seen in various facilities supporting production and the
aftermarket.
3.3.3 Continuous Improvement Structure
The continuous improvement operating system is managed and administered via a centralized
team. This team acts are the company’s internal continuous improvement consulting
organization. The centralized team also manages the training curriculum, streamlines the lean
capabilities and tools, facilitates lean events, certifies and audits the company’s various sites. The
team works closely with a companywide network of change agents that are embedded in the
various business units.
These resident experts have usually been trained and certified by the central team in the various
lean and continuous improvement tools. These individuals act as change agents and lean experts
within their operational units. The advantage of this structure is that these experts understand the
businesses they represent while being experts in utilizing the lean tools making them effective
resources to help drive continuous improvement.
The company also extended its lean efforts beyond its walls launching lean support to its
suppliers and partners. Their objective is to connect the various dots of the value stream in
support of driving value stream operational excellence. They dedicated a supplier development
organization that also focused on lean and continuous improvement providing lean training and
event facilitation to their suppliers. They also created a supplier lean program that certifies the
supplier lean proficiency and provides incentives to the suppliers that actively engage in
continuous improvement.
The company has significant resources that are dedicated to its continuous improvement and lean
efforts. They are well structured and aligned in their quest for operational excellence.

17
3.4 Company Lean Status and Challenges
The evident dedication and commitment to continuous improvement has manifested itself in
many tangible improvements throughout the years. The company’s productivity has significantly
increased since its lean implementation over ten years ago. Various projects have resulted in
significant pockets of lead-time improvements. Several sites across their business have been
certified lean proficient achieving operational performance indicators that are of highest
standards. 30% of their total sites have achieved their highest level of proficiency. Over 50% of
the company’s supplier spend is also performing at highest level of their lean proficiency. All the
signs concluded that this is a company that is well immersed in continuous improvement.
However, with all these successful pockets of improvement the company has been stagnant on
fundamental operational performance. Two indispensable key performance indicators have been
stagnating since the initial benefits of the lean transformation was realized post launch in the
early 2000s. Customer on-time delivery and companywide inventory turnover have reached a
plateau. These ultimate companywide indicators are reflective of the whole system effectiveness
versus local performance measures.
The questions arise; why does a company that is well structured and supported to implement lean
is struggling to move the needle on these fundamental measures? Why all the results of these
lean workshops and mappings stopped having an impact on the company’s customer delivery
performance and companywide inventory velocity? This leads to the conclusion that there are
more fundamental issues that are impeding the company’s lean progression. These issues are
beyond the conventional elements advocated by the lean literature. They go beyond management
support, involvement and structure. The company in study is a true example of involvement and
support.
The research focus had to go deeper into the company’s core systems to understand how to drive
effective lean behavior and decipher what is impeding it. It was important to recognize what
drove the operations leaders’ behaviors and what influenced their decisions. The apparent

18
conclusion led to the current management accounting system. As previously discussed the
company relied heavily on its managerial accounting system to drive and measure its operational
leaders’ performance. It was prudent to study the current system and expose its weakness in
order to effectively help the company continue building on its lean quest and address the current
stagnation of customer on-time delivery and companywide inventory turnover measurements.

19
4.0 Overview of the Current Traditional Management Accounting System The first major observation was that the current management accounting system utilized by the
company in study was incompatible to lean thinking. On the contrary it drove managers and
supervisors to make decisions that were fundamentally conflicting with their lean
implementation goals. In most corporations the backbone of decision making is highly
influenced by financial goals. If the accounting system that measures the financial health of the
operations is incompatible or is not capable of showing the financial benefits of lean; the
management will always be caught in a vicious dilemma between doing what they preach and
meeting their financial targets that their success is measured upon.
The next two chapters of the thesis will elaborate on the role of the accounting system in
decision making, highlight the flaws observed in the current system utilized by the company,
demonstrate empirically the cause and effect of current system on lean implementation and
provide arguments against the current system.
4.1 Accounting Systems As defined by G. R. Crowningshield; the function of accounting is to provide financial
information for all parties interested in the welfare of an enterprise (Crowningshield 1962). An
accounting system is tailored to provide information to various stakeholders such as investors,
shareholders, regulatory agencies, analysts, employees and management.
There are three major components of accounting: financial accounting, cost accounting and
management accounting (Killough and Leininger 1984).
Killough and Leininger defined the accounting components as follow:
Financial accounting:
Financial accounting purpose is to provide information necessary to summarize the result of the
operations and financial position of the company for a selected period of time. The information

20
in the financial statements mostly meets the needs of external stakeholders such as regulatory
agencies and investors.
Cost accounting:
Cost accounting purpose is to provide information necessary to drive cost estimation, allocation
methods and product-cost determination. All these elements are necessary to complete the
financial statements.
Management accounting;
Management accounting purpose is to provide information necessary for management planning
and control rather than financial reporting. The information is essential for budgeting and
planning, standard setting, cost control, performance measurement, incentive program and
system development
The inputs of the accounting system are highly influential in the decision making framework of
management. These inputs drive long term and short term decisions. They also influence
allocation of funds and resources. The inputs are the foundation for budgets and goal setting and
provide the mechanism to measure success against these objectives. While cost accounting is
necessary to complete financial statements; management accounting provides the backbone for
management decision making. Performance measurement and incentive compensation are
designed to influence organizational behavior. If these measures were based on principles that
conflict with lean; the outcome is suboptimal at best. In such reality lean becomes a set of tools
rather than a management system. The management team would always be in conflict with what
they believe needs to be implemented to help their company’s lean transformation versus how
their performance is being measured and their success is perceived. In order to avoid such
conflict the compatibility of a company’s managerial accounting system to lean philosophy is
essential to allow any organization to reach its full lean potential.

21
4.2 Current Management Accounting System
The company’s current management accounting system is cost center centric, build on standard
costing and allocation principles. This commonly used traditional cost accounting system is built
on principles developed in the 1920s (Johnson and Kaplan 1987). These principles are more
suitable for a mass production environment and are ill equipped for the high mix low volume
aerospace production reality.
4.2.1 Standard Costing
The definition of standard costing is a predetermined reference that should be attained under a
set of operating conditions (Crowningshield 1962). Carl Warren explained, in his book Survey of
Accounting, that Standards are performance goals used by service, merchandising and
manufacturing businesses to evaluate and control their operations (Warren 2001). He also
mentioned that the accounting systems that use standards to determine cost are called standard
cost systems.
The company in study uses standard cost systems to determine its manufacturing and products
standard cost. The company invests significant effort behind setting these standards to ensure
efficiency and develop references to help management make operational tactical and strategic
decisions. Standards are also used to evaluate the value of the inventory in raw material, work in
progress and finished goods.
These standard costs are used to drive cost reduction, inventory management, cost control,
planning and budgeting. The standard cost system drives key performance indicator that the
managers and supervisors are measured on and the variance from these standards drives
subsequent operational decisions. The standard cost variance analysis reporting by the principle
of exceptions allows management to make corrective decisions and focus on cost management
(Warren 2001). Such accounting system is designed for cost management and drives cost
efficiency centric decisions.

22
Like most companies in the manufacturing sector, the company in study determines their
standard costing by using three main cost components: direct material, direct labor and overhead
allocation. Figure 2 shows a simplified illustration of the standard cost and other cost break
down.
Figure 2 Standard and other costs
In addition to the direct material consumed by every part, standard processing times are used to
determine the allocation of the direct labor cost and overhead cost to each part. The addition of
these three components determines the standard cost per part. Finance then calculates variances
to the standards and allocates these variances to an adjustment account that is added to the
standard cost to determine the cost of goods sold, also referred to as cost of sales (COS) as
described in Equation 1:
Cost of Goods Sold = Standard Cost + Variance Adjustment (1)

23
The COS determines the gross margin once subtracted from the selling price. As a result the
drive to reduce the COS and standard cost is key to improve the company’s manufacturing gross
margins.
Other costs such as purchasing, general and administration (G&A), logistics and rework are not
in the product standard cost nor COS but rather go directly to the bottom line. And thus the gross
margins are not sensitive to such cost as they get subtracted from the gross margins to determine
the net profits. These buckets of cost tend to be more holistic and are not allocated to the product
directly but rather handled and controlled at the higher level of the company Profit and Loss
(P&L) and not by the facilities where gross margins are more relevant and monitored.
As previously mentioned the standard processing times per part and the methods of allocation of
the facility cost to each part are integral parts of how a standard cost system determines the
standard costing. An in depth study was done in one of the company’s main manufacturing
facilities to get a hands-on understanding of the cost allocation methods used. The next section
will elaborate on how standard times are determined and how the allocation methods practically
function to determine the standard cost of every part.
4.2.2 Standard Processing Times (Standard hours)
Standard processing times per manufacturing process step are calculated and set by process
planning and manufacturing engineering. These processing times are quite critical to the
accounting system as they are the basis with which costs get allocated. The process planning and
manufacturing engineering teams work on the part routing through manufacturing in order to
meet the product specifications and while they determine the steps they set the expected
processing times. It is important to mention that the processing time used for allocation has three
components: Set-up time, Cycle time and Inspection time. While the definitions of these time
components are universal it is worth elaborating on how the company’s process planning defines
these time elements. Set-up time is the time the operator takes to set-up the machine to receive
the new part inclusive but not limited to tooling change, calibration and mounting. Set-up time

24
can have idle and non-idle machine time components in it. Part of the lean efforts the company
has been focusing on Set-up time reduction and mistake proofing. It was very apparent on the
shop floor that the understanding of the set-up elements is quite mature, a reflection of the
company’s focus on the lean tools. Cycle time is the time a part gets touched by the machine or
operator in that work center to transform the part. It is common in lean literature that cycle time
can be defined as the frequency with which product is completed from a given process step
(Duggan 2002). In this case the company planning team defines cycle time as the touch time or
“processing time” the part takes to transform in a work center. Finally the inspection time, if the
process step has an inspection step planned in the routing the timing of this inspection is also
added to the total processing time. If an unplanned inspection is required due to a deviation, it is
not added to the processing time; it goes into shop loss as a cost category that goes directly to the
bottom line. Equation 2 summarizes standard processing time as described above:
Standard processing time = Set-up time + Cycle time + Inspection time (2)
These time components are calculated using time studies and set based on relative representation
of various operators or based on previous benchmark of similar existing processes. Once
established they are loaded to the ERP system and each part gets processed through a work
center the system automatically allocates the processing time to each part and adds them
depending on the part routing. This data is stored and updated in the company’s ERP system and
utilized by the finance organization during the budget cycle reviews and by the supervisors and
operations managers for their day to day operational management. The standard processing time
for a given part in a work center is referred to in the company as standard hours.

25
4.2.3 Cost Allocation
The model of allocation determines the manufacturing standard cost of each part using the
processing time that the part spent through all the work centers required to transform the part to
its finished condition. The allocation methods spread the total fixed and variable cost to each
work center in order to allocate it to each part thereafter.
The company uses a top down approach of allocation where the aggregated cost of a facility is
allocated to each cost center and then for each cost center the cost gets allocated to a work center
where the product is produced. As seen in Figure 3 below a production facility has multiple
major cost centers that are divided into multiple work centers, where machines are assigned.
Figure 3 Production facility hierarchy of cost allocation
A cost center for simplification can be described as a major manufacturing product line. It is
worth noting that the layout of the facilities is designed around product lines versus functional
production. This layout is aligned with the lean principles and a significant amount of effort was
done through many years of transformation to orient the shop floor towards a product base
layout. Each cost center or product line can have multiple work centers where the products get
processed. A work center can be a single machine or combination of like machines arranged in
Major Cost Center
Work Center 2
Production Facility
Work Center 1
Machine 1 Machine 2

26
sequence of operations. The material flow sequence is evident on these product lines part
resulting from years of shop floor kaizen events, visual flow and 5S lean implementation.
The cost to a given part gets allocated at the work center level. A standard cost rate per hour is
established per work center. This standard cost rate will include the variable and fixed cost
allocated to the work center. The formula below illustrates the rate calculation at the work center
level, all elements are relative to a specific work center:
Standard cost rate = Cost allocation (Variable + Fixed) / Standard processing time (3)
The fixed portion is mostly driven by the building allocations and utilities. These costs are
mostly allocated using a square footage ratio of the work center relative to the cost center it is
dedicated to relative to the facility’s size. Other allocation in the fixed portion is support groups
to the shop such as IT, Quality and Continuous Improvement Staff which are allocated to each
work center using a manpower ratio relative to the cost center and facility. The last component of
the fixed portion of cost allocation is the machines depreciation of the work center. All these
components determine the fixed portion of the cost allocation.
The variable portion of the cost allocation is mostly driven by the Direct Labor cost per work
center. This included the salaries, fringe and benefits. In addition to the Direct Labor costs; non
product materials such as tools and packing supplies are included in the variable cost per work
center. These costs can be easily traced to a work center and the consumption of those materials
are usually a function of volume and thus added to the variable part of the cost allocation.
These two elements of the cost allocations are calculated using the ERP system. Once divided by
the processing time of the work center a standard cost per hour is determined for each work
center. This standard cost rate is set and used to calculate the standard cost per part later on.

27
4.2.4 Standard Cost Allocation to a Given Part
In standard cost accounting the three main cost elements: direct material, direct labor and
overhead allocation are needed to determine the standard cost of a part. In the previous section
the cost allocation methods of the direct labor and overhead allocation was elaborately explained
and are represented in the standard cost rate calculation per work center. The third element is the
direct material. The direct material cost includes the cost of raw material of a given part. This is
controlled through the ERP system bill of material and master data managed by supply chain and
finance. The cost of the raw material is calculated using the actual purchasing price of the
previous year multiplied by inflation and metal indexes or any other supplier specific escalation
formulas. This is set in the system once a year and any deviation goes to the variance adjustment
added to the COS.
As for the procurement costs (general administration, transportation, warehousing and … etc)
these costs are not included in the standard cost but rather goes directly to the bottom line. The
direct material cost in the standard cost represents the price this raw material is planned to be
procured at from the supplier.
Once the standard cost rate per work center is established and the direct material cost is in the
system, the standard cost of a given part can now be established. Below is an illustrative
example of how standard cost per part gets established using the company’s allocation method.
Example:
Part A takes a total of 6 hours of processing time in Work Center 1, 2 hours of processing time in
Work Center 2 and 5 hours of processing time in Work Center 3. As previously defined
processing time is the total of touch or machine time, set-up time and inspection time of Part A
during all its manufacturing process steps going through a work center. The direct material cost
for this part is $1000 dollars. The fixed and variable cost allocation rate for Work Center 1 is
calculated at $100 dollars per standard hour, Work Center 2 is at $150 dollars per standard hour

28
and Work Center 3 is at $120 dollars per standard hour. Part A goes through the three work
centers in order to transform to a finished good.
Table 3 below illustrates the standard costing of Part A going through is transformation from raw
material to a finished good:
Table 3 Standard costing
Process Step
Part Price Standard cost
Direct material $1000 per part $1000
Process Step Standard shop rate Standard processing time
Standard cost
Work Center 1 $100 per hour 6 hours $600
Work Center 2 $150 per hour 2 hours $300
Work Center 3 $120 per hour 5 hours $600
The standard costing at every process level determines the inventory valuation of the part. Part A
raw material standard cost was $1000 and through its transformation it accumulated $1500,
being valued at $2500 of standard cost in its finished state.
As elaborated in the table above, the cost allocation is derived from the standard processing
hours for a given part. In such allocation system the standard processing time or standard hours,
as referred to by the company’s operations managers, of a given part with its three elements (set-
up time, cycle time and inspection) is what drives the part’s cost. They determine the allocation
of the company’s resources to the part and thus its perceived cost and margin. As a result the
standard hours of a part is an important parameter that managers focus on influencing to improve
the perceived margins of the products they are producing in the work and cost centers they
manage. It is a key enabler for them to attract more business volume to their respective cost
centers and facilities.

29
4.2.5 Standard Cost Rate per Standard Hour (Line Rate)
Building on the previous standard cost explanations; once the standard hours and subsequently
the standard costing is established per part, the management need to create performance
indicators to highlight variation to the set standards in order to trigger corrective actions to help
manage cost.
As per most manufacturing entities the company uses aggregate indicators set annually to
highlight variations to these standards. As a function of the standard cost accounting system one
of the most important indicators is adherence to budgeted standard cost rates for a work center,
cost center and a facility. This key performance indicator is referred to in the company as a line
rate.
Using a bottom-up approach the finance team does an exercise annually during the budget cycle
to determine the line rate of a facility, cost center and work center. This calculation is a function
of volume expected to be produced during a given period of time, which is usually a fiscal year.
The demand data input for the time period in question is fed from the master production schedule
(MPS). Utilizing the ERP bill of materials, the MPS demand is then translated into parts
manufacturing volumes taking into consideration lead time, batch sizes, process routing and
number of units required per parent assembly or sub-assembly. Once the parts volumes are
determined; these volumes are then multiplied by the standard manufacturing processing time
per part (standard hours) per work center and the total amount of standard hours for the time
period is then determined for every work center. In the same fashion the variable cost for the
same given period is also calculated using the volumes from the MPS for every work center. The
fixed costs for the same period are allocated to each work center using the methods explained in
the previous section.
The ratio between the total costs and the total standard hours is then calculated and a standard
cost rate per standard hour for a work center is established for the budgeted year as shown in

30
Equation 4 below. The same method is used to calculate the line rates at a higher aggregated
level for a given cost center and ultimately for a given manufacturing facility.
Line rate (standard cost rate) = (fixed + variable) / total standard hours (4)
Line rates are the number one performance measurements the company uses to evaluate the
financial health of its operations. All operations executives, managers and supervisors are
extremely aware of their line rate targets and their performance measurement is highly
influenced by their success to meet or improve their line rates.
The next chapter of this thesis will demonstrate the behavior resulting from such system in
relevance to the lean principles

31
5.0 Research Hypotheses and Empirical Findings
The aforementioned allocation principles and the standard costing method are fundamental to the
current company’s lean conflict. It was emphasized by Jim Womack and Dan Jones in their
pronounced book, Lean Thinking; that traditional system of standard cost accounting utilizing
labor and machine hours for absorption is congruence to mass-production thinking (Womack and
Jones 2003). Two anti-lean behaviors resulting from the current operations management
accounting system were observed during the study:
1. Standard cost accounting promoted overproduction
2. Standard cost accounting drove a tendency for suboptimal investment decisions
Both behavioral hypotheses were substantiated via empirical findings from the company’s
inventory, delivery and supply chain data, also through surveys of middle management
questioning their decision making tendencies.
5.1 Hypothesis 1: Standard Cost Accounting Promotes Overproduction
The standard cost allocation and overhead absorption accounting created a system that by design
rewards waste “muda”. It was initially designed for mass production driving focus on efficiency
and machine utilization. The variance to the total budgeted standard hours would result in either
favorability or un-favorability to the planned line rates. The logic is that standard hours create
absorption and if the machine is producing the system can allocate overhead and thus absorb
costs. Therefore inventories in such scenario are seen as assets and not waste. The line
supervisors and managers are responsible for controlling manufacturing costs and their number
one key performance indicator is adherence to the budgeted standard hours in order for them to
achieve their line rates. It is highly institutionalized within the operations management and
supervision team is that an idle machine is a machine that does not make money. And thus
32
adherence to budgeted standard hours ensures that the system efficiency is reached and
operations cost is being absorbed.
If a volume variance situation occurs due to uneven flow, supplier shortages or market shift the
supervisors tend to overproduce to make their hours. Their success was measured on meeting
those standard hours and if they are below the hours budgeted their line rate goes up as a result
and their cost is perceived to be higher. And in reverse if the supervisors make more hours with
the same cost even if they were producing more unites than needed, they are perceived to be
financially favorable and their line rate would improve.
As a result the system is driving and rewarding management to overproduce. As explained in the
thesis introduction; overproduction is the number one waste of Taiichi Ohno’s seven types of
wastes. The reason overproduction is the number one waste in the seven types of waste is
because overproduction can result in all other types of waste. When the machines are
overproducing they are unnecessarily consuming capacity that might be needed to deliver other
products on time. Building inventories increase waiting time, adds more cost of transportation,
logistics, warehousing and increases the risk of defects. Also the risks of inventory write off or
major rework increases in the case of a design engineering change; those engineering changes
are common within the aerospace industry and cause significant pain to the materials
organization. All these hidden costs go directly to the bottom line and impact the company’s true
profitability.
The first hypothesis of this this is that standard cost accounting drives a tendency for
management to overproduce.
In the following section of this thesis, examples will be analyzed to demonstrate aforementioned
hypothesis.

33
5.1.1 Line Rate Adjustment Calculations
On the shop floor everyday decisions are influenced by line rate measurements. Here is a
scenario to highlight how the operations team makes decisions to improve the perceived
financial performance of their business units. Work Center 1 has a budgeted line rate of $100
dollars per standard hour. This was calculated based on the work center’s standard processing
time of 10 hours for Part A which has a demand forecast of 1000 pieces during the next 12
months and a raw material cost of $1000. The fixed cost allocation to Work Center 1 is $800,000
for same 12 months. The direct labor required to produce 1000 for Work Center 1 is one operator
costing $150,000 with fringe benefits. An incremental $50,000 of variable material cost
including packaging and tooling will be needed to produce the 1000 pieces. By using Equation 4,
line rate is calculated as:
Line rate = ($800,000 + $200,000) / (10 hrs x 1000 pcs) = $100 dollars per standard hour
According to the calculated budget the $100 line rate has fixed component of $80 and a variable
component of $20 per standard hour.
The standard cost of part A after Work Center 1 process step is ($100 x 10 hrs) + $1000 = $2000
This standard cost becomes the reference with which inventory and margins get calculated.
In order to meet the line rate target and the standard cost calculated in the budget, it is paramount
that Work Center 1 has to accumulate 10,000 standard hours in order to absorb the fixed cost
allocation set in the budget. Based on the calculation above; any deviation from the budgeted
standard hours will have an impact on the line rate and thus on the standard cost of the part. If
the work center accumulates less standard hours during the 12 months it will increase the
perceived cost of the part, on the other hand if the work center accumulates more standard hours
during the same period it will have more hours of absorption and reduce the perceived cost of the
part.

34
Figure 4 below illustrates the relationship between line rate and standard hours.
Figure 4 Relationship between line rate and standard hours
It is obvious from the graphical relationship between cost and hours that the supervisors are
incentivized to overproduce in order to improve their line rates. Below is a demonstration of the
impact to Part A standard cost as a result of variation to the budgeted standard hours.
Consider the following scenario: A shift in volume occurred due to any system variability, such
as customer demand reduction during these 12 months, and the forecast is now revised to 850
pieces instead of the original forecasted 1000 pieces. By definition the $800,000 of fixed cost
will not change during the period. The variable cost of $200,000 will largely stay intact one
(10,000 hrs)
Fixed ($800,000) +
Variable ($200,000)

35
operator is still needed to operate Work Center 1 in order to produce 850 pcs. The 150 pieces
reduction equates to about $7,500 of incremental variable cost savings, such as less consumption
of packing material and tools. However, based on the new volume the total number of standard
hours is now reduced by 1500 hours to 8,500 hours instead of the budgeted 10,000 hours. Actual
line rate and, as a result, cost of part A have now become:
Actual line rate = ($800,000 + $192,500) / 8500 = $117 per standard hour,
Actual cost of Part A = (10 hrs x $117) + $1000 = $2170.
The variance versus the set standard cost is $170 per part; multiplied by 850 pieces for the given
year, that equates to close to $145,000 of margin loss for Work Center 1 against their budget.
This perceived margin loss due to less absorption which increases the cost of the parts produced
in Work Center 1 will push the supervisors to overproduce in order to accumulate the hours and
balance their line rates back to meet budget.
In retrospect the cost variance that drove production decisions did not actually change anything
for the company’s bottom line. The true cost of operations did not change; the fixed cost for the
budgeted period did not change. Altering production volume based on the cost variance analysis
does not bring any true value. Producing 150 incremental pieces in excess of customer demand is
actually wasteful. The operations decision that drove the excess production of 150 pieces to
improve cost by overproducing resulted in creating the number one waste in the seven types of
waste taught under the lean principles.

36
5.1.2 Issuing New Work in Progress versus Rework
An interesting phenomenon was observed that also proves that standard accounting management
creates tendency of overproduction that is beyond conventional wisdom. As previously
demonstrated the allocation of variable and fixed costs in the standard cost calculation are highly
influenced by the accumulated standard hours. Other cost such as logistics, re-work and shop
loss are not captured in the standard costs but are rather pooled into a separate holistic cost
bucket that is subtracted after the margins are calculated. Figure 5 below illustrates the different
cost buckets.
Figure 5 Cost buckets
In a scenario where during manufacturing of the customer order of Part A on Work Center 1, a
deviation was highlighted in 50 pieces found in finished conditioned of the 500 pieces required
by the customer. Work Center 1 was also scheduled to produce another customer order of 500
pieces of Part B during the same budgeted time period. Both Part A and Part B take 10 hours of
standard processing times and have use the same raw material which costs $1000 per part. The

37
annualized fixed cost and the variable cost are similar to the previous example of a total of
$1,000,000. For this scenario, the line rate, and standard costs for A and B are as follows:
Line rate (standard cost rate) = ($800,000 + $200,000) / (10 hrs x (500 pcs Part A + 500 pcs Part
B)) = $100 per standard hour,
The standard cost of part A = ($100 x 10 hrs) + $1000 = $2000,
The standard cost of part B = ($100 x 10 hrs) + $1000 = $2000.
After further analysis it was revealed that those 50 deviated pieces of Part A can be reworked
and salvaged. However, they need to run an additional full cycle of rework on Work Center 1 (10
hours each) in order for them to be salvaged. Supply chain had 5% buffer inventory of the
common raw material on the self of about 50 pieces and can expedite the supplier to advance an
additional 50 pieces to replenish stock from what they have on order. The supervisor is left with
a decision to make whether to rework the parts or use the existing buffer and supply chain
expedites to meet customer demand. It is remarkable to see how the direction of the decision can
influence the perceived cost of the part and the line rate variance.
If the supervisor chose to rework the parts, the incremental accumulated hours will not be
credited to the standard cost or the line rate; it will go against rework and shop loss which gets
accounted for after the margins are calculated. This means that reworking the parts will take
away previous hours that could be used to absorb overhead cost for other products scheduled to
be produced on Work Center 1.
If the supervisor chose to issue new work in progress to compensate for the 50 deviated parts, the
hours will be accredited to the accumulated standard hours. Ironically the work center variance
performance will benefit from the new work in progress and improve its line rate and cost
variance of the products A and B. The incremental 50 pieces issued to the floor will accumulate
incremental 500 standard hours and can be handled by same operator. As a result, the
incremental variable cost is insignificant and can be eliminated from the proceeding calculations,
resulting in the following line rate, and standard costs for A and B:

38
Actual line rate = $1,000,000 / 10,500 hrs = $95 dollar per stand hour,
The revised cost of part A is ($95 x 10 hrs) + $1000 = $1950,
The revised cost of part B is ($95 x 10 hrs) + $1000 = $1950.
That is an additional perceived margin of $50,000 for both products combined. The decision to
issue the incremental 50 pcs rather than re-working the deviated batch; improved the perceived
cost of all products produced on Work Center 1. This is another example where an operations
decision to overproduce have yielded favorable perceived results using standard accounting
variance analysis.
Cost accounting allocations principles valued a wasteful decision of overproduction and swayed
the operators’ behavior away from reworking the deviated batch. How can that be justified when
the business did not create any true value. On the contrary that decision has locked more of the
company’s cash in inventory that it did not need as overproduction has drove supply chain to
overbuy. While the non-conforming pieces are still valued as assets in inventory waiting for
rework, they are usually set aside to advance other priorities until they eventually have to be
addressed before they get financially provisioned. While these decisions are not done
maliciously; they are decisions that the operations teams have to make on daily basis in order to
manage their line rates and standard cost variances and their perceived success. What they don’t
realize is these decision impact indirectly the company’s true financial performance by
consuming unnecessary resources and overwhelmingly driving resources to overproduce creating
waste.
5.1.3 Empirical Evidence
Below is empirical evidence observed during the research; these findings clearly highlight the
impact of the current managerial accounting system on the company’s operational performance.
Evidence of overproduction and anti-lean behavior were found upon studying the work in
progress status and quality disposition practices for non-conforming material. A focus on
manufacturing sites performance was also done where the impact of the cost accounting system

39
was suspected to be the highest. The study covered performance data over the past three years;
going back to 2012 and also reflecting the first six months performance of 2015.
The first finding was that about a third of the work in progress can be classified as aging. The
way aging is calculated; is any part that stays in work in progress status without being finished
for more than 125% of its system processing time. This is a direct result of cost centric behaviors
as demonstrated above where overproduction is favored to meet line-rate targets.
Figure 6 below illustrates the data collected since 2012, plotting the fourth quarter end points of
the last three years and the second quarter end point for 2015 WIP and aging WIP values. It is
clear that the percentage of the work in progress aging has hovered around 30% over the period
in study. The consistency of the aging performance clearly demonstrates that the overproduction
issue is institutionalized into how the company operates.
Figure 6 Work in progress aging
WIP Value $

40
The same study was conducted for the manufacturing sites. The results were slightly higher than
the overall company performance. Similarly the manufacturing sites over the past three years
have carried over a third of their work in progress inventory in the aging bucket. Some
manufacturing sites had their work in progress aging status reach near 40% during some months
within the year. Figure 7 below shows work in progress aging statistics for manufacturing sites.
Figure 7 Manufacturing sites work in progress aging
It is very evident from the work in progress results that overproduction is epidemic within the
company. This can be directly linked to standard cost accounting measurement pressures and the
subsequent decisions being made to meet line rate targets by the operations management team.
The notion of absorption by default drives the system to overproduce.
Another study was done to understand the speed of which non-conforming parts get a
disposition within the company’s operational system. Disposition is the action taken between
WIP Value $

41
quality and production to assign an action to each deviated part determining whether the part will
be reworked, accepted in its deviated condition or scrapped. A system that overproduces is
expected to have a higher risk of deviations; and while the operations teams are busy
overproducing they cannot allocate the time to analyze and disposition a part that is found to be
non-conforming. Instead they usually prefer to produce another one and allocate more
production hours. The evidence was remarkably clear in the aging of these quality dispositions,
as demonstrated below.
Figure 8 below illustrates the company’s quality disposition performance over the past three
years. The results in the figure demonstrate that over that past three year around 60% of the
quality notifications of non-conformance have exceeded 30 days to get a disposition. That
means that only 40% of the non-conforming parts identified throughout the past three years were
able to get a disposition and get actioned where to scrap or rework within a 30 days window.
This is clearly a sign of a system that is overloaded. Even though there is a slight improvement
over the years; the aging statistic is quite high and is clearly reflecting the symptoms of
overproduction.
Figure 8 Quality disposition aging
INV Value $

42
Looking into the manufacturing sites non-conforming quality notification disposition
performance Figure 9 the results were 30% higher than the company’s performance. A
staggering 80% of the quality notifications of non-conformity in the manufacturing sites took
more than 30 days to get a disposition. Some of these quality notifications aged for over six
months and on some occasions even exceeded one year before they were addressed.
Figure 9 Manufacturing Quality Disposition Aging
As clearly demonstrated throughout this chapter; it is more advantageous for standard costing
and line rate management to issue more products on the floor than rework the deviated parts. The
cause and effect of such phenomenon is clearly demonstrated in the manufacturing sites quality
INV Value $
43
disposition aging. Supervisors have to make choices every day and what they are measured on
drives their ultimate path.
The symptoms of overproduction are paramount in the aforementioned findings. These findings
are to be expected as they are a result of an accounting system that overwhelmingly drives
people to make day to day decisions in favor of overproduction. The system’s main objective is
to keep all the resources efficiently producing regardless of what they produce and when they
produce it. A measurement system that drives and rewards overproduction is in direct
conflict with lean thinking.
44
5.2 Hypothesis 2: Standard Cost Accounting Drives a Tendency for Suboptimal Investment
Decisions
The company’s current simplistic cost allocation method using labor and machine time (standard
hours) as reference to allocate overhead is more suitable for a mass production environment with
limited product and process variety. In addition these principles were developed in the beginning
of the century where labor cost relevance, manufacturing complexity and technology where at
very different stage than today’s manufacturing reality. Quoting Srikanth and Robertson “since
the time of Ford and Taylor, day to day activities at all levels of the manufacturing organization
have been governed by the standard cost accounting system and its single-minded focus on the
reduction of unit costs through the reduction of direct labor content” (Srikanth and Robertson
1995).
In today’s manufacturing environment machine technology, process complexity and automation
has been rapidly evolving. The increase cost of materials, energy, logistics and professional
support staff has way out paced the cost of labor; as a result the significance of the cost of labor
relative to the total manufacturing cost has been reducing. It is estimated that the average labor
cost is around 17% for U.S. based manufacturing companies (Flinchbaugh and Carlino 2006).
This strengthens the argument that the relevance of the direct labor hours to real cost of
manufacturing is not as significant in today’s manufacturing reality.
However, as previously explained in Section 4.2.4, in traditional cost accounting the direct labor
and overhead allocation based on standard hours are important components to a given part’s
standard cost. They determine the allocation of the company’s resources to the part and thus its
perceived cost and margin. Such managerial accounting system drives managers to focus on
labor and machine efficiency and pushes them to find way to reduce labor content. These are
notions relevant to mass production versus the mixed model and relatively low volume reality of
aerospace.
Figure 10 below illustrates the components of standard cost and the other cost drivers that are not
reflected in standard methodology.

45
Figure 10 Cost drivers that are not reflected in standard cost
Given that labor is not the main driver of manufacturing cost and yet it is the most important
parameter that determines product standard cost in the current traditional costing model,
managers are making decisions based on distorted input from their accounting system. The
current costing data is not comprehensive enough to capture the true cost of a product. Major
cost drivers in today’s business reality such as purchasing, general administration (G&A),
transportation and warehousing are not reflected in the standard cost are illustrated in Figure 9.
Managers who make important day to day strategic decisions based on the product standard cost
data only, will give little attention to other cost parameters that need to be considered not to
erode the bottom line. Decision such as capital investment in machinery, investments in
manufacturing process improvements and in-sourcing or out- sourcing are all influenced by the
standard cost data. All these decisions are in quest for improving operational profitability. If the
cost data are not truly reflective of reality then managers might be unknowingly working against

46
their and their corporate’s main objective. Their decisions might be hurting the bottom line
instead of improving it.
The second hypothesis of this thesis is standard cost accounting drives a tendency for
suboptimal investment decisions.
In the following section of this thesis, examples will be analyzed to demonstrate aforementioned
hypothesis.
5.2.1 Process Lead Time Reduction Unrewarded
The company has been embarking on value stream mapping and process improvement events
from the past decades. It is not uncommon that the operations management struggle with the full
implementation of these initiatives. An interesting finding is that impact of these events can be
perceived unfavorably on the product cost creating ambiguity and confusion. Here is a scenario
to help illustrate the conflicts that sometimes arise between lean actions and product cost.
Part A goes through Work Center 1 and Work Center 2 for grinding and de-burring, respectively.
Customer demand is 20 parts per month. Both work centers have similar set-up times (ST) of 10
minutes, however their cycle times (CT) considerably differ with Work Center 1 at 15 hours and
Work Center 2 at 30 hours. The differential in cycle time creates an inventory accumulation of 5
pieces worth 7.5 days of customer demand in between both work centers. Figure 11 shows a
portion of a value stream map for the current state for Part A.
The total processing times of Part A inclusive of set-up times is 45 hours and 20 minutes. The
total manufacturing lead time of Part A is 10 days.

47
Figure 11 Value stream current state
In a scenario after a lean event, the team identifies an opportunity through a kaizen bursts to
reduce the total lead time of Part A through rebalancing the CT of both work centers. Offloading
some of the de-burring operations to the grinding operations during its finishing steps in Work
Center 1 can help reduce the CT of Work Center 2 thus improving the effective throughput of
Part A. This will also allow the parts to flow in a single piece flow eliminating the need for
inventory accumulation and avoiding unnecessary non-value added wait time. The solution
proposed will add 10 hours to the finishing process of Work Center 1 while reducing Work
Center 2 processing time by 5 hours. Figure 12 shows the portion of a value stream map after
the lean analysis for Part A.

48
Figure 12 Value stream future state
In this scenario the total processing time for Part A will be 50 hours and 20 minutes. By
eliminating the in between process inventories the total lead time will also be equal to the total
processing time adding to little more than 2 days of lead time. As a result of these process
modifications the total processing time has increased by 10%, however the cycle time of Work
Center 2 has improved by 17% and consequently the throughput or frequency of Part A
production influenced by Work Center 2 has also improved by 17%. Correspondingly the total
manufacturing lead time has improved by a staggering 80% (10 days to 2 days). Looking at the
results from a lean perspective they are impressive as they result in improvement in various
dimensions; lead time reduction, inventory elimination, throughput improvement and cycle time
reduction.
One would also conclude that the results will also have a positive impact on the financials with
the improvement of cash velocity and output rate. Looking at the results from a standard cost
accounting perspective they paint a difference picture. The only dimension that lean causes is it
increases the total cycle time (total standard processing time) by 5 hours. As standard cost
accounting methodology uses the processing time, or standard hours as per the company’s
terminology, to allocate cost; the lean exercise has actually increased the part cost. Given that the
line rate of Work Center 1 and Work Center 2 is at $100 per standard hour and the variance from
the total standard processing time is an incremental 5 hours; the standard cost of the Part A has

49
increased by $500. The lean exercise have eliminated waste and should have improved
profitability, however under such an accounting system has increased Part A’s perceived cost
and reduced its margin. Such a contradiction puts the management team in a dilemma; how can
their continuous improvement efforts reflect negatively on the same parts they are trying to
improve. This is a true manifestation of how standard cost accounting ignores improvements in
process lead time and in various other dimensions that lean achieves and drives a suboptimal
decision by concentration only on one dimension (total standard processing time).
5.2.2 Process Cycle Reduction Phantom Savings
The process planning team is often under pressure to reduce product cost; part of a companywide
initiative to reduce cost and improve margins. Influenced by standard accounting principles they
always tend to focus their efforts on finding ways to reduce total processing times to eliminate
hours for a given part and thus reduce its standard cost. These efforts include finding innovative
ways to machine the parts more rapidly utilizing the company’s scarce manufacturing
development resources and engineers. Due to the emphasized limitations of the standard costing
approach and the proven conflicts it can induce, it is paramount that the selection of these efforts
if solely driven by standard cost parameters can actually be detrimental. Some of these efforts if
not selected wisely not only will they be wasting scarce resources on non-value added projects;
they actually might be working against the company’s profitability goals by incurring
incremental investments while delivering phantom savings. Here is scenario that highlights the
false perception of savings and the indirect impact it can have on the company’s true financial
performance.
Building on the previous example, the planning team assigned a task force to find innovative
ways to reduce the grinding process time of Work Center 1. With an investment of $10,000 in
new tooling material and mounting the engineers will be able to save 5 hours of the processing
time of Work Center 1. Figure 13 below illustrates the impact of such investment.

50
Figure 13 Work Center 1 cycle reduction
The 5 hours saving of processing time for Work Center 1, will generate a positive impact on the
Part A standard cost based on the standard cost and allocation accounting principles. For
simplicity shaving 5 hours from the total processing time of Part A multiplying that with the
$100 line rate will create a favorable standard cost differential of $500 dollars. From a standard
cost accounting perspective the team has improved margins by the same amount. They can
practically pay for the $10,000 investment with the cost differential of one month worth of
production. It looks like a logical business case.
However, if you take another look at the investment in study with lean eyes you will realize that
the savings predicted are nothing but phantom. Not only the savings are not real; the company
will have incurred incremental cost without truly creating value. The incremental differential of
the cycle times between both work centers will create more room for inventory build-up and as a
result the total lead time of the Part A will also increase. The reason why the decision is not ideal
is due to the fact that Work Center 2 dictates the pace of sales. With its longer cycle time Work
Center 2 can be labeled as the pace maker or the critical constrain. Any reduction to Work
Center 1 cycle time will not create more sales or cash velocity if Work Center 2 cycle time

51
remains unchanged. As a result the suggested investment will not create more sales or deliver
more products to the end customer. Given that the fixed cost and variable cost will also remain
unchanged; the reality is the Part A’s margins did not improve. On the contrary the $10,000
tooling investment, depending on how the accounting team will treat it, will be an additional
expense or will increase the company’s asset depreciation.
Standard costing methods gives equal importance to all resources in its methodology of
allocation. In the aforementioned example it is clear how these methods can mislead
management to making flawed investment decisions. These investment decisions in actuality will
work against the company’s objectives; blindsided by the standard cost accounting limitations
and shortfalls. Unfortunately the significant activities the company has launched to improve its
standard cost; guided by these accounting principles will tend to generate suboptimal results.
5.2.3 Outsourcing Impact Based on Line Rate Allocation
Another observation where standard cost accounting can misguide management in making vital
decisions is the out-sourcing and in-sourcing of hardware based on standard cost. As previously
elaborated standard costing only represents a portion of the current manufacturing cost drivers.
Major cost elements such as purchasing G&A, transportation and warehousing are not
represented in the standard cost. The exclusion of these pooled expenses does not provide clarity
on the true cost of managing and manufacturing a part. The standard cost is centric around
overhead and labor allocation based on standard hours. By design standard cost it is not suitable
for sourcing decisions due to its limitations. However, it has always been the reference that the
operations sourcing team used to move hardware allocation between its facilities or to an
external source in the supply chain.
Here is a scenario decision that will highlight the shortcomings of using standard costing as a
reference for sourcing activities. The scenario is a study of sourcing Part A from its current
North American facility to another company owned international low cost facility. The study was
done using standard costing and line rates as a cost reference. North American facility has a line
rate of $100 per standard hour and the international low cost facility has a line rate of $60 per

52
standard hour. Part A will be manufactured in the international facility and shipped back to be
assembled in a higher assembly produced in North America before being sold to customers. Part
A has a total processing time of 10 hours and thus using the allocation logic its standard cost in
its current location can be calculated at $1000 per part. If the part is sourced to its international
low cost facility its new standard cost will be calculated at $600 per part. That is a standard cost
saving of $400 per part. Given that the part volume is 1000 pieces per year. This sourcing project
is expected to yield perceived savings or margin expansion of $400,000 annually. As a result of
the reduction in volume in North America headcount can now be reduced by one operator
favorably impacting variable cost. An additional investment of $650,000 of new machinery will
be needed in the international location to accommodate Part A production. Also engineering
substantiation and non-re-occurring project spending of another $100,000 will be required.
Looking at it from a standard costing perspective the business case will have a pay back in less
than two years.
Looking at it from a lean perspective many more questions needed to be answered to substantiate
such investment. What will be the incremental inventory investment to support the international
source? Is there an incremental warehousing expense required to support these inventories? What
is the incremental transportation investment to move the hardware back and forth? What is
impact of this sourcing activity on lead time? What is the exposure to more defects by adding
lead time and inventory to the system? What is the exposure to material handling risk? All these
are questions that standard cost accounting does not answer. All these elements are waste that the
lean principles focus on eliminating as they are deemed non-value added.
In addition the investment could also have a negative impact on the North American line rate.
Sourcing out 10,000 standard hours without having a plan for back fill will result in increasing
North American line rates. The overhead cost will be allocated or absorbed by fewer hours and
thus the rate will go up. Even though the labor reduction yielded variable saving on Part A, the
majority of the line rate is driven by overhead allocation. In such scenario optimizing Part A
standard cost by sourcing it outside of its current facility will increase all other products
produced in the facility it left behind. And because the overhead and machinery are also still
required in North America for other products the company hasn’t really saved on anything. On

53
the contrary it has just added to its cost structure by acquiring incremental machinery for the low
cost international facility. What it might have saved on labor, it will be paying on other hidden
cost in incremental depreciation and underutilized assets. This is without calculating the financial
impact of all the lean wastes that are not considered by standard cost accounting that will result
from the out-sourcing decision. Another example of phantom savings that in actuality might be
costing the company more money than it originally did before the outsourcing decision.
Standard costing should be the reference for making sourcing decisions. It can be misleading and
is ill equipped to provide a total holistic picture to management in order to ensure that the
investment decisions they are making are based on sound basis.
5.2.4 Empirical Evidence
Due to the sensitive nature of the profitability data, figures on financial profit and loss
performance will not be shared in this thesis. As a division of a major corporation the company
does not disclose its divisional financial statements to the public. Financial statements at the
parent division level are publicly published on a quarterly basis.
It is fair to say that years of cost reduction activities did contribute to margin improvement from
operations cost curtailment. Effective projects of square footage consolidations and facilities
reorganization have yielded beneficial results. However, the potential of further significant
margin improvement is still apparent. Only a percentage of the hundreds of millions of dollars of
cost savings, that the sourcing teams have been claiming, did materialize in effective true bottom
line benefit to the company. There are signs of over capitalization throughout the company’s
facilities. Some North American facilities are at current utilization load that is suboptimal. This
is a result of years of sourcing activities that moved hundreds of parts between facilities.
In support of the sourcing activities; the total absolute inventory has also grown significantly
over the past 10 years. The absolute inventory has grown over the past 10 years at a compounded
annual growth rate that is 28% higher than the compounded annual growth rate of the company’s

54
sales for the same period. The inventory turnover has stagnated for 10 years. The total company
turnover has seen a slight deterioration even though all facilities have been actively working on
lean initiatives. Some facilities did indeed improve their local performance in turning their work
in progress inventory faster but the collective performance of the company has lagged behind.
These are symptoms of a system that drove suboptimal results despite of years of continuous
improvement and cost reduction activity. The performance shortfall can be justified by the
exposed limitations of the standard cost accounting system that currently supports the backbone
of decision making of the company’s operations management. It drives decisions that do not
support the lean principles and philosophies.
5.3 Hypotheses Conclusion
In studying both outlined hypotheses, many aspects of standard cost accounting system shortfalls
have been exposed. This will be valuable in helping define recommendations for the company’s
lean enterprise transformation plan. Based on the behavior observation and empirical data
supporting the hypotheses it is evident that the fundamental tools that the management is
currently using to operate the business are mass-production centric. Consequently how do we
expect them to induce lean favorable decisions in such environment? The system puts them in
direct conflict with the same objectives they are trying to achieve. Either by incentivizing them
to overproduce, as proven in hypothesis 1, or by misguiding their decisions, as proven in
hypothesis 2, the system by design drives anti-lean outcomes. The root cause of their lean
conflict is driven from the fact that their management accounting system is contradictory to lean
thinking.

55
6.0 Alternative Solutions to Traditional Cost Accounting
The focus of the coming chapters is on finding a comprehensive solution that will address the
deficiencies caused by standard cost accounting practices and enable the management team to
drive lean favorable decisions. Activity Based Management, Throughput Accounting and Lean
Accounting were all studied as alternate managerial accounting solutions to the company’s
current traditional cost accounting system.
6.1 Managerial Accounting Evolution
The traditional standard cost accounting methods used today where all developed in the 1920s
(Johnson and Kaplan 1987). Over the past century product diversity, manufacturing methods,
technology and organizational structures have significantly evolved, while these traditional
accounting practices have stagnated. This evolution gap and its shortfalls are clearly observed in
the research findings of Chapter 5.
As described in Chapter 4, the accounting and costing systems were designed to fulfill three
major functions:
Enable external reporting to stakeholders,
Determine product costing and
Guide management operational and strategic control.
Many companies use one costing system to suffice the needs of three accounting functions
mentioned above (Kaplan and Cooper 1997). Similarly the company also uses one costing
system for its three accounting functions. As a division of a public company the external
reporting needs for the company are dominant. Notwithstanding the lack evolution of the
traditional standard cost accounting systems, they are still suitable to meet the needs of external
financial reporting (Kaplan and Anderson 2007). Auditors and regulators are not concerned if the
costing is distorted between different products as long as the aggregated inventory value is
balanced with the financial entries recorded and reconciled in the financial statements (Johnson

56
and Kaplan 1987). This subtlety is one of the reasons that caused the stagnation of the traditional
cost accounting systems evolution.
Even though the current traditional system meets the company’s external reporting needs, in
order to drive favorable lean behavior the company needs to address its costing and management
accounting functions. The thesis research findings proved that the traditional standard cost
accounting systems provided distorted product costing data and ill-equip management to make
sound operational and strategic decisions. As a result the company needs to pursue an alternative
costing system in support of its three accounting functions or decouple the external reporting
system from managerial accounting systems utilizing different costing techniques for both.
6.2 Evolved Alternatives
Multiple alternatives to traditional cost accounting system were studied in support of designing a
comprehensive solution that will address its proven shortfalls. Three alternatives: Activity Based
Management, Throughput Accounting and Lean Accounting were analyzed, challenged and
strategically ranked.
6.2.1 Activity Based Costing (ABC)
In the 1980s ABC was introduced with the intention of fixing the allocation deficiencies of the
traditional standard costing (Kaplan and Anderson 2007). The difference between ABC and
traditional cost accounting; is that ABC focuses on activities done by the company’s shared
resources to allocate cost to product or services. The allocation logic is centered on the principle
that product or services consume activities and activities consume resources. By allocating the
indirect cost to the activities, in turn one can allocate the cost to the product or service based on
the amount of activity each product or service did require to be delivered (Northrup 2004).
Figure 14 below illustrates the activity-based cost allocation principle.

57
Figure 14 Activity-based cost allocation
The activity-based allocation technique ensured that the indirect costs that have grown
significantly in today’s manufacturing reality such as purchasing, administration, quality,
logistics and planning are now allocated to each product on the basis of activity consumption.
This principle change has significantly reduced the distortion of the traditional cost allocation
model, helping provide managers with more accurate profitability information to drive better
decisions (O’Guin 1991).
6.2.1.1 ABC System Construct
Kaplan and Cooper in their pronounced book, Cost and Effect, elaborated on four sequential
steps to develop an ABC management system.
Step 1 Develop the Activity Dictionary:
Identify the activities that are done by the company’s shared resources. This includes
customer activities such as administration, sales and marketing in addition to product
activities such as machine set-up, purchasing, transportation, warehousing and quality
58
control. These activities are then summed in an activity dictionary. The level and quantity
of activities in an ABC system is a reflection of a company’s aspiration for improvement
and complexity. The level of granularities of activities enhances the accuracy of cost
allocation; up to a point of diminishing returns due to cost of administering and
maintaining the system.
Step 2 Determine How Much the Organization is Spending on Each Activity:
Using resources cost drivers such as salaries, fringe, travel and indirect materials gathered
from the company’s financial systems, the resources cost is mapped to the activities
identified in the dictionary. This can be done using estimates of the resources time
allocation to a defined task. This step provides the company with an elaborate view of
what activities they spend money on.
Step 3 Identify Organization Products, Services and Customer:
This is a logical step to perform in support of linking activity costs to the eventual
recipient of the company’s product and services. This step defines the ultimate purpose of
a company’s activities.
Step 4 Select Activity Cost Drivers That Link Activity Costs to the Organization’s
Products, Services and Customers:
This is the final step by which cost is allocated to products or services dependent on their
consumption of activities. This is guided by the activity cost driver, a measurable
quantitative unit of activity output. As long as these units are quantifiable, they can differ
in nature. A company can have activities with transactional drivers based on frequency of
occurrence such as number of engineering changes, or activities with duration drivers
based on time requirement such machine set-up hours, or activities with intensity drivers
based on actual cost of the specialized resource that the activity demanded.
This methodology helps companies produce good estimates of cost and provide management
with clarity on the level of activities and resources utilized to deliver specific products or
services (Kaplan and Cooper 1997). In addition to pricing benefits; having more accurate costing

59
information will enable managers with better tools to make better operational and strategic
decision that were compromised by traditional cost accounting distortion as proven in Chapter 5
of this thesis.
6.2.1.2 Financial Reporting
There are limitations of using ABC costing for the external financial reporting needs. As
previously mentioned external financial reporting is focused on consistency and robustness of
balancing inventory valuation with the financial entries recorded and reconciled in the financial
statements. The ABC model should evolve with a company’s learning post implementation and
changes to the costing assumption are prune to change. External stakeholders such as auditors
and tax authorities value consistency, uniformity and objectivity (Kaplan and Cooper 1997). This
might contradict with the ABC continuous improvement managerial needs. Also some expenses
might not be allowed under traditional rules to be allocated to inventory while in an ABC model
managers might prefer to allocate these activities to product cost. As a result decoupling the
financial reporting from the ABC and using the new model for managerial accounting might be a
prudent choice.
6.2.1.3 Drawbacks of ABC
While ABC principles did close deficiencies in the traditional cost allocation models it also has
several drawbacks that hindered its wide acceptance as described below:
1. System set-up and maintainability:
ABC system requires substantial investment of resources and time to build. The complexity of
storing data, updating the models, computing durations and complicated usability of the data by
managers using conventional office software impacted ABC’s popularity. As a result of its
complexity, companies also tend to implement ABC in pockets, limiting the benefits of
enterprise wide profitability opportunities (Kaplan and Anderson 2007).

60
2. Practical capacity vs actual utilization:
One of the models shortfalls is that it ignores practical capacity. When resources estimate the
time they allocate to activities they add up to 100%. As a result all cost drivers in the ABC
modeling assumes that all resources work at full capacity which in reality ignores the potential of
unused capacity (Kaplan and Anderson 2007).
3. Allocation shortcoming:
The fundamentals of indirect cost allocation to product and in turn to inventory delays a
company’s recognition of expense. Costs are allocated to inventory. The expense is only be
recognized when the inventories are sold. If a company builds WIP or finished goods the
allocation will allow it to improve profitability in the short term as the cost will be allocated to
inventory (Corbett 1998). This allocation principle drives overproduction.
6.2.2 Throughput Accounting
In the 1980s Eliyahu Goldratt, introduced the Theory of Constraints (TOC). He declared cost
accounting to be the number-one enemy of productivity loss (Corbett 1998). Glodratt’s TOC
solution to traditional cost accounting shortfalls is Throughput Accounting.
6.2.2.1 TOC
TOC is a methodology of production logistics that focuses on maximizing throughput. The TOC
drives a continuous improvement approach that is structured in five sequential steps (Goldratt
1990):
1. Identify the system constraint:
A constraint is the limiting resource in a production facility that limits its maximum flow.

61
2. Exploit the system’s constraint:
Once the constraint is identified, the goal is to drive this resource output. This can also be
achieved by protecting it from any material shortages that might cause the resource to
lose capacity.
3. Subordinate everything else to the above decision:
Drive all other resources to work at the constraint’s pace. This would ensure there is no
unnecessary build-up of work in progress.
4. Elevate the system’s constraints:
In this step the goal is to unblock that constraint by breaking it. This can be achieved
through optimization or investment in capacity.
5. Once the constraint is broken go back to step 1:
The moment a constraint is unblocked the system performance will not got infinity, it
will be paced by another constraint. At this milestone the logic is to start again from the
beginning and drive the continuous improvement cycle.
6.2.2.2 Throughput Accounting Elements
Built on the TOC philosophy; throughput accounting offers a simplistic approach to guide
managerial decision making. This is driven by the fact that throughput accounting considers all
operating expense including direct labor not to be totally variable. There are three key elements
to throughput accounting: Throughput, Operating Expense and Assets (Northrup 2004):
Throughput (T):
Throughput is the rate by which the company generates money. This is calculated by
deducting the revenues from the material cost paid to vendors.
Operating Expense (OE):

62
All the money the system spends in converting inventory into throughput. This is
inclusive of direct labor.
Assets / Investments (I):
All the money the system invested in buying items with the intent to convert to
throughput. It is worth noting that the inventory is valued in throughput accounting at the
value it was purchased from the vendors. Throughput accounting eliminates any
allocation of cost to inventory. This is a fundamental difference relative to traditional cost
accounting models.
Throughput accounting uses these three elements to guide decision making. The three elements
are used to drive two main performance indicators: Net Profit (NP) and Return on Investment
(ROI). NP and ROI are tailored to help drive operational and strategic actions. The following
formulas demonstrate the link between the three elements:
Net Profit (NP) = Throughput (T) – Operating Expense (OE) (5)
Return on Investment (ROI) = (Throughput (T) – Operating Expense (OE)) / Investment (I) (6)
This simplistic methodology drives management to focus on decisions that will improve T and
lower I and OE. In throughput accounting ROI is the ultimate measurement in decision making.
In throughput accounting management is geared to drive decisions to improve ROI continuously
(Corbett 1998).
6.2.2.3 Financial Reporting
The fundamentals of throughput accounting go against the conventional general accepted
accounting principles (GAAP) that are designed for external reporting consistency. Unlike cost
accounting principles; throughput accounting does not allocate any cost absorption to inventory
and thus will not be suitable for external reporting. It is rather a managerial accounting principle
that drives managers to make favorable decision to increase throughput and profitability.

63
6.2.2.4 Throughput Accounting Limitations
The simplistic nature of throughput accounting is its own limitation. This is based on the
assumption that the operating expenses inclusive of direct labor are fixed independent of product
volume, mix and complexity. This assumption is argued to be valid for short term and tailored to
maximize short term profits operating in a constrained production environment (Kaplan and
Cooper 1997). In the long run all costs are considered variable (Johnson and Kaplan 1987).
Throughput accounting can be very useful in solving a linear programing like issues to drive
optimal decisions around a constraint. It lacks a comprehensive view of business measurements.
6.2.3 Lean Accounting
With the increased interest in lean manufacturing principles the need for complementary
accounting and measurement systems is in high demand. Lean accounting is a new method of
managing a business based on lean principles; it amalgamates lean and accounting methods in a
new context to manage, control and measure the enterprise (Maskell et al. 2012). The field of
lean accounting continues to evolve with today’s business environment and management
innovation.
Lean accounting was designed to address the following needs that are essential to lean
practitioners (Maskell et al. 2012):
1. Replace traditional measurements with lean performance measurements designed to drive
lean and continuous improvement behaviors within the various levels of the organization.
2. Identify the financial benefits of lean implementation and improvements while
developing strategies to continuously expand these benefits.
3. Provide improved methods to determine product cost and value stream costs in order to
enable profitable business decisions by management.
4. Eliminate waste from the accounting, control and management systems.
5. Enable finance resources to work on lean improvements and strategic matters by
providing them with capacity gains.
6. Drive the business around customer value creation.
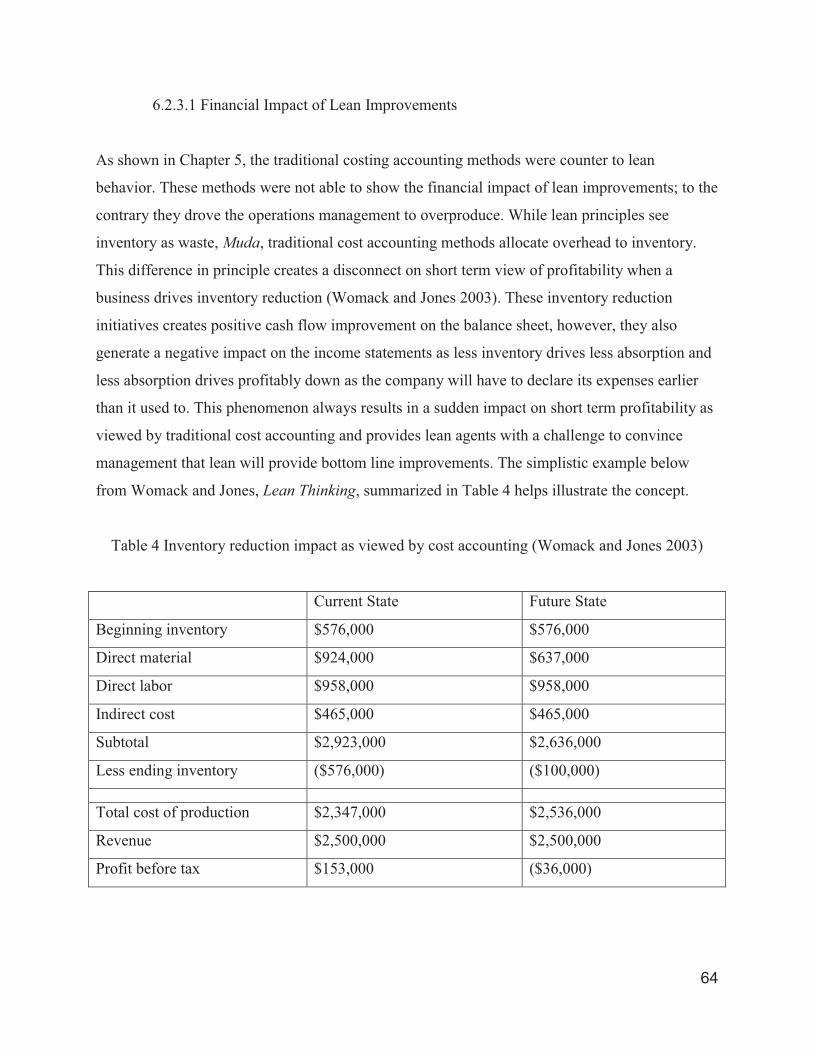
64
6.2.3.1 Financial Impact of Lean Improvements
As shown in Chapter 5, the traditional costing accounting methods were counter to lean
behavior. These methods were not able to show the financial impact of lean improvements; to the
contrary they drove the operations management to overproduce. While lean principles see
inventory as waste, Muda, traditional cost accounting methods allocate overhead to inventory.
This difference in principle creates a disconnect on short term view of profitability when a
business drives inventory reduction (Womack and Jones 2003). These inventory reduction
initiatives creates positive cash flow improvement on the balance sheet, however, they also
generate a negative impact on the income statements as less inventory drives less absorption and
less absorption drives profitably down as the company will have to declare its expenses earlier
than it used to. This phenomenon always results in a sudden impact on short term profitability as
viewed by traditional cost accounting and provides lean agents with a challenge to convince
management that lean will provide bottom line improvements. The simplistic example below
from Womack and Jones, Lean Thinking, summarized in Table 4 helps illustrate the concept.
Table 4 Inventory reduction impact as viewed by cost accounting (Womack and Jones 2003)
Current State Future State
Beginning inventory $576,000 $576,000
Direct material $924,000 $637,000
Direct labor $958,000 $958,000
Indirect cost $465,000 $465,000
Subtotal $2,923,000 $2,636,000
Less ending inventory ($576,000) ($100,000)
Total cost of production $2,347,000 $2,536,000
Revenue $2,500,000 $2,500,000
Profit before tax $153,000 ($36,000)

65
In the example above the future state inventory reduction initiative have helped a company
require less material-buy to generate the same amount of revenue. With the direct labor and
indirect cost remaining unchanged in the future state, the reduction of inventory has resulted in a
positive cash outcome. The future state has generated the same income with less expenditure.
However, the traditional cost model will view a production cost increase resulting from a
reduction in ending inventory. And thus will show this initiative as having a negative impact on
profitability. Fewer inventories means less absorption and thus the production expense will be
recognized in the period relative to being allocated in inventory and superficially being perceived
as assets.
Similar to throughput accounting; lean accounting counters this phenomenon by disregarding
any cost allocation to inventory. Lean accounting rather uses cash basis accounting for
operational expenses, which discloses the expense as period expenses, rather than allocating
overhead to inventory and disclose these costs at the time of sale. This approach will eliminate
this incentive for production to overproduce in order to improve their perceived financial
performance. Lean accounting views value stream profitability in a simplistic approach as
presented in Equation 7 below:
Value stream profitability = Revenue – Material cost – Conversion cost (7)
Revenue is the revenue generated from the shipments the value stream accomplished in a given
period. Material cost covers the material purchased from vendors. The conversion cost covers
cost of all the resources required to produce the output and run the value stream in the same
period.
6.2.3.2 Performance Measurement “Box Score”
Lean accounting also provides alternatives to help management view their business
improvements from a different perspective. The approach provides a communication medium
that can showcase the operational and resource capacity improvements being driven by lean
implementation and their financial results. A three dimensional tool combing operational,

66
resource capacity and financial measurement developed by Maskell el al. and presented in their
book, Practical Lean Accounting, can be used as an alternate solution to counter traditional
accounting view of lean results. The tool called “Box Score” was designed to enable managers to
drive lean and showcase its operational and financial improvements comparing current state
actuals and future state expectations (Maskell et al. 2012). Table 5 below illustrates Box Score
multidimensional measurements of a value stream (Maskell et al. 2012).
Table 5 Value stream Box Score measurements
Measurement Current
State
Future
State
Change Long
term
Future
State
Change
from
current
state
Operational
Dock to dock days Days
First time through %
On-time shipment %
Floor space Sq. Ft.
Sales per person $
Resource
Capacity
Average cost per unit $
Productive %
Nonproductive %
Available %
Inventory Value $
Financial
Revenue $
Material cost $
Conversion cost $
Value stream profit $
The tool measures value stream performance under the above mentioned dimensions. Lead time
measurement such as dock to dock days, quality measurement such as first time through,
delivery such as on time shipment, floor space, sales per person and average cost of a unit in a

67
given value stream are measured under the Operational Pillar. Revenue, material cost,
conversion cost and value stream profits are measured under the Financial Pillar. A Resource
Capacity Pillar measures a value stream average cost per unit, productivity, availability and
inventory valuation.
The concept widens the perspective of managers on the lean improvements. This approach
provides them with tangible metrics that can help them showcase lean improvements using value
stream operational and simple financial indicators that are easy to present. It also exposes the
capacity gains that lean initiatives drives to help them make decisions on growing the business or
optimize the cost structure in quest for increasing profitability.
6.2.3.3 Financial Reporting
Lean accounting is an evolved managerial accounting solution to help leaders drive favorable
decisions and eliminate distortion caused by using traditional cost accounting systems. The
drastic principle shift of cost allocation, inventory valuation and value stream split can be
challenging to external auditors and stakeholders that are used to GAAP methods. More adoption
of these evolved principles will ease the acceptance of the external view. In the meantime de-
coupling the external reporting from the managerial accounting would be advisable.
6.2.3.4 Path to Lean Accounting
Lean accounting profoundly changes the conventional view of running the business. Its concepts
are logical in principle but yet revolutionary relative to the widely used traditional cost
accounting systems. Not all companies are divided by value stream, which makes it difficult to
collect the performance measurements discussed previously on the value stream level. The shift
to using a cash basis accounting relative to inventory allocation is a dramatic shift to the
conventional ways that accountants view inventory. Such dramatic shift requires an evolutionary
approach to implementation in order to ensure success and sustainability. It is recommended to
gradually transition to a lean accounting approach, taking over a year or so to completely switch
from existing financial systems (Womack and Jones 2003).

68
7.0 Comparison of the Accounting Alternatives
In this section the three aforementioned alternatives will be compared against the scenario
examples that were presented in the thesis hypotheses in Chapter 5 to evaluate and analyze the
outcome of their utilization. In quest for finding a comprehensive solution, it was essential to
ensure that the gaps observed in Chapter 5 will be addressed by the alternate managerial
accounting system that will be recommended.
7.1 Comparison Against Observed Gaps in Hypothesis 1
The first hypothesis stated that standard cost accounting drove a tendency for management to
overproduce. It was observed in Chapter 5 that traditional cost accounting rewarded
overproduction. The coming sections will analyze the alternate managerial accounting systems
behavior towards overproduction using the same scenarios used to demonstrate the traditional
cost accounting gaps in Chapter 5.
7.1.1 Line Rate Adjustment Calculation (observation demonstrated in section 5.1.1)
It was observed in section 5.1.1 that the traditional cost accounting system drove and rewarded
overproduction in all forms regardless if the work centers are producing products not aligned to
customer demand. In order to examine the alternate managerial accounting systems outcome
against such traditional cost accounting behavioral gap, the same parameters used in section
5.1.1 were analyzed.
Part A had a demand forecast of 1000 pcs over a 12 month period. The direct material cost was
$1000 / pc, variable material (packing and tools) $50 / pc, direct labor $150,000 and fixed cost
allocation of $800,000. Part A budgeted standard cost was $2000. A new assumption of Part A
selling price was introduced at $3000. In a scenario where the actual demand transpires to be 850
pcs instead of the 1000 pcs originally forecasted, the analysis below will demonstrate how each
alternate accounting system will react to the reduction in demand.

69
1. ABC
As previously mentioned activity-based allocation improved cost visibility by allocating indirect
cost to activities and in turn allocating the cost to the product based on the amount of activity
each product consumed. Let us assume that after an ABC allocation exercise, Part A activity cost
per part distributed between purchasing $300, logistics $500 and quality $200 adds up to $1000.
The new ABC standard cost inclusive of direct material, direct labor and activity cost is $2200.
Using this new assumption the impact of overproducing on profitability is simulated using ABC
costing. As illustrated in Table 6, while the revenue remains the same, overproducing150 pieces
and keeping those in inventory for the given period will reduce production cost by $330,000
resulting in a favorable profit outcome versus adjusting production to demand.
Table 6 ABC impact on overproducing
Overproduce Align production with demand
(Cut production by 150 pcs)
Beginning inventory $0 Beginning inventory $0
Direct material $1050 / pc $1,050,000 Direct material $1050 / pc $892,500
Direct labor $15 / hr $150,000 Direct labor $17.6 / hr $150,000
Activities (allocation) ex.
Acquiring Material $300 / pc
Logistics $500 / pc
Quality $200 / pc
$1,000,000 Activities (allocation) ex.
Acquiring Material $345 / pc
Logistics $575/ pc
Quality $230 / pc
$977,500
Subtotal $2,200,000 Subtotal $2,020,000
Less ending inventory ($330,000) Less ending inventory $0
Total cost of production $1,870,000 Total cost of production $2,020,000
Revenue ($3000 x 850) $2,550,000 Revenue ($3000 x 850) $2,550,000
Profit before tax $680,000 Profit before tax $530,000
ABC models assume that all costs are variable and thus reducing production output by 150
pieces will cut the equivalent cost from the product activity-allocation based on the fact that the

70
product is consuming fewer activities. However, if the resources supporting the activities were
not allocated to other products the rate per activity will go up. In Table 5 a 15% activity rate
increase was introduced to all activities due to the reduction of 15% of production. Similarly the
direct labor rate also went up assuming that the operator’s 1500 freed-up hours where not
assigned to another product.
In a scenario where all costs are perceived variable and that all freed-up capacity was
successfully allocated to other products or cut, the profitability outcome of cutting production
versus over producing was also simulated in Table 7.
Table 7 ABC impact on overproducing II
Overproduce Align production with demand
(Cut production by 150 pcs)
Beginning inventory $0 Beginning inventory $0
Direct material $1050 / pc $1,050,000 Direct material $1050 / pc $892,500
Direct labor $15 / hr $150,000 Direct labor $15 / hr $127,500
Activities (allocation) ex.
Acquiring Material $300 / pc
Logistics $500 / pc
Quality $200 / pc
$1,000,000 Activities (allocation) ex.
Acquiring Material $300 / pc
Logistics $500/ pc
Quality $200 / pc
$850,000
Subtotal $2,200,000 Subtotal $1,870,000
Less ending inventory ($330,000) Less ending inventory $0
Total cost of production $1,870,000 Total cost of production $1,870,000
Revenue = $3000 x 850 $2,550,000 Revenue ($3000 x 850) $2,550,000
Profit before tax $680,000 Profit before tax $680,000
As shown in Table 7, 100% of the variable activity-cost allocation related to the 150 pieces were
successfully reassigned or cut. Also the direct labor rate remained stable assuming that the 1500
hours of the operator capacity are now allocated to another product. The outcome of such

71
scenario revealed that both overproducing and aligning production to customer demand will
result in similar profitability expectations.
The new ABC allocation method gives management better visibility on strategic product mix and
resource allocation. However, the notion of cost allocation in inventory by default favors
inventory build-up or does not penalize as shown in the simulations above.
2. Throughput Accounting
Throughput accounting does not allocate cost to inventory. It is focused on driving throughput
and aligning system pace to the constraint. In throughput accounting, OE will remain fixed with
overhead at $800,000 + labor at $150,000 = $950,000 despite the demand reduction of 150 pcs.
As previously mentioned T is influenced by revenue and material cost. Since revenue is stable in
both decisions at 850 pieces; increasing T will require less material purchases aligning
production to customer demand.
As shown in Table 8 this simplistic financial approach will always keep the system in check. Net
profits are not favorable to overproduction as it is not yielding an effective benefit on a
company’s revenue nor operating cost.
Table 8 Throughput Accounting impact on overproduction
Overproduce Align production with demand
(Cut production by 150 pcs)
Material cost $1,050,000 $892,500
Labor $150,000 $150,000
Overhead $800,000 $800,000
Revenue = $3000 x 850 $2,550,000 $2,550,000
T = Revenue – Material cost $1,500,000 $1,657,500
OE = Overhead + Labor $950,000 $950,000
NP = T – OE $550,000 $707,500

72
The system is designed to drive management to focus on increasing profitability by driving
material cost down, increasing sales or strategically addressing operating expense.
3. Lean Accounting
Lean accounting views value stream profitability in a simplistic financial approach that also
avoids allocating cost to inventory. Lean accounting rather uses cash basis accounting for
operational expenses in the same period.
For simplicity we will assign $800,000 as the value stream cost of making Part A. With revenue
and conversion costs remaining the same for both decisions, material cost becomes the variable
driving value stream profitability. By default lean accounting will drive the decision to reduce
inventory. As shown in Table 9 aligning production with demand result in favorable value
stream profitability.
Table 9 Lean Accounting impact on overproduction
Financial Overproduce Align production with demand
Cut production by 150 pcs
Material cost $1,050,000 $892,500
Conversion cost ( value stream
overhead + labor)
$950,000 $950,000
Revenue = $3000 x 850 $2,550,000 $2,550,000
Value stream profitability $550,000 $707,500
Lean principles are focused on doing more with less. Other elements in the “Box Score” will also
highlight operational and resource capacity benefits for avoiding overproduction. For example
the dock to dock lead time measurement will favor less inventory build-up to drive speed.
Similarly, the floor space measurement will also favor fewer inventories to avoid increasing
space requirements and increasing the cost of the value stream. The system is designed to drive
decisions that will help attack waste and improve profitability.

73
7.1.2 Issuing New Work in Progress versus Rework (observation demonstrated in section 5.1.2)
It was observed in section 5.1.2 that traditional cost accounting drove operators to ignore
reworking deviated hardware and issue new material instead to accumulate standard hours. This
behavior creates waste and falsely improves perceived profitability.
The same parameters previously used in Section 5.1.2 to demonstrate such behavior were
analyzed using the alternate accounting systems. Part A and Part B customer demand is 500
pieces each for a 12 month period, direct material $1000 / pc, variable material (packing and
tools) $50 / pc, direct labor $150,000 and fixed cost allocation of $800,000. Budgeted standard
cost was $2000 for both products. The analysis below will demonstrate the behavior that each
alternate system will drive in a scenario where 50 pieces of Part A required rework.
1. ABC
The allocation of cost in inventory again swayed the decision to drive overproduction. As shown
in Table 10, if the operator issues an additional 50 pieces instead reworking the deviated parts
their profitability is shown to be favorable. This is resulting from the treatment of the 50 pieces
that will remain in inventory as assets and thus offsetting production cost.
Table 10 ABC impact on rework vs overproducing
Rework Issue new material
Direct material $1050 / pc $1,050,000 Direct material $1050 / pc $1,102,500
Direct labor $15 / hr $150,000 Direct labor $14.4 / hr $150,000
Activities (allocation) ex.
Acquiring Material $300 / pc
Logistics $500 / pc
$1,000,000 Activities (allocation) ex.
Acquiring Material $300 / pc
Logistics $500/ pc
$1,050,000

74
Quality $200 / pc Quality $200 / pc
Subtotal $2,200,000 Subtotal $2,302,500
Less ending inventory $0 Less ending inventory ($110,000)
Total cost of production $2,200,000 Total cost of production $2,192,500
Revenue = $3000 x 1000 $3,000,000 Revenue = $3000 x 1000 $3,000,000
Profit before tax $800,000 Profit before tax $807,500
Cost allocation in inventory always favors overproduction as it delays expenses to a future
period. The inventory treatment of the deviated parts droves a non-value added decision.
2. Throughput Accounting
The OE will remain fixed regardless of reworking the parts or issuing a new batch of 50 pcs.
The revenue will also remain stable since reworking or issue new material will not result in
increased or reduced customer delivery. The sales will remain the same at 1000 pcs for the given
period. However, the material cost will vary impacting T depending on the decision outcome.
Table 11 Throughput accounting impact on rework vs overproducing
Rework Issue new material
Material cost $1,050,000 $1,102,500
Labor $150,000 $150,000
Overhead $800,000 $800,000
Revenue = $3000 x 1000 $3,000,000 $3,000,000
T = Revenue – Material cost $1,950,000 $1,897,500
OE = Overhead + Labor $950,000 $950,000
NP = T – OE $1,000,000 $947,500
As shown in Table 11, throughput accounting favors reworking the parts to avoid accumulating
incremental material cost which will negatively impact T. Maximizing throughput drives

75
inventory reduction oriented decisions and thus favorably benefiting a company’s profitability
and cash flow.
3. Lean Accounting
In lean accounting view, the material cost will increase as a result of issuing more WIP to
compensate for the deviated 50 pieces. The cash basis accounting will always favor reworking
the existing WIP instead of locking the company’s cash in incremental inventory investment
given that the revenue will remain unchanged. Table 12 summarizes the value stream
profitability outcome of reworking or issuing new material to deliver customer demand.
Table 12 Lean accounting impact on rework vs overproducing
Financial Rework Issue new material
Material cost $1,050,000 $1,102,500
Conversion cost ( value stream
overhead + labor)
$950,000 $950,000
Revenue = $3000 x 1000 $3,000,000 $3,000,000
Value stream profitability $1,000,000 $947,500
Complementary to the financials shown in table 12, lean is also focused on driving root cause
corrective action to resolve the drivers behind the quality deviation. In the lean “Score Box”
operational measurements such as dock to dock lead time reduction and quality measurements
such as first time through help provide the operators with more perspective to eliminate waste
and increase value.

76
7.1.3 Conclusion of Comparisons against Gaps Observed in Hypothesis 1
It was concluded in Chapter 5 that traditional cost accounting drove overproduction. Table 13
summaries the observations gathered after analyzing the alternate accounting methods against
the gaps elaborated in hypothesis 1.
It was clear that even though ABC improved the cost distortions of traditional cost accounting;
the notion of allocating cost to inventory will always favor the system to increase inventory
build-up. Like traditional cost accounting, ABC methods also favored overproduction.
Throughput and Lean accounting financial models both successfully countered overproduction
tendencies. However, lean accounting provided a more comprehensive view with operational
and financial measurements that enhanced the understanding of overproduction impacts.
.
Table 13 Summary of alternate methods behavior to hypothesis 1
Hypothesis 1
(Overproduction) ABC
Throughput
Accounting Lean Accounting
Examples
Conclusion
Might favor
overproduction
Drives throughput
and subordinates
system to constraint
Overproduction is
# 1 waste
Example: 5.1.1
Line rate
adjustment
calculations
Allocation favors
inventory build-
up
Increasing
throughput drives
inventory
avoidance
Financial and
operational metrics
sway agents
against
overproducing
Example: 5.1.2
Issuing new
work in progress
versus rework
Allocation favors
inventory build-
up
Increasing
throughput drives
inventory
avoidance
Financial and
operational metrics
sway agents
against
overproducing and
eliminating waste

77
7.2 Comparison Against Gaps Observed in Hypothesis 2
The second hypothesis stated that standard cost accounting drove a tendency for suboptimal
investment decisions. It was observed in Chapter 5 that the cost allocation distortions of
traditional cost accounting led management to favor cycle time reductions at the expense of lead
time reduction, drive investments that led to phantom savings and drive sourcing decisions
irrelevant to total cost. In the coming section the alternate accounting systems will be analyzed
against the gaps highlighted in Chapter 5 to examine what decision outcomes they will drive.
7.2.1 Process Lead Time Reduction Unrewarded (observation demonstrated in section 5.2.1)
In section 5.2.1 it was observed that process lead time reduction was not rewarded in traditional
cost accounting. The traditional methods rather focused on one dimension only total cycle time
or (total standard processing time) reduction.
The same parameters used in section 5.2.1 were analyzed using the alternative accounting
systems. As shown in Figure 11 in Chapter 5, a lean initiative aligned CT of Work Center 1 and
Work Center 2 to 25 hours, eliminating inventory in between work centers and reducing process
lead time by 80%. In order to align the CT of both work centers the total cycle time or (total
standard processing time) increased by 5 hours during the same exercise. The analysis below will
demonstrate how each alternate system will view these lean benefits.
1. ABC
Since direct labor in ABC costing is allocated based on total cycle time, the increase in total
cycle time mentioned above will also cause a product cost increase. If the direct labor is $15 per
hour the product cost will increase by $75 due to the 5 hours cycle time increase. However, one
may argue that with the significant reduction in inventory; indirect cost such as handling and
storage will also reduce and thus reducing activity cost allocation. It is difficult to speculate
what the activity cost reduction would be as it is dependent on multiple variables.

78
As previously elaborated in Chapter 6, ABC refined the cost allocation principles improving the
cost distortions of the traditional models. Even though the cost principles has improved, the cost
allocation to inventory still provides a major issue in support of such a lean initiative. Any
sudden reduction in inventory will cause a perceived profit loss on the short term and cause
management to question the financial benefits of such initiative.
2. Throughput Accounting
The lean initiative will be favorably seen by throughout accounting. The inventory reduction will
benefit T as the system will require less material to drive sales. Also the ROI will improve due
the reduction of inventory investment.
In throughput accounting Work Center 2 would be considered the system constraint. And with
the Work Center 2 cycle reduction from 30 hours to 25 hours, the system can now increase
output and drives more sales if the customer demand requires it. This would in return improve T
and increase NP.
3. Lean Accounting
The inventory reduction will reduce the material cost driving the value stream profit to increase.
Such drastic inventory reduction will also reduce the conversion cost of the value stream. This
will be driven by the less material handling, less storage expense, reduction of floor space
required, quality benefits and less inventory damages. Also the increased throughput rate can be
used to drive higher revenues if required or invested in other system benefits.
Almost all operational measurements in the lean “Box Score” will show improvements to the
current state.

79
7.2.2 Process Cycle Reduction Phantom Savings (observation demonstrated in section 5.2.2)
It was observed in section 5.2.2 that traditional cost accounting focus on total cycle time
reduction, drove management to invest in initiatives that resulted in phantom saving. The same
parameters previously used in section 5.2.2, were analyzed to examine the alternative accounting
systems view of cycle time reduction savings.
As shown in Figure 12 in Chapter 5, in an effort to reduce total cycle time, Work Center 1 was
reduced from 15 hours to 10 hours while Work Center 2 CT remained at 30 hours. This required
a tooling investment of $10,000. This reduction of 5 hours was perceived favorably by traditional
cost accounting model. The analysis below will demonstrate how each alternate system will view
this total cycle time reduction benefits.
1. ABC
The total cycle time reduction of 5 hours will reduce the direct labor and machine allocation to
Part A. Any reduction to total cycle time will be perceived favorably as it will reduce cost
allocation and in return reduce the perceived product cost. The only way this would be true; if all
costs were variable and these 5 hours cycle time reduction resulted in equivalent 100%
production cost elimination. In reality there was no reduction in the total cost of production
resulting from cycle time reduction, however, ABC will show the initiative favorable to Part A’s
perceived cost.
2. Throughput Accounting
On the other hand, throughput accounting does not see any CT improvement for any resource
other than the critical constraint as favorable. The TOC logic is based on subordinating all
resources to the system constraint pace. Such investment will not improve T as the system will
still be constrained to Work Center 2 pace. On the contrary it will increase the OE for the given
period due to the investment in tooling and will negatively impact NP.

80
3. Lean Accounting
Similarly lean accounting will recognize such initiative as waste. The takt time will not be
influenced by such investment and as a result it will not drive any incremental revenues. On the
contrary Work Center 1 reduction in CT will increase the probability for inventory to accumulate
between work centers and thus drives more waste. Also the conversion cost of the value stream
will increase as a result of the tooling investment unfavorably impacting value stream
profitability without generating incremental revenue.
7.2.3 Outsourcing Impact Based on Line Rate Allocation (observation demonstrated in section 5.2.3)
It was observed in section 5.2.3 that making sourcing decisions using traditional cost accounting,
solely based on line rate gains did not provide the management with the complete considerations
required to make a well informed decision. Various elements were missing from the decision
making criteria that could indirectly increase costs as a result of these sourcing decisions. The
alternative accounting systems were analyzed to assess their comprehensive view of sourcing
decisions.
1. ABC
The activity-based allocation technique ensured that the indirect costs that such as purchasing,
administration, quality, logistics and planning are now allocated to each product on the basis of
activity consumption. This gives a more complete assessment of the products’ cost in making a
sourcing decision relative to the distorted allocation traditional cost accounting.
2. Throughput Accounting
Throughput accounting focus on NP and ROI provides a good balance for sourcing decisions.
With OE seen as relatively fixed, any sourcing or outsourcing decisions has to substantially
impact OE to be considered. The focus on increasing T ensures that the investments are either

81
going to increase sales velocity or reduce procured material cost. The simple financial
measurements of throughput accounting provide management with a balanced check to their
decision making.
3. Lean Accounting
Lean accounting by design covers a wide spectrum of parameters that enables management to
make a complete decision. The financial, operational and resource capacity measurements are
geared toward creating value and minimizing waste. Using the “Box Score” approach any
sourcing decision will be measured operationally against its impact on lead time, quality,
delivery, floor space, sales per person and average cost of a unit for the value stream. The
sourcing financial impact on the value stream will be evaluated against its revenue, material cost,
conversion cost and profits. Productivity, availability and inventory impact of any sourcing
decision will be also measured to assess the value stream resource capacity impact. Such
balanced approach will guide management on the cause and effect of their decisions avoiding
any misinterpretation of benefits that can yield to suboptimal results.
7.2.4 Conclusion of Comparisons against Gaps Observed in Hypothesis 2
It was concluded in Chapter 5 that traditional cost accounting drove a tendency for suboptimal
investment decisions. Table 14 summaries the observations gathered after analyzing the alternate
accounting methods against the gaps elaborated in hypothesis 2.
ABC provided an enhanced view of total cost incorporating indirect costs such as logistics,
quality and administration. The new activity based principles provided a better platform for
decision making. However, its short fall remains in the cost allocation in inventory and notion
that cost is 100% variable. Throughput accounting construct focuses decision making around the
impact on NP and ROI. This simple financial approach consistently ensured investment
effectiveness on the short term. Lean accounting three dimensional view of the value stream

82
balanced decision making to drive short term gains and focuses on long term continuous
improvement goals.
Table 14 Summary of alternate methods behavior to hypothesis 2
Hypothesis 2
(Suboptimal
Decisions)
ABC Throughput
Accounting Lean Accounting
Examples
Conclusion
Short falls result
from cost
allocation in
inventory
Drives velocity
and focuses on
ROI
Drives value
stream
profitability
Example: 5.2.1
Process cycle
reduction vs
process lead-time
reduction
Allocation of
cost in inventory
distorted the
benefits
NP and ROI favor
inventory
reduction
initiatives
The three
dimensional view
of the value
stream favors LT
reduction
Example: 5.2.2
Process cycle
reduction phantom
savings
Allocation of
labor using
standard hours
drove the wrong
conclusion
NP and ROI
constraint focus
ensures
investment
effectiveness
The three
dimensional view
of the value
stream balance
decision making
Example: 5.2.3
Outsourcing
impact based on
line rate allocation
Activity
allocation
provide better
view on total
cost
NP and ROI
ensures
investment
effectiveness
The three
dimensional view
of the value
stream balance
decision making

83
8.0 Proposed Solution
In support of designing a holistic solution to address the research findings and support the
company’s desire to overcome the current stagnation of customer on-time delivery and inventory
turnover measurements; a survey was conducted to collect feedback from the middle
management in the company’s operations and supply chain organizations. It was important to
gather their thoughts on potential solutions to complement the thesis focus on managerial
accounting
8.1 Qualitative Input
Surveys were conducted in supply chain and operations. The intent of the surveys was to
understand the pain points from middle management and understand where they feel the need to
change to make a difference in their lean journey and quest to achieve customer delight.
Eight managers from supply chain and operations were interviewed. The managers chosen
represented various functions within the supply chain management organization. Sourcing,
Vendor Management, Delivery Assurance, Capacity Management and Supplier Development
departments were all represented. The managers were asked to rate four key attributes and their
effectiveness on customer on time delivery. Lean thinking is centric around customer and as a
supply chain management organization; customer on time delivery was a simple and yet
comprehensive key performance indicator to help them reflect on their effectiveness. The four
key attributes that they rated were:
a. Current local key performance indicators
b. Current organizational structure
c. Current contracts structure
d. Current sourcing strategies

84
All of them were asked to rate each attribute from one to seven, one being least effective and
seven being most effective. They were also asked in an open ended question (What would they
fundamentally do different to help move the needle on customer on time delivery?)
Figure 15 below shows the survey findings together with the average, maximum and minimum
scores per attribute. The lowest scoring rating for was the Local KPIs”, management believed the
current local silo key performance indicator were impeding their ability to deliver on-time to
customers. The second area that required attention was the Sourcing Strategies, which scored the
second lowest rating. Managers believed that the current low cost sourcing strategies was
favoring cost to the determinant of customer delivery.
Figure 15 Survey findings
Organizational structure also scored low. Managers believed that the lack of connectivity
between departments was not conducive to delivery performance. And finally the supplier
contractual relationship was also seen as driving an unfavorable delivery performance. It was
much focused on cost and transferring risk to the supply base, as a result it did not induce the
right behavior from the suppliers.
85
Answers from the open ended question, asking managers on what would they do differently to
drive delivery performance mostly revolved around similar themes. Connectivity, driving holistic
performance indicators, driving total cost for sourcing decisions and extending the connectivity
to the selected suppliers of choice were the common recommendations written by the managers.
It is obvious from the survey results and the managers input that there is a realization the
fundamental system that drives the business needs to evolve and transform to drive customer
value and in return improve operational and financial measurements.
8.2 System Recommendations
The extensive analysis done in chapter 6 of various accounting systems alternatives and
understanding their impact on addressing the traditional cost accounting shortfalls was a key
enabler to providing a comprehensive recommendation for the company in study. The feedback
collected from the managers was also a contributor in shaping the recommendations as it
solidified the areas of focus that company needed to address to elevate its lean approach and
address its current stagnation of customer on-time delivery and inventory turnover
measurements.
8.2.1 Managerial Accounting
It is clear that the managerial accounting system is a corner stone to decision making. It
influences the day to day operations and strategic decisions in a large company where systems
are important to govern and manage the masses. The findings of this thesis proved that the
company’s current managerial accounting system is impeding its lean progress. A selection of an
alternate managerial accounting system will be critical to the company’s lean transformation.
After studying various alternatives, it was concluded that any system that allocates cost to
inventory will always favor overproduction which is anti-lean in nature. As a result ABC will not
be suitable to support the company’s lean quest. While it can be used to enhance product costing,

86
it should not be used to drive operational decisions. Throughput and lean accounting provide
simple financial measurements to guide decision making. Throughput accounting focuses on the
constraint and drives the system to improve NP and ROI through exploiting the constraint. It can
be useful to solve a linear programing issue in any facility where the demand exceeds capacity
and choices will have to be made on driving product mix.
The value stream focus of lean accounting and its complementary financial, operational and
resource capacity measurements make it the most complete managerial accounting alternative.
The three dimensional performance measurements are designed to drive lean and continuous
improvement behaviors within the various levels of the organization. The balanced view of
business performance also helps the organization showcase the benefits of lean improvements
and develop strategies to continuously expand these benefits. Its financial approach to viewing
value stream profitability as revenues net of material and conversion cost also encourages the
right lean behavior in tactical and strategic decisions. The cash basis accounting exposes
overproduction and drives velocity emphasizing management to increase revenues while
minimizing resources. Such focus will be instrumental in driving improvement in companywide
inventory turnover. Lean accounting enables the enterprise to focus on eliminating waste and
creating value.
8.2.2 Performance Measures
One of the major elements of the survey finding was the need to have key performance indicators
that drove the organization toward effectiveness. The managers were seeking different
measurement indicators that would counter silo sub-optimized thinking. Embracing lean
accounting as a managerial accounting system would be an ideal solution for the company’s
needs. It will also ensure that the value stream drive for customer value including on-time
delivery and enhance velocity improving inventory turnover.
Maskell el al presented in their book, Practical Lean Accounting, a starter set for value stream
measurement that provides a framework for managers to drive effective performance. Table 15

87
provides a summary of these measurements and an explanation of the lean behavior that they
will encourage.
Table 15 Starter set for value stream measurement
Measurement Explanation Lean behavior
Sales per
person
Productivity indicator measuring the value stream
revenue divided by the number of resources in the
value stream
Deliver more value
with less
On-time
shipment
Customer delivery indicator measuring the value
stream ability to deliver the right product on-time to
customer requirement
Delivering value on
time and pacing
system to takt time
Dock to dock
time
Velocity indicator measuring amount of inventory in
the value stream expressed in time units relative to
customer demand
Increase flow through
the value stream and
reduce inventory
First time
through
Quality indicator measuring the ability of the value
stream to deliver the product right the first time,
every time
Standard work and
root cause corrective
actions to fix any
issues
Average
product cost
Cost indicator measuring the total value stream cost
relative to the its customer output
Deliver more value
with less
Accounts
receivable days
outstanding
Cash indicator measuring the amount owed by the
value stream customers expressed in days of
shipments
Increase value stream
cash velocity
The starter set explained above would be a suitable recommendation for the company to drive a
new streamlined set of indicators that would enable effective lean value stream performance.
Sales per person will help the company assess the productivity of each value stream. This will be
a major improvement relative to the current status where all resources are pooled by function in
support of all products not providing clarity on which product consumes the most resources.
Value stream on-time shipment, shifts the mind set to one ultimate delivery performance centric
around the customer. This will counter the company’s existing departmental delivery metrics that

88
drove silo decisions. Local delivery optimization does not provide any value if the end customer
is not getting their product on time. Value stream dock to dock time will help the company’s
flow efforts and counter existing focus on cycle time reduction relative to lead time reduction.
First time through, will allow company to focus and prioritize quality improvements driving
value stream effectiveness and ultimately customer satisfaction. Average product cost will also
drive the management time to have a holistic view in driving value stream resource optimization.
This cost view will help the company gear all cost efforts to true effective initiatives and not
chase phantom savings are previously demonstrated. Accounts receivable days outstanding gives
the value stream a notion of cash flow. This will provide the company’s management a good
view on the various value streams’ contribution to the balance sheet optimization, drives a focus
on flow and on-time delivery.
8.2.3 Organizational structure
The organizational structure will be a key enabler to implement the aforementioned
improvements. The move to use lean accounting as the new managerial accounting system would
require the company to structure in value streams. Today for the most part the company is
functionally organized with various pockets of value streams in manufacturing and assembly.
The next evolution requires a companywide initiative to reorganize into value streams driving its
operations around customer value creation.
8.2.3.1 Creating value streams
Building on the existing structure the company can start their value stream efforts with the
assembly and maintenance facilities that are already structured by product type. These facilities
have a group of lines divided by product type that deliver value to the end customers. These lines
would be a good starting point to build the company’s value streams. The next step would be
linking the manufacturing facilities currently divided by component type to these value streams.
The manufacturing facilities worldwide are designated centers of excellence for a family or
families of components. These manufacturing facilities provide upstream finished components

89
input to the assembly facilities value streams. Such structural alignment would require resource
allocation, IT reporting modification and leadership hierarchy modification to enable value
stream management.
8.2.3.2 Extending the value streams
The company also manages a diverse global supply chain of partners and third party suppliers.
Extending the value streams to the supply base is a logical step of lean evolution. The success
and robustness of the external material input will be crucial to the effectiveness of the new
formed value streams structure. Also diversified supplier performance measurements that
balance delivery, quality and cost will also be important in driving a sustainable supply base that
is well aligned and integrated to the value streams lean objectives. Long term agreements and
strategic alignment should be the focus of the contractual process. Extending the value streams is
an incremental step to help the company transform to a lean enterprise.
8.2.3.3 Role of the finance organization
The financial simplification benefits of embracing lean accounting provides the finance
organization with capacity that can be invested in driving value activities. The elimination of
waste from the accounting, control and management will enable the finance community in the
company to elevate its contribution. Having finance resources work with the operations team on
lean improvements and value stream transformation strategies will help the company drive
earnings growth while providing customer value and subsequently delight.

90
9.0 Summary and conclusion
This thesis was set to drive three main objectives using practical findings from a lean
transformation study of a large North American OEM:
1. Expose the weakness of the traditionally used managerial cost accounting systems,
demonstrate their impact on decision making and accentuate the fundamental conflict
they have with lean thinking.
2. Study alternative management accounting systems and identify the most suitable
managerial accounting system that will address the deficiencies of traditional cost
accounting and enable lean transformation.
3. Provide holistic system recommendations to the aerospace OEM in support of
overcoming its current customer on-time delivery and inventory turnover stagnation.
The weakness of traditional cost accounting was clearly exposed by demonstrating how it
consistently rewarded overproduction; the number one type of waste. Examples of line rate
adjustment calculations and issuing new WIP versus rework revealed the flaws in the standard
cost allocation models that drove management to overproduce. The cost allocation distortions
impact on driving suboptimal decisions was also demonstrated in this thesis. Examples showing
how lead time reduction initiatives were unrewarded, how investments that drove phantom
savings were favored and how outsourcing solely based on line rate was imperfect; all helped
prove the fundamental conflict the traditional cost accounting systems had with lean thinking.
Empirical data also substantiated the thesis hypotheses and highlighted the need for the company
to consider changing its current managerial accounting system.
The thesis also identified that lean accounting was the best alternative to traditional cost
accounting and practically demonstrated how it addressed its proven gaps. Three alternate
managerial accounting systems; ABC, throughput and lean accounting were elaborately studied

91
in support of finding the alternate solution. The three alternative managerial accounting models
were then extensively analysed using the examples that exposed the gaps of traditional cost
accounting. The findings proved that lean accounting is the most complete alternative. While
ABC enhanced the cost allocation distortions and throughput accounting challenged the cost
allocation in inventory; lean accounting provided a comprehensive solutions with financial and
performance measurement system. The thesis demonstrated how lean accounting provided a
comprehensive approach helping management view their business performance from a
multidimensional perspective using practical tools like Box Score. In addition to the undisputed
operational and capacity benefits of lean; the thesis revealed how lean accounting provided the
framework to help showcase the financial benefits of lean improvements to the bottom line.
In addition to the managerial accounting recommendation, the thesis also provided
comprehensive solutions using qualitative input from the operations and supply chain managers.
New broad performance measures and organizational structure geared to drive value stream
effective performance and eliminate silos were recommended. These recommendations will help
the company elevate its lean level and overcome the current stagnation of on-time delivery and
inventory turnover.
The thesis contribution emphasizes the notion that driving successful lean transformation
requires a comprehensive system. It is essential to have a management system that supports and
guides the organization on strategy and day to day operational decisions that are in sync with
lean thinking. The core systems that guides decision making are mostly influenced by financial
metrics and performance measurements. The right choice of managerial accounting system is
vital in order drive the right behavior within a large company. The thesis contribution clearly
showed that the compatibility of the managerial accounting systems with the lean philosophies is
essential to enable manufacturing companies successfully implement lean. As the interest in lean
production continues to grow, more research contribution around the management systems that
supports it will continue to evolve.

92
References:
Ahlstrom, P. and Karlsson, C. (1996), Change processes towards lean production – the role of
the management accounting system, International Journal of Operations & Production
Management, Vol. 16, No. 11, pp. 42-56.
Bakke, N.A. and Hellberg, R. (1991), Relevance lost? A critical discussion of different cost
accounting principles in connection with decision making for both short and long term
production scheduling, International Journal of Production Economics, Vol. 24, pp. 1-18.
Boyd, L.H. and Cox, F.J. (2002), Optimal decision making using cost accounting information,
International Journal for Production Research, Vol. 40, No.8.
Camacho-Miano, M., Moyano-Fuentes, J. and Sacristn-Daz, M. (2013), What can we learn from
the evolution of research on lean management assessment?, International Journal of Production
Research, February, Vol.51, No.4, pp. 1098-1116.
Cooper, R. and Kaplan R. (1988), The promise and peril of integrated cost systems, Harvard
Business Review, July-August, Vol.76, No.4, pp. 109-119.
Corbett, T. (1998), Throughput Accounting, The North River Press, Great Barrington, MA.
Crowningshield, G. (1962), Cost Accounting: Principles and Managerial Application, Houghton
Mifflin, Boston, MA.
Crute, V., Ward, Y., Brown, S., Graves, A. (2003), Implementing Lean in Aerospace:
Challenging the Assumptions and Understanding the Challenges, Technovation, Vol. 23, pp.
917-928.
Duggan, K. (2002), Creating Mixed Model Value Streams: Practical Lean Techniques for
Building to Demand, Productivity Press, New York, NY.

93
Flinchbaugh, J. and Carlino, A. (2006), The Hitchhiker’s Guide to Lean: Lessons from the Road,
Society of Manufacturing Engineers, Dearborn, MI.
Goldratt, E. (1990), What is This Thing Called the Theory of Constraints and How Should It Be
Implemented?, North River Press, Great Barrington, MA.
Hino, S. (2006), Inside the Mind of Toyota: Management Principles for Enduring Growth,
Productivity Press, New York, NY.
Horngren, C., Foster, G and Datar, S. (2000), Cost Accounting: A Managerial Emphasis, 10th
edition, Prentice-Hall, Upper Saddle River, NJ.
Jones D. (2014), “What Lean Really Is” LeanUK. The Lean Enterprise Academy, September 11,
2014. Web. November 1, 2015. ‹http://www.leanuk.org›.
Johnson, H. (1991), Activity based management: past, present and future, The Engineering
Economist, Vol. 36, No.3, pp. 219-238.
Johnson, H. and Kaplan, R. (1987), Relevance Lost: The Rise and Fall of Management
Accounting, Harvard Business School Press, Boston, MA.
Kaplan, R. (1991), New systems for measurement and control, The Engineering Economist, Vol.
36, No. 3, pp. 210-218.
Kaplan, R. and Anderson, S. (2007), Time-Driven Activity-Based Costing: A Simpler and More
Powerful Path to Higher Profits, Harvard Business School Press, Boston, MA.
Kaplan, R. and Cooper, R. (1997), Cost and Effect: Using Integrated Cost Systems to Drive
Profitability and Performance, Harvard Business School Press, Boston, MA.
94
Killough, L. and Leininger W. (1984), Cost Accounting: Concepts and Techniques for
Management, West Publishing Company, New York, NY.
Lea, B.-R. and Min, H. (2003), Selection of management accounting systems in Just-In-Time
and Theory of Constraints-based manufacturing, International Journal of Production Research,
Vol. 41, No.13, pp. 2879-2910
Li, X., Sawhney, R., Arendt, E.J. and Ramasamy, K. (2012), A comparative analysis of
management accounting systems’ impact on lean implementation, International Journal
Technology Management, Vol.57, Nos. 1/2/3, pp. 33-48.
Liker J. (2004), The Toyota Way: 14 Management Principles from the World's Greatest
Manufacturer, McGraw Hill, New York, NY.
Maskell, B. (1993), Why MRPII hasn’t created world class manufacturing… where do we go
from here?, Management Accounting: Magazine for Chartered Management Accountants, Vol.
71, No. 10, pp. 48-50.
Maskell, B., Baggaley, B. and Grasso, L. (2012), Practical Lean Accounting: A Proven System
for Measuring and Managing the Lean Enterprise, CRC Press, Boca Raton, FL.
Murphy A. (2015), “2015 Global 2000: The World's Biggest Auto Companies” Forbes. Forbes,
May 6, 2015. Web. November 1, 2015. ‹http://www.forbes.com›.
N.p. (2015), “What is Lean?” Lean. Lean Enterprise Institute, n.d. Web. November 1, 2015.
‹http://www.lean.org›.
Northrup, C. (2004), Dynamics of Profit-Focused Accounting: Attaining Sustained Value and
Bottom-Line Improvement, J. Ross Publishing, Boca Raton, FL.

95
O’Guin, M. (1991), The Complete Guide to Activity-Based Costing, Prentice-Hall, Upper Saddle
River, NJ.
Ohno, T. (1988), Toyota Production System: Beyond Large Scale Production, Productivity Press,
New York, NY.
Spencer, M. (1994), Economic theory, cost accounting and theory of constraints: an examination
of relationships and problems, International Journal of Production Research, Vol. 32, pp. 299-
308.
Srikanth, M. and Robertson, S. (1995), Measurements for Effective Decision Making: A Guide
for Manufacturing Companies, The Spectrum Publishing Company, Wallingford, CT.
Warren, C. (2001), Survey of Accounting, South-Western College Publishing, Cincinnati, OH.
Womack, J., Jones, D. and Roos, D. (1991), The Machine that Changed the World: The Story of
Lean Production, Harper Collins, New York, NY.
Womack, J. and Jones, D. (2003), Lean Thinking: Banish Waste and Create Wealth in your
Corporation, Free Press, New York, NY.