Importance of Developing Fluorocarbons Emissions Inventory ...
25
Importance of Developing Fluorocarbons Emissions Inventory in Asia and Emissions Mitigation Analysis Tatsuya HANAOKA Integrated Environment and Economy Section Center for Social and Environmental Systems Research National Institute for Environmental Studies 0 The 15 th Workshop on GHG Inventory in Asia (WGIA15) Nay Pyi Taw, Myanmar July 11 – 14, 2017
Transcript of Importance of Developing Fluorocarbons Emissions Inventory ...

Importance of DevelopingFluorocarbons Emissions Inventory in Asia
and Emissions Mitigation Analysis
Tatsuya HANAOKA
Integrated Environment and Economy SectionCenter for Social and Environmental Systems Research
National Institute for Environmental Studies
0
The 15th Workshop on GHG Inventory in Asia (WGIA15)Nay Pyi Taw, Myanmar
July 11 – 14, 2017

Types of Fluorocarbons
1
Ozone Depleting Substance Greenhouse Gas
CFCs(ChloroFluoroCarbons) ✔
✔
HCFCs (HydroChloroFluoroCarbons)
✔ ✔
HFCs(HydroFluoroCarbons)
✔
PFCs (PerFluoroCarbons)
✔
SF6(Sulfur Hexafluoride)
✔
NF3(Nitrogen Trifluoride) ✔
Today’s Topic

Fluorocarbons‐ Ideal Characteristics and Various Applications ‐
2
☆ Colorless, transparent, odorless gas or liquid☆ Chemically stable, hard for chemical decomposition☆ Thermally stable, hard for thermal decomposition☆ No corrosive property☆ Incombustible property, no flame and no explotion☆ Very less toxicity☆ Volatile property, easy to evaporate☆ Liquescent property, easy to liquefy with additional pressure
In 1928, Midgley successfully synthesized CFC‐12 and CFC‐11
Refrigerant Thermal insulation foam
Open foam Solvent Aerosol
propellant
Used for various purposes as ideal artificial chemical product

Fluorocarbons Environmental Impacts‐ Global Warming Potentials ‐
3
Example)1 kg HCFC‐22 refrigerant emission = 1810 kg CO2 eq emission

+ + +
Average HCFC‐22 refrigerant charged per household air conditioner is about 1000 g/device= CO2 equivalent emission per device without any recovery is 1.81 t‐CO2 eq/device
Why & How Important of Recovery and Decomposition
4
CO2 emissions per capita in FY2015 in Japan = 9.64 tCO2Source: National GHG Inventory Report of Japan 2017
CO2 emissions per household in FY2015 = 4.92 tCO2 Equivalent to 1 household
Average HFC‐134a refrigerant charged per refrigeration is about 125‐150g/device = 0.18‐0.21 t‐CO2eq + Averaged HCFC‐22 refrigerant charged per air conditioner is about 1000g/device = 1.18 t‐CO2eq + Average HFC‐134a refrigerant charged per car air‐conditioner is about 500‐700g/device = 0.72‐1.00 t‐CO2eq
= Around 4.5~4.8 tCO2 eq
Note) examples of CO2 equivalent emissions calculations when there is no recovery measure for fluorocarbons
Source: calculated based on the GHG Emissions Data of Japan by GHG Inventory Office, Japan
=
Equivalent to 5 devices
+ + + + around 9~10 tCO2 eq

Why & How Important of Recovery and Decomposition
5
tCO2/popIndia 1.32Indonesia 1.59Viet Nam 1.42
Energy‐related CO2 emissions per capita in 2010
tCO2/popThailand 3.36
tCO2/pop
China 5.41
Note) Calculated by author, using IEA (2016) World CO2 emissions from Fuel Combustion and UN World Population Prospects: The 2012 Revision. If you use the national inventory, the exact value should be different, but the scale of its value should be similar.
< = around 4 tCO2 eq+HCFC‐22
< = around 6 tCO2 eq+ +HCFC‐22
tCO2/popMyanmar 0.15
= around 2 tCO2 eqHCFC‐22
<
< =around 0.2 tCO2 eq
HCF‐134a

UNEP (2015) The Emission Gap ReportEmissions Pathways are in line with the 2℃ target under the Paris Agreement?
6Source) UNEP (2015), FigureES1, Figure ES2http://uneplive.unep.org/media/docs/theme/13/EGR_2015_ES_English_Embargoed.pdf
Without enhanced ambition, the likely global average temperature increase will be in the range of <3.0 ‐ 3.5℃ by the end of the century
INDCs emission levels are 4 ‐ 6 GtCO2eq lower than the current policy trajectory in 2030 However, emission gaps between INDCs and 2℃ pathways are 12 Gt - 14 Gt CO2eq in 2030.
Around halving emissions by 2050 relative to 2010(equivalent to achieving around 2 tCO2eq per capita)
Necessary to fill the gapby reducing not only CO2but also all GHGs including CFCs, HCFCs, HFCs, etc.

IPCC AR5 WG3 (2014)Chapter 6: Assessing Transformation Pathways
7
Without more mitigation, global mean surface temperature might increase by 3.7 – 4.8℃ by 2100. To stay below 2℃, the range of GHG emissions are roughly between 30‐50 Gt CO2eq in 2030. To stay below 2℃, 41–72% reductions by 2050 compared to the 2010 level are required.
Different colors show different categories which achieve the same CO2-eq concentration at the point in 2100
Corresponding to 2 ℃
Reaching to ZERO emission in the end of the century
41%~72%reduction
Relative to 2010
20502010
Source) IPCC AR5 WG3 (2014), Figure SPM.4

Fluorocarbon Emissions will Offset CO2 Reduction Efforts
8Note: Reduction effects were approximately estimated by using information based on the Energy Conservation Center, Japan, and National GHG Inventory Report of Japan 2017. Reduction effects will vary depending on preconditions.
Energy related CO2 emissions per household (FY2015) in Japan: 4.92 t CO2 per household
Eco-friendly lifestyle
Super thermal insulated house (e.g. double-glazed window, high heat insulated material)
Solar PV
Rooftop greening
Solar water heater
High-efficient hot water heater (e.g. fuel cell, heat pump)
High efficient air-conditioner
LED lighting
High efficient vehicle
Replacement with high-efficient devices : around 0.1 – 1 tCO2 reduction
With mitigation measures and investments, CO2 emissions per household can be reduced by around half (i.e. reduction amounts are around 2.0 ‐3.0 tCO2 per household)
Implementation of eco-friendly lifestyle : around 0.1 – 1 tCO2 reduction
Introduction of renewable energy : more than 1 tCO2 reductionImprovement of infrastructure : around 0.1 – 1 tCO2 reduction
If you don’t recover and decompose fluorocarbons and emit all fluorocarbons from one air conditioner, refrigeration and car air conditioner, it is equivalent to 2.5 – 3.0 tCO2eq emission
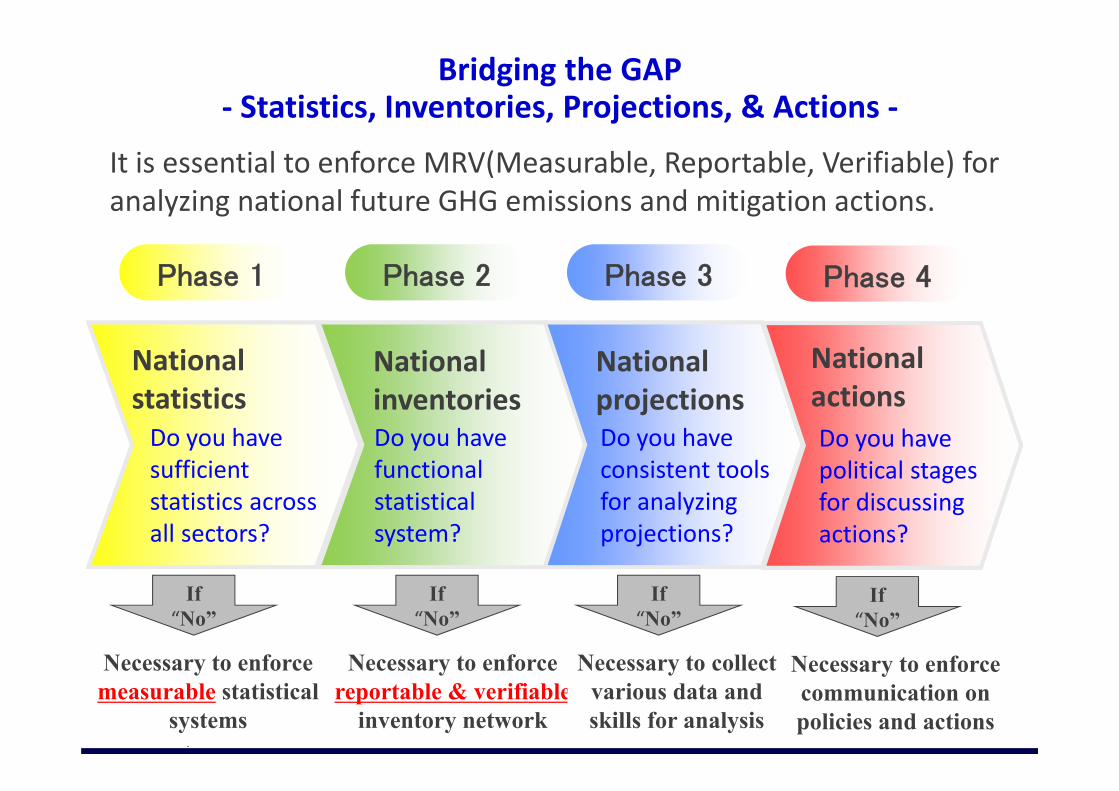
Bridging the GAP ‐ Statistics, Inventories, Projections, & Actions ‐
9
Phase 1
National statisticsDo you have sufficient statistics across all sectors?
If “No”
Necessary to enforcemeasurable statistical
systems
Phase 2
National inventoriesDo you have functional statistical system?
If “No”
Necessary to enforce reportable & verifiable
inventory network
Phase 3
National projectionsDo you have consistent tools for analyzing projections?
If “No”
Necessary to collect various data and skills for analysis
Phase 4
Do you have political stages for discussing actions?
If “No”
Necessary to enforcecommunication onpolicies and actions
National actions
It is essential to enforce MRV(Measurable, Reportable, Verifiable) for analyzing national future GHG emissions and mitigation actions.

1. It is necessary to collect statistics on the number of devices & products which use & consume CFCs, HCFCs, HFCs, PFCs, SF6, NF3. Refrigerator for household use, and for commercial use. Air conditioner for house (separate‐type, single‐packaged‐type) Air conditioner for motor vehicle (car, truck, bus) Central air conditioning equipment for building Condensing unit Refrigerating unit for transportation Refrigerating display showcase and so on
2. It is necessary to collect data on “average charged (consumed) amount per device & product” and “type of fluorocarbon gases per device & product” based on market survey and statistics.e.g.) 500 – 700 g of HFC‐134a refrigerant are charged in a car air conditioner
1000g of HCFC‐22 refrigerant are charged in a room air conditioner.
3. It is also significantly beneficial to collect statistics on import, export, production, consumption of CFCs, HCFCs, HFCs, PFCs, SF6, NF3.
How to Estimate Fluorocarbons Emissions‐ Step1: Collecting Statistics and Aggregating Data ‐
10

How to Estimate Fluorocarbons Emissions‐ Step2: Methodologies for Estimating Emissions Inventory ‐
11
1. Bottom‐up approachWe estimate emissions by micro statistical data such as number of devices containing fluorocarbons, average consumed amount per device, leakage rate, recovery rate, etc.
e.g. ) total emission in refrigerator =total refrigerant contained at production ×fugitive refrigerant ratio at product
+ Σ(number of operated devices ×refrigerant contained per device ×fugitive ratio from use)+ Σ(number of disposed devices ×refrigerant contained per device)– recovered amount of refrigerant
2. Top‐down approachWe estimate emissions by macro statistical data such as production, consumption, import, export, average share of service type, average lifetime distribution of service type, etc.
e.g.) total consumption in refrigerator = (production + import – export ) × share of refrigerator use in all refrigerants
total emission in refrigerator =total consumption in refrigerator × lifetime distribution of refrigerator for disposal
– recovered amount of refrigerant

How to Estimate Fluorocarbons Emissions‐ Step3: Estimating Future Emissions using Bottom‐up Approach‐
12
Overview of how to estimate end‐of‐life products (=dispose of used products) by using Population Balance Model
Methodology Overview Required variable for future scenario
Multi regressionmodel
Using historical correlation between objective variable and basic socio‐economic variable.
GDP, POP, per capita GDP
Lifetime model Using historical correlation between number of sales by device and lifetime duration by device.
Sales numbers by device.lifetime duration by device.
Population balancemodel
Using historical correlation between number of stocks by device and lifetime duration by device.
Stock (in‐use) numbers by device.Lifetime duration by device.
Source) Oguchi M., Terazono A., Hanaoka T. (2017) Estimating the potential amount of fluorocarbons in end‐of‐life products generated in Asian developing countries, 2017 Joint Conference ISIE and ISSST.

0%
50%
100%
1990
1992
1994
1996
1998
2000
2002
2004
2006
2008
2010
2012
2014
2016
2018
2020
2022
2024
2026
2028
2030
2032
2034
2036
2038
2040
2042
2044
2046
2048
2050
0%
50%
100%
1990
1992
1994
1996
1998
2000
2002
2004
2006
2008
2010
2012
2014
2016
2018
2020
2022
2024
2026
2028
2030
2032
2034
2036
2038
2040
2042
2044
2046
2048
2050
0%
50%
100%
1990
1992
1994
1996
1998
2000
2002
2004
2006
2008
2010
2012
2014
2016
2018
2020
2022
2024
2026
2028
2030
2032
2034
2036
2038
2040
2042
2044
2046
2048
2050
How to Estimate Fluorocarbons Emissions‐ Step4: Assumptions and Scenarios Settings‐
13
HCFC22
R410A
HFC32
China
Thailand
India
It is necessary to set the following assumptions based on market survey and statistics.1. Average amount of charged (consumed) refrigerant per device & product
e.g.) 1000g refrigerant per room air conditioner. 500 – 700 g refrigerant per car air conditioner2. Transitions of refrigerant type in the sales, in the past and the future
e.g.) HCFC22, R410A, HFC32 in room air conditioner. HFC134a in car air conditioner conditioner3. Transitions of share of refrigerant type in the sales, in the past and the future (based on
expert interviews and Kigali Amendment etc)
Example overview of transitions of types & shares in the sales of refrigerant in room air conditioner
Source) Oguchi M., Terazono A., Hanaoka T. (2017) Estimating the potential amount of fluorocarbons in end‐of‐life products generated in Asian developing countries, 2017 Joint Conference ISIE and ISSST.
China Gov. plans to use R290 (i.e. propane) rather than HFC32. If so, the scenario in this study needs to be modified.

How to Estimate Fluorocarbons Emissions‐ Step5: Emission Estimation Analysis‐
14
0102030405060708090
100
2015
2016
2017
2018
2019
2020
2021
2022
2023
2024
2025
2026
2027
2028
2029
2030
disposed
regrigeran
t (kton
)
China
R32 R410A R22
0123456789
10
2015
2016
2017
2018
2019
2020
2021
2022
2023
2024
2025
2026
2027
2028
2029
2030
disposed
regrigeran
t (kton
)
India
R32 R410A R22
0
0.5
1
1.5
2
2.5
3
2015
2016
2017
2018
2019
2020
2021
2022
2023
2024
2025
2026
2027
2028
2029
2030
disposed
refrigeran
ts (kton
)
Thailand
R32 R410A R22
0
2
4
6
8
1020
1520
1620
1720
1820
1920
2020
2120
2220
2320
2420
2520
2620
2720
2820
2920
30
disposed
refrig
eran
t (MtCO2e
q)
India
R32 R410A R22
0
1
2
3
4
2015
2016
2017
2018
2019
2020
2021
2022
2023
2024
2025
2026
2027
2028
2029
2030
disposed
refrig
eran
ts (MtCO2e
q)
Thailand
R32 R410A R22
① Example emission projections of disposed refrigerants from room air conditioners (k ton)
➁ Example emission projections of disposed refrigerants from room air conditioners (Mt CO2 eq)
After analyzing emissions by device and by fluorocarbon, we can find detailed characteristics. Necessary to analyze the trend in the unit of CO2 eq as well as ton of refrigerant. HCFC‐22 is still large in the near term, thus necessary to recover HCFCs as well as HFCs.
0
25
50
75
100
125
150
2015
2016
2017
2018
2019
2020
2021
2022
2023
2024
2025
2026
2027
2028
2029
2030
disposed
refrig
eran
ts (MtCO2e
q)
China
R32 R410A R22
Source) Oguchi M., Terazono A., Hanaoka T. (2017) Estimating the potential amount of fluorocarbons in end‐of‐life products generated in Asian developing countries, 2017 Joint Conference ISIE and ISSST.

How to Analyze Mitigation Measures‐ Step1: Collecting Information on Mitigation Measures ‐
15
Leakage measures
Recovery measures Decomposition measuresPortablerecovery device
Portable reclaimingdevice
Portable tank
[Mixed combustion furnace]1. Cement kiln (i.e. mixing with cement production process)2. Rotary kiln(i.e. mixing with waste incineration process)
[Single purpose furnace]3. Submerged combustion method4. Superheated steam reaction method5. Catalytic method6. Plasma method
Small size plasma arc device
Collecting data about initial cost, O&M cost, reduction efficiency, etc in each measures
Note) Photos taken by author when visiting ASADA corporation

How to Analyze Mitigation Measures‐ Step2: Variety of Future Scenarios ‐
16
Depending on purposes of analyses, it is better to set wide range of future scenarios, for example, the worst case, the best case, middle of the road case, etc.
As for fluorocarbon mitigations, there is no recovery and decomposition in Asian developing countries yet, thus it is better to differentiate scenarios of “domestic measures only by international technology cooperation” and “domestic measures mixing with cooperation of overseas transportation of fluorocarbon wastes”.
16
Example of recovery & decomposition scenarios about room air conditioners in Asia Scenario name Scenario description
BaU Emissions without any measures (i.e. no recovery and decomposition)
RD Recover the amount of fluorocarbons up to the capacity level of existing decomposition facilities (such as cement kiln, rotary kiln)
RD‐Max‐domestic Recover fluorocarbons at a maximum and decompose fluorocarbon waste by the existing facilities (such as cement kiln, rotary kiln). In addition, in order to deal with all fluorocarbon waste within its country independently, decomposition facilities are newly installed by international technology cooperation.
RD‐Max‐Abroad Recover fluorocarbons at a maximum and decompose fluorocarbon waste by the existing facilities (such as cement kiln, rotary kiln). If the capacity level of existing decomposition facilities are not enough, remaining fluorocarbon wastes are transported by ship to Japan and decomposed by using Japanese facilities.

How to Analyze Mitigation Measures‐ Step3: Mitigation Potentials and Mitigation Cost Analyses ‐
17
Costs of mitigating fluorocarbons are estimated around 100 – 1300 JPN yen/tCO2eq (equivalent to around 1‐13 US$/tCO2eq) in 2030 in developing countries. Compared to costs of achieving the 2℃ target, costs of recovery & decomposition are cost competitive.
Costs of CO2 mitigation for achieving the 2℃ target are around 50‐100US$/tCO2 by 2030 at least. (Source: Carbon Pricing Leadership Coalition (2017) Report of the High‐Level Commissions on Carbon Prices)
0.0
20.0
40.0
60.0
80.0
100.0
120.0
140.0
160.0
2015
2016
2017
2018
2019
2020
2021
2022
2023
2024
2025
2026
2027
2028
2029
2030
Dispo
sed refregira
nt(MtCO2e
q)
HCFC22(Emission) R410A(Emission) HFC32(Emission)
HCFC22(Recovered) R410A(Recovered) HFC32(Recovered)
0
200
400
600
800
1000
1200
1400
0.0
10.0
20.0
30.0
40.0
50.0
60.0
70.0
2018
2019
2020
2021
2022
2023
2024
2025
2026
2027
2028
2029
2030
Recovered & De
compo
sed c
ost
(JPN
Yen/tCO2
eq)
Recovered & De
compo
sed a
mou
t(M
tCO2
eq)
HCFC22(Recovered) R410A(Recovered) HFC32(Recovered)
HCFC22(Mitigation cost) R410A(Mitigation cost) HFC32(Mitigation cost)
0
200
400
600
800
1000
1200
1400
0.0
10.0
20.0
30.0
40.0
50.0
60.0
70.0
2018
2019
2020
2021
2022
2023
2024
2025
2026
2027
2028
2029
2030
Recovered & De
compo
sed cost
(JPN
Yen/tCO2
eq)
Recovered & De
compo
sed am
out
(MtCO2
eq)
HCFC22(Recovered) R410A(Recovered) HFC32(Recovered)
HCFC22(Mitigation cost) R410A(Mitigation cost) HFC32(Mitigation cost)
Example of recovery & decomposition of refrigerants from room air conditioners in China
RD‐Max‐domesticscenario
RD‐Max‐abroadscenario
Source) Oguchi M., Terazono A., Hanaoka T. (2017) Estimating the potential amount of fluorocarbons in end‐of‐life products generated in Asian developing countries, 2017 Joint Conference ISIE and ISSST.
Summary
18
1. To achieve the 2 ℃ target under the Paris Agreement at COP21, it is necessary to reduce all GHGs (not only the Kyoto Baskets of CO2, CH4, N2O, HFCs, PFCs, SF6, NF3 but also other GHGs such as CFCs, HCFCs)
2. Fluorocarbon emissions will offset CO2 reduction efforts.It is necessary to recover and decompose fluorocarbon emissions.
3. Even if implementing Kigali Amendment, there are still large amount of emissions of CFCs and HCFCs in Asian developing countries. Thus, it is important to take measures on recovery and decomposition of CFCs, HCFCs as well as HFCs.
4. Costs of fluorocarbon mitigation measures are more cost competitive than costs of CO2 mitigation measures to achieve the 2℃ target.
Acknowledgement:This research was supported by the Environment Research and Technology Development Fund (3K143010) of the Ministry of the Environment, Japan

Appendix
19

Global Warming Potentials‐ major fluorinated GHGs in the time horizon of 100 years ‐
20
Gas ODP GWP(SAR)
GWP(AR4)
GWP(AR5) Major sectors
CFC
CFC-11 1.0 4000 4750 4660 Closed foam, Open foam, Aerosols, etc
CFC-12 1.0 8500 10900 10200 Refrigerant (automobile air-conditioning, refrigeration etc)
CFC-113 0.8 5000 6130 5820 Solvent (Electronic component, dry-cleaning etc)
CFC-114 0.8 9300 10000 8590 Open foam
HCFC
HCFC-22 0.055 1700 1810 1760 Refrigerant (room air-conditioning, commercial refrigeration etc)
HCFC-141b 0.11 630 725 782 Closed foam, Open foam, Solvent(Electronic component), etc
HCFC-142b 0.065 2000 2310 1980 Open foam
HFC
HFC-23 0 11700 14800 12400 By-product of HCFC-22 production
HFC-134a 0 1300 1430 1300 Refrigerant (automobile air-conditioning, refrigeration etc)
HFC-152a 0 140 124 138 Aerosols
HFC-32 0 650 675 677 Refrigerant (room air-conditioning, etc)
PFCCF4 0 6500 7390 6630 AL production, Semiconductor Manufacturing, etc
C2F6 0 9200 12200 11100 AL production, Semiconductor Manufacturing, etc
SF6 SF6 0 23900 22800 23500 Semiconductor Manufacturing, Electric Utilities, etc
NF3 NF3 0 ― 17200 16100 Semiconductor Manufacturing, Electric Utilities, etc
Note1) Previously, GWP values in the time horizon of 100 years in the IPCC SAR have been used for GHGs national inventory reports under UNFCCC, because of the stipulation in the Kyoto Protocol.
Note2) The new official decision was made by the COP19 under the UNFCCC in 2013 that all countries need to use the GWP values in the time horizon of 100 years reported in the IPCC AR4 used for GHGs national inventory reports from 2015

Global Historical CFCs, HCFCs, HFCs Productions Trends‐ effects of regulations and policies ‐
21
Regulations on productions under the Montreal Protocol was, in a sense, successful internationally. However, the another issue is about emissions of “banked fluorocarbons” in various devices at the time of disposal.
Source) Calculated by author based on AFEAS database. Energy‐related CO2 emissions are based on IEA
Using GWPs in the time horizon of 100 years in IPCC SAR
0
1
2
3
4
5
6
719
30
1935
1940
1945
1950
1955
1960
1965
1970
1975
1980
1985
1990
1995
2000
2005
2010
フロ
ン類
の生
産量
(Gt‐CO
2) HFCsHCFCsCFCs
Invention
Finding on Ozone Depletion Mechanism
First observation of Ozone Depletion Montreal Protocol
KyotoProtocol
Note) AFEAS provided data on production and consumption, thus many researchers used this database. However, this figure under‐estimated production amounts due to data availability; for example, 1) AFEAS included data only from AFEAS member countries, thus data from China, Russia, India etc were excluded, 2) AFEAS did not report all type of fluorocarbons.
Prod
uctio
n (Gt‐CO
2eq
)
0%5%10%15%20%25%30%35%40%45%50%
Ratio relative to CO2 emissions
エネ
ルギ
ー起
源CO
2排出
量と
の比
較(19
90年
比%
)Co
mpa
red to ene
rgy‐related
Globa
l CO2Em
issions
(% re
lativ
e to 199
0 level)

0%
5%
10%
15%
20%
25%
30%
35%
40%
0123456789
1019
30
1940
1950
1960
1970
1980
1990
2000
2010
エネ
ルギ
ー起
源CO
2排出
量
との
比較
(199
0年比%)
フロ
ン類
の生
産量
(Gt‐CO
2eq)
HFCsHCFCsCFCsCO2排出量比
Compa
red to ene
rgy‐related
Globa
l CO2Em
issions
(% re
lativ
e to 199
0 level)
Global Historical CFCs, HCFCs, HFCs Productions Trends‐ Comparison between IPCC SAR GWP and IPCC AR4 GWP ‐
22
Using GWPs in IPCC SAR
Prod
uctio
n (Gt‐CO
2eq
)
Ratio relative to CO2 emissions
Using GWPs in IPCC AR4
0%
5%
10%
15%
20%
25%
30%
35%
40%
0123456789
10
1930
1940
1950
1960
1970
1980
1990
2000
2010
エネ
ルギ
ー起
源CO
2排出
量
との
比較
(199
0年比%)
フロ
ン類
の生
産量
(Gt‐CO
2eq)
Around 1.5GtCO2eq
Compa
red to ene
rgy‐related
Globa
l CO2Em
issions
(% re
lativ
e to 199
0 level)
Note)CO2 emission in Japan in 1990 was 1.16 GtCO2
Source) Calculated by author based on AFEAS database. Energy‐related CO2 emissions are based on IEA
Note) AFEAS provided data on production and consumption, thus many researchers used this database. However, this figure under‐estimated production amounts due to data availability; for example, 1) AFEAS included data only from AFEAS member countries, thus data from China, Russia, India etc were excluded, 2) AFEAS did not report all type of fluorocarbons.

Example of Previous Study‐ Future Emissions Projections of Fluorocarbons ‐
23
Source) Velders et al. [2009], PNAS
Upper left : in the unit of metric tonUpper right: in the unit of ODP tonLower right: in the unit of CO2 ton
We need to carefully discuss about effects of Kigali Amendment on future HFCs emissions projections

Asia-Pacific Integrated Modelhttp://www-iam.nies.go.jp/aim/index.html
ご清聴ありがとうございましたThank you for your attention