IMPLICATIONS OF NEW PERSPECTIVES ON GROWTH AND YIELD …
11
IMPLICATIONS OF NEW PERSPECTIVES ON GROWTH AND YIELD MODELS Robert G. Haight ABSTRACT The New Perspectives program of the National Forest System emphasizes the management of forest ecosystems for qualities and outputs other than timber. Applying New Perspectives to stand management, silviculturists are for- mulating ranges of stand attributes that are associated with desired ecosystem qualities. The problem is to define a management regime that will attain the desired conditions over time. This paper describes how growth and yield models may be used to determine the feasibility of the de- sired stand attributes, estimate the present value or volume maximizing management regime from the set of feasible re- gimes, and estimate the costs of attaining the desired con- ditions. Results are presented for four mixed-conifer stands in the Northern Rocky Mountains with three possible land use designations: timber production, timber production in visually sensitive areas, and timber production in white- tailed deer winter habitat. For each land use, stand den- sity targets are expressed as a simple function relating both the minimum and maximum numbers of trees per acre to the quadratic mean diameter of the stand. Growth and yield is forecast with the Stand Prognosis Model. Re- sults show that significant reductions in present value and volume production may result from meeting stand density targets. In addition, the solution algorithm quickly finds infeasible targets (e.g., the targets associated with wildlife management proved to be infeasible for all four test stands). Because the solution algorithm provides near-feasible solu- tions, it is easy to identify specific targets that need to be relaxed to obtain feasibility. Thus, the results from the so- lution algorithm can be used to quantify the costs associ- ated with meeting the nontimber management goals. INTRODUCTION In response to changes in values that people have for lands and resources of the National Forest System, the Forest Service has initiated a New Perspective for Manag- ing the National Forest System (Kessler 1991). During the past four decades, the Forest Service embraced a model for National Forest management that focused on quantities of extracted forest products and services (e.g., Paper presented at the National Silviculture Workshop, Cedar City, UT, May 6-9, 1991. Robert G. Haight, North Central Forest Experiment Station, Forest Service, U.S. Department of Agriculture, 1992 Folwell Ave., St. Paul, MN 55108. This paper is based on a study of optimal harvesting with stand density targets (Haight and others 1991), which was conducted while the, senior author was with the Southeastern Forest Experiment Station. 62 board feet of timber, recreation user days, pounds offish). The general public was asked to respond to tradeoffs be- tween outputs produced under different management alternatives. Through the planning process, managers learned that people are interested not only in extracted products and services, but also in the onsite condition of the ecosystem that provides these goods. The condition of the ecosystem may include qualities such as beauty and wildness in addition to attributes such as biological diver- sity and health. Thus, the New Perspectives program em- phasizes forest management alternatives that sustain the diversity of on site values of ecosystems. A sustained yield of extracted outputs should be provided as a byproduct of sound ecosystem management. The New Perspectives program is having an immediate impact on silvicultural prescriptions and the use of growth and yield models. Applying New Perspectives to stand management, silviculturists are formulating ranges of stand densities that are associated with desired forest outputs and onsite ecosystem values (e.g., Chew 1989). These stand densities are used as targets to reach over time. The problem is to determine management regimes that satisfy these targets. This paper describes the use of a stand simulator and optimization program that not only determine the feasibility of such stand density targets but also the optimal harvest regimes for reaching them. The cost of attaining the targets is obtained by comparison to the associated unconstrained optimal regime. (The prob- lem formulation and computer program are described by Haight and others 1991.) , In addition to influencing the way in which growth and yield models are used, the' New Perspectives program has identified several growth and yield research needs. These needs are noted here in passing; the body of the paper fo- cuses on how growth and yield models may be used to evaluate desired stand conditions. Most stand simulators in the Western United States are of the single-tree type, and they provide great flexibility in the range of species, tree sizes, and management pre- scriptions that may be simulated. However, due to the restricted range of data used to construct the component models (e.g., young, even-age, conifer stands) and the in- creasing demand for management prescriptions that re- store and maintain stands outside this range (e.g., stands with old-growth characteristics), new models of the follow- ing processes need to be incorporated into single-tree simulators: • old tree growth and mortality, • dead tree dynamics, • dead branch and litter accumulation, • natural regeneration, This file was created by scanning the printed publication. Errors identified by the software have been corrected; however, some errors may remain.
Transcript of IMPLICATIONS OF NEW PERSPECTIVES ON GROWTH AND YIELD …

IMPLICATIONS OF NEW PERSPECTIVES ON GROWTH AND YIELD MODELS
Robert G. Haight
ABSTRACT
The New Perspectives program of the National Forest System emphasizes the management of forest ecosystems for qualities and outputs other than timber. Applying New Perspectives to stand management, silviculturists are formulating ranges of stand attributes that are associated with desired ecosystem qualities. The problem is to define a management regime that will attain the desired conditions over time. This paper describes how growth and yield models may be used to determine the feasibility of the desired stand attributes, estimate the present value or volume maximizing management regime from the set of feasible regimes, and estimate the costs of attaining the desired conditions. Results are presented for four mixed-conifer stands in the Northern Rocky Mountains with three possible land use designations: timber production, timber production in visually sensitive areas, and timber production in whitetailed deer winter habitat. For each land use, stand density targets are expressed as a simple function relating both the minimum and maximum numbers of trees per acre to the quadratic mean diameter of the stand. Growth and yield is forecast with the Stand Prognosis Model. Results show that significant reductions in present value and volume production may result from meeting stand density targets. In addition, the solution algorithm quickly finds infeasible targets (e.g., the targets associated with wildlife management proved to be infeasible for all four test stands). Because the solution algorithm provides near-feasible solutions, it is easy to identify specific targets that need to be relaxed to obtain feasibility. Thus, the results from the solution algorithm can be used to quantify the costs associated with meeting the nontimber management goals.
INTRODUCTION
In response to changes in values that people have for lands and resources of the National Forest System, the Forest Service has initiated a New Perspective for Managing the National Forest System (Kessler 1991). During the past four decades, the Forest Service embraced a model for National Forest management that focused on quantities of extracted forest products and services (e.g.,
Paper presented at the National Silviculture Workshop, Cedar City, UT, May 6-9, 1991.
Robert G. Haight, North Central Forest Experiment Station, Forest Service, U.S. Department of Agriculture, 1992 Folwell Ave., St. Paul, MN 55108. This paper is based on a study of optimal harvesting with stand density targets (Haight and others 1991), which was conducted while the, senior author was with the Southeastern Forest Experiment Station.
62
board feet of timber, recreation user days, pounds offish). The general public was asked to respond to tradeoffs between outputs produced under different management alternatives. Through the planning process, managers learned that people are interested not only in extracted products and services, but also in the onsite condition of the ecosystem that provides these goods. The condition of the ecosystem may include qualities such as beauty and wildness in addition to attributes such as biological diversity and health. Thus, the New Perspectives program emphasizes forest management alternatives that sustain the diversity of on site values of ecosystems. A sustained yield of extracted outputs should be provided as a byproduct of sound ecosystem management.
The New Perspectives program is having an immediate impact on silvicultural prescriptions and the use of growth and yield models. Applying New Perspectives to stand management, silviculturists are formulating ranges of stand densities that are associated with desired forest outputs and onsite ecosystem values (e.g., Chew 1989). These stand densities are used as targets to reach over time. The problem is to determine management regimes that satisfy these targets. This paper describes the use of a stand simulator and optimization program that not only determine the feasibility of such stand density targets but also the optimal harvest regimes for reaching them. The cost of attaining the targets is obtained by comparison to the associated unconstrained optimal regime. (The problem formulation and computer program are described by Haight and others 1991.) , In addition to influencing the way in which growth and yield models are used, the' New Perspectives program has identified several growth and yield research needs. These needs are noted here in passing; the body of the paper focuses on how growth and yield models may be used to evaluate desired stand conditions.
Most stand simulators in the Western United States are of the single-tree type, and they provide great flexibility in the range of species, tree sizes, and management prescriptions that may be simulated. However, due to the restricted range of data used to construct the component models (e.g., young, even-age, conifer stands) and the increasing demand for management prescriptions that restore and maintain stands outside this range (e.g., stands with old-growth characteristics), new models of the following processes need to be incorporated into single-tree simulators:
• old tree growth and mortality, • dead tree dynamics, • dead branch and litter accumulation, • natural regeneration,
This file was created by scanning the printed publication.Errors identified by the software have been corrected;
however, some errors may remain.

• hardwood dynamics and hardwood-conifer competition,
• tree volume loss and mortality due to damage from . selection harvests.
In addition, ways are needed to simulate silvicultural systems such as group selection management in which trees of similar ages are clumped rather than uniformly distributed within a stand. Finally, more emphasis should be placed on the description and forecasting of forest landscapes that are made up of several contiguous stands. Growth and yield models need to be linked to geographic information systems in order to display the spatial as well as the temporal order of the forest landscape.
The remainder of the paper is organized as follows. First, I review multiple-resource management formulations at the stand and forest levels. The second section describes a set of stand-level studies for the Flathead National Forest. The description includes management goals and desired stand conditions for three land-use zones. The third section presents results including the feasibility of the desired stand conditions and costs of attaining them. The paper concludes with a discussion of how to adjust stand density targets to attain feasibility and reduce costs.
MULTIPLE-RESOURCE MANAGEMENT FORMULATIONS
Because of the demand for management alternatives that sustain ecosystem values, researchers and National Forest managers are developing relationships among timber harvesting, forest structure, and ecosystem qualities. I refer to the combination of forest outputs and ecosystem qualities as forest resources, for lack of a better term. Furthermore, there is great interest in determining not only the optimal mix of such resources but also management strategies for obtaining them.
Economic formulations of this multiple-resource problem seek the management alternative that maximizes the discounted value of net benefits from the flow of forest resources over time. Such a formulation requires joint production functions and monetary valuation of the forest resources. In many National Forests, timber harvesting is the most widely practiced management activity, and forest resources are dependent on the timing of timber harvests and the resulting temporal and spatial order of the forest.
Economic formulations of multiple-resource management are common at the stand level. Analytical studies have focused on the harvest age for an even-age stand and have assumed that forest resources can be expressed as a function of stand age (e.g., Hartman 1976; Calish and others 1978). The Faustmann formula is generalized by adding a function for nontimber forest resources to an agedependent timber production function. This formulation allows the determination of the effects of nontimber resources on the optimal rotation age. The extent and direction of the change depend on the nature of the nontimber resources and their value relative to timber harvests. In addition to analytical studies, numerical methods have been used to solve stand-level, multiple-resource models
63
for optimal thinning regimes and rotation ages. Riitters and others (1982) determined optimal thinning regimes for ponderosa pine using a model that includes joint production of timber and forage. The relative prices of these two resources are crucial for determining optimal production levels.
When monetary valuations of nontimber forest resources are not available, models for joint production may be used to estimate the costs (in terms of foregone revenue) of producing alternative levels of these resources. For example, Brown (1987) estimated functions that relate near-view scenic beauty to physical attributes (including stand density) of an uneven-age ponderosa pine stand. Using a stand simulator to forecast steady-state timber, water, and forage yields for different residual stand densities, he constructed a curve showing the tradeoff between revenues for these outputs and scenic beauty. The monetary cost of providing a nonmonetary forest resource may be compared with its benefits to aid determination of the optimal mix.
Haight and others (1991) applied this general approach to stand-level harvesting problems faced by National Forest managers. There are two important differences between this approach and the one Brown (1987) provided. First, this study moves beyond the simulation of steadystate resource production to the determination of optimal management regimes with continuous decision variables that are defined in discrete time intervals over a long planning horizon. Second, this study does not provide measures of nontimber forest resources such as scenic beauty. Instead, stand density targets that are associated with the production of desired forest resources are prescribed. As a result, the study cannot explicitly show tradeoffs between revenues derived from harvesting and nontimber resource values. However, the study does show how changes in target densities affect revenue, and this analysis may be used to adjust admittedly subjective targets to reduce costs.
The strength of the Haight and others (1991) approach is the dynamic optimization formulation with continuous decision variables. The use of dynamic optimization allows the examination of a more realistic and much wider range of harvest activities for either even-age or unevenage management systems, including mixed-species management. Further, if production relationships expressing nontimber forest resources as a function of stand density become available (e.g., Hull and Buhyoff 1986; Brown 1987), these may be incorporated into the optimization model so that explicit tradeoffs between the revenue and yield from timber harvesting and nonmonetary resource production may be examined.
A major criticism of a single-stand analysis is that forest-level information is ignored (Bowes and Krutilla 1989). For nontimber forest resources such as visual quality and wildlife, the aggregate of stand conditions over a large area has as much impact on production as singlestand conditions. Thus, the value of changing the age distribution of stands over a large area to increase the production and quality of these resources may be high enough to justify harvest ages that are significantly different from single-stand optima. I recognize this shortcoming and hope with future research to generalize the single-stand

approach to solve the optimal forest-level management problem.
Forest-level models have been formulated to determine optimal harvest ages, and they include production relationships for forest resources as a function of the forest age distribution (e.g., Bowes and Krutilla 1989; Paredes and Brodie 1989). Bowes and Krutilla show that the optimal solution may involve specialized uses of some stands (e.g., short rotations for timber production) and the production of multiple forest resources from others (e.g., long rotations for stands that produce both timber and wildlife habitat). As a result, optimal rotation ages may vary for stands of the same initial age and depend on the age distribution of the surrounding forest.
Forest-level analyses provide land-use designations and harvest ages that maximize forest-wide benefits, but they do not provide the detailed management prescriptions for individual stands that are required to produce the desired forest resources. Further, forest models do not fully evaluate the costs of alternative stand-level prescriptions. Therefore, I believe that results from standlevel analyses in addition to those from forest-level models will improve the management of timber stands for multiple forest resources.
STUDY DESIGN
The stand management problems are formulated to find the best sequence of thinnings for mid-rotation stands on a 20-year cycle during a 60-year horizon. The objective is to maximize either the present value or cubic foot volume of harvests while meeting stand density targets, which are evaluated on a 5-year cycle. The stand is regenerated in year 60. A mathematical representation of the management problem is provided by Haight and others (1991).
The Stand Prognosis Model Onland Empire Version 5.2) is used to simulate stand development (Wykoff and others 1982; Wykoff 1986; Hamilton 1986). The projection interval is 5 years. The individual tree is the basic unit of projection, and stands with any combination of species and size classes can be accommodated. The simulator is calibrated for 11 conifer species occurring on 30 habitat types in northern Idaho and northwestern Montana. Although the simulator includes a regeneration establishment component (Ferguson and others 1986; Ferguson and Crookston 1984), it is not used because the focus is on thinning well-stocked, mid-rotation stands, and because the target stand descriptions define density levels for a single-storied canopy. Future studies are planned for multi storied stands in which the regeneration establishment model is requisite.
The stand management problems are solved using a coordinate-search algorithm called the "Method of Hooke and Jeeves" (Hooke and Jeeves 1961). The mechanics of the algorithm can be found in most operations research texts (e.g., Bazaraa and Shetty 1979). A description of the algorithm and its performance with the Prognosis Model are given in detail elsewhere (Haight and Monserud 1990; Monserud and Haight 1990).
Harvest regimes are defined by a set of control variables representing the fractions of trees harvested by diameter class and species group in specified periods.
64
Because of complexities in the response surface generated by the Prognosis Model, the coordinate-search algorithm does not guarantee convergence to a globally optimal solution to a given harvesting problem. Convergence is improved by defining harvest controls for relatively wide diameter classes and broad species groupings (Haight and Monserud 1990). Therefore, I use one species group, three unmerchantable diameter classes (0-2, 2-4, and 4-7 in.), and five merchantable diameter classes (7-10, 10-14, 14-18, 18-22, and 22-40 in.).
Management regimes are computed for four mixedconifer stands on the Flathead National Forest in Montana in the Abies grandis / Clintonia uni/lora habitat type. The elevations range from 2,400 to 5,000 ft, the slopes range from 0 to 45 percent, and the aspects are south to southwest. The diameter distributions and· species proportions are listed in tables 1 and 2.
The economic parameters for problems with a present value objective represent 1989 market conditions on the Flathead National Forest (Gary Dahlgren, Timber Sales Forester, Flathead National Forest, Kalispell, MT, personal communication). The stumpage price is $150 per 1,000 Scribner board feet (Mbf) and independent of
Table 1-lnitial conditions for the four test stands located on the Flathead National Forest in the Abies grandislClintonia unifJora habit type
Stand number Diameter 2 3 4
Inches - - - - - - - - - - - - - - -Trees/acre - - - - - - - - - - - - - - - -
0-2 150 933 1,050 600 2-4 900 67 0 75 4-7 586 24 0 158 7 -10 46 10 0 130
10 -14 0 70 0 25 14 -18 0 31 0 0 18 -22 0 6 0 0
22+ 0 1 0 0 Total 1,683 1,142 1,050 988
Ft2/acre 131 125 2 103 gmd1(inch) 3.8 4.5 0.6 4.4
lQuadratic mean diameter (qmd) is 13.541 (~)OS where b is the stand basal area (ft2/acre) and t is trees/acre.
Table 2-Species composition as a percent of stand basal area for the four test stands located on the Flathead National Forest in the Abies grandis/Clintonia unifJora habitat type
Stand number Species 2 13 4
Lodgepole pine Western larch Douglas-fir Subalpine fir Grand fir Spruce Western white pine
94 2 3 1 o o o
7 25 67 o 1 O. o
o 4 7
36 o
50 3
93 6 o 1 o o o
'Species composition for stand 3 is listed as a percent of total number of trees because the quadratic mean diameter of the stand is less than 1 inch.

.~ ...
species. While appraised stumpage prices differ by species, bid prices for timber sales on the Flathead National Forest are usually the same across species. Furthermore, stand density targets associated with timber production do not distinguish between species. Therefore, I elected not to assign species preferences and to use one speciesindependent stumpage price. If premiums exist for one or more species, these may easily be incorporated into the model (see Haight and Monserud 1990). The minimum merchantable tree size is 7 in. in diameter at breast height, and merchantable tree volumes are measured with a 6-in. minimum top diameter. Precommercial thinning costs $0.10/tree regardless of species. The real discount rate is 4 percent, and the discount rate, prices, and costs are assumed to be constant over time. With a cubic foot volume objective, there are no production costs, the stumpage price is effectively $lIft3 , and the discount rate is zero. The minimum merchantable tree size and minimum top diameter are the same.
The baseline harvest regime for each production objective is computed without stand density constraints. For comparison, harvest regimes are computed with stand density targets for three land-use designations on the Flathead National Forest: timber production as the primary output, timber production in visually sensitive areas, and timber production in whitetailed deer winter habitat. Stand density targets are upper and lower bounds for total trees per acre as a function of the quadratic mean diameter (qmd) of the stand, with diameters specified in 2-in. intervals (table 3).
The density targets are silviculturists' expert (albeit subjective) opinions of stand conditions that will produce
. the desired forest outputs such as wildlife habitat or visual quality. The targets were developed in consultation with the respective resource specialists at the National Forest. For a given land-use designation, density targets were constructed based on habitat type, slope, aspect, and elevation (Chew 1989). The rationale of the density targets is simple: if the quadratic mean diameter of the stand can be kept between the upper and lower bounds (the targets) at a given density then the resource specialists expect that the desired level of resource production
will be achieved. Of course, the determination of these targets is not the focus of this research; see Smith and Long (1987) for a more objective approach to developing the stand density targets for wildlife management.
The density targets for the timber management landuse designation (table 3) are designed with the goal of maximizing timber production while protecting the productive capacity of the land and timber resource. Implicit in the targets are constraints on thinning type, on the minimum tree size at rotation age, and on the species mix. A strong emphasis on resource protection was intended to be reflected in these targets.
Managed forests are accessible for recreation, and scenic attractiveness affects the quality of recreational experiences. The relationship between timber harvesting and scenic quality has been evaluated (Kenner and McCool 1985; Hull and Buhyoff 1986; Brown 1987), and results show that, with proper slash removal, reducing stand density enhances scenic attractiveness. The density targets for timber management in visually sensitive areas (table 3) are designed to maintain a pleasing, natural-appearing landscape in which management activities are not dominant.
Thermal cover in whitetailed deer winter habitat is optimal when stands have a closed canopy and thus high densities (Thomas and others 1982). Such stands help the animals reduce heat loss and thus conserve energy both by the reduction in radiation to the night sky because of a closed canopy and from reduced wind chill in a dense stand (Thomas and others 1982). Targets that are intended to ensure adequate thermal cover for whitetailed deer are given in table 3.
RESULTS
Unconstrained Management
Across the four test stands, thinning regimes that maximize present value have more intense commercial thinnings and produce less volume than do regimes that maximize volume production. Commercial thinnings are more intense because discounting gives a premium to revenue
Table 3-Upper and lower bounds of stand density targets for three management goals for the four test stands located on the Flathead National Forest in the Abies grandislClintonia unit/ora habitat type
Quadratic mean diameter
Inche.s
1 -3 3 -5 5 -7 7 -9 9 -11
11 -13 13 -15 15 -17 17 -19
Targets by management objective Timber Visual quality Deer habitat
upper lower upper lower upper lower
- - - - - - - - - - - - - - - - - - - - - - - - - - - - - - - - - -Trees/acre - - - - - - - - - - - - - - - - - - - - - - - - - - - - - - - - - - -
1,000 450 900 300 1,000 600 900 450 800 300 900 600 800 380 800 300 800 600 560 370 560 300 520 400 390 315 390 300 366 327 290 260 290 250 292 262 230 210 230 210 185 177 195 178 195 178 160 145 160 145
65

produced earlier in the regimes. Throughout this discussion, thinning intensity refers to the number of trees harvested. Therefore, a more intense commercial thinning means that more trees of commercial size are harvested.
The thinning regimes for stand 1 are representative of the effects of management objectives. The thinning strategy for maximizing present value (fig. 1) involves thinning from above, taking most merchantable trees every 20 years. A small precommercial thinning is scheduled in year 20. By year 60, the majority of trees are greater than 7 in. in diameter, resulting in a harvest of 8 Mbfi'acre. The present value is $420/acre, and the volume production is 58.8 ftNacre/year. Mean annual volume production is calculated as the total volume harvested in thinnings and clearcut minus the volume of the initial stand divided by 60 years.
The thinning regime that maximizes volume production (fig. 2) involves a heavy precommercial thinning in year 0 and light commercial thinnings in years 0 and 20. These thinnings produce a stand with 59 percent more volume in year 60 relative to the regime in figure 1. Overall, the thinning regime produces 7 percent more volume and 29 percent less present value than the regime that maximizes present value.
1000
_ Trees out
800 c::J Trees left
CD ... 600 (,)
as -fh CD
400 CD ... .... 200
0
0-2 2-4 4-7 7-10 10-14 14-18 18-22 22+
Diameter class (inches) 1000
Year 40 _ Trees out
800 r:::J Trees left
CD ti 600
as -fh ~ 400 ... ....
200
0
0-2 2-4 4-7 7-10 10-14 14-18 18-22 22+
Diameter class (inches)
CD ... (,) nI -fh CD CD ... ....
Timber Management
The stand density targets associated with the timber management land use are infeasible in stands 1 and 4 (table 4), both of which are dominated by lodgepole pine. Due to high mortality rates, the constraints are violated at the ends of the thinning regimes when stand densities drop below the desired levels for stands with larger mean diameters. For example, the constrained thinning regime for stand 1 involves a heavy thinning in year 0, which reduces stand density to the maximum for small-diameter stands, and includes no thinnings thereafter. Stand density is within the targets until year 60 when it drops below the desired 380 trees/acre minimum associated with an 8-in. mean diameter.
The form of the objective function has no effect on optimal thinning regimes for stands in which targets are infeasible: solutions are nearly the same for both present value and volume maximization. When the targets are feasible, optimal regimes differ in the same manner as unconstrained regimes: regimes that maximize present value have more intense commercial thinnings and produce less volume.
-1000
Year 20 -Trees out [Il Trees left
800
CD ... 600 (,)
nI -UJ CD 400 CD ... ....
200
0 0-2 2-4 4-7 7-10 10-14 14-18 18-22 22+
Diameter class (inches)
Year 60 _ Treesout
0.8 IlZJ Trees left
0.6
0.4
0.2
o 0-2 2-4 4-7 7-10 10-14 14-18 16-22 22+
Diameter class (inches)
Figure 1-Thinning regime for stand 1 that maximizes present value with no stand density constraints.
66

1000 1000
- Treesout _ Treesout
800 £:2l Trees left Year 20 C!l Trees left 800
f CD (.) ... as 600 (.)
600 U; as -CD tn CD CD ... 400 CD
400 .... ... .... 200
200
0 0
0-2 2-4 4-7 7-10 10-14 14-18 18-22 22+ 0-2 2-4 4-7 7-10 10-14 14-18 18-22 22+
Diameter class (inches) Diameter class (inches) 1000 1000
Year 40 _ Trees out
- Treesout 800 [ZJ Trees left Year 60 ED Trees left
800
CD CD ... ... (.)
600 (.)
as as 600 U; -tn CD CD f 400
CD ... 400 .... ....
200 200
0 0
0-2 2-4 4-7 7-10 10-14 14-18 18-22 22+ 0-2 2-4 4-7 7-10 10-14 14-18 18-22 22+
Diameter class (inches) Diameter class (inches)
Figure 2-Thinning regime for stand 1 that maximizes timber volume production with no stand density constraints_
In comparison to the unconstrained regimes shown in figures 1 and 2, constrained regimes have more intense precommercial thinnings early and less intense commercial thinnings later on. As an example of the effects, compare the graphs of density vs. diameter for the unconstrained and constrained regimes that maximize the present value of stand 1 (figs. 3A and 3B, respectively). The
constrained regime has fewer trees when the mean diameter is small and more trees when the mean diameter is large. The differences in thinning intensity in the constrained regime for stand 1 result in 39 percent less present value and 5 percent less volume production relative to the production levels of the unconstrained regimes. Across all stands, the effects of the constraints on the
Table 4-Objective function values for management regimes that maximize the present value ($/acre) and volume production (ft3/acre/year) of mixed-conifer stands with and without stand density targets. An asterisk indicates that targets are infeasible. The cost of the targets (expressed as a percent of the unconstrained return) is listed in parentheses
Stand Objective function values by management objective number Unconstrained Timber Visual quality Deer habitat
- - - - - - - - - - - - - - - - - - - - - - - - - - - - - - - - - - - -Max. present value ($/acre) - - - - - - - - - - - - - - - - - - - - - - - - - - - - - -
1 420 258"(39%) 183(56%) 262*(38%) 2 2,691 2,658 ( 1 %) 2,570( 4%) 2,480*( 8%) 3 178 148 (17%) 121(32%) 149*(16%) 4 1,253 949*(24%) 1 ,209( 4%) 943*(25%)
1 2 3 4
- - - - - - - - - - - - - - - - - - - - - - - - - - - - - - - - - - Max. volume (ff3/acre/year)- - - - - - - - - - - - - - - - - - - - - - - - - - - - - - - - -
62.9 59.5*( 5%) 42.4(33%) 58.9*( 6%) 62.7 52.7 (16%) 56.2(10%) 49.4*(21%) 43.1 41.2 ( 4%) 41.2( 4%) 39.3*( 9%) 69.6 58.6*(16%) 64.3( 8%) 63.2*( 9%)
67

management criteria are to reduce present value by 1 to 39 percent and volume production by 4 to 16 percent relative to the production levels of the unconstrained regimes (table 4).
Timber Management in Visually Sensitive Areas
The stand density targets used in visually sensitive areas offer a wider range of feasible stand densities than do targets for the other land uses. As a result, the targets are feasible in all four test stands (table 4).
The constrained optimal thinning regime for stand 1 (for both forms of the objective function) includes a heavy precommercial thinning in year 0, reducing stand density to the upper bound of900 trees/acre (fig. 3C). Thereafter, stand density stays within the bounds with no further thinnings. Compared to the unconstrained regime (fig. 3A), the pre commercial thinning leaves roughly half the number of trees at the start and produces no revenue. As a result, the constrained regime produces 56 percent less present value and 33 percent less volume.
A similar pattern is repeated in the other stands, regardless of the form of the objective function: the first thinning is heavy to reduce the stand density to the required target, and light thinnings may be taken thereafter to fine tune the stand density. Just as in the previous cases,
1600 c A. Unconstrained Management
1200 0 Upper & lower bounds CD ... n- Constrained regime U cu 800 -en CD c CD ... ~ 400 0
u
0
1.0 3.0 5.0 7.0 9.0 11.0
Quadratic mean diameter (inches)
1600 C. Visual Management
1200 -- Upper & lower bounds
CD n Constrained regime ... U CU 800 -en c CD CD c ... ~ 400
c 0
0 1.0 3.0 5.0 7.0 9.0 11.0
Quadratic mean diameter (inches)
regimes that maximize present value have more intense commercial thinnings and produce less volume than do regimes that maximize volume production. The effects of the constraints on the management criteria are to reduce present value by 4 to 56 percent and volume production by 4 to 33 percent relative to the production levels of the unconstrained regimes (table 4).
Timber Management in Whitetailed Deer Winter Habitat
Because high stand density levels are needed for adequate thermal cover, the stand density targets for whitetailed deer winter habitat management offer the smallest range of feasible alternatives. As a result, the targets are infeasible in all four test stands (table 4). In short, you can't get there from here.
With a present value objective, the optimal thinning regime for stand 1 involves a heavy thinning from above in year 0, which reduces stand density to slightly above the target density of 1,000 trees/acre (fig. 3D). Stand density is within the bounds until year 30, when it drops below the required 600 trees/acre for a 6-in. mean stand diameter. It continues to be below the required 400 trees/acre for an 8-in. mean stand diameter at year 60. A similar infeasible regime is obtained with a volume production objective.
CD ... U cu -en CD CD ... ....
CD ... U cu -en CD CD ... ~
1600
1200
800
400
0
1.0
1600
1200
800
400
o
B. Timber Management
c c
Upper & lower bounds ·n- Constrained regime
3.0 5.0 7.0 9.0 11.0
Quadratic mean diameter (inches)
D. Deer Habitat Management
-- Upper & lower bounds o -G- Constrained regime
1.0 3.0 5.0 7.0 9.0 11.0
Quadratic mean diameter (inches)
Figure 3--Plots of stand density versus quadratic mean diameter for unconstrained (A) and constrained (8-0) optimal thinning regimes for stand 1. Each thinning regime is represented by data points in 1 O-year intervals beginning in year O. The upper and lower bounds defining the stand density targets are also given.
68
1600
1200
800
400
0
1.0
1600
1200 CD ... Co) ca 800 en CD ! .- 400
0' 1.0
Deer Habitat Management-Stand 1
-------~-------t Upper & lower bounds
-G- Constrained regime
D
-+ Modified bounds
3.0 5.0 7.0 9.0 11.0
Quadratic mean diameter (inches)
Deer Habitat Management-Stand 3
Upper & lower bounds -G Constrained regime -+ Modified bounds
3.0 5.0 7.0 9.0 11.0
Quadratic mean diameter (inches)
1600 Deer Habitat Management-Stand 2
- Upper & lower bounds CD 1200 ... Co)
-G- Constrained regime -+- Modified bounds
ca - 800 0 CD CD ... .- 400
0 1.0 3.0 5.0 7.0 9.0 11.0
Quadratic mean diameter (inches)
1600 Deer Habitat Management-Stand 4
- Upper & lower bounds -n- Constrained regime -+- Modified bounds
1200 ·······++--------t ! Co)
~ 800
Z ... .- 400
.... g- - - ---
1.0 3.0 5.0 7.0 9.0 11.0
Quadratic mean diameter (inches)
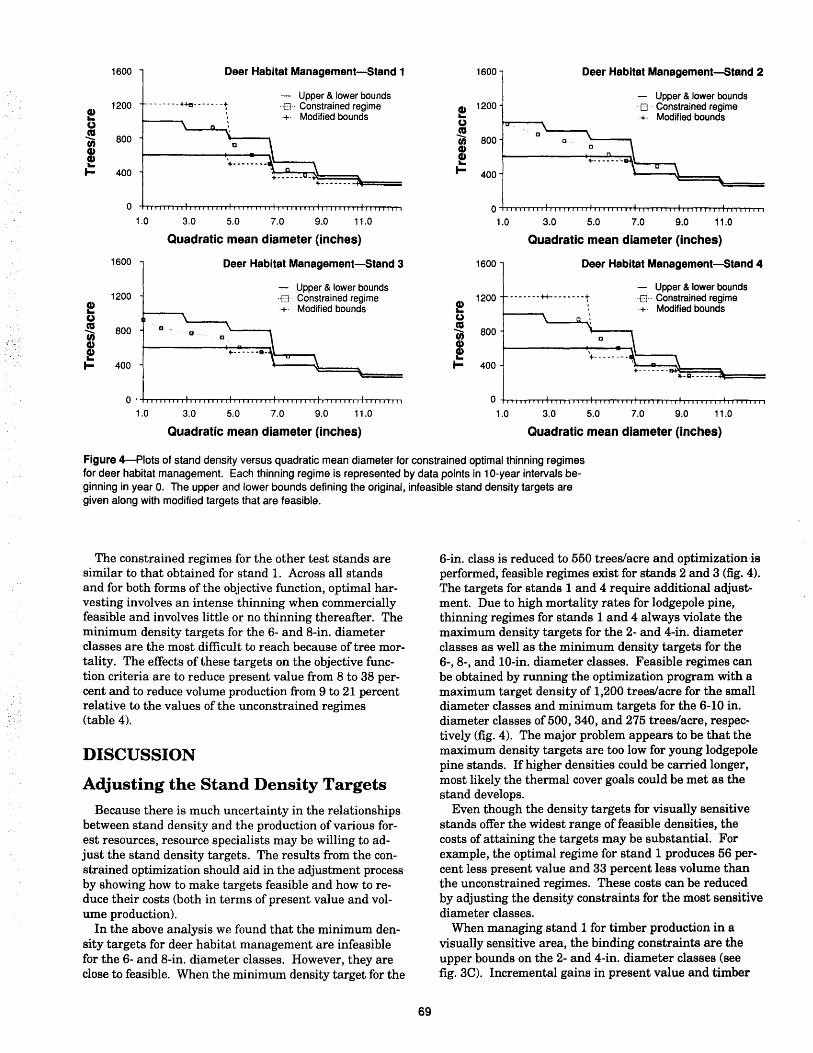
Figure 4-Plots of stand density versus quadratic mean diameter for constrained optimal thinning regimes for deer habitat management. Each thinning regime is represented by data pOints in 10-year intervals beginning in year O. The upper and lower bounds defining the original, infeasible stand density targets are given along with modified targets that are feasible.
The constrained regimes for the other test stands are similar to that obtained for stand 1. Across all stands and for both forms of the objective function, optimal harvesting involves an intense thinning when commercially feasible and involves little or no thinning thereafter. The minimum density targets for the 6- and 8-in. diameter classes are the most difficult to reach because of tree mortality. The effects of these targets on the objective function criteria are to reduce present value from 8 to 38 percent and to reduce volume production from 9 to 21 percent relative to the values of the unconstrained regimes (table 4).
DISCUSSION
Adjusting the Stand Density Targets
Because there is much uncertainty in the relationships between stand density and the production of various forest resources, resource specialists may be willing to adjust the stand density targets. The results from the constrained optimization should aid in the adjustment process by showing how to make targets feasible and how to reduce their costs (both in terms of present value and volume production).
In the above analysis we found that the minimum density targets for deer habitat management are infeasible for the 6- and 8-in. diameter classes. However, they are close to feasible. When the minimum density target for the
69
6-in. class is reduced to 550 trees/acre and optimization is performed, feasible regimes exist for stands 2 and 3 (fig. 4). The targets for stands 1 and 4 require additional adjustment. Due to high mortality rates for lodgepole pine, thinning regimes for stands 1 and 4 always violate the maximum density targets for the 2- and 4-in. diameter classes as well as the minimum density targets for the 6-,8-, and 10-in. diameter classes. Feasible regimes can be obtained by running the optimization program with a maximum target density of 1,200 trees/acre for the small diameter classes and minimum targets for the 6-10 in. diameter classes of 500,340, and 275 trees/acre, respectively (fig. 4). The major problem appears to be that the maximum density targets are too low for young lodgepole pine stands. If higher densities could be carried longer, most likely the thermal cover goals could be met as the stand develops.
Even though the density targets for visually sensitive stands offer the widest range of feasible densities, the costs of attaining the targets may be substantial. For example, the optimal regime for stand 1 produces 56 percent less present value and 33 percent less volume than the unconstrained regimes. These costs can be reduced by adjusting the density constraints for the most sensitive diameter classes.
When managing stand 1 for timber production in a visually sensitive area, the binding constraints are the upper bounds on the 2- and 4-in. diameter classes (see fig.3C). Incremental gains in present value and timber
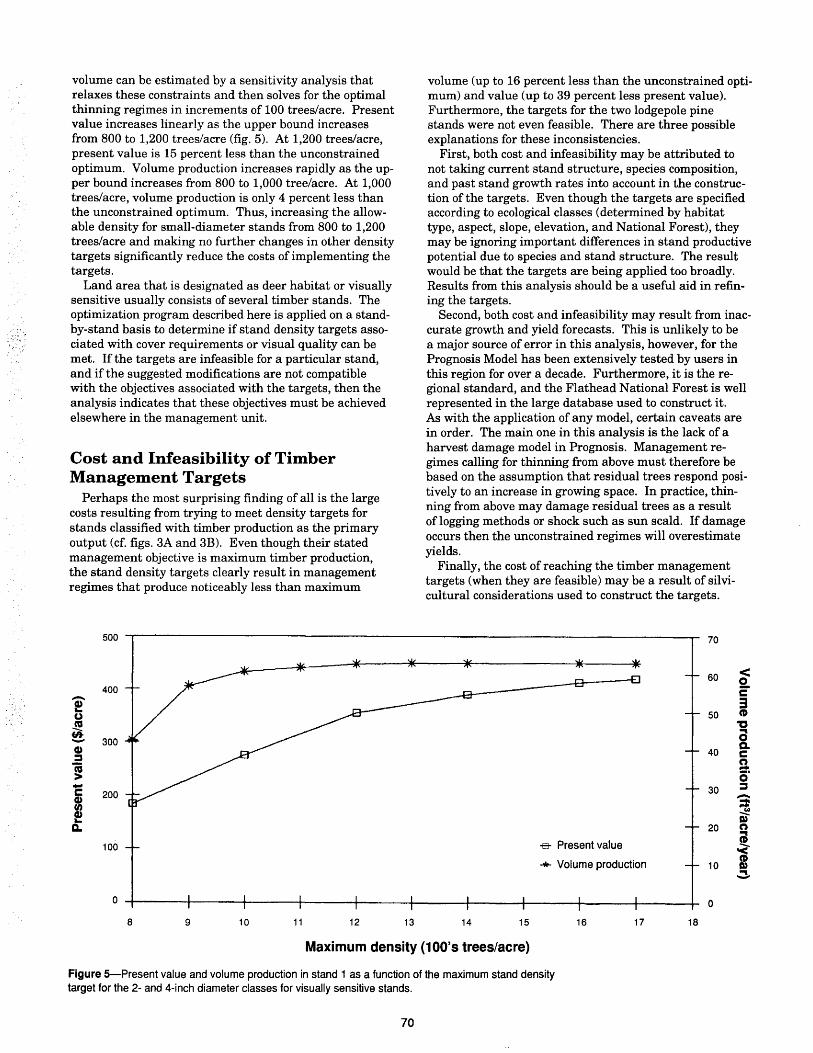
volume can be estimated by a sensitivity analysis that relaxes these constraints and then solves for the optimal thinning regimes in increments of 100 trees/acre. Present value increases linearly as the upper bound increases from 800 to 1,200 trees/acre (fig. 5). At 1,200 trees/acre, present value is 15 percent less than the unconstrained optimum. Volume production increases rapidly as the upper bound increases from 800 to 1,000 tree/acre. At 1,000 trees/acre, volume production is only 4 percent less than the unconstrained optimum. Thus, increasing the allowable density for small-diameter stands from 800 to 1,200 trees/acre and making no further changes in other density targets significantly reduce the costs of implementing the targets.
Land area that is designated as deer habitat or visually sensitive usually consists of several timber stands. The optimization program described here is applied on a standby-stand basis to determine if stand density targets associated with cover requirements or visual quality can be met. If the targets are infeasible for a particular stand, and if the suggested modifications are not compatible with the objectives associated with the targets, then the analysis indicates that these objectives must be achieved elsewhere in the management unit.
Cost and Infeasibility of Timber Management Targets
Perhaps the most surprising finding of all is the large costs resulting from trying to meet density targets for stands classified with timber production as the primary output (cf. figs. 3A and 3B). Even though their stated management objective is maximum timber production, the stand density targets clearly result in management regimes that produce noticeably less than maximum
500
400
e Co)
~ - 300 CD ::s ~ -C 200
~ Q.
100
o
8 9 10 11 12 13
volume (up to 16 percent less than the unconstrained optimum) and value (up to 39 percent less present value). Furthermore, the targets for the two lodgepole pine stands were not even feasible. There are three possible explanations for these inconsistencies.
First, both cost and infeasibility may be attributed to not taking current stand structure, species composition, and past stand growth rates into account in the construction of the targets. Even though the targets are specified according to ecological classes (determined by habitat type, aspect, slope, elevation, and National Forest), they may be ignoring important differences in stand productive potential due to species and stand structure. The result would be that the targets are being applied too broadly. Results from this analysis should be a useful aid in refining the targets.
Second, both cost and infeasibility may result from inaccurate growth and yield forecasts. This is unlikely to be a major source of error in this analysis, however, for the Prognosis Model has been extensively tested by users in this region for over a decade. Furthermore, it is the regional standard, and the Flathead National Forest is well represented in the large database used to construct it. As with the application of any model, certain caveats are in order. The main one in this analysis is the lack of a harvest damage model in Prognosis. Management regimes calling for thinning from above must therefore be based on the assumption that residual trees respond positively to an increase in growing space. In practice, thinning from above may damage residual trees as a result of logging methods or shock such as sun scald. If damage occurs then the unconstrained regimes will overestimate yields.
Finally, the cost of reaching the timber management targets (when they are feasible) may be a result of silvicultural considerations used to construct the targets.
70
60
50
40
30
20
flo Present value
..... Volume production 10
0
14 15 16 17 18
< 0 C 3 (I)
"C .. 0 a. c n -O· ::s -= ~ n i ~ m
..::!-
Maximum density (100's trees/acre)
Figure 5-Present value and volume production in stand 1 as a function of the maximum stand density target for the 2- and 4-inch diameter classes for visually sensitive stands.
70

Implicit in the targets are constraints on the type of thinning, on the minimum tree size at rotation age, and on the species mix. If these silvicultural considerations are necessary to guarantee a workable regime then the results from the unconstrained formulation will be unworkable. However, density targets may not be the best way to incorporate silvicultural considerations such as the type of thinning (e.g., thin only from below) that are not directly related to density. Such nondensity constraints are best handled by explicitly stating them in the problem formulation. Incorporating these constraints directly into the optimization model may then produce management regimes that are both more productive and practical than those resulting from less explicit stand density targets.
CONCLUSIONS
The New Perspectives program is having an immediate impact on silvicultural prescriptions and the use of growth and yield models. Silviculturists are formulating ranges of stand densities that are associated with desired forest outputs and on site ecosystem values (e.g., Chew 1989), and these stand densities are used as targets to reach over time. A stand simulator combined with an optimization program may be used to determine not only the feasibility of such stand density targets but also the optimal harvest regimes for reaching them.
In this study, stand density targets are subjectively associated with the production of desired forest resources. If functions that explicitly relate resource production to stand density are available (e.g., Hull and Buhyoff 1986; Brown 1987), then the problem may be reformulated with constraints for minimum levels of resource production over time, using the same solution methodology.
Solving constrained optimization problems is an efficient way to identify and analyze management regimes that are intended to satisfy pre specified stand density targets. Results for test stands in the Rocky Mountains show that the constraints imposed on management by such targets can significantly affect the resulting harvest regimes. With no targets, optimal harvesting depends on whether an economic or volume production criterion is used. When targets are imposed, attaining the targets overrides the objective function criterion so that there are only small differences in optimal regimes found with different criteria. Further, harvest regimes that attain feasible targets have very different harvest intensities over time than do unconstrained regimes. Assuming that these unconstrained regimes provide a workable standard, imposing density targets may result in significant reductions in revenue and volume.
The solution algorithm helps resolve infeasible targets. Results show that density targets for a land-use designation may not be feasible for every stand condition (e.g., the targets for timber production) or even any stand condition (e.g., the targets for deer winter habitat). Because the solution algorithm can also be used to provide nearfeasible solutions, it is easy to identify specific targets that need to be relaxed to gain feasibility.
Results from the solution algorithm may be used to incrementally adjust targets so that the costs of meeting
71
the targets are reduced. The gains in revenue or timber volume that can be obtained with incremental changes in targets can be compared with the estimated marginal benefits from nonmonetary forest resource production. Results from such marginal analyses should improve our ability to determine efficient levels of production of multiple forest resources.
REFERENCES
Bazaraa, M. S., and C. M. Shetty. 1979. Nonlinear programming: theory and algorithms. John Wiley and Sons, New York. 560 p.
Bowes, M. D., and J. V. Krutilla. 1989. Multiple-use management: the economics of public forestlands. Resources for the Future, Washington DC. 357 p.
Brown, T. C. 1987. Production and cost of scenic beauty: examples for a ponderosa pine forest. Forest Science. 33: 394-410.
Calish, S., R. D. Fight, and D. E. Teeguarden. 1978. How do nontimber values affect Douglas-fir rotations? Journal of Forestry. 76: 217-221.
Chew, J. D. 1989. An expert system for the diagnosis of stand treatment needs. Paper presented at the Artificial Intelligence and Growth Models for Forest Management Decisions Conference, Vienna, Austria, Sept. 18-22,1989.
Ferguson, D. E., and N. L. Crookston. 1984. User's guide to the Regeneration Establishment Model-a Prognosis Model extension. USDA For. Servo Gen. Tech. Rep. INT-161. 23 p.
Ferguson, D. E., A. R. Stage, and R. J. Boyd. 1986. Predicting regeneration in the grand fir-cedar-hemlock ecosystem of the Northern Rocky Mountains. Forest Science Monograph. 26. 41 p.
Haight, R. G., and R. A. Monserud. 1990. Optimizing anyaged management of mixed-species stands: I. Performance of a coordinate-search process. Canadian Journal of Forest Research. 20:15-25.
Haight, R. G., R. A. Monserud, and J. D. Chew. 1991. Optimal harvesting with stand density targets: managing Rocky Mountain conifer stands for multiple forest outputs. Manuscript available from the senior author.
Hamilton, D. A., Jr. 1986. A logistic model of mortality in thinned and unthinned mixed conifer stands of northern Idaho. Forest Science. 32: 989-1000.
Hartman, R. 1976. The harvesting decision when a standing forest has value. Economic Inquiry. 14: 52-58.
Hooke, R., and T. A. Jeeves. 1961. Direct search solution of numerical and statistical problems. J. Assoc. Compo Mach. 8: 212-221.
Hull, R. B. IV, and G. J. Buhyoff. 1986. The scenic beauty temporal distribution method: an attempt to make scenic beauty assessments compatible with forest planning efforts. Forest Science. 32: 271-286.
Kenner, B., and S. F. McCool. 1985. Thinning and scenic attractiveness in second-growth forests: a preliminary assessment. Res. Note 22, Montana For. and Cons. Expt. Station, Univ. Montana, Missoula. 4 p.
Kessler, W. B. 1991. New Perspectives for the Forest Service. Journal of Soil and Water Conservation. 46: 6-7.
Monserud, R. A., and R. G. Haight. 1990. Programmer's guide to the Prognosis Optimization Model. USDA For. Servo Gen. Tech. Rep. INT-269. 24 p.
Paredes, G. L., and J. D. Brodie. 1989. Land value and the linkage between stand and forest level analyses. Land Economics. 65: 158-166.
Riitters, K., J. D. Brodie, and D. W. Hann. 1982. Dynamic programming for optimization of timber production and grazing in ponderosa pine. Forest Science. 28: 517-256.
Smith, F. W., and J. N. Long. 1987. Elk hiding and thermal cover guidelines in the context of lodgepole pine stand density. Western Journal of Applied Forestry. 2: 6-10.
72
Thomas, J. W., H. Black, R. J. Scherzinger and R. J. Petersen. 1982. Deer and elk. P. 104-127 In: Wildlife habitats in managed forests-the Blue Mountains of Oregon and Washington. Thomas, J. W. (ed.). USDA For. Servo Agric. Handb. No. 553.
Wykoff, W. R., N. L. Crookston, and A. R. Stage. 1982. User's guide to the Stand Prognosis Model. USDA For. Servo Gen. Tech. Rep. INT-133. 112 p.
Wykoff, W. R. 1986. Supplement to the user's guide for the Stand Prognosis Model-Version 5.0. USDA For. Servo Gen. Tech. Rep. INT-208. 36 p.