Implications of an Integrated U.S.-Mexican Sugar and ... · Presentation delivered at USDA...
21
Implications of an Integrated U.S.-Mexican Sugar and Sweetener Sector Steven Zahniser, Stephen Haley, Lynn Kennedy, and Getachew Nigatu USDA Economic Research Service Presentation delivered at USDA Agricultural Outlook Forum Washington, DC, February 21, 2014
Transcript of Implications of an Integrated U.S.-Mexican Sugar and ... · Presentation delivered at USDA...

Implications of an Integrated U.S.-Mexican Sugar and Sweetener Sector
Steven Zahniser, Stephen Haley, Lynn Kennedy, and Getachew Nigatu USDA Economic Research Service
Presentation delivered at USDA Agricultural Outlook Forum Washington, DC, February 21, 2014
Introduction
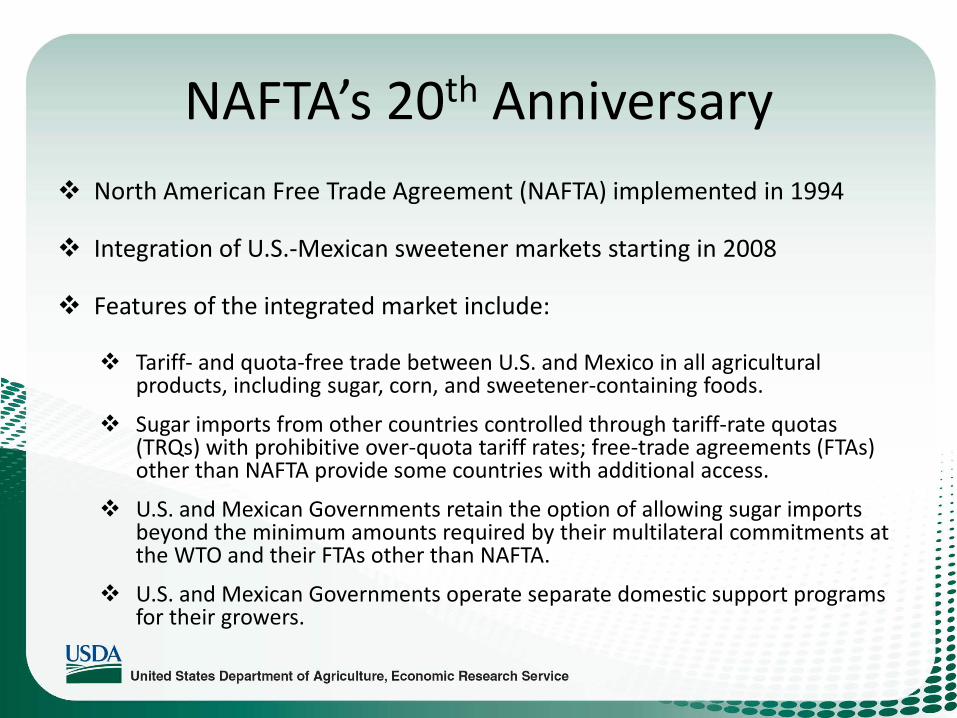
NAFTA’s 20th Anniversary North American Free Trade Agreement (NAFTA) implemented in 1994
Integration of U.S.-Mexican sweetener markets starting in 2008
Features of the integrated market include:
Tariff- and quota-free trade between U.S. and Mexico in all agricultural products, including sugar, corn, and sweetener-containing foods.
Sugar imports from other countries controlled through tariff-rate quotas (TRQs) with prohibitive over-quota tariff rates; free-trade agreements (FTAs) other than NAFTA provide some countries with additional access.
U.S. and Mexican Governments retain the option of allowing sugar imports beyond the minimum amounts required by their multilateral commitments at the WTO and their FTAs other than NAFTA.
U.S. and Mexican Governments operate separate domestic support programs for their growers.

Implications of an Integrated Market
Increased bilateral trade in sugar, other sweeteners, and sweetener-containing products
Scope of market shifts from national to binational
Policy effects extend across the border
High fructose corn syrup (HFCS) has displaced some sugar consumption in Mexico and increased Mexico’s exportable surplus of sugar

Bilateral trade

Increased trade in sugar and fructose
Fructose exports are measured in terms of dry weight. Source: U.S. Census Bureau, Foreign Trade Statistics, as cited by USDA-FAS, Global Agricultural Trade System. .
0
200
400
600
800
1,000
1,200
1,400
1,600
1,800
2,000
1996 1997 1998 1999 2000 2001 2002 2003 2004 2005 2006 2007 2008 2009 2010 2011 2012 2013
Met
ric to
ns (t
hous
ands
)
Fiscal Year
Fructose exports to Mexico Sugar imports from Mexico
Annual averages: • U.S. sugar imports from Mexico:
1.3 million mt, Fiscal Years 2009-13 (FY = October 1 - September 30) 2009-13
• U.S. HFCS exports to Mexico: 993 thousand mt, FYs 2010-13

Trade in a broad set of sweetener-containing products Average annual value Average annual volume
Calendar Years 1991-93
Calendar Years 2011-13
Calendar Years 1991-93
Calendar Years 2011-13
U.S. dollars (millions) Metric tons (thousands)U.S. exports to MexicoFructose syrup, containing more than 50 5 445 17 1,136 percent by weight of fructose, NESOIChocolate and preparations 47 230 16 63Glucose or glucose syrup 5 187 18 424Sugar, cane or beet 44 120 116 148Soups, broths, and preparations thereof, dried 18 176 9 66Other bread, pastry, cake, biscuits, and bakery, 18 96 13 17 wares, excluding pizza and quicheSauces and preparations, not elsewhere specified 5 55 2 29Mexican exports to the U.S.Sugar, cane or beet 1 1,057 3 1,514Confectionery products 23 445 15 209Carbonated soft drinks (1) 15 204 19 298Other nonalcoholic beverages (1) 6 73 8 96Sauces and preparations, not elsewhere specified -- 81 -- 56Biscuits and wafers (2) 16 485 11 212Prepared foods obtained from swelling or roasting of cereal flakes or products, with or without sugar
4 145 2 44
Corn chips and savory snacks 11 93 7 35Pastry, not elsewhere specified or indicated 13 74 8 30Pasta and noodles 5 52 6 57(1) Volume is measured in millions of liters.(2) Includes sweet biscuits, waffles, wafers, pastries, cake, and bread, among other products.Source: U.S. Census Bureau, Foreign Trade Statistics , as cited by USDA-FAS, Global Agricultural Trade System .
Trade flow /commodity

A binational market

Snapshot of U.S. and Mexican sugar and corn sectors, annual averages, FYs 2012-14
CommodityResulting
sugar, centrifugal
ProductionArea
harvestedYield Observations regarding past two decades
Metric tons (millions)
Metric tons (millions)
Hectares (millions)
Metric tons per hectare
Mexican sugarcane 6.5 50.6* 0.72* 70.0* Upward trends in area and productionFlat trend in yields
U.S. sugarcane 3.4 26.8 0.34 78.2 Flat trends in area, yields, and production
U.S. sugarbeet 4.5 29.3 0.48 61.0 Upward trends in yields and productionDownward trend in area
U.S. corn n.a. 313.8 34.94 9.0 Upward trends in area, production, and yieldsPercent devoted to HFCS 4.1
*Data correspond to harvests 2010/11 to 2012/13. Mexican data indicate that the annual average of sugar producedfrom Mexican sugarcane during this period equaled 5.7 million metric tons.Note: Average yield is calculated as the average of the three annual yields.Sources: USDA-FAS, PSD Online (U.S. and Mexican centrifugal sugar production); SAGARPA-CONADESUCA (Mexican caneproduction, area, and yields); USDA-NASS, Quick Stats (U.S. cane and beet production, area, and yields); USDA-ERS, FeedGrains Database (share of U.S. corn devoted to HFCS production).
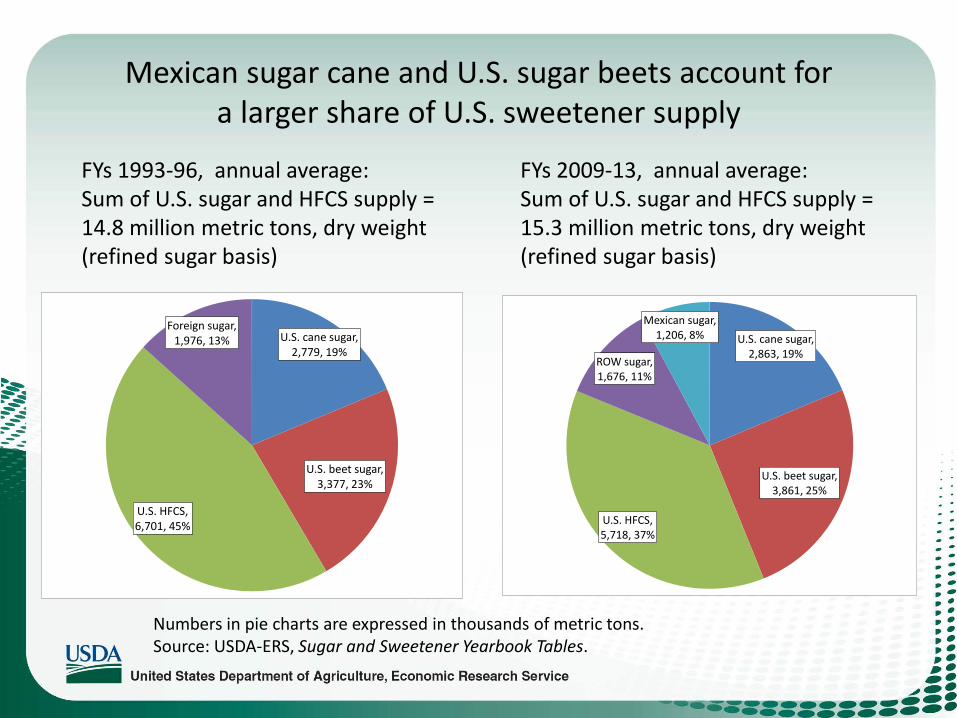
Mexican sugar cane and U.S. sugar beets account for a larger share of U.S. sweetener supply
FYs 1993-96, annual average: Sum of U.S. sugar and HFCS supply = 14.8 million metric tons, dry weight (refined sugar basis)
FYs 2009-13, annual average: Sum of U.S. sugar and HFCS supply = 15.3 million metric tons, dry weight (refined sugar basis)
Numbers in pie charts are expressed in thousands of metric tons. Source: USDA-ERS, Sugar and Sweetener Yearbook Tables.
U.S. cane sugar, 2,779, 19%
U.S. beet sugar, 3,377, 23%
U.S. HFCS, 6,701, 45%
Foreign sugar, 1,976, 13% U.S. cane sugar,
2,863, 19%
U.S. beet sugar, 3,861, 25%
U.S. HFCS, 5,718, 37%
ROW sugar, 1,676, 11%
Mexican sugar, 1,206, 8%

Integration has narrowed the gap between U.S. and world raw sugar prices
Source: Intercontinental Exchange, No. 11 nearby (world), No. 16 nearby (U.S.).
0
5
10
15
20
25
30
35
40
45
Cen
ts p
er p
ound
U.S. raw sugar price World raw sugar priceU.S. raw sugar loan rate

USDA’s long-term projections assume supply responds to price
Source: USDA Agricultural Projections to 2024.
0
5
10
15
20
25
30
35
40
45
0
1,000
2,000
3,000
4,000
5,000
6,000
7,000
8,00019
99/2
000
2000
/01
2001
/02
2002
/03
2003
/04
2004
/05
2005
/06
2006
/07
2007
/08
2008
/09
2009
/10
2010
/11
2011
/12
2012
/13
2013
/14
2014
/15
2015
/16
2016
/17
2017
/18
2018
/19
2019
/20
2020
/21
2021
/22
2022
/23
2023
/24
2024
/25
U.S
. cen
ts p
er p
ound
Thou
sand
s of m
etric
tons
, raw
val
ue
Fiscal Year
U.S. and Mexican sugar production versusU.S. raw sugar price, July-September
U.S. sugar from beets Mexico sugar from cane
U.S. sugar from cane Raw sugar price,July-September
Projections
Policy effects extend across the border

Many cases where one country’s policy potentially affects the other
• How does broader availability of better market information affect quality of decision making? – U.S.-Mexico Governmental Sweetener Working Group: Exchanges,
analyzes, and publicizes data about U.S.-Mexico sweetener markets • How will Mexico’s tax on soft drinks alter beverage manufacturers’
choice between cane sugar and HFCS? • How do U.S. domestic marketing allotments influence market
shares of U.S. and Mexican growers? – U.S. administers allotments to U.S. sugar producers, Mexico does not
administer allotments to its producers • How does provision of additional market access to third countries
affect profitability of growers, refiners, and manufacturers? • How has the increased use of corn to produce ethanol in the United
States affected the availability of HFCS?
High fructose corn syrup in Mexico

U.S. HFCS exports to Mexico
Source: U.S. Department of Commerce, Census Bureau, HTS Export Data
0
200
400
600
800
1,000
1,200Th
ousa
nds o
f met
ric to
ns, d
ry w
eigh
t
Fiscal Year
HFCS-42 HFCS-55 and above Crystalline fructose
FYs 2010-13: • Annual average of 993,000 metric
tons, dry weight • HFCS-55 and above accounts for
about 89 percent of this trade • Emergence of HFCS-42 exports,
perhaps for baking or blending
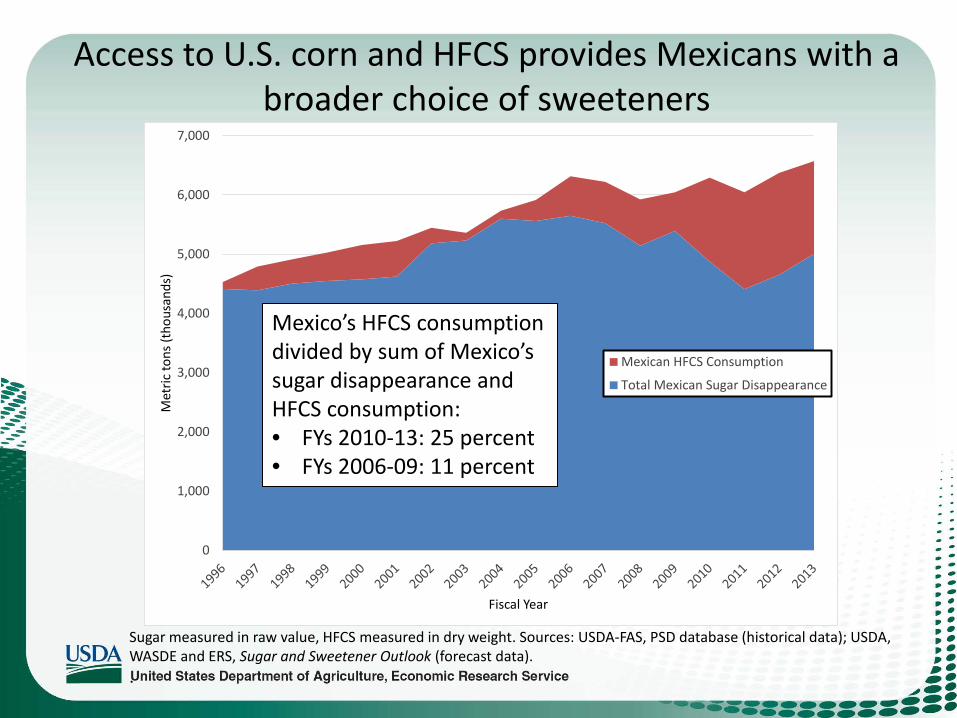
Access to U.S. corn and HFCS provides Mexicans with a broader choice of sweeteners
Sugar measured in raw value, HFCS measured in dry weight. Sources: USDA-FAS, PSD database (historical data); USDA, WASDE and ERS, Sugar and Sweetener Outlook (forecast data). .
0
1,000
2,000
3,000
4,000
5,000
6,000
7,000
Met
ric to
ns (t
hous
ands
)
Fiscal Year
Mexican HFCS Consumption
Total Mexican Sugar Disappearance
Mexico’s HFCS consumption divided by sum of Mexico’s sugar disappearance and HFCS consumption: • FYs 2010-13: 25 percent • FYs 2006-09: 11 percent

HFCS’s possible/potential impact on Mexican sugar exports to the U.S.
0
500
1,000
1,500
2,000
2,500
3,000
3,500
4,000M
etric
tons
(tho
usan
ds)
Fiscal Year
Mexican sugar supply less disappearance Mexican HFCS Consumption
Increased Mexican HFCS consumption contributes to larger exportable surplus of Mexican sugar, which in turn results in larger Mexican sugar exports to United States.
Sugar measured in raw value, HFCS measured in dry weight. Sources: USDA-FAS, PSD database (historical data); USDA, WASDE and ERS, Sugar and Sweetener Outlook (forecast data). .

Questions to think about

Questions to think about
What is the long-term growth path for sugarcane, sugarbeets, and HFCS in the U.S. and Mexico?
What are the prospects for further rationalization in the U.S. and Mexican sweeteners sector?
How large will be HFCS’s share of Mexico’s sweetener consumption?
How compatible are domestic support and trade policies with the integrated U.S.-Mexico market?
Thanks!
Steven Zahniser ([email protected]), Stephen Haley ([email protected]), Lynn Kennedy ([email protected]), and Getachew Nigatu ([email protected])
ERS website: www.ers.usda.gov ERS Sugar and Sweeteners Page: http://www.ers.usda.gov/topics/crops/sugar-sweeteners.aspx
ERS Agricultural Baseline Projections Page: http://www.ers.usda.gov/topics/farm-economy/agricultural-baseline-projections.aspx
ERS NAFTA, Canada, and Mexico Page: http://www.ers.usda.gov/topics/international-markets-trade/countries-regions/nafta,-canada-mexico.aspx
LSU Ag Center website: http://www.lsuagcenter.com/