Implications of 20 Years of CHC Cognitive-Achievement ... · CHC taxonomy of human cognitive...
73
Implications of 20 Years of CHC COG-ACH Research – Kevin S. McGrew – 12-18-12 draft 1 Implications of 20 Years of CHC Cognitive-Achievement Research: Back to the Future and Beyond CHC Kevin S. McGrew Woodcock-Muñoz Foundation WORKING DRAFT: DO NOT QUOTE In Press Woodcock-Muñoz Foundation Press: WMF Press (http://www.woodcock-munoz-foundation.org/press.html ) (Note . All figures are at the end of the manuscript after the references)
Transcript of Implications of 20 Years of CHC Cognitive-Achievement ... · CHC taxonomy of human cognitive...

Implications of 20 Years of CHC COG-ACH Research – Kevin S. McGrew – 12-18-12 draft 1
Implications of 20 Years of CHC Cognitive-Achievement Research:
Back to the Future and Beyond CHC
Kevin S. McGrew
Woodcock-Muñoz Foundation
WORKING DRAFT: DO NOT QUOTE
In Press
Woodcock-Muñoz Foundation Press: WMF Press
(http://www.woodcock-munoz-foundation.org/press.html)
(Note. All figures are at the end of the manuscript after the references)

Implications of 20 Years of CHC COG-ACH Research – Kevin S. McGrew – 12-18-12 draft 2
Abstract
Much has been learned about CHC COG�ACH relations during the past 20 years (McGrew & Wendling,
2010). This paper builds on extant research by first clarifying the definitions of abilities, cognitive abilities,
achievement abilities, and aptitudes and then defining the differences between domain-general and
domain-specific CHC predictors of school achievement. The promise of Kaufman’s (1979; 2009)
“intelligent” intelligence testing principle is demonstrated with two approaches to CHC-based selective,
referral-focused assessment (SRFA). Next, a number of new intelligent test design (ITD) principles are
described and demonstrated via a series of exploratory data analyses that employ a variety of data analytic
tools (multiple regression, causal interpretation of SEM, multidimensional scaling). These ITD principles
and analyses result in the proposal to construct developmental-sensitive CHC-consistent scholastic aptitude
clusters, measures that can play an important role in contemporary third-method (pattern of strength and
weakness [PSW]) approaches to specific learning disability (SLD) identification.
The need to move beyond simplistic conceptualizations of CHC COG�ACH relations and SLD
identification models is argued and demonstrated via the presentation and discussion of CHC
COG�ACH models (causal SEM). Another proposal advanced is to identify and quantify cognitive-
aptitude-achievement trait complexes (CAATCs). A revision in current third-method PSW SLD models is
proposed that will integrate CAATCs. Finally, the need to incorporate the degree of cognitive complexity of
tests and composite scores within CHC domains in the design and organization of intelligence test batteries
(to improve the prediction of school achievement) is proposed. The fusion of proposals presented in this
paper are a call to: (a) return to old ideas with new methods (i.e., “Back to the Future”) and (b) embrace
new ideas, concepts, and methods that require psychologists to move beyond the confines of the dominant
CHC taxonomy of human cognitive abilities (i.e., “Beyond CHC”).

Implications of 20 Years of CHC COG-ACH Research – Kevin S. McGrew – 12-18-12 draft 3
Implications of 20 Years of CHC Cognitive-Achievement Research: Back to the
Future and Beyond CHC
Let me begin by taking a few degrees of freedom to provide a personal introduction and context to help the
reader understand the genesis of the wide-ranging ideas presented in this paper.
It is an honor and pleasure to write and present this invited paper at the Inaugural Session of the
Richard Woodcock Institute for Advancement of Contemporary Cognitive Assessment: The Evolution of
CHC Theory and Cognitive Assessment. As this paper evolved, it became clear that many of my thoughts,
ideas, concepts, and approaches to data analyses reflected the influence of Dr. Richard Woodcock, a friend
and mentor for over 25 years of my professional career. More than once, I wanted to change the focus and
title of my paper to address a broader array of topics, many that build directly on the legacy of Dr.
Woodcock’s numerous innovative applied assessment contributions.
Dr. Woodcock’s innovations and contributions include, but are not limited to:
• Publishing the first co-normed, individually administered cognitive-aptitude-achievement-
interest battery of tests, which extend over most of the lifespan (preschool to late adulthood);
• Publishing the only individually administered co-normed cognitive and achievement batteries
that provide scores based on both age and grade norms;
• Operationalizing and articulating a pragmatic decision-making model for test development
and interpretation;
• Bridging the intelligence theory–IQ test gap as the first test author to base a cognitive-
achievement battery on the extended Cattell-Horn Gf-Gc theory, later to be called Cattell-
Horn-Carroll (CHC) theory;
• Initiating the practice of applying IRT Rasch test scaling methods to a clinical, individually
administered battery of tests and the development of the crucial W score–growth score metric;
• Developing and advocating for better metrics for understanding human performance (e.g., real
regression-to-the-mean adjusted discrepancy norms, norm-based intradiscrepancy and
variation metrics, the Relative Performance Index, proficiency levels);

Implications of 20 Years of CHC COG-ACH Research – Kevin S. McGrew – 12-18-12 draft 4
• Publishing an individually administered cognitive ability battery that also included differential
scholastic aptitude clusters;
• Pioneering a series of CHC-organized joint- or cross-battery factor analyses of the major
individually administered test batteries, resulting in birth of the concept of cross-battery
assessment;
• Advocating for and providing methodology for examiners to engage in more flexible selective
testing; and
• Providing technically sound solutions for test linking and equating, included the linking of a
standardized battery of adaptive behavior (Scales of Adaptive Behavior; Scales of Adaptive
Behavior—Revised) to a cognitive-achievement battery and the translation and adaptation of
all three versions of the English-based WJ cognitive and achievement batteries to Spanish
formats via equated U.S. norm methods.
This list is incomplete, but it demonstrates the breadth of Dr. Woodcock’s contributions to the
practice of psychological and educational assessment. On a more personal note, Dr. Woodcock has played
a major role as a positive and critical mentor—one that has encouraged, prodded, and challenged me to
always think about “raising the bar” when conceptualizing, implementing, and completing a research or
test-development project.
Major portions of this paper draw on Dr. Woodcock’s foundational contributions. In many
respects, his fingerprints are all over this paper. He can claim partial credit for any of the ideas and
innovations that are well received. I will assume 100% responsibility for any that fall flat or are
misdirected. However, he will need to assume indirect responsibility for any material that may be
characterized by the reader as, “Hmm…interesting idea—but are you serious?” since he contributed to the
development of my professional mind—which shares much common variance with his—an intellectually
restless mind that is driven to (a) look for new methods, research, and theories to address applied problems;
(b) stretch available statistical methods and software in search of discovery; (c) look beyond the parochial
boundaries of my training for seeds of ideas in other disciplines to cross fertilize with my existing
professional schema; (d) challenge tradition and orthodoxy in the pursuit of best practice and on the basis

Implications of 20 Years of CHC COG-ACH Research – Kevin S. McGrew – 12-18-12 draft 5
of scientific evidence; and (e) relentlessly (stubbornly?) pursue purpose-driven research and creative
thinking.
The above comments only partially describe the purpose, passion, and serendipity1 theme that
evolved as the core of my professional life, due in large part to Dr. Woodcock. This professional
philosophy produced the CHC cognitive-achievement relations synthesis (McGrew & Wendling, 2010),
which served as the springboard for the current paper. What may look like a coherent and logical set of
propositions, proposals, and data analyses in this paper is more the result of a nonlinear, serendipitous,
Woodcock-influenced journey “back to the future” and “beyond CHC.”
My “Beyond CHC” Journey
A priceless gift from Dr. Woodcock has been unfettered access to the standardization data from all three
editions of the WJ battery (Woodcock & Johnson, 1977; Woodcock & Johnson, 1989; Woodcock,
McGrew, & Mather, 2001) and numerous special studies reported in the various technical manuals. I have
had complete freedom to explore and play in what I call my private “WJ data sandbox.” I have spent
countless hours in this sandbox in the pursuit of answers to questions, hunches, theory-driven ideas, and
serendipitous findings from prior data sandbox sessions. I have entered the data sandbox with many
different data analytic tools and lenses. Many of the discoveries and insights have never reached formal
publication as they satisfied my curiosity and, more importantly, resulted in new insights regarding the
nature of intelligence and the WJ tests. That was sufficient reward. However, from time to time, I put my
findings to word in the form of journal articles or book chapters—the current paper being one such product
of my exploratory data sandbox activities.
No sooner than the WJ III was published in 2001, I began exploring the subtle nuances of the WJ
III norm data. The corpus of findings has made it clear that a strict, linear-structural approach to
understanding the nature of human intelligence, understanding the mental processes assessed in the WJ III®
tests, and understanding cognitive, aptitude, and achievement relations requires the use of both CHC-
grounded research and alternative non-CHC lenses. Starting in 2002, I engaged in a wide-ranging set of
1 Purpose, passion and serendipity is the motto or philosophy of my web-based portal, The MindHub
TM
(www.themindhub.com).
Implications of 20 Years of CHC COG-ACH Research – Kevin S. McGrew – 12-18-12 draft 6
exploratory analyses of the WJ III norm data and select WJ-R and WJ III cross-battery data sets. I dubbed
this my “beyond CHC” project. From 2002 to today, I subjected these data sets to a variety of exploratory
and analytic procedures (various variants of exploratory factor analysis, exploratory model-generating
CFA, cluster analysis, and 2- and 3-D multidimensional scaling).
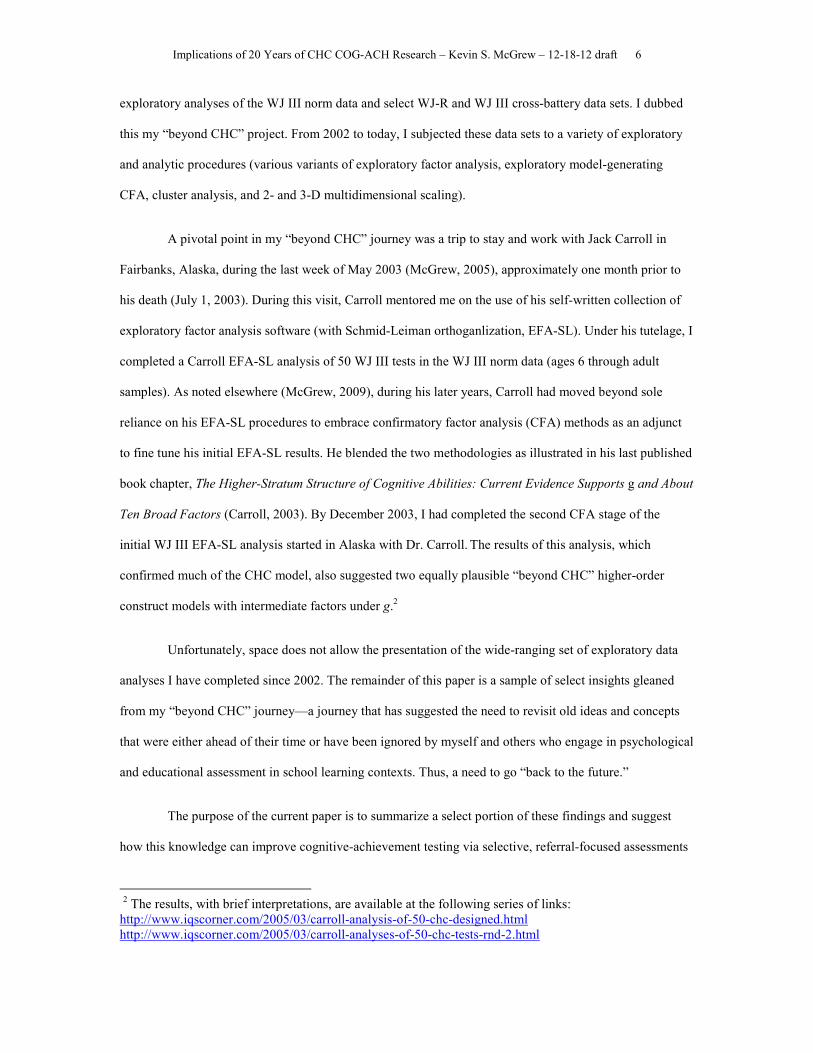
A pivotal point in my “beyond CHC” journey was a trip to stay and work with Jack Carroll in
Fairbanks, Alaska, during the last week of May 2003 (McGrew, 2005), approximately one month prior to
his death (July 1, 2003). During this visit, Carroll mentored me on the use of his self-written collection of
exploratory factor analysis software (with Schmid-Leiman orthoganlization, EFA-SL). Under his tutelage, I
completed a Carroll EFA-SL analysis of 50 WJ III tests in the WJ III norm data (ages 6 through adult
samples). As noted elsewhere (McGrew, 2009), during his later years, Carroll had moved beyond sole
reliance on his EFA-SL procedures to embrace confirmatory factor analysis (CFA) methods as an adjunct
to fine tune his initial EFA-SL results. He blended the two methodologies as illustrated in his last published
book chapter, The Higher-Stratum Structure of Cognitive Abilities: Current Evidence Supports g and About
Ten Broad Factors (Carroll, 2003). By December 2003, I had completed the second CFA stage of the
initial WJ III EFA-SL analysis started in Alaska with Dr. Carroll. The results of this analysis, which
confirmed much of the CHC model, also suggested two equally plausible “beyond CHC” higher-order
construct models with intermediate factors under g.2
Unfortunately, space does not allow the presentation of the wide-ranging set of exploratory data
analyses I have completed since 2002. The remainder of this paper is a sample of select insights gleaned
from my “beyond CHC” journey—a journey that has suggested the need to revisit old ideas and concepts
that were either ahead of their time or have been ignored by myself and others who engage in psychological
and educational assessment in school learning contexts. Thus, a need to go “back to the future.”
The purpose of the current paper is to summarize a select portion of these findings and suggest
how this knowledge can improve cognitive-achievement testing via selective, referral-focused assessments
2 The results, with brief interpretations, are available at the following series of links: http://www.iqscorner.com/2005/03/carroll-analysis-of-50-chc-designed.html http://www.iqscorner.com/2005/03/carroll-analyses-of-50-chc-tests-rnd-2.html

Implications of 20 Years of CHC COG-ACH Research – Kevin S. McGrew – 12-18-12 draft 7
(SRFA). This will be followed by suggestions of select new intelligent test design (ITD) principles for
developing features that can be used to advance interpretation of intelligence test batteries, along with
proposals for SLD identification models—innovations that require a combination of going “back to the
future” and “beyond CHC.”
CHC Model v2.0
The CHC model utilized in this paper is the recent CHC revision described by Schneider and McGrew
(2012). A visual-graphic representation of the Schneider and McGrew summary is presented in Figure 1.
This model and the Schneider and McGrew definitions are the foundation for this paper. 3
--------------------------------------------------------
Insert Figure 1 about here.
--------------------------------------------------------
CHC COG����ACH Relations: What We Know Today
McGrew and Wendling (2010) recently provided the first systematically organized relations synthesis of
contemporary Cattell-Horn-Carroll (CHC) cognitive-achievement (COG�ACH) research. Their review
also included an integration of the narrative synthesis of the CHC COG�ACH research by Flanagan and
colleagues (Flanagan, Ortiz, Alfonso, & Mascolo, 2006). McGrew and Wendling concluded that much has
been learned from 20 years of CHC COG�ACH relations research. According to McGrew and Wendling
(2010):
• Almost all available CHC-designed COG�ACH research is limited to the WJ Battery.
Ninety-four percent of the reviewed research has been completed with the WJ battery
(Woodcock-Johnson® Psycho-Educational Battery–Revised [WJ-R], Woodcock & Johnson,
1989, and the Woodcock-Johnson III [WJ III], Woodcock, McGrew, & Mather, 2001). Thus,
caution is suggested in generalizing to other intelligence batteries until similar CHC-designed
studies are completed with other commonly used cognitive batteries (e.g., Differential Ability
Scales®–II [DAS-II], Elliott, 2007; Kaufman Assessment Battery for Children, Second Edition
3 An abridged summary of the Schneider & McGrew CHC v2.0 model can be accessed at: http://www.iqscorner.com/2011/06/chc-intelligence-theory-v20-broad-and.html

Implications of 20 Years of CHC COG-ACH Research – Kevin S. McGrew – 12-18-12 draft 8
[KABC-II], Kaufman & Kaufman, 2004; Wechsler Intelligence Scale for Children®–Fourth
Edition [WISC®-IV], Wechsler, 2008; Stanford-Binet Intelligence Scales, Fifth Edition [SB5],
Roid, 2003).
• The primary action in CHC COG�ACH relations is at the narrow-ability level. Although
broad CHC composites may be the best average predictors across a broad array of outcome
measures, when the focus is on understanding, diagnosing, or suggesting academic
interventions in sub-areas of achievement (e.g., word attack, reading comprehension, learning
math facts, solving applied math problems), McGrew and Wendling’s (2010) review
suggested narrow is better. As stated by McGrew and Wendling, “consistent with the classic
‘bandwidth-fidelity tradeoff’ (Cronbach & Gleser, 1957) and the ‘attenuation paradox’
(Boyle, 1991; Loevinger, 1954) issues in the validity and reliability measurement
literature….broad best predicts and explains broad. Narrow best predicts and explains
narrow” (p. 669). New research, presented later, suggests that the “narrower is better”
principle may not be 100% accurate and a more fundamental underlying principle is
significant.
• There is a future for “intelligent” intelligence testing, even in the current response-to-
intervention (RTI) environment. The disposal of the imperial IQ–ACH SLD discrepancy
model, coupled with the publication of multiple contemporary cognitive batteries implicitly or
explicitly grounded in (or interpretable from) CHC theory, and the extant CHC-based
COG�ACH research knowledge provide assessment professionals with the opportunity to go
“back to the future” and engage in the judicious, flexible, selective, intelligent (clinical skills
+ psychometric research) intelligence testing (Kaufman, 1979; Kaufman, 2009).
Figure 2 is a condensed, abridged summary of McGrew and Wendling’s (2010) relations synthesis
of contemporary CHC COG�ACH research. The figure conveys four important conclusions. First,
academically related cognitive assessment should focus primarily on the measurement of narrow rather
than broad CHC abilities. Second, certain CHC narrow abilities (e.g., Gc [language development], Gsm
[working memory]) are important for both reading and math (domain-general CHC abilities). Third, some
CHC narrow abilities are differentially related to reading (e.g., Gc [lexical knowledge], Ga [phonetic

Implications of 20 Years of CHC COG-ACH Research – Kevin S. McGrew – 12-18-12 draft 9
coding]) and math achievement (Gf [quantitative reasoning], Gv [visualization]) (domain-specific CHC
abilities). Finally, conclusions 1 through 3, make it clear that in order to design assessments that address
referral-specific concerns, assessment professionals and researchers need to understand the three-way
interaction of CHC narrow abilities X achievement domains X age (developmental status).4
--------------------------------------------------------
Insert Figure 2 about here.
--------------------------------------------------------
Clarification of Ability Construct Terminology
Before proceeding, it is necessary to clarify and define some key terms. The terms ability, cognitive ability,
achievement, aptitude, and aptitude-achievement are discussed in contemporary psychological and
educational assessment circles, often without a clear understanding of the similarities and differences
between and among the terms. For example, what does an “aptitude-achievement” discrepancy in the
context of contemporary models of SLD identification (see Flanagan, Fiorello, & Ortiz, 2010) mean?
Where are the aptitudes in the CHC model? It is argued here that it is critical for assessment professionals
and researchers to use agreed-upon terms to avoid confusion, enhance collaboration, and facilitate research
synthesis. In this spirit, Figure 3 illustrates the conceptual distinction between abilities, cognitive abilities,
achievement abilities, and aptitudes. These conceptual distinctions are drawn primarily from Carroll (1993)
and the work of Snow and colleagues (Corono et al., 2002). These definitions will be used in this paper.
--------------------------------------------------------
Insert Figure 3 about here.
--------------------------------------------------------
Figure 3 illustrates that all constructs in the CHC model are abilities. According to Carroll (1993),
“as used to describe an attribute of individuals, ability refers to the possible variations over individuals in
the liminal levels of task difficulty (or in derived measurements based on such liminal levels) at which, on
any given occasion in which all conditions appear favorable, individuals perform successfully on a defined
4 The abridged nature of Figure 2 excludes the age-related differential findings reported by McGrew and Wendling (2010). Readers should consult this source for information on the relation between age and significant CHC COG�ACH findings.
Implications of 20 Years of CHC COG-ACH Research – Kevin S. McGrew – 12-18-12 draft 10
class of tasks” (p. 8, italics in original).5 In simple terms, “every ability is defined in terms of some kind of
performance, or potential for performance” (p. 4). The overarching domain of abilities includes cognitive
and achievement abilities as well as aptitudes (see Figure 3). Cognitive abilities are abilities on tasks “in
which correct or appropriate processing of mental information is critical to successful performance” (p.
10, italics in original). The key component to the definition of cognitive abilities is the processing of mental
information (Carroll, 1993). Achievement abilities “refers to the degree of learning in some procedure
intended to produce learning, such as an informal or formal course of instruction, or a period of self-study
of a topic, or practice of a skill” (p. 17). As reflected in Figure 3, the CHC domains of Grw and Gq are
consistent with this definition and Carroll’s indication that these abilities are typically measured with
achievement tests. Most assessment professionals use the terms “cognitive” and “achievement” abilities in
accordance with these definitions. However, the term aptitude is often misunderstood.
Carroll (1993) uses a narrow definition of aptitude “to refer to a cognitive ability that is possibly
predictive [emphasis added] of certain kinds of future learning success” (p. 16). The functional emphasis on
prediction is the key to this narrow definition of aptitude and is indicated by the two horizontal arrows in
Figure 3. These arrows, which connect domain-general and domain-specific abilities to the shaded CHC
narrow abilities, combine to predict a achievement ability outcome domain and represent the narrow
definition of “aptitude” used in this paper.
This definition is much narrower than the broad concept of aptitude reflected in the work of
Richard Snow. Snow’s notion of aptitude includes both cognitive and noncognitive (conative)
characteristics of individuals (Corno et al., 2002; Snow, Corno & Jackson., 1996). The broader definition of
aptitude focuses on “the characteristics of human beings that make for success or failure in life’s important
pursuits. Individual differences in aptitudes are displayed every time performance in challenging activities
is assessed” (Corno et al., 2002, p. xxiii). Contrary to many current assumptions, aptitude is not the same as
cognitive ability or intelligence. According to Corno et al., ability is the power to carry out some type of
specific task and comes in many forms: reading comprehension, mathematical reasoning, spatial ability,
perceptual speed, domain-specific knowledge (e.g., humanities), physical coordination, etc. This is
5 As noted by Carroll (1993), liminal refers to specifying threshold values used “in order to take advantage of the fact that the most accurate measurements are obtained at those levels” (p. 8).

Implications of 20 Years of CHC COG-ACH Research – Kevin S. McGrew – 12-18-12 draft 11
consistent with Carroll’s definition of ability. According to Snow and colleagues, aptitude is more aligned
with the concepts of readiness, suitability, susceptibility, and proneness, all which suggest a “predisposition
to respond in a way that fits, or does not fit, a particular situation or class of situations. The common thread
is potentiality—a latent quality that enables the development or production, given specified conditions, of
some more advanced performance” (Corno et al., 2002, p. 3). This definition is similar to the definition in
the Shorter Oxford English Dictionary (Brown, 2002) where the noun aptitude is defined as “1. Natural
tendency, propensity, or disposition; 2. Fitness, suitability, appropriateness; 3. Natural ability; a talent (for);
capacity to acquire a particular skills” (p. 107, bold in original). This broader definition includes
noncognitive characteristics such as achievement motivation, freedom from anxiety, self-concept, control
of impulses, and other noncognitive characteristics.
As reflected in Figure 3, cognitive and achievement abilities differ primarily in the degree of
emphasis on mental information processing (cognitive) and the extent to which the ability is an outcome
acquired more from informal and formal instruction (achievement). Here, aptitude is defined as the
combination, amalgam or complex of specific cognitive abilities that, when combined, best predict a
specific achievement domain. This definition is consistent with Snow’s (1987) assumption that “the term
aptitude always implies prediction in some particular outer environment” (p. 13). Cognitive abilities are
always cognitive abilities. Some cognitive abilities contribute to academic or scholastic aptitudes, which
are pragmatic functional measurement entities—not latent, trait-like cognitive abilities. Different academic
or scholastic aptitudes, depending on the achievement domain of interest, likely share certain common
cognitive abilities (domain general) and also include cognitive abilities specific to certain achievement
domains (domain specific). A simple and useful distinction is that cognitive abilities and achievements are
more like unique abilities in a table of human cognitive elements, while different aptitudes represent
combinations of different cognitive elements from this table that serve a pragmatic predictive function. For
quantoid readers, the distinction between factor-analysis-based latent traits (cognitive abilities) and
multiple-regression-based functional predictors of achievement outcomes (cognitive aptitude) may help
clarify the sometimes murky discussion of cognitive and achievement abilities and aptitudes.

Implications of 20 Years of CHC COG-ACH Research – Kevin S. McGrew – 12-18-12 draft 12
Finally, I believe the various third-method pattern-of-strength-and-weakness (PSW) SLD models
referenced in this paper would benefit from being framed in a broader conceptual and theoretical
framework. Regardless of the SLD model name (e.g., concordance–discordance, discrepancy–consistency,
dual discrepancy–consistency), the models, at their core, are all based on the notion of a specific pattern or
configuration of abilities, aptitudes, and achievements related to different types of SLD in different
achievement domains (see Flanagan, Fiorello, & Ortiz, 2010). The visual-graphic representation of each
model typically includes three shapes (representing construct domains) and simple discrepancy
comparisons between the domains (typically designated by arrows; see Figure 11 later in this manuscript).
Although clear and efficient for enhancing conceptual understanding, such models tend implicitly to
suggest a simplistic, multiple-domain discrepancy-score approach to defining SLD. Furthermore, the
rationales for these models reflect a parochial foundation in contemporary federal SLD regulations and
contemporary research from the fields of special education, school psychology, school neuropsychology,
and psychometric factor-analysis intelligence research. Seminal and historical research from other corners
of psychology (e.g., individual differences, educational psychology) that has focused on the development of
theories and methods for measuring and describing characteristic patterns or configurations of different
human ability traits is largely ignored in contemporary SLD model literature.
Richard Snow’s seminal study of aptitude complexes (which, at various times, he also referred to
as compounds and configurations) (Corno et al., 2002; Snow, 1987) is the most prominent educational
psychology example. Building on Snow’s work, Ackerman’s (1996) PPIK (intelligence-as-process,
personality, interests, intelligence-as-knowledge) model of intelligence has produced intriguing research-
based insights into trait complexes. In an Annual Review of Psychology article on individual differences in
intelligence (Scientific and Social Significance of Assessing Individual Differences: “Sinking Shafts at a
Few Critical Points”), Lubinski (2000) recognizes the similarity of the work of Snow and Ackerman (and
others) via the discussion of the constellations of cross-domain attributes. Although these research
programs have typically dealt with a broader array of human trait domains (intelligence, achievement,
motivation, personality, interests, etc.), the focus on patterns or configurations across and within domains is
similar to the focus of contemporary SLD third-method models.

Implications of 20 Years of CHC COG-ACH Research – Kevin S. McGrew – 12-18-12 draft 13
I believe that research and conceptualization of third-method PSW SLD models could benefit
from being viewed as a narrow subset of a larger set of trait complexes. Contemporary SLD assessment
research could benefit from the conceptual and methodological progress demonstrated by trait-complex
organized research (e.g., see Ackerman, 1996, 2000; Ackerman, Bowen, Beier, & Kanfer, 2001; Ackerman,
Chamorro-Premuzic, & Furnham, 2011).6 For example, this historical research would serve to remind
contemporary assessment personnel that aptitude-achievement relations are not readily captured in simple
linear relations (and figures) and often require interactions and the conceptualization of relations in
multidimensional hyperspace (see Snow, 1987). To advance this idea , I suggest the various third-method
SLD models be considered attempts to understand and measure cognitive-aptitude-achievement trait
complexes. Borrowing liberally from Ackerman (Ackerman, 1997; Beier & Ackerman, 2005), who in turn
drew from the seminal work of Cronbach (1967) and Snow (1989), a trait complex is defined in the most
general sense as “sets of traits that combine to affect some type of outcome…the sets of traits are
sufficiently interrelated to suggest exploration of mutually causal interdependencies” (Ackerman, 1997, p.
187). This definition is consistent with the definition in the Shorter Oxford English Dictionary (Brown,
2002), which defines the noun complex as “1. A complex whole; a group of related elements…2.
Chemistry. A substance or species formed by the combination of simpler ones” (p. 468, bold in original).
In the current context, I define a cognitive-aptitude-achievement trait complex (CAATC) as a constellation
or combination of related cognitive, aptitude, and achievement traits that, when combined together in a
functional fashion, facilitate or impede the acquisition of academic learning. I will return to CAATCs
later—in the form of exploratory data analyses that may offer hope for better measuring, describing, and
explaining school learning—with implications for revisions of current third-method SLD identification
models.
6 The use of this broader context also serves as a necessary reminder (and link to research) that one of the primary goals of cognitive-aptitude-achievement testing is the identification of aptitude-treatment-interactions (ATIs) that can inform instructional interventions (see Corno et al., 2002).

Implications of 20 Years of CHC COG-ACH Research – Kevin S. McGrew – 12-18-12 draft 14
CHC-Selective, Referral-Focused Assessment Strategies
A General CHC-Selective, Referral-Focused Assessment Approach
Given the CHC v2.0 model and CHC COG�ACH relations research synthesis summarized in Figure 2, it
is now possible for the field of school-based cognitive assessment to move toward more flexible selective,
referral-focused assessment (SRFA) approaches. Unfortunately, linear constraints of the written word
combined with the heterogeneous universe of possible learning problems in the sphere of human
experience do not allow for the presentation of multiple SRFA scenarios. Instead, two fictitious examples
(see Figure 4) are presented to demonstrate how the information summarized in Figure 2 can be used.
--------------------------------------------------------
Insert Figure 4 about here.
--------------------------------------------------------
Figure 4 presents the assessment logic for a student who is 7 years of age and who is referred for
continuing problems in basic reading skills (BRS) acquisition.7 In both scenarios, all relevant domain-
general and domain-specific abilities listed for BRS (see Figure 3) are considered in the selection of
possible tests to administer by the examiner during Stage 1. It should be noted in Figure 4 that not all
possible WJ III tests associated with BRS (see Figure 2) are listed during Stage 1 of the assessment
scenario. The more detailed age-based summaries provided by McGrew and Wendling (2010) were
consulted to select the initial pool of possible tests to administer in Stage 1 of the SRFA process. In both
scenarios, the decision was made to administer eight WJ III tests (identified by black flags) that correspond
to the CHC domains designated on each branch of the figure. Given that referral and background
information suggested a possible language–Gc deficit, the examiner decided to measure at least three
narrow CHC abilities via the selection of three WJ III Gc tests (Verbal Comprehension, Oral
Comprehension, and Picture Vocabulary). These three tests provided indicators of of domain-general
language development (Gc-LD) and listening ability (Gc-LS), and domain-specific lexical knowledge (Gc-
VL). Also, given that the WJ III Picture Vocabulary test can be considered a pictorial general verbal
information test (McGrew, 1986, 1994), the examiner decided not to administer the WJ III General
7 This figure is not intended to represent the figure or flow chart to follow in a lockstep manner. It is a visual schematic intended to represent the underlying logic for explanatory purposes.

Implications of 20 Years of CHC COG-ACH Research – Kevin S. McGrew – 12-18-12 draft 15
Information test at Stage 1. Rather, the Picture Vocabulary score at Stage 1 would guide the examiner’s
decision whether to administer General Information during Stage 2 of the assessment. Reflecting an
awareness of the age-based findings of McGrew and Wendling (2010), where both associative memory
(Glr-MA) and naming facility (Glr-NA, similar to rapid automatized naming [RAN], or speed of lexical
access) are significantly related to BRS achievement, two WJ III Glr tests were selected for administration
(Visual-Auditory Learning and Rapid Picture Naming). Finally, the domain-general abilities of perceptual
speed (Gs-P [WJ III Visual Matching]) and working memory (Gsm-MW [Numbers Reversed]) and the
BRS domain-specific ability of phonetic coding (Ga-PC [a.k.a., phonemic awareness, WJ III Sound
Blending]) were selected to be administered. This collection of eight WJ III tests, based on the CHC
COG�ACH information summarized in Figure 1, represents the most time-efficient and BRS-targeted set
of CHC narrow cognitive ability WJ III tests for taking a first look at the student during Stage 1 of SRFA.
As designated in Figure 4 by the downward pointing arrows, this hypothetical subject displayed
relative deficits on the WJ III Verbal Comprehension, Oral Comprehension, and Picture Vocabulary tests
when scores were compared to a complete set of SRFA Stage 1 tests. Relative strengths are noted in Gsm-
MW, Glr-MA/NA, Gs-P, and Ga-PC, suggesting the hypothesis that the student’s difficulties are likely not
related to cognitive CHC deficits in these domains. These fictitious results suggest a broad Gc deficit as
indicated by weaknesses in language development, listening ability, and lexical knowledge. As noted in
Figure 4, the examiner is then faced with the Stage 2 decision whether to consider administering additional
WJ III tests to verify this hypothesized broad Gc deficit (e.g., General Information or Academic
Knowledge for general [verbal] information, Understanding Directions for listening ability). If sufficient
other test information, parent and teacher reports (e.g., Children’s Psychological Processes Scale [CPPS],
Dehn, 2012), and school records provide additional convergent evidence of a broad language–Gc deficit, it
would not be unreasonable for an examiner to stop additional Gc testing and generate the hypothesis of a
broad Gc deficit as contributing to the student’s BRS learning difficulties. However, if the examiner was
not convinced or it was determined that it was important to gather more detailed information for making
within-Gc narrow ability comparisons, then the four tests listed in Stage 2 might be considered.

Implications of 20 Years of CHC COG-ACH Research – Kevin S. McGrew – 12-18-12 draft 16
Scenario 2 illustrates how a different pattern of cognitive strengths and weaknesses (after Stage 1)
for another seven year old student would lead to a different Stage 2 question and SRFA strategy. In this
scenario, relative strengths were suggested in Gc, Gsm-MW, Gs-P, and Ga-PC. Hypothesized Glr-related
deficits were suggested, in associative memory and naming facility. The weakness on the WJ III Picture
Vocabulary test could also be consistent with the initial hypothesis of long-term storage and retrieval
deficits, as this test requires a subject to look at pictures and retrieve from their lexicon the appropriate
name for the picture. As noted in the Stage 2 portion of this scenario, initial test results suggest the Gc
problems reported by school personnel do not appear related to lack of language abilities or limitations in
the student’s breadth of vocabulary or general information. Rather, they suggest that the presenting learning
behaviors may be more related to problems in storing newly acquired Gc knowledge or in problems with
efficient retrieval. In contrast to Scenario 1 where, at Stage 2, further assessment was focused primarily on
additional confirmation evidence of a highly probably broad Gc deficit, Stage 2 (in Scenario 2) is still
focusing on generating a hypothesis about cognitive deficits that likely need further exploration. As can be
seen in Figure 3, additional SRFA would appear wise to investigate and compare this student’s associative
memory (WJ III Memory for Names) and naming facility (WJ III Retrieval Fluency and Decision Speed).
Depending on the Stage 2 results, the examiner may feel confident in forming a hypothesis regarding this
particular student’s pattern of cognitive strengths and weakness and discontinue formalized testing or, if
necessary, enter a third iteration of assessment by supplementing the WJ III Glr-MA/NA tests with tests of
these abilities from other assessment batteries (Flanagan, Ortiz, & Alfonso, in press; Flanagan, Ortiz,
Alfonso, & Mascolo, 2006).
These two hypothetical examples do not cover the entire array of possible test patterns that may
emerge after Stage 1 or some that might take the Stage 2 assessment into other domains (e.g., phonemic
awareness, working memory, processing speed). If the assessment is only to aid instructional hypothesis
generation, the testing completed (as described above) may be sufficient to suggest evidence-based
interventions that are then monitored with curriculum-based methods. If eligibility for SLD services is
under consideration, it might be possible for the examiner to conclude from the pool of all administered
tests that the individual’s relative strengths provide sufficient evidence of average or normal cognitive
abilities, a requirement for SLD diagnosis. If not, the examiner may need to engage in additional SRFA

Implications of 20 Years of CHC COG-ACH Research – Kevin S. McGrew – 12-18-12 draft 17
with WJ III tests that are good proxies for general intelligence, and more importantly, are tests of abilities
that are less related to BRS learning problems. A review of less BRS-salient CHC domains in Figure 3
suggests that the best candidate strength tests for this hypothetical case might come from the CHC Gf
domain.
CHC-Consistent, Aptitude-Selective, Referral-Focused Assessment: Back to the Future
The third-method approach to SLD identification has been advanced primarily by Flanagan and colleagues
(2006, 2011, in press), as well as Hale and colleagues (Hale, Wycoff, & Fiorello, 2011) and Naglieri (2011)
(see Flanagan, Fiorello, and Ortiz, 2010, for an overview and discussion). A central concept of the third-
method SLD models is that an individual with a possible SLD must demonstrate cognitive deficits that are
empirically or theoretically established as being those most related to the achievement domain where the
person is experiencing their primary achievement difficulties. That is, the individual’s cognitive domain-
general or domain-specific deficits are consistent or concordant with the person’s academic deficits in the
context of other cognitive and achievement strengths that suggest strengths in non-SLD areas (i.e., a
consistent pattern of strengths and weaknesses [PSW]).
Inherent in these SLD models is the notion of aptitude-achievement consistency or concordance.
This use of “aptitude” is consistent with the previously defined notion of cognitive aptitude for a specific
academic domain, hereafter called scholastic aptitude.8 It is important to note that aptitude is not the same
as general intelligence and is not a CHC cognitive ability trait—it is a combination or complex of cognitive
abilities that best predict a specific achievement domain. For reading and math, these are the domain-
general and domain-specific CHC narrow abilities summarized in Figure 3.
Back to the Future vis-à-vis Scholastic Aptitude Measures. The importance of scholastic
aptitude as a core component of the consistency models of SLD assessment and identification, in many
respects, is a call to go “back to the future.” The WJ (Woodcock & Johnson, 1977) and WJ-R (Woodcock
& Johnson, 1989) batteries both included scholastic aptitude (SAPT) clusters as part of the WJ/WJ-R
pragmatic decision-making discrepancy model (McGrew, 1986, 1994; Woodcock, 1984). Of particular
8 The term scholastic aptitude is used instead of academic aptitude to afford continuity with early attempts to provide differential academic aptitude clusters in the WJ and WJ-R—measures that were called Scholastic Aptitude clusters.
Implications of 20 Years of CHC COG-ACH Research – Kevin S. McGrew – 12-18-12 draft 18
relevance was the WJ and WJ-R Type I aptitude-achievement discrepancy, which provided a discrepancy
between obtained and expected achievement (a prediction based on curriculum-specific SAPTs). The
original WJ and WJ-R SAPTs were not presented as part of the explicitly defined comprehensive
discrepancy-based consistency–concordance SLD identification models as advanced by Flanagan et al.
(2006, 2011, in press), Hale et al. (2011), and Naglieri (2011). Instead, the original SAPTs were presented
as part of a general psychoeducational pragmatic decision-making model. However, it is clear that the WJ
and WJ-R SAPTs were ahead of their time because, philosophically, they now align with the aptitude
portion of the aptitude-achievement consistency–concordance component of contemporary SLD models.
The WJ SAPTs were differentially weighted combinations of the four best cognitive tests that
predicted reading, math, writing, or knowledge. The differential weights were the same across all age
ranges. For example, the WJ Reading Aptitude cluster was a differentially weighted combination of
Antonyms-Synonyms (Gc-LD/VL: .42), Visual-Auditory Learning (Glr-MA: .23), Analogies (Gc-LD/VL:
.18), and Blending (Ga-PC: .17). The WJ Math Aptitude cluster was a differentially weighted combination
of Antonyms-Synonyms (Gc-LV: .39), Analysis-Synthesis (Gf-RG: .27), Visual Matching (Gs-P: .26), and
Concept Formation (Gf-I: .08). In the WJ-R, the SAPTs were equally weighted, four-test combinations.
Although derived primarily via the atheoretical empirical power of multiple regression statistical models,
the specific CHC abilities included in the WJ Reading and Math SAPTs demonstrate overlap with the
critical CHC cognitive abilities listed for reading and math in Figure 2. As articulated by McGrew (1986)
when discussing the Woodcock-Johnson Tests of Cognitive Abilities (WJTCA), “because of their
differential weighting system, the [Woodcock-Johnson Tests of Cognitive Abilities] WJTCA Scholastic
Aptitude clusters should provide some of the best curriculum-specific expectancy information available in
the field of psychoeducational assessment” (p. 217). When discussing the Woodcock-Johnson Tests of
Cognitive Abilities—Revised (WJTCA-R) SAPTs, McGrew (1994) reiterated “the purpose of the WJTCA-
R differential aptitude clusters is to provide predictions of current levels of achievement. If a person
obtains low scores on individual tests that measure cognitive abilities related to a specific achievement area
and these tests are included in the aptitude cluster, then the person’s current achievement expectancies
should also be lowered. This expectancy information will be more accurately communicated by the
narrower WJTCA-R different aptitude clusters than by any broad-based score from the WJTCA-R or other

Implications of 20 Years of CHC COG-ACH Research – Kevin S. McGrew – 12-18-12 draft 19
tests” (p. 223, italics in original). Woodcock (1984), in a defense of the SAPTs in School Psychology
Review, made it clear that the composition of these clusters was to make the best possible aptitude-
achievement comparison. Woodcock stated that “the mix of cognitive skills included in each of the four
scholastic aptitude clusters represents the best match with those achievement skills that could be obtained
from the WJ cognitive subtests” (p. 359).
The value of the WJ and WJ-R SAPTs was not fully appreciated largely due the dominant IQ–
ACH discrepancy model that constrained assessment professionals from using the SAPTs as intended
(McGrew, 1994). This, unfortunately, led to their elimination in the WJ III and replacement with the
Predicted Achievement (PA) option, which provided achievement domain-specific predictions of
achievement based on the age-based optimal weighting of the seven individual tests that compose the WJ
III GIA-Standard (GIA-Std) cluster. Although the WJ III PA option is a stronger predictor of achievement
than the WJ III GIA-Std, the PA option never captured the attention of assessment professionals and tends
to be atheoretical—and thus not intuitively understandable to clinicians. In a sense, the field has now
caught up with the WJ/WJ-R operationalization of SAPTs.
Intelligent Test Design (ITD): Developmental-Sensitive, CHC-Consistent Scholastic Aptitude
Clusters
WJ/WJ-R type SAPTs could now serve an important role in contemporary aptitude-consistency SLD
models. With advances in CHC theory and measurement and computerized test scoring, it is now possible
to develop better SAPTs for SLD identification and other purposes—what I call developmental-sensitive
CHC-consistent scholastic aptitude clusters, an example of a more “intelligent” intelligence test design
(ITD) principle. I next use the WJ III norm data to illustrate an ITD approach to the development of CHC-
consistent SAPTs because (a) as a coauthor, I have ready access to the complete data set, (b) over 90% of
the extant CHC COG�ACH research has been based on the WJ-R or WJ III, and (c) the WJ III includes
the most complete array of individual tests that sample from the widest array of CHC domains relevant to
academic achievement. The WJ III norm data for all subjects from ages 5 through 18 were used in the
analyses described next.

Implications of 20 Years of CHC COG-ACH Research – Kevin S. McGrew – 12-18-12 draft 20
Developmental-Sensitive CHC-Consistent Scholastic Aptitude Clusters. Prior WJ-R/WJ III
CHC COG�ACH research has demonstrated systematic developmental relations between WJ-R/WJ III
cognitive clusters and achievement (Floyd, McGrew, & Evans, 2008; McGrew, 1993; McGrew & Hessler,
1995). This is consistent with the conclusions of McGrew and Wendling (2010) and indicates that CHC-
consistent SAPTs should incorporate this developmental information. More important, these prior studies
provide an ITD approach to capture the age-nuanced CHC COG�ACH relations. The ITD procedures
described below for the prediction of the WJ III Basic Reading Skills cluster are the same procedures used
in the prediction of WJ III Math Reasoning.
All WJ III individual tests (that were classified as measuring CHC narrow abilities related to basic
reading skills as summarized in McGrew and Wendling, 2010) served as the initial pool of potential
predictor tests. CHC theory and logic-based multiple regression models were crafted. First, all tests in the
initial predictor pool were entered into a single, full multiple-regression model. Next—instead of running a
software application to implement automatic backward or forward multiple regression stepping of test
variables—an author-controlled backward elimination of predictor/test-predictor strategy occurred. Tests
with high negative loadings were eliminated one-by-one, and the output inspected after each step.9 Tests
that were nonsignificant in the prediction of BRS were then eliminated one at a time. After a final pool of
statistically significant contributors to the BRS model remained, previously eliminated tests that theory,
research, or partial correlation monitoring suggested as potentially related to BRS were reentered (one at a
time) to insure they were still not significant predictors that should have been retained in the final model.
Multiple iterations of this test predictor reentry process occurred before the BRS prediction model was
finalized. Six tests were retained in the BRS model based on the entire sample of 5 through 18 year olds:
Verbal Comprehension, Sound Awareness, Numbers Reversed, Visual Matching, Sound Blending, and
Visual-Auditory Learning.10
9 The partial correlations for all tests after each step were closely monitored to identify tests that may have been “bridesmaid” predictors—i.e., would likely have stayed in the model if another test with which the bridesmaid test was highly correlated had not been present. 10 In the Math Reasoning regressions, the WJ III Number Series test eliminated from the initial pool of potential predictor variables given that the Quantitative Concepts test in the Math Reasoning cluster includes some number series items.

Implications of 20 Years of CHC COG-ACH Research – Kevin S. McGrew – 12-18-12 draft 21
Next, thirteen separate multiple regression models were run at each age from ages 5 through 18.
The standardized regression coefficients for each predictor were plotted as a function of age. The plotted
raw standardized coefficients demonstrated clear systematic developmental trends, but with noticeable
“bounce” due to sampling error. Smoothed curves, using a nonlinear smoothing function through the plot of
each set of age-specific standardized regression coefficients, were generated. The smoothed curves
represent the best estimate of the population parameters. This technique of smoothing sample values to
estimate population parameters has been used previously in a variety of studies (see McGrew, 1993, and
McGrew & Wrightson, 1997) and was employed in the development of WJ III GIA-Standard and GIA-
Extended g-weighted clusters and the developmental-sensitive WJ III Predicted Achievement (PA) score
(McGrew & Woodcock, 2001). The raw and smoothed results for Verbal Comprehension and Visual-
Auditory Learning are presented in Figure 5 for illustrative purposes. The raw, standardized coefficients
demonstrate sampling error bounce, but visual inspection suggests clear developmental trends. The
smoothed curves are interpreted as the best estimates of the population parameters for Verbal
Comprehension and Visual-Auditory Learning from ages 5 through 18. It is clear that the relative
importance of Verbal Comprehension and Visual-Auditory Learning increase and decrease systematically,
respectively, as a function of age. Figures 6 and 7 present the final smoothed results for the CHC-consistent
SAPT tests for the prediction of the WJ III Basic Reading Skills and Math Reasoning clusters.
-------------------------------------------------------
Insert Figure 5–7 about here.
--------------------------------------------------------
There is much that can be discussed from a review of Figures 6 and 7. The most salient
conclusions are:
• SAPTs require a mixture of domain-general and domain-specific CHC cognitive abilities. The
composition of CHC-consistent SAPT clusters make theoretical and empirical (CHC
COG�ACH research synthesis, see Figure 3) sense. For example, Gc-LD/VL (Verbal
Comprehension) is a domain-general predictor as it is salient for BRS and MR at all ages and
systematically increases in importance with age. In BRS, visual-auditory-paired associative

Implications of 20 Years of CHC COG-ACH Research – Kevin S. McGrew – 12-18-12 draft 22
memory (Visual-Auditory Learning [Glr-MA]) is very important during the early ages (ages
6–9), but then disappears from importance in the prediction model. Visual-Auditory Learning
(Glr-MA) is not in the MR model. Glr-MA, as measured by Visual-Auditory Learning, is
classified as a BRS domain-specific ability. Gf abilities (quantitative reasoning [RQ], Number
Matrices; general sequential reasoning [RG], Analysis-Synthesis) are important throughout all
ages when predicting math reasoning achievement. In fact, both increase in relative
importance with age, particularly for the measure of Gf-RQ (Number Matrices). These two Gf
tests are absent from the BRS model, which defines them as MR domain-specific abilities.
Instead of measures of Gf, measures of Ga abilities (Sound Blending, Sound Awareness) are
BRS domain-specific abilities. Gs and Gsm-MW (domain-general cognitive efficiency
variables) are classified as domain-general since they are present in both the BRS and MR
models.
• Developmental trends are critically important in aptitude-achievement comparisons. The age-
based plots (see Figures 6 and 7) provide a more precise picture of the developmental nature
of the relations between CHC abilities and achievement than the McGrew and Wendling
(2010) and Flanagan and colleagues reviews (2006, 2011). The current findings suggest, when
selecting tests for SRFA, it is crucial that examiners know the developmental nature of CHC
COG�ACH relations research. The fact that some specific narrow CHC tests show such
dramatic changes across age suggests that those who implement an aptitude-achievement
consistency–concordance SLD model must be cautious and not use a “one size fits all”
approach when determining which CHC COG abilities be examined for the aptitude portion
of the consistency model. An ability that may be very important at certain age levels may not
be as important at other age levels (e.g., Visual-Auditory Learning in the WJ III BRS aptitude
cluster).
• SAPTs are better predictors of achievement than g-based composites. The amount of
explained variance (multiple R-squared, see Tables in Figures 6 and 7) is higher for the CHC-

Implications of 20 Years of CHC COG-ACH Research – Kevin S. McGrew – 12-18-12 draft 23
consistent SAPT clusters when compared to the WJ III General Intellectual Ability (GIA-Std)
clusters. This is particularly true at the oldest ages for MR.11
• SRFA requires three-way interaction thinking. The above results reinforce McGrew and
Wendling’s (2010) conclusion that development of more “intelligent” SRFA strategies
requires a recognition of the three-way interaction of CHC abilities X achievement domains X
age (developmental status).
It is time to consider bringing the SAPTs back...back to the future. The logic of their design is a
nice fit with the aptitude component of the aptitude-achievement consistency–concordance SLD models.
The field is now ready for this type of conceptualized and developed measure. However, the original
concept can be improved upon via two new ITD procedures:
• Test developers should utilize the extant CHC COG�ACH relations literature when selecting
the initial pool of tests to include in the prediction models. This extant research literature
should also guide the selection of variables in the final models. The models should not be
driven by raw empiricical prediction. This varies from the WJ and WJ-R SAPTs, which were
designed primarily based on empirical criteria, although their composition often made
considerable theoretical sense when viewed via a post hoc CHC lens. Test batteries that do
not include indicators of all major achievement-relevant cognitive domains (e.g., Glr, Ga, and
Gs are missing from some individually administered cognitive test batteries) will have a hard
time developing CHC-consistent SAPTs. Test developers or independent researchers will
need to explore means by which supplemental indicators of missing key CHC SAPT-
important tests might be statistically linked to the other tests in these more limited CHC
batteries. This problem also holds for the WJ III, albeit to a lesser extent, when SRFA requires
“drilling down” deeper into certain narrow CHC cognitive ability domains.
11 Of course, these values capitalize on chance factors due to the sample-specific nature of multiple regression procedures and would likely shrink somewhat in independent, sample cross validation. However, the results are consistent with prior reviews of the superior predictive ability of WJ/WJ-R SAPTs when compared to WJ/WJ-R g-based composite scores as well as composites from earlier editions of the Wechsler batteries, SB, and KABC (McGrew, 1986, 1994).

Implications of 20 Years of CHC COG-ACH Research – Kevin S. McGrew – 12-18-12 draft 24
• Provide age-based developmental weighting of the tests in the different CHC-consistent
SAPTs. The authors of the WJ III demonstrated the necessary technology to make this
possible when they implemented age-based, differential-weighted GIA g and Predicted
Achievement scores in the WJ III computer scoring software (Woodcock-Johnson III
Normative Update [WJ III NU] Compuscore® and Profiles Program [Compuscore], Schrank
& Woodcock, 2007). The same technology can be applied to the development of CHC-
designed SAPTs with developmental shifting weights (per the smoothed curves in the models
above). For WJ III users, the WJ III NU-based Compositator program (Schneider, 2010) can
be used to develop CHC-consistent SAPTs within the WJ III battery; although, the age-based
correlation matrices that serve as the program’s software engine are not provided in single-
year increments, but rather mirror that broader age range reported for the WJ III test
intercorrelations as reported in the WJ III NU technical manual (McGrew & Woodcock,
2001; McGrew, Schrank, & Woodcock, 2007).
A CHC-Consistent SAPT SRFA Strategy. The composition of the example WJ III BRS and MR
SAPTs suggests another wrinkle for SRFA. Instead of pursuing the General CHC SRFA Approach
described previously (see Figure 3 and 4 and related text for BRS example), examiners could choose to
administer the six BRS SAPT tests presented in Figure 6 during Stage 1 of the assessment process. This
would provide the most time-efficient initial assessment that would include indicators of the key BRS
CHC-related cognitive abilities. Examiners would then examine the relative pattern of strengths or
weaknesses within the initial six tests and continue per the logic and methods described previously with
regard to the example presented in Figure 4. Of course, the six BRS SAPT tests could be supplemented at
Stage 1 with additional tests based on available referral and background information.
An additional advantage, aside from time-efficient SRFA, would be the ability to generate
predicted or expected achievement scores that could then be evaluated for statistical significance to
determine aptitude-achievement consistency (or the aptitude-achievement component of the BRS
cognitive-aptitude-achievement trait complex described later in this paper) as used in contemporary
consistency SLD models. Currently, if one is using the WJ III battery, the Compositator (Schneider, 2010)

Implications of 20 Years of CHC COG-ACH Research – Kevin S. McGrew – 12-18-12 draft 25
program could serve this function. Hopefully, in the future, intelligence test developers will include a broad
array of tests that measure the most important narrow CHC COG�ACH relations, or statistical links to
supplemental co-normed batteries, that would allow for CHC-consistent SAPT construction across co-
normed or equated batteries.
CHC COG����ACH Relations: Concluding Comments—ITD and Back to the Future
The dethroning of the imperial IQ–Achievement discrepancy model of SLD identification, combined with
(a) the emergence of the CHC taxonomy of cognitive abilities, (b) the publication of a variety of cognitive
intelligence batteries that are either implicitly or explicitly grounded in (or can be interpreted from) CHC
theory, and (c) the emergence of CHC COG�ACH research synthesis (which indicates school-learning-
related cognitive assessments should focus primarily on narrow CHC abilities) provide opportunities for
assessment professionals to go “back to the future” to embrace “intelligent” intellectual assessment.
Assessment professionals can throw off the shackles of the knee-jerk “give everyone a standard or
complete IQ battery” mentality and, instead, embrace a CHC SRFA assessment strategy.
SRFA assessment is consistent with Alan Kaufman’s “intelligent testing” approach, first
articulated in 1979. The intelligent testing skill set requires the combination of knowledge of clinical
principles and expertise in understanding the quantitative features of each individual test in an intelligence
battery (e.g., reliability, specificity, g-loadings, different theoretical interpretations, CHC COG�ACH
relations, etc.). This demands “a very high standard of clinical expertise” (Fletcher-Janzen, 2009, p. 16) as
the model requires the bringing together of “empirical data, psychometrics, clinical acumen, psychological
theory, and careful reasoning to build an assessment of an individual leading to the derivation of an
intervention to improve the life circumstances of the subject” (Reynolds, 2007, p. 1133). The CHC
COG�ACH research synthesis summarized here and elsewhere (Flanagan et al., 2006; McGrew &
Wendling, 2010) provides a crucial missing link to the intelligent testing approach that, for years, was
handicapped by (a) the lack of a comprehensive taxonomy of human cognitive abilities (CHC theory) by
which to study cognitive-achievement relations, (b) the lack of applied intelligence batteries that sampled a
sufficient range of CHC abilities related to academic achievement (e.g., the WISC-R, which dominated the
early years of SLD research, did not include measures of Glr, Ga, and Gf, abilities that have been reported

Implications of 20 Years of CHC COG-ACH Research – Kevin S. McGrew – 12-18-12 draft 26
to be significantly related to reading or math achievement), and (c) dominant research methods that focused
primarily on prediction and the incremental partitioning of variance (e.g., multiple regression) and not on
explanation and causal relations (e.g., structural equation modeling) (McGrew, Flanagan, Keith, &
Vanderwood, 1997).
The above developments, as well as the recent emphasis on aptitude-achievement consistency in
third-method SLD models, also beckons assessment professionals to go “back to the future”—to embrace
Woodcock’s (1984) concept SAPTs, a measurement option first operationalized in the individually
administered WJ cognitive-achievement battery and then the WJ-R. Use of ITD principles, as demonstrated
by the developmental-sensitive CHC-consistent SAPTs, can now provide the best possible academic
expectancy information available from contemporary cognitive test batteries.
Beyond CHC Theory
The astute reader may recognize the hypocrisy in the above criticism of pre-CHC COG�ACH research
(for its reliance on multiple regression prediction models) and my presentation of CHC-consistent SAPTs
built on the statistical machinery of multiple regression methods. Guilty as charged. In my defense, it is
important to note that the construction of proposed multiple-regression-based, developmental-sensitive
CHC-consistent SAPTs was not turned over to the blind automatic variable entry and removal stepping
algorithms of multiple regression software. Instead, they were designed via theory and research-driven
considerations at each step in the process (i.e., ITD). Nevertheless, everything presented above is most
likely wrong—to some extent.
Why? Because using linear models to represent the nonlinear nature of reality is bound to
represent inaccurately the real-world reality of the complex interactions between cognitive-aptitude-
achievement trait complexes. Horn and Noll (1997), when discussing the limitations of linear factor
analysis methods to define cognitive ability taxonomies, make this important point (which is also relevant
to studying cognitive-aptitude-achievement trait complexes) when they state:

Implications of 20 Years of CHC COG-ACH Research – Kevin S. McGrew – 12-18-12 draft 27
A fundamental limitation of any theory built on a rectilinear system of factors is
that it is not of a form that well describes natural phenomena. It is thus unlikely to
be fully adequate. It is a system that can accurately describe rectangular structures
built by humans…but not the rounded and irregular structures of mother nature.
The phenomena of nature are not usually well described by the linear equations of
a Cartesian coordinate system….The equations that describe the out structure and
convolutions of brains must be parabolas, cycloids, cissoids, spirals, foliums [sic]
exponentials, hyperboles, and the like. (p. 84)
I have tried to embrace Horn and Noll’s (1997) characterization of human abilities as being
inadequately described by linear statistical models and methods. Although not completely free from the
shackles of linear models, I have attempted to move beyond CHC by applying more complex interacting
linear CHC COG�ACH causal structural equation modeling (SEM) as well as moving beyond the
statistical constraints of factor analysis methods via the use of more historical (and underutilized) data
analysis tools such as cluster analysis and multidimensional scaling (MDS) (McGrew, 2005; Schneider &
McGrew, 2012). Two sets of my “back to” and “beyond” analyses are presented next. The first set is an
investigation that integrated CHC theory with information processing (IP) research. The second set was the
search for CHC cognitive-aptitude-achievement trait complexes, a journey that resulted in the serendipitous
discovery of a potentially new conceptual twist for SLD identification models based on the configurations
of a person’s cognitive, aptitude, and achievement strengths and weaknesses.
Beyond CHC: CHC COG����ACH Information Processing (IP) Causal Models
Drawing on the intriguing IP + psychometric research that has explored the relation between working
memory (MW) and higher-order cognition, a research topic that has “occupied researchers for the past 20
years” (Kane, Bleckley, Conway, & Engle, 2001, p. 169), I previously published the results of WJ III norm
sample-based causal models that investigated the relations between measures of information processing
efficiency (viz., Gs, Gsm-MS, and Gsm-MW) and complex cognitive ability (operationalized in the form of
g) (McGrew, 2005). The results were consistent with the previously summarized working memory�g
research literature. Across five age-differentiated WJ III norm samples, the working memory�g direct

Implications of 20 Years of CHC COG-ACH Research – Kevin S. McGrew – 12-18-12 draft 28
effect path ranged from .73 to .93. Clearly, working memory was interpreted as exerting a large causal
effect on complex cognitive performance, which was defined by a latent g-factor based on the combination
of five latent CHC factors (i.e., Gf, Gc, Glr, Ga, Gv). Also of interest was the finding, consistent with
research on the developmental cascade hypothesis (Fry & Hale, 1996, 2000), that Gs did not demonstrate a
direct effect on g in the childhood samples. However, starting at late adolescence, Gs begins to demonstrate
small, yet significant, direct effects on g and a much more substantial effect at middle childhood and
beyond. A beyond-CHC extension of these original CHC–IP analyses is the exploration of causal models
that add achievement-dependent variables to the CHC–IP models. A few illustrative models are presented
next.
Figure 8 presents the results from an illustrative CHC–IP COG�ACH causal SEM for WJ III
norms subjects from ages 6 through 8 years of age. The g + Gs + Ga�word attack model suggests that
understanding the acquisition of word attack skills may require an understanding of a variety of direct and
indirect effects (mediated via other abilities) for the cognitive abilities of general intelligence (g),
processing speed (Gs), memory span (Gsm-MS), working memory (Gsm-MW), and auditory processing
(Ga).12 The effect summary table (see Figure 8) suggests that g (.59), working memory (Gsm-MW: .54),
and processing speed (Gs: .59) are most relevant to understanding the development of word attack skills.
Although lower, the total effects for memory span (Gsm-MS: .34) and auditory processing (Ga: .27)
implicate these abilities in understanding word attack skill performance. This is a much more complex
model for explaining or predicting a component of basic reading skills (viz., word attack) when compared
to the simple multiple regression SAPT model (see Figure 6). Also, it is important to note that the model fit
of this was not practically different from the more parsimonious g�Word Attack (.73) model.
-------------------------------------------------------
Insert Figure 8 about here.
--------------------------------------------------------
12 Although the use of the inferential fit statistics are inappropriate due to the previously described exploratory model generation methods used, for the record, select model fit statistics for the model in Figure 8 were GFI = .93, AGFI = .91, PGFI = .74, and RMSEA = .055 (.051 – .058). A model with a single path from g to word attack produced a direct g effect of .73 and model fit statistics that are nearly equivalent (GFI = .90, AGFI = .91, PGFI = .73, RMSEA = .069 [.066 – .073]).

Implications of 20 Years of CHC COG-ACH Research – Kevin S. McGrew – 12-18-12 draft 29
When the criterion latent factor was basic reading skills (BRS), fewer non-g paths were significant
in two equally plausible alternative g + models.13 In the g�BRS model, the g direct effect was .81. An
alternative g + Gs�BRS model produced a g direct effect of .64 plus a direct Gs effect of .24. In the
second alternative BRS model, (g + MW�BRS), the direct g effect decreased to .38 while a much larger
MW direct effect was found (.44). A similar pattern was found when models were specified with letter-
word identification (LWID) being the criterion latent variable. In the g�LWID model, the direct g effect
was .76. The direct g effect decreased to .58 in the alternative g + MW�LWID model, with the Gs direct
effect being .25. An equally plausible g + MW�LWID model produced a direct g effect of .28 and a direct
MW effect of .50.
Although the amount of model “tinkering” that occurs to obtain good model fits is often not
reported and is typically unknown (Horn, 1989), I admit the above models are ripe with ad hoc model
tweaking and tinkering. The more complex models violate Occam’s razor (the law of parsimony), which
would typically result in the rejection of the model in Figure 8 (as well as all other g + �ACH models
presented earlier in this paper) in favor of a single g�word attack model. Nevertheless, I cautiously
resonate to the position of Stankov, Boyle, and Cattell (1995) who stated, within the context of research on
human intelligence that “while we acknowledge the principle of parsimony and endorse it whenever
applicable, the evidence points to relative complexity rather than simplicity. Insistence on parsimony at all
costs can lead to bad science” (p. 16).
The power of the inferential fit statistics for these reported causal models has been neutered—and
I did it willingly. The above analyses are presented as illustrations of new ideas and approaches I hope
others will pursue. According to John Horn (1989), Lloyd Humphries was the first to describe factor
analysis as “little more than efforts to slice smoke” (p. 38). But, Horn extended the slicing smoke metaphor
by saying that “it is reasonable, however, to fan smoke in ways that are meaningful and useful” (p. 37), and
“it is possible to move smoke around in ways that show we know where it is” (p. 38). The CHC–IP
COG�ACH causal models presented above should be viewed as intelligent, well-reasoned attempts to
move and fan the smoke of COG�ACH relation research. This initial attempt indicates the need for CHC
13 The fits statistics for the models described in this paragraph are not presented. The findings were very similar to those reported for the word attack models with the various models not being practically different.

Implications of 20 Years of CHC COG-ACH Research – Kevin S. McGrew – 12-18-12 draft 30
COG�ACH relations research to go beyond simple linear models. Yes, causal SEMs are based on a
system of linear equations, so the nonlinear nature of reality is not adequately captured. Yet, it is possible to
specify models that are more complex and that would include interaction terms, nonlinear effects, age
(developmental) variables, models without g, and models with causal relations between and among the
narrow–broad cognitive and achievement abilities (e.g., see Benson, 2008;). Schneider and McGrew (2012)
and Floyd and Kranzler (2012) have presented conceptual CHC–IP models or frameworks that would be
good starting points from which to specify more dynamic CHC–IP COG �ACH causal models. Moving
beyond CHC requires both looking beyond the linear, factor-based model via the incorporation of research
from other areas (e.g., information processing and neurocognitive research) and also moving beyond
traditional (and largely linear) research methods to capture better the real-world nuances of CHC
COG�ACH relations.
Although models similar to the CHC–IP COG�ACH causal model presented in Figure 8 can
suggest abilities–tests that may be most relevant to SRFA, integration of such models in SLD identification
models requires much additional development and innovation. One intriguing possibility is assessing the
degree to which an individual’s pattern of test scores conforms to or is a variance from a norm-group-
validated CHC–IP COG�ACH causal model (like the one in Figure 8). The predominant use of fit indices
in CFA and SEM has been to evaluate the fit of a model in a sample of data or across multiple sample
groups. However, techniques have been suggested for the development of SEM person-fit (Reise &
Widaman, 1999). I would encourage those with quantitative skills much better than mine to explore the
development of applied methodology that would allow for the evaluation of whether the configuration or
pattern of a person’s cognitive and achievement test scores are consistent, or at variance with, a validated
normative CHC–IP COG�ACH model. Even more exciting would be the development of person-to-SEM
fit metrics that could suggest which causal paths (e.g., Ga�word attack in Figure 8) may be the reason for
the person’s model misfit—possibly suggesting cognitive ability deficits that explain a person’s deficient
functioning on the achievement-dependent variable. Person-normative model misfit methods have the
potential to provide metrics that may better operationalize the diagnosis and understanding of SLD,
cognitive-aptitude-achievement trait complexes, and school learning in general.

Implications of 20 Years of CHC COG-ACH Research – Kevin S. McGrew – 12-18-12 draft 31
Beyond CHC: CHC Cognitive-Aptitude-Achievement Trait Complexes
I have previously argued that alternative nonfactor analysis methodological (e.g., multidimensional scaling
[MDS]) and theoretical lenses need to be applied to validated CHC measures to better understand “both the
content and processes underlying performance on diverse cognitive tasks” (McGrew, 2005, p. 172). When
MDS-faceted14 methods have been applied to data sets previously analyzed by exploratory or confirmatory
factor methods, “new insights into the characteristics of tests and constructs previously obscured by the
strong statistical machinery of factor analysis emerge” (Schneider & McGrew, 2012, p. 110).15 Despite the
empirical status of these methods being characterized as “quite impressive” (Süß & Beauducel, 2005, p.
319), American psychology and mainstream quantitative school psychology have expressed little interest in
these useful methodological lenses (Tucker-Drob & Salthouse, 2009) in favor of what I call Jöreskog
syndrome16—an almost blind allegiance to and belief in structural equation modeling confirmatory factor
analysis (SEM-CFA) methods as the only way to see the “true light” of the structure of intelligence and
intelligence tests. ITD requires test developers and researchers to embrace a wider array of data analytic
tools to understand better the various nuances of the measures being developed or evaluated. Singular use
of one tool (e.g., CFA) to analyze intelligence test batteries represents Kaplan’s (1964) law of the
instrument: “Give a small boy a hammer, and he will find that everything he encounters needs pounding”
(p. 15).
Following methods similar to those explained and demonstrated by Beauducel, Brocke, and
Liepmann (2001), Beauducel and Kersting (2002), Süß and Beauducel (2005), Tucker-Drob and Salthouse 14 Facet theory is considered a metatheory that enables researchers to define formal hypotheses in a manner that makes systematic data collection and testing of hypotheses transparent. “A facet [emphasis added] may be any way of categorizing observations in usually mutually exclusive and exhaustive categories and can be formally described as a set consisting of a finite number of elements. Facet theory is based on the Cartesian product of a finite number of sets…therefore, a facet is simply a set involved in a Cartesian product…in faceted models of intelligence, the behavior or tasks typically are classified as “operations [emphasis added] (the most prominent cognitive demand of a task, contents [emphasis added] (the different classes of task content), or complexity [emphasis added]” (Süß & Beauducel, 2005, p. 313). 15 See Süß and Beauducel (2005) and Tucker-Drob and Salthouse (2009) for excellent descriptions of these methods and illustrative results. 16Karl Gustav Jöreskog is coauthor of the statistical program LISREL, which, when it was released—by most accounts—was considered a watershed, ushering in the tsunami of structural equation modeling research in the field of intelligence and intelligence testing. I must confess that I previously suffered from this syndrome, but now see that SEM-CFA models are just one set of powerful tools for understanding intelligence and intelligence tests. I now recognize the need for complimentary alternative methodological and theoretical lenses by which to study and explore human intelligence—although, I am still very much CHC-centric.

Implications of 20 Years of CHC COG-ACH Research – Kevin S. McGrew – 12-18-12 draft 32
(2009), and Wilhelm (2005), I subjected all WJ-R standardization subjects (McGrew, Werder, &
Woodcock, 1991) with complete sets of scores (i.e., list-wise deletion of missing data) for the WJ-R Broad
Cognitive Ability-Extended (BCA-Ext), Reading Aptitude (RAPT), Math Aptitude (MAPT), Written
Language Aptitude (WLAPT), Gf-Gc cognitive factors (Gf, Gc, Glr, Gsm, Gv, Ga, Gs), Broad Reading
(BRDG), Broad Math (BMATH), and Broad Written Language (BWLANG) achievement clusters to a
Guttman radex MDS analysis (n = 4,328 subjects from early school years to late adulthood).17 MDS
procedures have more relaxed assumptions than linear statistical models and allow for the simultaneous
analysis of variables that share comment variables or tests—a situation that results in nonconvergence
problems (due to excessive multicolinearity) when using linear statistical models. This feature made it
possible to explore the degree of similarity of the WJ-R operationalized measures of the constructs of
cognitive abilities, general intelligence (g), scholastic aptitudes, and academic achievement in a single
analysis. That is, it was possible to explore the relations between and among the core elements of CHC-
based cognitive-aptitude-achievement trait complexes (CAATCs). The results are presented in Figures 9
and 10.
-------------------------------------------------------
Insert Figures 9 and 10 about here.
--------------------------------------------------------
WJ-R MDS Analysis: Basic Interpretation
• In Guttman radex models, variables closest to the center of the 2-D plots are the most
cognitively complex. The following is concluded from the results in Figure 9:
o The WJ-R g measure (BCA-Ext) is almost directly at the center of the plot and is the
most cognitive-complex variable. This makes theoretical sense given that it is a
composite common to 14 tests from seven of the CHC Gf-Gc cognitive domains.
Proximity to the center of MDS plots is sometimes considered evidence for g.
17 The WJ-R battery was analyzed since it was the last version of the WJ series to include scholastic aptitude clusters.
Implications of 20 Years of CHC COG-ACH Research – Kevin S. McGrew – 12-18-12 draft 33
o Reading and Writing Aptitude (GRWAPT) and Math Aptitude (MAPT) are also
cognitively complex. Both the GRWAPT18 and MAPT clusters are composed of four
equally weighted tests of four different Gf-Gc abilities. Thus, the finding that they are
also among the most cognitively complex WJ-R measures is not surprising. The CHC Gf-
Gc cognitive measures of Gf and Gc are much more cognitively complex than Gv, Glr,
Ga, Gsm, and Gs.19
• In Guttman radex models, the variables are located along two continua or dimensions that
often have substantive theoretical interpretations. The two dimensions in Figure 9 are labeled
A�B and C�D. The following is concluded from a review of Figure 9:
o The A�B dimension reflects the ordering of measures per stimulus content, a common
finding in MDS analyses. The cognitive variables on the left side of this continuum
midline (Gv, Glr, Gf, Gs, MAPT) are composed of measures with predominant visual-
figural or numeric-quantitative stimulus characteristics. The majority of the variables on
the right side of the continuum midline (GRWAPT, Gc, Ga, Gsm, BRDG, BWLANG)
are characterized as more auditory-linguistic, language, or verbal. This visual-
figural/numeric-quantitative-to-auditory-linguistic/language-verbal content dimension is
very similar to the figural, numeric, and verbal content demonstrated by the Berlin Model
of Intelligence Structure (BIS) (Süß & Beauducel, 2005).20
18 As noted in Figure 9, the Reading and Written Language Aptitude clusters, which were separate variables in the analysis, shared three of four common tests and nearly overlapped in the MDS plot. Thus, for simplicity, they were combined into the single GRWAPT variable in Figure 9. This is also consistent with the factor analysis of reading and writing achievement variables that typically produce a single Grw factor and not separate reading and writing factors. 19 The primary narrow abilities measured by each of the cognitive Gf-Gc clusters are included in the label for each cluster. Contrary to the WJ III, the WJ-R Gf-Gc clusters were not all operationally constructed as broad Gf-Gc abilities (see McGrew, 1997; McGrew & Woodcock, 2001). Only the WJ-R Gf and Gc clusters can be interpreted as measuring broad domains per the requirement that broad measures must include indicators of different narrow abilities (e.g., Concept Formation [Gf-I] and Analysis-Synthesis [Gf-RG]). The other five WJ-R Gf-Gc clusters are now understood to be valid indicators of narrow CHC abilities (Gsm-MS, Ga-PC, Glr-MA, Gv-MV/CS, Gs-P). 20 The BIS model is a heuristic framework, derived from both factor analysis and MDS facet analysis, for the classification of performance on different tasks and is not to be considered a trait-like structural model of intelligence as exemplified by the factor-based CHC theory. Nevertheless, Guttman radex MDS models often show strong parallels to hierarchical, factor-based models that are based on the same set of variables (Kyllonen, 1996; Süß & Beauducel, 2005; Tucker-Drob & Salthouse, 2009).

Implications of 20 Years of CHC COG-ACH Research – Kevin S. McGrew – 12-18-12 draft 34
o The C�D dimension reflects the ordering of variables per cognitive operations or
processes, another common finding in MDS analyses. The cognitive variables above the
continuum midline (Gv, Glr, Ga, Gc, Gsm, BCA-Ext, GRWAPT) are composed
primarily of cognitive ability tasks that involve mental processes or operations.
Conversely, although not as consistent, three of the lowest variables below this
continuum midline are the achievement ability clusters (BRDG, BWLANG, BMATH).
Thus, the C�D dimension is interpreted as representing a cognitive
operations/processes-to-acquired knowledge/product dimension.
o In contrast to factor analysis, interpretation of MDS is more qualitative and subjective.
Variables that may share a common dimension are typically identified as lying on
relatively straight lines or planes, in separate quadrants or partitions, or tight groupings
(often represented by circles or ovals or connected as a shape via lines). The AC quadrant
(see Figure 9) is interpreted as representing (excluding BCA-Ext, which is near the
center) cognitive operations with visual-figural content (Gv, Glr). The CB quadrant is
interpreted as representing auditory-linguistic/language-verbal content-based cognitive
operations. The BC quadrant includes only the three broad achievement clusters and is
thus an achievement or an acquired knowledge dimension. Finally, the DA quadrant can
be interpreted as cognitive operations that involve quantitative operations or numeric
stimuli (e.g., Gf is highly correlated with math achievement, McGrew & Wendling, 2010;
one half of the Gs-P cluster is the Visual Matching test, which requires the efficient
perceptual processing of numeric stimuli, Glr-N).21 The interpretation of these four
quadrants is consistent with the BIS content-faceted content-by-operations model
research.
o Theoretical interpretation of the two continua and four quadrants provides potentially
important insights into the abilities measured by the WJ-R. More importantly, the
conclusions provide potentially significant theoretical insights into the nature of human
intelligence—insights that typically fail to emerge when using factor analysis methods
21 The MAPT cluster also includes the two Gf tests and Visual Matching.

Implications of 20 Years of CHC COG-ACH Research – Kevin S. McGrew – 12-18-12 draft 35
(Schneider & McGrew, 2012; Süß & Beauducel, 2005). In other MDS analyses I have
completed, similar visual-figural/numeric-quantitative-to-auditory-linguistic/language-
verbal and cognitive operations/processes-to-acquired knowledge/product continua
dimensions have emerged (McGrew, 2005; Schneider & McGrew, 2012). When I have
investigated a handful of 3-D MDS22 models, the same two dimensions emerge along
with a third, automatic-to-deliberate/controlled cognitive processing dimension, which is
consistent with the prominent dual-process models of cognition and neurocognitive
functioning (Evans, 2008, 2011; Barrouillet, 2011; Reyna & Brainerd, 2011; Ricco &
Overton, 2011; Stanovich, West, & Toplak, 2011) that are typically distinguished as Type
I–II or System I–II (see Kahneman’s, 2011, highly acclaimed Thinking, fast and slow).23
These higher-order cognitive processing dimensions, which are not present in the CHC taxonomy,
suggest that intermediate strata (or dimensions that cut across broad CHC abilities) might be useful
additions to the current three-stratum CHC model. These higher-order dimensions may be capturing the
essence of fundamental neurocognitive processes and argue for moving “beyond CHC” to integrate
neurocognitive research to better understand intellectual performance.
WJ-R MDS Analysis: Cognitive-Aptitude-Achievement Trait Complex (CAATC) Interpretation
Figure 10 is an extension of the results presented in Figure 9. Two different CAATCs are suggested. These
were identified by starting first with the BMATH and BWLANG-BRDG achievement variables and next
connecting these variables to their respective SAPTs (MAPT, GRWAPT). Next, the closest cognitive Gf-
Gc measures that were in the same general linear path were connected (the goal was to find the math- and
reading-related variables that were closest to lying on a straight line). Ovals where then superimposed on
the figure to represent the areas comprising the two CAATCs. Finally, a dotted line representing the
approximate bisection of each of the CAATC vectors was drawn. The approximate correlation (r = .55, see
22 WJ III 3-D MDS model for norm subjects ages 9–13 is available at http://www.iqscorner.com/2008/10/wj-iii-guttman-radex-mds-analysis.html 23 A similar dimension emerged as a plausible higher-order cognitive processing dimension in the previously mentioned Carroll type analysis of 50 WJ III test variables (see footnote 2).

Implications of 20 Years of CHC COG-ACH Research – Kevin S. McGrew – 12-18-12 draft 36
Figure 10) between the two multidimensional CAATCs was estimated via measurement of the angle
between the CAATC vector dotted lines.24
As presented in Figure 10, Math and Reading-Writing CAATCs are suggested as a viable
perspective from which to view the relations between cognitive abilities, aptitudes, and achievement
abilities. The following primary conclusions, insights, and questions are drawn from Figures 9 and 10:
• It appears that potential exists to empirically identify CAATCs via the use of CHC-grounded
theory, the extant CHC COG�CH relations research, and multidimensional scaling. It also
appears possible to estimate the correlation between different trait complexes (see
math/reading-writing trait complex r = .55 in Figure 10). I suggest these preliminary findings
may help the field of cognitive-achievement assessment and research to better approximate
the multidimensional nature of human cognitive abilities, aptitudes, and achievement abilities.
• Although the WJ-R battery is not as comprehensive a measure of CHC abilities as the WJ III,
the cognitive abilities within the respective math and reading-writing CAATCs are very
consistent with the extant CHC COG�ACH relations research (McGrew & Wendling, 2010).
The reading-writing trait complex (see Figure 10) includes Ga-PC, Gc-LD/VL, and via the
GRWAPT, Gs-P and Gsm-MS; abilities that are listed as domain-general and domain-specific
in Figure 3. In the case of math, the trait complex includes indicators of Gf-RG, Gv-MV, and
via the MAPT, Gs-P (Visual Matching, which might also tap Gs-N) and Gc-LD/VL; abilities
that are either domain-general or domain-specific for math (see Figure 3). Working memory
(Gsm-MW) is not present (see Figure 3) as the WJ-R battery did not include a working
memory cluster that could enter the analysis.
Also of interest are the three WJ-R cognitive factors (Gsm-MS, Glr-MA, Gs-P) that are
excluded from the hyperspace representations of the proposed math and reading-writing
CAATCs. Although highly speculative, it is possible their separation (i.e., independence)
from the narrower-designated trait complexes—if known to be related to reading-writing or
24 Using trigonometry, the cosine of the intersection of the two trait complex vectors was converted to a correlation. I thank Dr. Joel Schneider for helping fill the gap in my long-lost expertise in basic trigonometry via a spreadsheet that converted the measured angle to a correlation.

Implications of 20 Years of CHC COG-ACH Research – Kevin S. McGrew – 12-18-12 draft 37
math achievement—indicates that they represent domain-general abilities. Glr-MA and Gs-P
are both listed as domain-general abilities in Figure 3. For CHC measures known to be
significantly related to achievement, additional work is needed to determine if independence
from identified CAATCs indicates domain-general abilities. Alternatively, it is very possible,
given the previously demonstrated developmental nuances of CHC COG�ACH relations, the
results presented in Figures 9 and 10 (which used the entire age range of the WJ-R measures)
may mask or distort findings in unknown ways.
Those knowledgeable of the CHC COG�ACH relations research will note the inclusion of
certain Gv abilities (Vz, SR, MV) in Figure 3 as well as the inclusion of the WJ-R Gv-MV/CS
cluster (see Figure 10) as part of the proposed math CAATC, despite the lack of consistently
reported significant CHC Gv�ACH relations. McGrew and Wendling (2010) recognized that
some Gv abilities have clearly been linked to reading and math achievement (especially the
later) in non-CHC-organized research. They speculated that the “Gv Mystery” (p. 665) may
be due to certain Gv abilities being threshold abilities or that the cognitive batteries included
in their review did not include Gv measures that measured complex Gv-related Vz or MV
processes. Given this context, it may be an important finding (via the methods described
earlier in this paper) that the WJ-R Gv measure is unexpectedly included in the math CAATC.
This may support the importance of Gv abilities in explaining math and concurrently indicate
a problem with the operational Gv measures.
• The long distance from the WJ-R Gv measure to the center of the diagram (see Figure 9)
indicates that the WJ-R Gv measure, which included tests classified as indicators of MV and
CS, is not cognitively complex. This conclusion is consistent with Lohman’s (1979) seminal
review of Gv abilities where he specifically mentions MV and CS as representing low-level
Gv processes and “such tests and their factors consistently fall near the periphery of scaling
representations, or at the bottom of a hierarchical model” (pp. 126–127). I advance the
hypothesis that the math CAATC in Figure 10 suggests that Gv is a math-relevant domain,
but more complex Gv tests (e.g., 3-D mental “mind’s eye” rotation, complex visual working
Implications of 20 Years of CHC COG-ACH Research – Kevin S. McGrew – 12-18-12 draft 38
memory), which would be closer to the center of the MDS hyperspace, need to be developed
and included in cognitive batteries. This suggestion is consistent with Wittmann and Süß’s
concept of Brunswick Symmetry, which, in turn, is founded on the fundamental concept of
symmetry, which has been central to success in most all branches of science (Wittmann &
Süß, 1999). The Brunswick Symmetry model argues that in order to maximize prediction or
explanation between predictor and criterion variables, one should match the level of cognitive
complexity25 of the variables in both the predictor and criterion space (Hunt, 2011; Wittmann
& Süß, 1999). The WJ-R Gv/WJ-R BMATH relation may represent a low (WJ-R Gv)-to-high
(WJ-R BMATH) predictor–criterion complexity mismatch, thus dooming any possible
significant relation. These findings are expanded upon later in this paper.
Researchers and practitioners in the area of SLD should recognize that when third-method
PSW “aptitude-achievement” discrepancies are evaluated to determine “consistency,” the
combination of domain-general and domain-specific abilities that composes an aptitude for a
specific achievement domain is in many ways a miniproxy for general intelligence (g). In
Figures 9 and 10, the BCA-Ext and MAPT and GRWAPT variables are in close proximity
(which represents high correlation) and are all near the center of the MDS radex model. The
manifest correlations between the WJ-R BCA-Ext (in the WJ-R data used to generate the
CAATCs in Figure 10) and RAPT, WLAPT, and MAPT clusters are .91, .89, and .91,
respectively. This reflects the reality of the CHC COG�ACH research in both reading and
math achievement: Cognitive tests or clusters with high g-loadings (viz., measures of Gc and
Gf), as well as shared domain-general abilities, are always in the pool of CHC measures
associated with the academic deficit. However, the placement of GRWAPT and MAPT in the
different content–processes quadrants in Figures 9 and 10 suggests that more differentiated
CHC-designed achievement domain SAPT measures might be developed. The manifest
correlations between MAPT and the two GRWAPT measures were .82 to .84, suggesting
approximately 69% shared variance. GRWAPT and MAPT are strongly related SAPTs; yet,
25 Cognitive complexity is defined later in this paper.
Implications of 20 Years of CHC COG-ACH Research – Kevin S. McGrew – 12-18-12 draft 39
there is still unique variance in each. Furthermore, the WJ-R SAPT measures used in this
analysis were equally weighted clusters and not the differentially weighted clusters as in the
original WJ. As presented earlier in this paper, research suggests that intelligent, test-
developed optimal SAPT prediction requires developmentally shifting weights across age. It
is my opinion that the evolution of developmental-sensitive CHC-consistent SAPTs will
result in lower correlations between RAPT and MAPT measures.
Beyond CHC Theory: Cognitive-Aptitude-Achievement Trait Complexes and SLD Identification
Models
The possibility of measuring, mapping, and quantifying CAATCs raises intriguing possibilities for
reconceptualizing approaches to the identification of SLD. Figure 11 presents the generic representation of
the prevailing third-method SLD models and a formative proposal for a conceptual revision. As noted
previously, the prevailing PSW model (left side of Figure 11), although useful for communication and
enhancing understanding of the conceptual approach, is simplistic. Implementation of the model requires
successive calculations of simple (and often multiple) discrepancies, which fail to capture the
multidimensional and multivariate nature of human cognitive, aptitude, and achievement abilities. I believe
the CAATC representations in Figure 10, although still clearly imperfect and fallible representations of the
nonlinear nature of reality, may better approximate the multifaceted nature of cognitive-aptitude trait
complex relations. The right side of Figure 11 is an initial attempt to conceptualize SLD within a CAATC
framework. In this formative model, the bottom two components of the current third-method models (i.e.,
academic and cognitive weakness) have been combined into a single, multidimensional CAATC domain.
-------------------------------------------------------
Insert Figure 11 about here.
--------------------------------------------------------
CAATCs better operationalize the notion of consistency among the multiple cognitive, aptitude,
and achievement elements of an important academic learning domain or domain of SLD. As noted in the
definition of CAATC presented earlier, the emphasis is on a constellation or combination of elements that
are related and combined together in a functional fashion. These characteristics imply a form of central,
inwardly directed force that pulls elements together much like magnetism. Cohesion appears the most

Implications of 20 Years of CHC COG-ACH Research – Kevin S. McGrew – 12-18-12 draft 40
appropriate term for this form of multiple-element bonding. Cohesion is defined by the Shorter English
Oxford Dictionary (Brown, 2002) as, “the action or condition of sticking together or cohering; a tendency
to remain united” (p. 444). Element bonding and stickiness are also conveyed in the APA Dictionary of
Psychology (VandenBos, 2007) definition of cohesion as “the unity or solidarity of a group, as indicated by
the strength of the bonds that link group members to the group as a whole” (p. 192). In the CAATC-based
SLD proposal in Figure 11, cohesion within a CAATC is designated by overlapping circular shapes.
Determining the degree of cohesion within a CAATC is an integral and critical step to ascertaining whether
a particular academic domain deficit is present. The stronger the within-CAATC cohesion, the more
confidence one can place in the identification of a CAATC as possibly indicative of an SLD. This focus on
quantifying the CAATC cohesion is seen as a necessary, but not sufficient, first step in attempting to
identify SLD based on a multivariate PSW. If the CAATC demonstrates very weak cohesion, the
hypothesis of a possible SLD should receive less consideration. If there is significant (yet to be
operationally defined), moderate-to-strong CAATC cohesion, then the comparison of the CAATC to the
cognitive–academic strengths portion of the conceptual model is appropriate for SLD consideration. To
simplify, PSW-based SLD identification would be based first on the detection of weakness in a cohesive-
specific CAATC, followed by determination of significant discrepancy in relative strengths from other
cognitive and achievement domains. Of course, additional variations of this model require further
exploration. For example, should discrepant–discordant comparisons be made between other empirically
identified and quantified CAATCs? Would CAATC-to-CAATC comparisons between highly empirical and
theoretically correlated CAATCs (e.g., basic reading skills and basic writing skills) when contrasted to less
empirically and theoretically correlated CAATC-to-CAATC domains (e.g., basic reading skills and math
reasoning) be diagnostically important? I have more questions than answers at this time.
Yes—this proposed CAATC framework and integration into SLD models is speculative and in the
formative stages of conceptualization. It is not yet ready for prime-time, in-the-field applied practice. It is,
however, based on exploratory data analyses inspired by theoretical considerations and well-reasoned logic.
Of course, appropriate statistical metrics and methods for operationalizing the degree of domain cohesion
are required, but I do not see this as an insurmountable hurdle. Metrics based on Euclidean distance (e.g.,
Mahalanobis distance) can quantify the cohesion between CAATCs as well as measure the distance from

Implications of 20 Years of CHC COG-ACH Research – Kevin S. McGrew – 12-18-12 draft 41
the centroid of a CAATC (see Schneider, 2012). Alternately, statisticians much smarter than I might apply
centroid-based multivariate statistical measures to quantify and compare CAATC domain cohesion. I urge
those with such skills and interest to pursue the development of these ITD metrics. Also, the current limited
exploratory results with the WJ-R data should be replicated and extended in more contemporary samples
with a larger range of both CHC cognitive, aptitude, and achievement tests and clusters. I would encourage
split-sample CAATC model development and cross validation in the WJ III norm data.
Additional research and development, some of which I have suggested in this paper, will provide
promising methodologies as well as ideas with limited validity, and possibly some with too many practical
constraints, thus, rendering them hard to implement. Nevertheless, the results presented here suggest
possible incremental progress toward better defining SLD and learning complexes that are more consistent
with nature—with the identification of CAATC taxa26 that better approximate “nature carved at the joints”
(Meehl, 1973, as quoted and explained by Greenspan, 2006, in the context of MR–ID diagnosis). Such a
development would be consistent with Reynolds and Lakin’s (1987) plea, 25 years ago, for disability
identification methods that better represent dispositional taxa rather than classes or categories based on
specific cutting scores grounded in “administrative conveniences with boundaries created out of political
and economic considerations” (p. 342).
Beyond CHC: ITD—Within-CHC-Domain Complexity-Optimized Measures
Optimizing Cognitive Complexity of CHC Measures
The Brunswick-Symmetry-derived Berlin Model of Intelligence Structure (BIS) (Wittmann & Süß, 1999)
was mentioned previously as an important framework for understanding predictor-criteria relations and,
more importantly, as a framework to better maximize these relations via matching the predictor-criteria
space on the dimension of cognitive complexity. What is cognitive complexity? Why is it important? More
important, what role should it play in designing intelligence batteries to optimize CHC COG�ACH
relations?
26 The Shorter Oxford English Dictionary defines a taxon as “a taxonomic group of any rank, as species, family, class, etc; an organism contained in such a group” (p. 3193) and taxonomy as “classification, esp. in relation to its general laws or principles; the branch of science, or of a particular science or subject, that deals with classification; esp. the systematic classification of living organisms” (p. 3193, italics in original).

Implications of 20 Years of CHC COG-ACH Research – Kevin S. McGrew – 12-18-12 draft 42
Cognitive complexity is often operationalized by inspecting individual test loadings on the first
principal component from principal component analysis (Jensen, 1998). The high g-test rationale is that
performance on tests that are more cognitively complex “invoke a wider range of elementary cognitive
processes (Jensen, 1998; Stankov, 2000, 2005)” (McGrew, 2010, p. 452). High g-loading tests are often at
the center of MDS radex models—but this isomorphism does not always hold. David Lohman, a student of
Snow’s, has made extensive use of MDS methods to study intelligence and has one of the best grasps of
what cognitive complexity, as represented in the hyperspace of MDS figures, contributes to understanding
intelligence and intelligence tests. According to Lohman and Lakin (2011), those tests closer to the center
are more cognitively complex due to five possible factors: a larger number of cognitive component
processes; accumulation of speed component differences; more important component processes (e.g.,
inference); increased demands of attentional control and working memory; and/or more demands on
adaptive functions (assembly, control, and monitoring). Schneider and McGrew’s (in press) level of
abstraction description of broad CHC factors is similar to cognitive complexity. Using the example of a
100-meter sprint hurdle race, one must independently measure 100-meter sprinting speed and then measure
performance in jumping hurdles (both examples of narrow abilities). However, competing in a 100-meter
sprint hurdle race is not the mere sum of the two narrow abilities and is more of a nonadditive combination
and integration of narrow abilities. This analogy captures the essence of cognitive complexity. In the realm
of cognitive measures, cognitively complex tasks involve more of the five factors listed by Lohman and
Lakin (2011) during successful task performance.
Of critical importance is the recognition that factor or ability domain breadth (i.e., broad or
narrow) is not synonymous with cognitive complexity. More important, cognitive complexity has not
always been a test design concept (as defined by the Brunswick Symmetry and BIS models; see Wittmann
& Süß, 1999; Süß & Beauducel, 2005) explicitly incorporated into ITD. A number of tests have
incorporated the notion of cognitive complexity in their design plans, but I believe this type of cognitive
complexity is different from the within-CHC-domain cognitive complexity discussed here.
For example, according to Kaufman and Kaufman (2004), “in developing the KABC-II, the
authors did not strive to develop ‘pure’ tasks for measuring the five CHC broad abilities. In theory, Gv

Implications of 20 Years of CHC COG-ACH Research – Kevin S. McGrew – 12-18-12 draft 43
tasks should exclude Gf or Gs, for example, and tests of other broad abilities, like Gc or Glr, should only
measure that ability and none other. In practice, however, the goal of comprehensive tests of cognitive
ability like the KABC-II is to measure problem solving in different contexts and under different conditions,
with complexity [emphasis added] being necessary to assess high-level functioning” (p. 16). Although the
Kaufmans address the importance of cognitively complex measures in intelligence test batteries, their
CHC-grounded description defines complex measures as those that are factorially complex or mixed
measures of abilities from more than one broad CHC domain. The Kaufmans also address cognitive
complexity from the non-CHC, neurocognitve, three-block functional Luria model when they indicate it is
important to provide measurement that evaluates the “dynamic integration of the three blocks” (p. 13). This
emphasis on neurocognitive integration (and thus, complexity) is also an explicit design goal of the latest
Wechsler batteries. As stated in the WAIS-IV manual (Wechsler, 2008), “although there are distinct
advantages to the assessment and division of more narrow domains of cognitive functioning, several issues
deserve note. First, cognitive functions are interrelated, functionally and neurologically, making it difficult
to measure a pure domain of cognitive functioning” (p. 2). Furthermore, “measuring psychometrically pure
factors of discrete domains may be useful for research, but it does not necessarily result in information that
is clinically rich or practical in real world applications (Zachary, 1900)” (Wechsler, p. 3). Finally, Elliott
(2007) similarly argues for the importance of recognizing neurocognitive-based “complex [emphasis added]
information processing” (p. 15) in designing the DAS-II, which results in tests or composites measuring
across CHC-described domains.
The ITD principle explicated and proposed here is that of striving to develop cognitively complex
measures within broad CHC domains—that is, not attaining complexity via the blending of abilities across
CHC broad domains and not attempting to directly link to neurocognitive network integration.27 The
27 This does not mean that cognitive complexity may not be related to the integrity of the human
connectome or different brain networks. I am excited about contemporary brain network research (Bressler & Menon, 2010; Cole, Yarkoni, Repovš, Anticevic & Braver, 2012; Toga, Clark, Thompson, Shattuck, & Van Horn, 2012; van den Heuvel & Sporns, 2012), particularly that which has demonstrated links between neural network efficiency and working memory, controlled attention and clinical disorders such as ADHD (Brewer, Worhunsky, Gray, Tang, Weber, & Kober, 2011; Lutz, Slagter, Dunne, & Davidson, 2008; McVay & Kane, 2012). The Parietal-Frontal Integration (P-FIT) theory of intelligence is particularly intriguing as it has been linked to CHC psychometric measures (Colom, Haier, Head, Álvarez-Linera, Quiroga, Shih, & Jung, 2009; Deary, Penke, & Johnson, 2010; Haier, 2009; Jung & Haier, 2007) and could be linked to CHC cognitive-optimized psychometric measures.
Implications of 20 Years of CHC COG-ACH Research – Kevin S. McGrew – 12-18-12 draft 44
Brunswick-Symmetry-based BIS model (Wittmann & Süß, 1999) provides a framework for attaining this
goal via the development and analysis of test complexity by paying attention to cognitive content
operations and process facets.
Figure 12 presents the results of a 2-D MDS radex model of most key WJ III broad and narrow
CHC cognitive and achievement clusters (for all norm subjects from approximately 6 years of age through
late adulthood).28 The current focus of the interpretation of the results in Figure 12 is only on the degree of
cognitive complexity (proximity to the center of the figure) of the broad and narrow WJ III clusters within
the same domain. Within a domain, the broadest three-test parent clusters are designated by black circles.29
Two-test broad clusters are designated by gray circles. Two-test narrow offspring clusters within broad
domains are designated by white circles. All clusters within a domain are connected to the broadest parent
broad cluster by lines. The critically important information is the within-domain cognitive complexity of
the respective parent and offspring clusters as represented by their relative distances from the center of the
figure. A number of interesting conclusions are apparent.
-------------------------------------------------------
Insert Figure 12 about here.
--------------------------------------------------------
First, as expected, the WJ III GIA-Ext cluster is almost perfectly centered in the figure—it is
clearly the most cognitively complex WJ III cluster. In comparison, the three WJ III Gv clusters are much
weaker in cognitive complexity than all other cognitive clusters with no particular Gv cluster demonstrating
a clear cognitive complexity advantage. As expected, the measured reading and math achievement clusters
are primarily cognitively complex measures. However, those achievement clusters that deal more with
basic skills (e.g., Math Calculation [MTHCAL] and Basic Reading Skills [RDGBS]) are less complex than
the application clusters (Math Reasoning [MTHREA] and Reading Comprehension [RDGCMP]).
The most intriguing findings in Figure 12 are the differential cognitive complexity patterns within
CHC domains (with at least one parent and at least one offspring cluster). For example, the narrow 28 Only reading and math clusters were included to simplify the presentation of the results and the fact, as reported previously, that reading and writing measures typically do not differentiate well in multivariate analysis—and thus the Grw domain in CHC theory. 29 GIA-Ext is also represented by a black circle.

Implications of 20 Years of CHC COG-ACH Research – Kevin S. McGrew – 12-18-12 draft 45
Perceptual Speed (PERSPD [Gs-P]) offspring cluster is more cognitively complex than the broad parent Gs
cluster. The broad Gs cluster is composed of the Visual Matching (Gs-P) and Decision Speed (Gs-R9, Glr-
NA) tests, which measure different narrow abilities. In contrast, the Perceptual Speed cluster is composed
of two tests that are classified as both measuring the same narrow ability (perceptual speed). This finding
appears, on first blush, counterintuitive as one would expect a cluster composed of tests that measure
different content and operations to be more complex (per the above definition and discussion) than a cluster
composed of two measures of the same narrow ability. However, one must task analyze the two Perceptual
Speed tests to realize that, although both are classified as measuring the same narrow ability (perceptual
speed [Gs-P]), they differ in both stimulus content and cognitive operations. Visual Matching requires
processing of numeric stimuli. Cross Out requires the processing of visual-figural stimuli. These are two
different content facets in the BIS (Wittmann & Süß, 1999) model. The Cross Out visual-figural stimuli are
much more spatially challenging than the simple numerals in Visual Matching. Furthermore, the Visual
Matching test requires the subject to quickly seek out, discover, and then mark two-digit pairs that are
identical. In contrast, in the Cross Out test, the subject is provided a target visual-figural shape, and the
subject must then quickly scan a row of complex visual images and mark two that are identical to the
target. It is interesting to note, in other unpublished “WJ III data sandbox” analyses that I have completed,
the Visual Matching test often loads on groups with quantitative achievement tests while Cross Out has
frequently shown to load on a Gv factor. Thus, task analysis of the content and cognitive operations of the
WJ III Perceptual Speed tests suggests that although both are classified as narrow indicators of Gs-P, they
differ markedly in task requirements. More important, the Perceptual Speed cluster tests, when combined,
appear to require more cognitively complex processing than the broad Gs cluster. This finding is consistent
with Ackerman, Beier, and Boyle’s (2002) research that suggests perceptual speed has another level of
factor breadth via the identification of four subtypes of perceptual speed (i.e., pattern recognition, scanning,
memory, and complexity; see McGrew, 2005, and Schneider & McGrew, 2012, for discussion of a
hierarchically organized model of speed abilities). Based on Brunswick Symmetry–BIS cognitive
complexity principles, one would predict that a Gs-P cluster composed of two parallel forms of the same
task (e.g., two Visual Matching or two Cross Out tests) would be less cognitively complex than broad Gs.

Implications of 20 Years of CHC COG-ACH Research – Kevin S. McGrew – 12-18-12 draft 46
A hint of the possible correctness of this hypothesis is present in the inspection of the Gsm parent and
offspring clusters reported in Figure 12.
The WJ III Gsm cluster is the combination of the Numbers Reversed (MW) and Memory for
Words (MS) tests. In contrast, the WJ III Auditory Memory Span (AUDMS [Gsm-MS]) cluster is much
less cognitively complex when compared to Gsm (see Figure 12). Like the Perceptual Speed (Gs-P) cluster
described in the context of the processing speed family of clusters, the Auditory Memory Span cluster is
composed of two tests (Memory for Words and Memory for Sentences) with the same memory span (MS)
narrow ability classification. Why is this narrow cluster less complex than its broad parent Gsm cluster
while the opposite held true for Gs-P and Gs? Task analysis suggests that the two memory span tests are
more alike than the two perceptual speed tests. The Memory for Words and Memory for Sentences tests
require the same cognitive operation—simply repeating back, in order, words or sentences spoken to the
subject. This differs from the WJ III Perceptual Speed cluster as the similarly classified narrow Gs-P tests
most likely invoke both common and different cognitive component operations. Also, the Auditory
Memory Span cluster is composed of stimuli from the same BIS content facet (i.e., words and sentences,
auditory-linguistic/language-verbal). In contrast, the Gs-P Visual Matching and Cross Out tests involve two
different content facets (numeric and visual-figural).
Likewise, the WJ III Working Memory (WRKMEM [Gsm-MW]) cluster is more cognitively
complex. This finding is consistent with the prior WJ III Gs–Perceptual Speed and WJ III Gsm–Auditory
Memory Span discussion. The WJ III Working Memory cluster is composed of the Numbers Reversed and
Auditory Working Memory tests. Numbers Reversed requires the processing of stimuli from one BIS
content facet—numeric stimuli. In contrast, Auditory Working Memory requires the processing of stimuli
from two BIS content facets: numeric and auditory-linguistic/language-verbal (i.e., numbers and words).
The cognitive operations of the two tests also differ. Both require the holding of presented stimuli in active
working memory space. Numbers Reversed then requires the simple reproduction of the numbers in reverse
order. In contrast, the Auditory Working Memory test requires the storage of the numbers and words in
separate chunks, and then the production of the forward sequence of each respective chunk (numbers or

Implications of 20 Years of CHC COG-ACH Research – Kevin S. McGrew – 12-18-12 draft 47
words), one chunk before the other. Greater reliance on divided attention is most likely occurring during
the Auditory Working Memory test.
In summary, the results presented in Figure 12 suggest that it is possible to develop cluster scores
that vary by degree of cognitive complexity within the same broad CHC domain. More important is the
finding that the classification of clusters as broad or narrow does not provide information on the measures’
cognitive complexity. Cognitive complexity, as defined in the Lohman and Lakin (2011) sense, can be
achieved within CHC domains without resorting to mixing abilities across CHC domains. Finally, some
narrow clusters can be more cognitively complex, and thus likely better predictors of complex school
achievement, than broad clusters or other narrow clusters.
Implications for Test Battery Design and Assessment Strategies
Currently the construction of assessments featuring broad CHC clusters fail to recognize the importance of
cognitive complexity during the design process. I plead guilty to contributing to this viewpoint via my role
in the WJ III, which focused extensively on broad CHC domain construct representation. (Most WJ III
narrow CHC clusters require the use of the Woodcock-Johnson III Diagnostic Supplement to the Tests of
Cognitive Abilities, Woodcock, McGrew, Mather, & Schrank, 2003.) Also, guilty as charged in the
dominance of broad CHC factor representation in the development of the original cross-battery assessment
principles (Flanagan & McGrew, 1997; McGrew & Flanagan, 1998). Additionally, I have determined the
“narrow is better” conclusion of McGrew and Wendling (2010) may need modification. Revisiting the
McGrew and Wendling results suggests that the narrow CHC clusters more predictive of academic
achievement likely may have been so not necessarily because they are narrow, but because they are more
cognitively complex. I offer the hypothesis that a more correct principle is that “cognitively complex
measures” are better. I welcome new research focused on testing this principle.
In retrospect, given the universe of WJ III clusters, a broad + narrow hybrid approach to
intelligence battery configuration (or cross-battery assessment) may be more appropriate. Based
exclusively on the results presented in Figure 12, the clusters that appear might better be featured in the
“front end” of the WJ III or a selective-testing constructed assessment—those clusters that examiners

Implications of 20 Years of CHC COG-ACH Research – Kevin S. McGrew – 12-18-12 draft 48
should consider first within each CHC broad domain: Fluid Reasoning (Gf)30, Comprehension-Knowledge
(Gc), Long-Term Retrieval (Glr), Working Memory (Gsm-MW), Phonemic Awareness 3 (Ga-PC), and
Perceptual Speed (Gs-P). No clear winner is apparent for Gv, although the narrow Visualization cluster is
slightly more cognitively complex than the Gv and Gv3 clusters. The above suggests that if broad clusters
are desired for the domains of Gs, Gsm, and Gv, then additional testing beyond the front end or featured
tests and clusters would require administration of the necessary Gs (Decision Speed), Gsm (Memory for
Words) and Gv (Picture Recognition) tests. Utilization of ITD principles for optimizing within-CHC
cognitive complex clusters suggests that a different emphasis and configuration of WJ III tests might be
more appropriate. It is proposed that the above WJ III cluster complexity priority or feature model would
likely allow practitioners to administer the best predictors of school achievement. I further hypothesize that
this cognitive-complexity-based, broad + narrow test-design principle most likely applies to other
intelligence test batteries that have adhered to the primary focus of featuring tests that are the purest
indicators of two or more narrow abilities within the provided broad CHC interpretation scheme. Of course,
this is an empirical question that begs research with other batteries. More useful will be similar MDS radex
cognitive complexity analyses of cross-battery intelligence data sets.31
Summary and Conclusions
McGrew and Wendling’s (2010) CHC COG�ACH relations review was the springboard for this paper.
My initial plan was to add greater clarity to McGrew and Wendling concerning the importance of
differentiating between domain-general and domain-specific predictors of school achievement. Next, I was
to demonstrate approaches to CHC-based selective referral-focused assessment (SRFA). The need to go
“back to the future” was initially going to focus on new opportunities for assessment professionals to
engage in more intelligent, flexible intelligence testing (à la Alan Kaufman, 1979) and the need to resurrect
the idea of WJ/WJ-R Scholastic Aptitude clusters (SAPTs). Finally, another original goal was to present
30 Although the WJ III Fluid Reasoning 3 cluster (Gf3) is slightly closer to the center of the figure, the difference from Fluid Reasoning (Gf) is not large and time efficiency would argue for the two-test Gf cluster. 31 It is important to note that the cognitive complexity analysis and interpretation discussed here is specific to within the WJ III battery only. The degree of cognitive complexity in the WJ III cognitive clusters in comparison to composite scores from other intelligence batteries can only be ascertained by cross-battery MDS complexity analysis.

Implications of 20 Years of CHC COG-ACH Research – Kevin S. McGrew – 12-18-12 draft 49
summaries of select exploratory analyses completed in my ten-year, “beyond CHC” adventure—analyses
that have provided many insights into the nature of intelligence and the characteristics of the WJ III tests. I
believe all of these goals were accomplished.
As this paper evolved, new conceptual, theoretical, and data-based insights lead me to drill deeper
into a number of ideas and concepts—in varying stages of formative development—to ascertain their merit.
The results were unexpected and hold great promise for: (a) formulating and implementing fresh
conceptual principles in new intelligence test design (ITD),32 (b) exploring more CHC-based
COG�ACH causal models to better understand the real-world nuances of COG�ACH relations, (c)
developing person-fit indices to validate CHC COG�ACH causal models for potential diagnostic and
instructional purposes, (d) identifying methods that may help recognize and quantify cognitive-aptitude-
achievement trait complexes (CAATCs), (e) revising current PSW third-method SLD models to integrate
CAATCs, and (f) incorporating and quantifying the degree of cognitive complexity of tests and composite
scores into the ITD process.
Of all the ideas presented, that of intelligence CHC-based SRFA can be immediately implemented
by assessment professionals. The assessment, statistical data, and computer-scoring-based technology are
available for relatively quick generation of developmental-sensitive CHC-designed scholastic aptitude
clusters for batteries with a sufficient breadth of CHC cognitive and achievement tests. The statistical
machinery (viz., MDS) to investigate the cognitive complexity of individual tests and composite scores has
existed for decades and can be used immediately to address the ITD principle of within-CHC-domain
cognitive complexity in test design and test battery organization.
The remaining proposals will require additional research and development, although progress is
already nearing completion for the necessary metrics to implement portions of the CAATC approach to
understanding COG�ACH relations (i.e., ability domain cohesion; see Schneider, 2012) and incorporate
32 I currently define intelligence test design (ITD) as the process of using more theory and research-based knowledge to approach the development and evaluation of intelligence tests. A handful of ITD concepts were articulated in this paper. They are by no means exhaustive. These are intended to go beyond already accepted and well-validated psychometric test design concepts (e.g., methods based on the “new rules of measurement,” Embretson, 1996; Embretson & Hershberger, 1999). In time, I hope a more complete set of ITD principles will be articulated by a collection of intelligence test researchers and test developers.

Implications of 20 Years of CHC COG-ACH Research – Kevin S. McGrew – 12-18-12 draft 50
them into SLD identification models. I encourage other intelligence researchers to become more
comfortable in moving from a less confirmatory approach to test development and research to a dynamic
hybrid model of exploratory and confirmatory models and analytic tools. My exploratory journey over the
past decade has resulted in the discovery of new insights and hypotheses that produced a number of the
new ideas proposed in this paper. I encourage others to embark on similar “back to” and “beyond” research
and theory-based journeys to improve the state of the art of intelligence theories, test batteries, and
interpretation.
To some, the test design and interpretation features presented here will be viewed as the primary
contribution of this manuscript. I will be pleased with such an outcome. However, I believe an equally
important outcome is the demonstration of the evolution of new ideas via unconstrained theory and
research-based exploratory data analysis. I am very much in agreement with the multiple method (factor
analysis plus MDS) recommendation of Tucker-Drob and Salthouse (2009) who stated:
We agree with Snow and colleagues’ argument that theories of ability
organization are “at least partly determined by the techniques used to analyze the
interrelationships”…that is, just as it is important to test hypotheses in a variety of
populations, using various operationalizations (e.g., multiple indicators), it is also
important to test hypotheses using alternative analytic methods. Turkheimer, Ford,
and Oltmanns (2005) have similarly argued that any structural taxonomy is
“meaningful but arbitrary,” at best, and is only useful insofar as it communicates
and emphasizes the important and salient features of the multivariate data. By
applying two parallel methodologies, we were able to identify such features. (p.
284)
The fusion of ideas presented here are a call to go “back to the future” and “beyond CHC—to
return to old ideas with new methods and embrace new ideas, concepts, and strategies that move beyond
the confines of dominate CHC taxonomy. These proposals compliment—they do not replace—
confirmatory-based research methods; however, the possibilities of exploratory discovery in the “sandbox”
of scientific investigation are exciting, and the promise of reward for future intelligent ITD is great. Dr.
Implications of 20 Years of CHC COG-ACH Research – Kevin S. McGrew – 12-18-12 draft 51
Richard Woodcock, throughout his long and accomplished career, has demonstrated that the need to move
forward, beyond simplistic perceptions of intelligence to advance the art and practice of psychological and
educational assessment requires the heart and vision of an adventurer. One who is willing to ask questions
and respond creatively to the answers. The essence of this purpose-driven research—to seek the unknown
for the unexpected reward—is captured in Merton and Barber’s (2003) book The Travels and Adventures of
Serendipity: A Study in Sociological Semantics and the Sociology of Science:
Many a scientific adventurer sails the uncharted seas and sets his course for a
certain objective only to find unknown land and unsuspected ports in strange
parts. To reach such harbors, he must ship and sail, do and dare; he must quest and
question. These chance discoveries are called “accidental” but there is nothing
fortuitous about them, for laggards drift by a haven that may be a heaven. They
pass by ports of opportunity. Only the determined sailor, who is not afraid to seek,
to work, to try, who is inquisitive and alert to find, will come back to his home
port with discovery in his cargo. (p. 177)

Implications of 20 Years of CHC COG-ACH Research – Kevin S. McGrew – 12-18-12 draft 52
References
Ackerman, P. L. (1996). A theory of adult intellectual development: Process, personality, interests, and
knowledge. Intelligence, 22, 227–257.
Ackerman, P. L. (1997). Personality, self-concept, interests, and intelligence: Which construct doesn’t fit?
Journal of Personality, 65(2), 171-204.
Ackerman, P. L. (2000). Domain-specific knowledge as the ‘‘Dark matter’’ of adult intelligence: Gf/Gc,
personality and interest correlates. Journals of Gerontology Series B: Psychological Sciences and Social
Sciences, 55(2), 69–84.
Ackerman, P. L., Beier, M. E., & Boyle, M. O. (2002). Individual differences in working memory within a
nomological network of cognitive and perceptual speed abilities. Journal of Experimental Psychology:
General, 131(4), 567–589.
Ackerman, P. L., Bowen, K. R., Beier, M. E., & Kanfer, R. (2001). Determinants of individual differences and
gender differences in knowledge. Journal of Educational Psychology, 93(4), 797–825.
Ackerman, P. L., Chamorro-Premuzic, T., & Furnham, A. (2011). Trait complexes and academic achievement:
Old and new ways of examining personality in educational contexts. British Journal of Educational
Psychology, 81(1), 27–40.
Barrouillet, P. (2011). Dual-process theories and cognitive development: Advances and challenges.
Developmental Review, 31(2–3), 79–85.
Beauducel, A., Brocke, B., & Liepmann, D. (2001). Perspectives on fluid and crystallized intelligence: Facets for
verbal, numerical, and figural intelligence. Personality and Individual Differences, 30(6), 977–994.
Beauducel, A., & Kersting, M. (2002). Fluid and crystallized intelligence and the Berlin Model of Intelligence
Structure (BIS). European Journal of Psychological Assessment, 18(2), 97–112.
Beier, M. E., & Ackerman, P. L. (2005). Age, ability, and the role of prior knowledge on the acquisition of new
domain knowledge: Promising results in a real-world learning environment. Psychology and Aging, 20(2),
341–355.
Benson, N. (2008). Cattell-Horn-Carroll cognitive abilities and reading achievement. Journal of
Psychoeducational Assessment, 26, 27–41.
Bressler, S. L., & Menon, V. (2010). Large-scale brain networks in cognition: Emerging methods and principles.
Trends in Cognitive Sciences, 14(6), 277–290.
Implications of 20 Years of CHC COG-ACH Research – Kevin S. McGrew – 12-18-12 draft 53
Brewer, J. A., Worhunsky, P. D., Gray, J. R., Tang, Y., Weber, J., & Kober, H. (2011). Meditation experience
associated with differences in default mode network activity and connectivity. PNAS, 108 (50), 20254–
20259.
Brown, L. (Ed.). (2002). Shorter Oxford English Dictionary (5th ed., Vols. 1–2). New York: Oxford University
Press.
Carroll, J. B. (1993). Human cognitive abilities: A survey of factor-analytical studies. Cambridge, United
Kingdom: Cambridge University Press.
Carroll, J. B. (2003). The higher-stratum structure of cognitive abilities: Current evidence supports g and about ten
broad factors. In H. Nyborg (Ed.), The scientific study of general intelligence: Tribute to Arthur R. Jensen
(pp. 5–21). New York: Pergamon Press.
Cole, M. W., Yarkoni, T., Repovš, G., Anticevic, A., & Braver. T. S. (2012). Global connectivity of prefrontal
cortex predicts cognitive control and intelligence. Journal of Neuroscience, 32(26), 8988–8999.
Colom, R., Haier, R. J., Head, K., Alvarez-Linera, J., Quiroga, M. A., Shih, P. C., & Jung, R. E. (2009). Gray
matter correlates of fluid, crystallized, and spatial intelligence: Testing the P-FIT model. Intelligence,
37(2), 124–135.
Corono, L., Cronbach, L. J., Kupermintz, H., Lohman, D. F., Mandinach, E. B., Porteus, A. W., et al. (2002).
Remaking the concept of aptitude: Extending the legacy of Richard E. Snow. Mahwah, NJ: Erlbaum.
Cronbach, L. J. (1967. Instructional methods and individual differences. In R. M. Gagné (Ed.), Learning and
individual differences (pp. 23-39). Columbus, OH: Merrill.
Deary, I. J., Penke, L., & Johnson, W. (2010). The neuroscience of human intelligence differences. Nature
Reviews—Neuroscience, 11, 201-211.
Dehn, M. (2012). Children’s Psychological Processes Scale. Stoddard, WI: Schoolhouse Educational Services.
Elliott, C. D. (2007). Differential Ability Scales–II. San Antonio, TX: NCS Pearson.
Embretson, S. E. (1996). The new rules of measurement. Psychological Assessment, 8(4), 341–349.
Embretson, S. E., & Hershberger, S. L. (1999). The New Rules of Measurement. Mahwah, New Jersey: Lawrence
Erlbaum Associates.
Evans, J. S. B. T. (2008). Dual-processing accounts of reasoning, judgment, and social cognition. Annual Review
of Psychology, 59, 255–278.

Implications of 20 Years of CHC COG-ACH Research – Kevin S. McGrew – 12-18-12 draft 54
Evans, J. S. B. T. (2011). Dual-process theories of reasoning: Contemporary issues and developmental
applications. Developmental Review, 31(2–3), 86–102.
Flanagan, D. P., & Alfonso, V. C. (2011). Essentials of specific learning disability identification. New York:
Wiley & Sons.
Flanagan, D. P., Alfonso, V. C., & Mascolo, J. T. (2011). An operational definition of SLD: Integrating multiple
data sources and multiple data-gathering methods. In D. P. Flanagan, & V. C. Alfonso (Eds.), Essentials of
specific learning disability identification (pp. 233–298). New York: Wiley & Sons.
Flanagan, D. P., Fiorello, C. A., & Ortiz, S. O. (2010). Enhancing practice through application of Cattell-Horn-
Carroll theory and research: A “third method” approach to specific learning disability identification.
Psychology in the Schools, 47(7), 739–760.
Flanagan, D. P., & McGrew, K. S. (1997). A cross-battery approach to assessing and interpreting cognitive
abilities. Narrowing the gap between practice and science. In D. P. Flanagan, J. L. Genshaft, & P. L.
Harrison (Eds.), Contemporary intellectual assessment. Theories, tests, and issues (pp. 314–325). New
York: Guilford.
Flanagan, D. P., Ortiz, S. O., & Alfonso, V. (in press). Essentials of cross-battery assessment (4th ed.). New York:
Wiley & Sons.
Flanagan, D. P., Ortiz, S. O., Alfonso, V. C., & Mascolo, J. T. (2006). The achievement test desk reference (2nd
ed.) (ATDR-2). New York: Wiley.
Fletcher-Janzen, E. (2009). Intelligence testing: Bridging the gap between classical and romantic science in
assessment. In J. C. Kaufman (Ed.), Intelligence testing: Integrating psychological theory and clinical
practice (pp. 15–29). Cambridge, NY: Cambridge University Press.
Floyd, R. G., & Kranzler, J. J. (2012). Processing approaches to interpretation of information from cognitive
ability tests: A critical review. In D. P. Flanagan & P. Harrison (Eds.), Contemporary intellectual
assessment (3rd ed., pp. 497–525). New York: Guilford Press.
Floyd, R. G., McGrew, K. S., & Evans, J. J. (2008). The relative contributions of the Cattell-Horn-Carroll
cognitive abilities in explaining writing achievement during childhood and adolescence. Psychology in the
Schools, 45(2), 132–144.
Fry, A. F., & Hale, S. (1996). Processing speed, working memory, and fluid intelligence: Evidence for a
developmental cascade. Psychological Science, 7(4), 237–241.
Fry, A. F., & Hale, S. (2000). Relationships among processing speed, working memory, and fluid intelligence in
children. Biological Psychology, 54(1–3), 1–34.
Implications of 20 Years of CHC COG-ACH Research – Kevin S. McGrew – 12-18-12 draft 55
Greenspan, S. (2006). Mental retardation in the real world: Why the AAMR definition is not there yet. In H. N.
Switzky & S. Greenspan (Eds.), What is mental retardation? Ideas for an evolving disability in the 21st
century (Revised and updated edition; pp. 167–185). Washington, DC: American Association on Mental
Retardation.
Haier, R. J. (2009). Neuro-intelligence, neuro-metrics and the next phase of brain imaging studies. Intelligence,
27, 121–123.
Hale, J. B., Wycoff, K. L., & Fiorello, C. A. (2011). RTI and cognitive hypothesis testing for identification and
intervention of specific learning disabilities. The best of both worlds. In D. P. Flanagan & V. C. Alfonso
(Eds.), Essentials of specific learning disability identification (pp. 173–201). New York: Wiley & Sons.
Horn, J. (1989). Models of intelligence. In R. L. Linn (Ed.), Intelligence: Measurement, theory and public policy
(pp. 29-73). Urbana: University of Illinois Press.
Horn, J. L., & Noll, J. (1997). Human cognitive capabilities: Gf-Gc theory. D. P. Flanagan, J. L. Genshaft, & P. L.
Harrison (Eds.), Contemporary intellectual assessment: Theories, tests and issues (pp. 53–91). New York:
Guilford Press.
Hunt, E. (2011). Human intelligence. Cambridge, NY: Cambridge University Press.
Jensen, A. R. (1998). The g factor: The science of mental ability. Westport, CT: Praeger.
Jung, R. E., & Haier, R. J. (2007). The parieto-frontal integration theory (P-FIT) of intelligence: Converging
neuroimaging evidence. Behavioral and Brain Sciences, 20, 135–187.
Kahenam, D. (2011). Thinking, fast and slow. New York: Farrar, Straus, and Giroux.
Kane, M. J., Bleckley, M. K., Conway, A. R. A., & Engle, R. W. (2001). A controlled-attention view of working-
memory capacity. Journal of Experimental Psychology General, 130(2), 169–183.
Kaplan, A. (1964). The Conduct of Inquiry: Methodology for Behavioral Science. San Francisco: Chandler
Publishing.
Kaufman, A. S. (1979). Intelligent Testing with the WISC-R. New York: Wiley & Sons.
Kaufman, J. C. (2009). Intelligence testing: Integrating psychological theory and clinical practice. Cambridge,
NY: Cambridge University Press.
Kaufman, A. S., & Kaufman, N. L. (2004). Kaufman Assessment Battery for Children–Second Edition. Circle
Pines, MN: American Guidance Service.

Implications of 20 Years of CHC COG-ACH Research – Kevin S. McGrew – 12-18-12 draft 56
Kyllonen, P. C. (1996). Is working memory capacity Spearman’s g? In I. Dennis & P. Tapsfield (Eds.), Human
abilities: Their nature and measurement (pp. 49–75). Mahwah, NJ: Lawrence Erlbaum Associates.
Lohman, D. F. (1979). Spatial ability: Review and re-analysis of the correlational literature. (Stanford University
Technical Report No. 8). Stanford, CA: Stanford University.
Lohman, D. F., & Lakin, J. (2011). Reasoning and intelligence. In R. J. Sternberg and S. B. Kaufman (Eds.), The
Cambridge Handbook of Intelligence (2nd ed.) (pp. 419-441). New York: Cambridge University Press.
Lubinski, D. (2000). Scientific and social significance of assessing individual differences: “Sinking shafts at a few
critical points.” Annual Review of Psychology, 51, 405–444.
Lutz, A., Slagter, H. A., Dunne, J. D., & Davidson, R. J. (2008). Attention regulation and monitoring in
meditation. Trends in Cognitive Sciences, 12(4), 164–169.
McGrew, K. S. (1986). Clinical interpretation of the Woodcock-Johnson Tests of Cognitive Ability. Boston: Allyn
& Bacon.
McGrew, K. S. (1993). The relationship between the Woodcock-Johnson Psycho-Educational Battery–Revised
Gf-Gc cognitive clusters and reading achievement across the life-span [Monograph]. Journal of
Psychoeducational Assessment Monograph Series, 39–53.
McGrew, K. S. (1994). Clinical interpretation of the Woodcock-Johnson Tests of Cognitive Ability–Revised.
Boston: Allyn & Bacon.
McGrew, K. S. (1997). Analysis of the major intelligence batteries according to a proposed comprehensive Gf-Gc
framework. In D. P. Flanagan, J. L. Genshaft, & P. L. Harrison (Eds.), Contemporary intellectual
assessment. Theories, tests, and issues (pp. 151–180). New York: Guilford.
McGrew, K. S. (2005). The Cattell-Horn-Carroll (CHC) theory of cognitive abilities. Past, present and future. In
D. P. Flanagan & P. L. Harrison (Eds.), Contemporary intellectual assessment. Theories, tests, and issues
(pp. 136–202). New York: Guilford Press.
McGrew, K. S. CHC theory and the human cognitive abilities project. Standing on the shoulders of the giants of
psychometric intelligence research [Editorial]. (2009). Intelligence, 37, 1–10.
McGrew, K. S. (2010). The Flynn Effect and its critics: Rusty linchpins and―lookin’ for g and Gf in some of the
wrong places. Journal of Psychoeducational Assessment, 28(5), 448–468.
McGrew, K. S., & Flanagan, D. P. (1998). The intelligence test desk reference (ITDR). Gf-Gc cross-battery
assessment. Boston: Allyn & Bacon.

Implications of 20 Years of CHC COG-ACH Research – Kevin S. McGrew – 12-18-12 draft 57
McGrew, K. S., Flanagan, D. P., Keith, T. Z., & Vanderwood, M. (1997). Beyond g. The impact of Gf-Gc specific
cognitive abilities research on the future use and interpretation of intelligence tests in the schools. School
Psychology Review, 26, 177–189.
McGrew, K. S., & Hessler, G. (1995). The relationship between the WJ-R Gf-Gc cognitive clusters and
mathematics achievement across the lifespan. Journal of Psychoeducational Assessment, 13, 21–38.
McGrew, K. S., Schrank, F. A., & Woodcock, R. W. (2007). Technical manual: Woodcock-Johnson III Normative
Update. Rolling Meadows, IL: Riverside Publishing.
McGrew, K. S., & Wendling, B. (2010). CHC cognitive-achievement relations: What we have learned from the
past 20 years of research. Psychology in the Schools, 47(7), 651–675.
McGrew, K. S., Werder, J., & Woodcock, R.W. (1991). WJ-R technical manual. Chicago, IL: Riverside
Publishing.
McGrew, K. S., & Woodcock, R. W. (2001). Technical Manual. Woodcock-Johnson III. Itasca, IL: Riverside
Publishing.
McGrew, K. S., & Wrightson, W. (1997). The calculation of new and improved WISC-III subtest reliability,
uniqueness, and general factor characteristic information through the use of data smoothing procedures.
Psychology in the Schools, 34, 181–195.
McVay, J. C., & Kane, M. J. (2012). Drifting from slow to “D’oh!”: Working memory capacity and mind
wandering predict extreme reaction times and executive control errors. Journal of Experimental
Psychology: Learning, Memory, and Cognition, 38(3), 525–549.
Merton, R. K., & Barber, E. (2003). The travels and adventures of serendipity. Princeton, NJ: Princeton
University Press.
Naglieri, J. A. (2011). The discrepancy/consistency approach to SLD identification using the PASS theory. In D.
P. Flanagan & V. C. Alfonso (Eds.), Essentials of specific learning disability identification (pp. 145–172).
New York: Wiley & Sons.
Reyna, V. F., & Brainerd, C. J. (2011). Dual processes in decision making and developmental neuroscience: A
fuzzy-trace model. Developmental Review, 31(2–3), 180–206.
Reynolds, C. R. (2007). Intelligent testing. In C. R. Reynolds & E. Fletcher-Janzen (Eds.), Encyclopedia of
Special Education (3rd ed., pp. 1132–1135). Hoboken, NJ: Wiley.

Implications of 20 Years of CHC COG-ACH Research – Kevin S. McGrew – 12-18-12 draft 58
Reynolds, M. C. & Lakin, C. (1987). Noncategorical special education: Models for research and practice. In
Wang, M. C., Reynolds, M. C., & Walberg, H. J. (Eds.), Handbook of special education: Research and
Practice Volume 1—Learner characteristics and adaptive education (pp.331-356), New York: Pergamon.
Reise, S. P. & Widaman, K. F. (1999). Assessing the fit of measurement modesl at the individual level: A
comparison of item response theory and covariance structure approaches. Psychological Methods, 4(1), 3-
21.
Ricco, R. B., & Overton, W. F. (2011). Dual systems Competence � Procedural processing: A relational
developmental systems approach to reasoning. Developmental Review, 31(2–3), 119–150.
Roid, G. (2003). Stanford-Binet Intelligence Scales, Fifth Edition. Itasca, IL: Riverside Publishing.
Schneider, W. J. (2010). The Compositator 1.0. Olympia, WA: WMF Press.
Schneider, W. J. (2012). A geometric representation of composite scores and profile variability. Unpublished
manuscript.
Schneider, W. J., & McGrew, K. S. (2012). The Cattell-Horn-Carroll model of intelligence. In D. P. Flanagan &
P. L. Harrison (Eds.), Contemporary Intellectual Assessment: Theories, Tests, and Issues (3rd ed., pp. 99–
144). New York: Guilford.
Schneider, W. J., & McGrew, K. S. (in press). Cognitive performance models: Individual differences in the ability
to process information. In S. Jackson, G. Brown, & R. Laro-Alecio (Eds.), Handbook of educational
theories. Charlotte, NC: Information Age Publishing.
Schrank, F. A., & Woodcock, R. W. (2007). Woodcock-Johnson III Normative Update Compuscore and Profiles
Program [Computer software]. Itasca, IL: Riverside Publishing.
Snow, R. E. (1987). Aptitude complexes. In R. E. Farr & M. J. Farr (Eds.), Aptitude, learning and instruction:
Conative and affective process analysis (Vol. 3, pp. 11–34). Hillsdale, NJ: Lawrence Erlbaum Associates.
Snow, R. E. (1989). Aptitude-treatment interaction as a framework for research on individual differences in
learning. In P. L. Ackerman, R. J. Sternberg, & R. Glaser (Eds.), Learning and individual differences:
Advances in theory and research (pp. 13-59), New York: W. H. Freeman.
Snow, R. E., Corno, L., & Jackson, D. (1996). Individual differences in a affective and conative functions. D. C.
Berliner, & R. C. Calfee (Eds.), Handbook of Educational Psychology . New York: Simon & Schuster
Macmillan.

Implications of 20 Years of CHC COG-ACH Research – Kevin S. McGrew – 12-18-12 draft 59
Stankov, L., Boyle, G. J., & Cattell, R. B. (1995). Models and paradigms in personality and intelligence research.
In D. Saklofske & M. Zeidner (Eds.), International Handbook of Personality and Intelligence (pp. 15–43).
New York: Plenum Press.
Stanovich, K. E., West, R. F., & Toplak, M. E. (2011). The complexity of developmental predictions from dual
process models. Developmental Review, 31(2–3), 103–118.
Süß, H.-M., & Beauducel, A. (2005). Faceted models of intelligence. In O. Wilhelm & R. W. Engle (Eds.),
Handbook of understanding and measuring intelligence (pp. 313–332). London: Sage.
Toga, A. W., Clark, K. A., Thompson, P. M., Shattuck, D. W., & Van Horn, J. D. (2012). Mapping the human
connectome. Neurogurgery, 71(1), 1–5.
Tucker-Drob, E. M., & Salthouse, T. A. (2009). Confirmatory factor analysis and multidimensional scaling for
construct validation of cognitive abilities. International Journal of Behavioral Development, 33(3), 277–
285.
van den Jeuvel, Kahn, R. S., Goñi, J., & Sporns, O. (2012). High-cost, high-capacity backbone for global brain
communication. Journal of the Proceedings of the National Academic of Sciences, 109(28), 11372-7.
VandenBos, G. R. (Ed.). (2007). APA dictionary of psychology. Washington, DC: American Psychological
Association.
Wechsler, D. (2008). Wechsler Adult Intelligence Scale–Fourth Edition: Technical and interpretive manual. San
Antonio, TX: NCS Pearson.
Wilhelm, O. (2005). Measuring reasoning ability. In O. Wilhelm & R. W. Engle (Eds.), Handbook of
understanding and measuring intelligence (pp. 373–392). London: Sage.
Wittmann, W. W., & Süß, H.-M. (1999). Investigating the paths between working memory, intelligence,
knowledge, and complex problem-solving performances via Brunswick Symmetry. In P. L. Ackerman, P.
C. Kyllonen, & R. D. Roberts (Eds.), Learning and individual differences: Process, trait, and content
determinants (pp. 77–104). London: Sage.
Woodcock, R. W. (1984). A response to some questions raised about the Woodcock-Johnson: II. Efficacy of the
aptitude clusters. School Psychology Review, 13, 355–362.
Woodcock, R. W., & Johnson, M. B. (1977). Woodcock Johnson Psycho Educational Battery. Chicago: Riverside
Publishing.
Woodcock, R. W., & Johnson, M. B. (1989). Woodcock Johnson Psycho Educational Battery–Revised. Chicago:
Riverside Publishing.

Implications of 20 Years of CHC COG-ACH Research – Kevin S. McGrew – 12-18-12 draft 60
Woodcock, R. W., McGrew, K. S., Mather, N. (2001). Woodcock-Johnson III. Itasca, IL: Riverside Publishing.
Woodcock, R. W., McGrew, K. S., Mather, N., & Schrank, F. A. (2003). Woodcock-Johnson III Diagnostic
Supplement to the Tests of Cognitive Abilities. Itasca, IL. Riverside Publishing.

General Intelligence (g)
Mathematical knowledge (KM)
Mathematical achievement
(A3)
Reading decoding (RD)
Reading comprehension
(RC)
Reading speed (RS)
Spelling ability (SG)
English usage (EU)
General verbal information (K0)
Language development
(LD)
Lexical knowledge (VL)
Listening ability (LS)
Communication ability (CM)
Induction (I)
General sequential
reasoning (RG)
Quantitative reasoning (RQ)
Memory span (MS)
Working memory capacity (MW)
Associative memory (MA) *
Meaningful memory (MM) *
Free-recall memory (M6) *
Ideational fluency (FI) **
Associational fluency (FA) **
Visualization
(Vz)
Speeded
rotation (SR)
Closure speed (CS)
Flexibility of closure (CF)
Visual memory (MV)
Phonetic coding (PC)
Speech sound discrimination
(US)
Resistance to auditory stimulus
distortion (UR)
Memory for sound patterns
(UM)
Maintaining & judging rhythm
(U8)
Quantitative
(Gq)
Quantitative Knowledge
(Gq)
Reading & Writing (Grw)
Comp -Comp -Knowledge
(Gc)
Fluid Reasoning (Gf)
Short-Term Memory (Gsm)
Long-Term Long-Term Storage &
Retrieval (Glr)
Visual Processing (Gv)
Auditory Processing (Ga)
Processing
Speed (Gs)
Perceptual speed (P)
Rate of test taking (R9)
Number facility (N)
Reading speed/fluency
(RS)
Writing speed/fluency
(WS)
General
Broad
Narrow
Writing ability (WA)
Writing speed (WS)
Grammatical sensitivity (MY)
Expressional fluency (FE) **
Sens. to probs. /altern. sol.
fluency (SP) **
Originality /creativity (FO)
**
Naming facility
(NA)**
Figural fluency
(FF) **
Figural flexibility (FX) **
Spatial scanning (SS)
Serial perceptual integration (PI)
Length estimation (LE)
Perceptual illusions (IL)
Perceptual alternations (PN)
Imagery (IM)
Musical discrim. & judgment (U1
U9)
Absolute pitch (UP)
Sound localization (UL)
Word fluency
(FW) **
Acquired Knowledge + Memory
* Learning
Efficiency
** Retrieval
Fluency
General
Speed +
Sensory-Motor Domain
Specific Abilities (Sensory) +
Domain-Independent General
Capacities +
Functional groupings
Conceptual groupings
+ = additional CHC abilities in groupings
in Part 2 of model
Figure 1. CHC v2.0 Model Based on Schneider and McGrew (2012)

General Intelligence (g)
? Simple reaction time (R1)
Choice reaction time (R2)
Semantic processing speed
(R4)
Speed of limb movement (R3)
Writing speed fluency (WS)
Olfactory memory (OM)
? ?
Domain Domain Specific Know.
(Gkn)
Reaction & Decision Speed
(Gt)
Reaction & Decision Speed
(Gt)
Psychomotor Speed (Gps)
Olfactory Abilities (Go)
Tactile Abilities
(Gh)
Kinesthetic Abilities (Gk)
Psychomotor Abilities (Gp)
Static strength (P3)
Multilimbcoordination (P6)
Finger dexterity (P2)
Manual
dexterity (P1)
Arm-hand steadiness (P7)
Speed of articulation (PT)
Movement time (MT)
Mental comparison speed (R7)
Inspection time (IT)
General
Broad
Narrow
Acquired
Knowledge +
Control
precision (P8)
Aiming (A1)
Gross body equilibrium (P4)
General Speed +
Sensory-Motor Domain Specific Abilities +
Motor
Functional groupings
Conceptual groupings
+ = additional CHC abilities in groupings
in Part I of model
Figure 1 (continued). CHC v2.0 model based on Schneider and McGrew (2012)
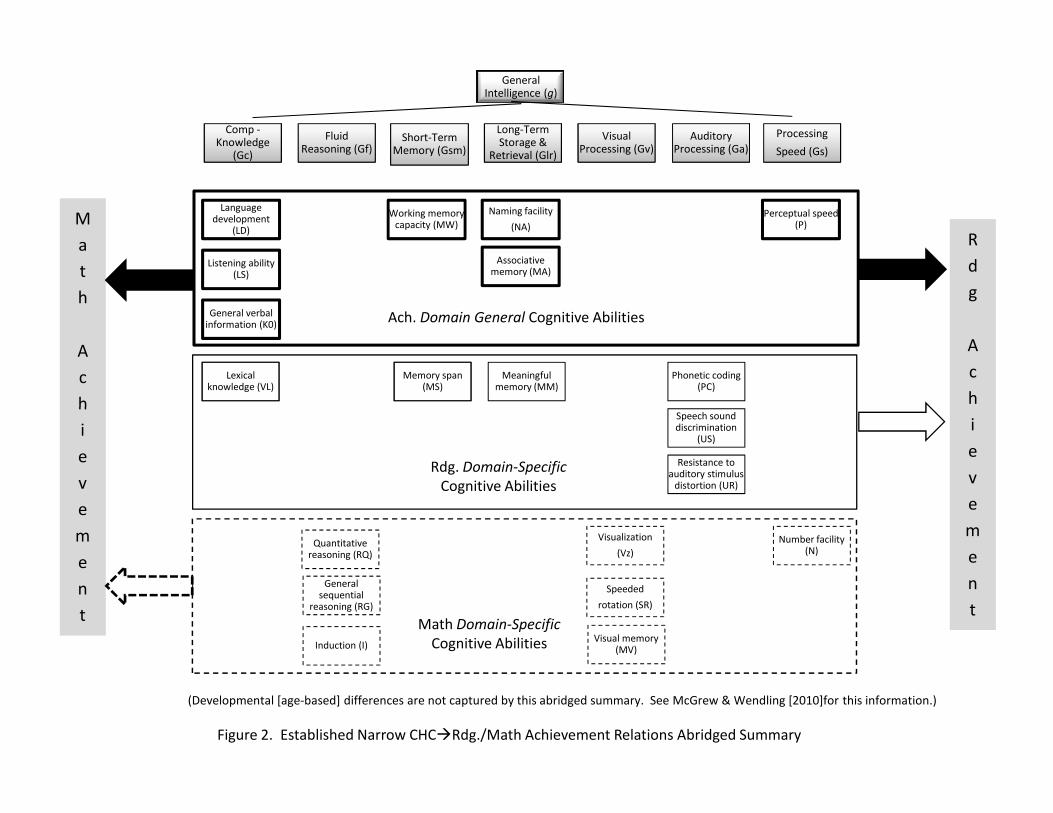
General verbal information (K0)
Language development
(LD)
Listening ability (LS)
Working memory capacity (MW)
Associative memory (MA)
Naming facility
(NA)
Lexical knowledge (VL)
Memory span (MS)
Meaningful memory (MM)
Phonetic coding (PC)
General Intelligence (g)
Comp -Comp -Knowledge
(Gc)
Fluid Reasoning (Gf)
Short-Term Memory (Gsm)
Long-Term Long-Term Storage &
Retrieval (Glr)
Visual Processing (Gv)
Auditory Processing (Ga)
Processing
Speed (Gs)
Perceptual speed (P)
R
d
g
A
c
h
M
a
t
h
A
c
h
Ach. Domain General Cognitive Abilities
Figure 2. Established Narrow CHC�Rdg./Math Achievement Relations Abridged Summary
Speech sound discrimination
(US)
Resistance to auditory stimulus
distortion (UR)
Induction (I)
General sequential
reasoning (RG)
Quantitative reasoning (RQ)
Visualization
(Vz)
Speeded
rotation (SR)
Visual memory (MV)
Number facility (N)
h
i
e
v
e
m
e
n
t
h
i
e
v
e
m
e
n
t
Rdg. Domain-Specific
Cognitive Abilities
Math Domain-Specific
Cognitive Abilities
(Developmental [age-based] differences are not captured by this abridged summary. See McGrew & Wendling [2010]for this information.)
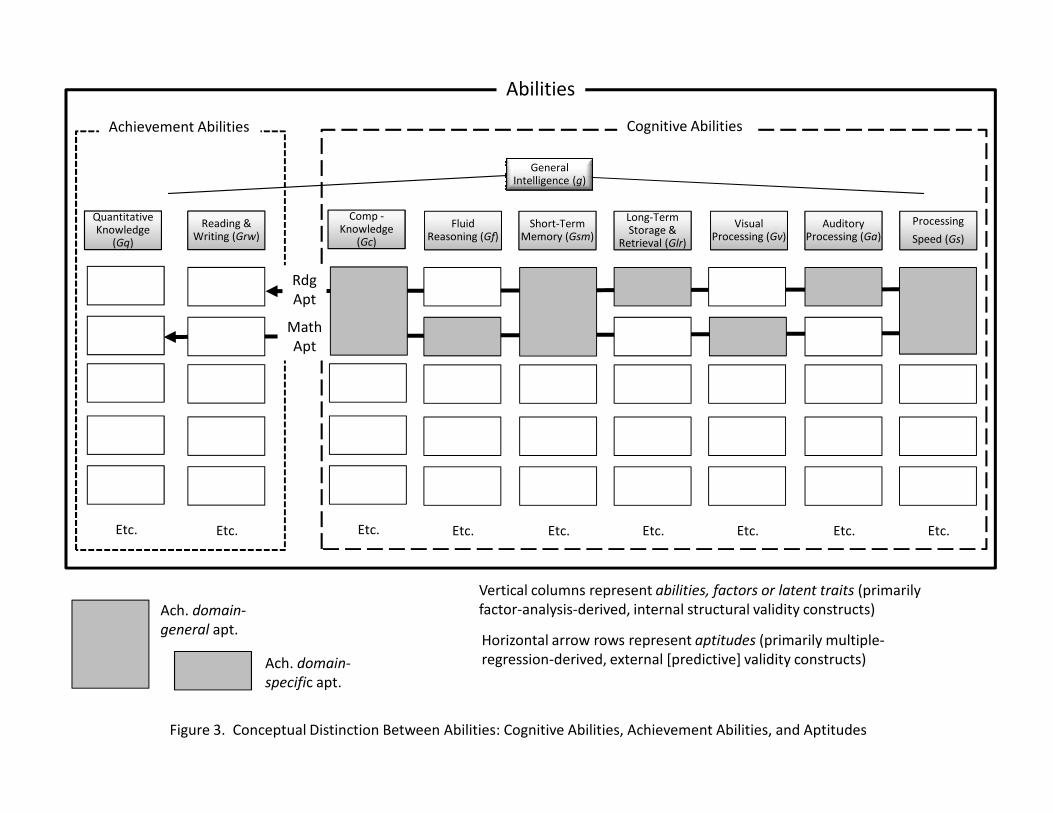
General Intelligence (g)
Long-Term
Retrieval (Glr)
Long-Term Storage &
Retrieval (Glr)
Visual Processing (Gv)
Fluid Reasoning (Gf)
Short-Term Memory (Gsm)
Auditory Processing (Ga)
Processing
Speed (Gs)
Comp -
(Gc)
Comp -Knowledge
(Gc)
Reading & Writing (Grw)
Quantitative Quantitative Knowledge
(Gq)
Abilities
Cognitive AbilitiesAchievement Abilities
Rdg
Apt
Math
Apt
Figure 3. Conceptual Distinction Between Abilities: Cognitive Abilities, Achievement Abilities, and Aptitudes
Etc. Etc.Etc. Etc. Etc. Etc.Etc.Etc.Etc.
Ach. domain-
general apt.
Ach. domain-
specific apt.
Vertical columns represent abilities, factors or latent traits (primarily
factor-analysis-derived, internal structural validity constructs)
Horizontal arrow rows represent aptitudes (primarily multiple-
regression-derived, external [predictive] validity constructs)

Figure 4. Two Illustrative CHC General Selective Referral-Focused Assessment (SRFA) Scenarios: BRS problems for ages 6 to 8 yrs

0.20
0.35
0.50Value
Sta
nd
ard
ize
d r
eg
ress
ion
co
eff
icie
nt
Vis-Aud Learning (Glr-MA)
0 5 10 15 20
TECHAGE
-0.10
0.05
Age group (in years)
Sta
nd
ard
ize
d r
eg
ress
ion
co
eff
icie
nt
Figure 5. Raw and Smoothed Standardized Regression Coefficients for WJ III Verbal Comprehension and Visual-
Auditory Learning Tests as Predictors of WJ III Basic Reading Skills (BRS) Cluster from Ages 5 Through 18
Verbal Comp. (Gc-LD/VL)
0
*
(* Note. Y-axis Minimum Value
of -0.10 Used as Some
Regression Coefficients Were
Less Than Zero and Negative)

0.1
0.2
0.3
0.4
0.5
Value
Sta
nd
ard
ize
d r
eg
ress
ion
co
eff
icie
nt
Verbal Comp. (GcLD/VL)
Verbal Comp. (Gc-LD/VL)
Sound Awareness (Ga-PC/Gsm-MW)
Numbers Reversed (Gsm-Wm)
Numbers Reversed (Gsm-Wm)
Sound Blending (Ga-PC)
Sound Blending (Ga-PC)
Vis-Aud Learning (Glr-MA)
Visual Matching (Gs-P)
Visual Matching (Gs-P)
0 5 10 15 20
TECHAGE
-0.1
0.0
Age group (in years)
Sta
nd
ard
ize
d r
eg
ress
ion
co
eff
icie
nt
Sound Awareness (Ga-PC/Gsm-MW) Vis-Aud Learning (Glr-MA)
Figure 6. Smoothed Standardized Regression Coefficients of Best Set of WJ III Cognitive Test Predictors of WJ III Basic Reading Skills (BRS)
Cluster from Ages 5 Through 18
Table is percent of BRS variance accounted for by GIA-Std and BRS Aptitude as constructed and weighted per the figure.
Age 5 6 7 8 9 10 11 12 13 14 15 16 17 18
GIA-Std 33 40 42 39 41 50 43 35 43 48 48 48 59 45
BRS Apt 50 49 50 48 45 56 48 43 50 54 52 52 63 52
Difference 17 9 8 9 4 6 5 8 7 6 4 4 4 7
(* Note. Y-axis Minimum Value
of -0.1 Used as Some Regression
Coefficients Were Less Than Zero
and Negative)
*

0.1
0.2
0.3
0.4
0.5
0.6
Regression coefficient Verbal Comp. (Gc-LD/VL)
Analysis-Synthesis (Gf-RG)
Number Matrices (Gf-RQ)
Visual Matching (Gs-P)
Analysis-Synthesis (Gf-RG)
Verbal Comp. (Gc-LD/VL)
Number Matrices (Gf-RQ)Numbers Reversed(Gsm-MW)
Numbers Reversed(Gsm-MW)
Sta
nd
ard
ize
d r
eg
ress
ion
co
eff
icie
nt
Figure 7. Smoothed Standardized Regression Coefficients of Best Set of WJ III Cognitive Test Predictors of WJ III Math Reasoning (MR)
Cluster from ages 5 thru 18
Table is percent of MR variance accounted for by GIA-Std and MR Aptitude as constructed and weighted per the figure
0 5 10 15 20
Age group (in years)
-0.1
0.0Regression coefficient
Visual Matching (Gs-P)
Number Matrices (Gf-RQ)Numbers Reversed(Gsm-MW)
Sta
nd
ard
ize
d r
eg
ress
ion
co
eff
icie
nt
Age group (in years)
Age 5 6 7 8 9 10 11 12 13 14 15 16 17 18
GIA-Std 32 39 44 46 53 56 50 60 64 56 53 65 53 47
MR Apt 46 42 47 53 56 61 62 63 71 72 64 77 64 66
Difference 14 3 3 7 3 5 12 3 7 12 11 12 11 19
(* Note. Y-axis Minimum Value
of -0.1 Used as Some Regression
Coefficients Were Less Than Zero
and Negative)
*
0

Pic. Recognition
Visual Matching
Decision Speed
Gv
GsMem. Span
(MS)
Oral Comp.Gc
Gen. Info.
Block Rotation
Spat. Relations Verbal Comp.
Cross Out
Mem.for Names
Mem.for Sent.
Mem.for Words
Wrk. Mem.
(MW)Num. Reversed
Aud. Wrk. Mem.
Cognitive efficiencyIndirect effect
Direct effect
Chi-square = 1016.5 df = 239
GFI = .93; AGFI = .91; PGFI = .74
RMSEA = .055 (.051 - .058)
Sound Blending
Gf
Glr
Ga Word
AttackInc. Words
Sound Patterns
Vis.-Aud. Lrg.
DR Vis-Aud.Lrg.
Ret. Fluency
Word Attack
gAnal.-Synth.
Conc. Form.
Numerical Reas.
.27
Ages 6-8
Figure 8. Plausible CHC/IP COG�Word Attack Causal Model in WJ III Norm Data (ages 6 - 8)
Effects
Direct Indirect Total
Gs 0.19 0.40 0.59
Gsm-MS 0.00 0.34 0.34
Gsm-MW 0.00 0.54 0.54
g 0.36 0.23 0.59
Ga 0.27 0.00 0.27

0
1
2
Glr (MA)
Gsm (MS)
Ga (PC)
Gc (LD/VL)
BCA
Ext
MAPT
GRWAPT
Gv (MV/CS)
WJ-R CHC factor clusters
C
BA
Notes on WJ-R Derived Scholastic
Aptitude Clusters (SAPTs)
GRWAPT = Gc(LD/VL) + Gs(P) + Ga(PC) + Glr(VAL)
or Gsm-MS
(RAPT and WLAPT nearly overlapped in figure.
Given their high degree of overlap, they were
combined into a single GRWAPT in the figure.)
MAPT = Gc(LD/VL) + Gs(P) + Gf(I) + Gf(RG)
-WJ-R SAPTs each composed of 4 tests with equal
weightings (.25)
-Bold font designates shared test CHC ability
content in GRWAPT and MAPT
-2 -1 0 1 2
-2
-1
Gs (P)
Gf (I/RG)MAPT
BRDG
BWLANG
BMATH
WJ-R broad achievement clusters
WJ-R Broad Cognitive Ability &
Scholastic Aptitude clusters
A:B = Visual-figural/numeric-quantitative - auditory-linguistic/language-verbal dimension
C:D = Cognitive operations/processes - acquired knowledge/product dimension
D
Note: Measures closer to the center are
more cognitively complex. The distance
between points represents the inter-
relations between variables. Highly-related
variables are spatially closer-have less
distance between their circles.
Figure 9. Guttman Radex MDS
Analysis Summary of WJ-R Cognitive,
Aptitude, and Achievement Measures
Across All Ages in WJ-R Norm Sample

Math (Gq) cognitive-aptitude-
achievement trait complex
0
1
2
Glr (MA)
Gsm (MS)
Ga (PC)
Gc (LD/VL)
Gf (I/RG)
BCA
Ext
MAPTBRDG
GRWAPT
Gv (MV/CS)
Notes on WJ-R Derived Scholastic
Aptitude Clusters (SAPTs)
GRWAPT = Gc(LD/VL) + Gs(P) + Ga(PC) + Glr(MA)
or Gsm-MS
(RAPT and WLAPT nearly overlapped in figure.
Reading/Writing (Grw)
cognitive-aptitude-
achievement trait complex
C
BA
r =.55
-2 -1 0 1 2
-2
-1
Gs (P)
BWLANG
BMATH
Angle = approximately 57o
r = approximately .55
(RAPT and WLAPT nearly overlapped in figure.
Given their high degree of overlap, they were
combined into a single GRWAPT in the figure.)
MAPT = Gc(LD/VL) + Gs(P) + Gf(I) + Gf(RG)
-WJ-R SAPTs each composed of 4 tests with equal
weightings (.25)
-Bold font designates shared test CHC ability
content in GRWAPT and MAPT
WJ-R CHC factor clusters
WJ-R broad achievement clusters
WJ-R Broad Cognitive Ability &
Scholastic Aptitude clusters
D
Figure 10. WJ III-Based Reading and Math Cognitive-Aptitude-Achievement Trait Complexes (CAATCs)
A:B = Visual-figural/numeric-quantitative - auditory-linguistic/language-verbal dimension
C:D = Cognitive operations/processes - acquired knowledge/product dimension
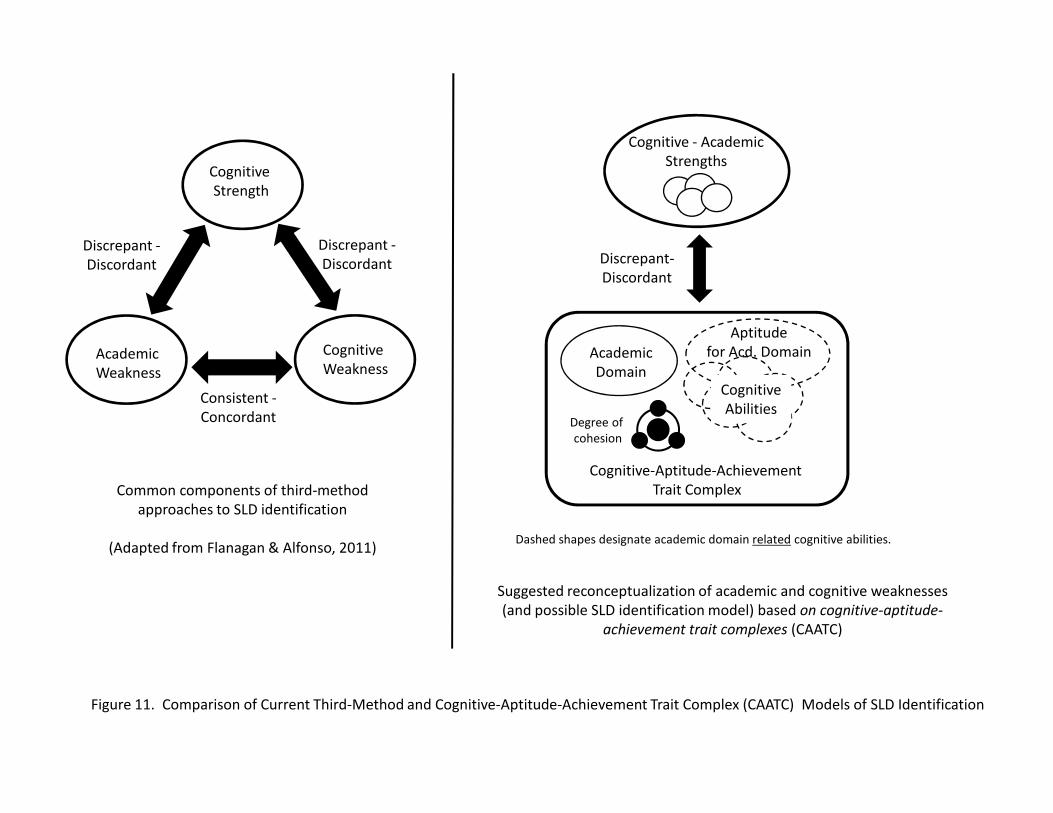
Cognitive
Strength
Academic
Weakness
Cognitive
Weakness
Discrepant -
Discordant
Discrepant -
Discordant
Consistent -
Concordant
Cognitive - Academic
Strengths
Discrepant-
Discordant
Academic
Domain
Aptitude
for Acd. Domain
Cognitive
AbilitiesConsistent -
Concordant
Common components of third-method
approaches to SLD identification
(Adapted from Flanagan & Alfonso, 2011)
Suggested reconceptualization of academic and cognitive weaknesses
(and possible SLD identification model) based on cognitive-aptitude-
achievement trait complexes (CAATC)
Dashed shapes designate academic domain related cognitive abilities.
Cognitive-Aptitude-Achievement
Trait Complex
Degree of
cohesion
Abilities
Figure 11. Comparison of Current Third-Method and Cognitive-Aptitude-Achievement Trait Complex (CAATC) Models of SLD Identification

0
1
2
GcGlr
Gv
Gv3
Ga
Gf
Gf3
Gsm
PHNAWR
PHNAW3
WRKMEM
ASMEM
VISUAL
SNDISC
AUDMS
RDGBR
GIA-ExtRDGCMP
GIA-Ext and three-test broad clusters
Two-test broad clusters
Two-test narrow clusters
-2 -1 0 1 2
-2
-1
Gf3
Gs
WRKMEM
PERSPD
MTHBR
MTHCAL
MTHREA
RDGBR
RDGBS
NUMREA
Figure 12. MDS Radex Model-Based Cognitive Complexity Analysis of Primary WJ III Clusters