Implementing quantitative pest risk analyses in planted ... · Implementing quantitative pest risk...
24
.01 Implementing quantitative pest risk analyses in planted forest: the case study of the pine processionary moth Régolini M., Dulaurent A.-M., Jacquet J.S., Meredieu C., Orazio C., Piou D., Samalens J.C., Jactel H. Umr BIOGECO, INRA, 33612 Cestas, France EFIATLANTIC (European Forest Institute-Atlantic Regional Office), Cestas, France 17/05/2013
Transcript of Implementing quantitative pest risk analyses in planted ... · Implementing quantitative pest risk...
.01
Implementing quantitative pest risk analyses in planted forest: the case study of the pine processionary moth
Régolini M., Dulaurent A.-M., Jacquet J.S., Meredieu C., Orazio C., Piou D., Samalens J.C., Jactel H.
Umr BIOGECO, INRA, 33612 Cestas, France EFIATLANTIC (European Forest Institute-Atlantic Regional Office), Cestas, France
17/05/2013

.02
INTRODUCTION
Régolini M./ Implementing quantitative pest risk analyses in planted
forest: the case study of the Pine processionary moth
17/05/2013
Climate change and increase in global trade trigger new forest risks, especially biotic risks
Raise concern for forest health & need to better evaluate risk in this changing world
o Increasing introduction and establishment of invasive species
o Higher intensity and frequency of pest outbreaks, expansion of their natural range

.03
INTRODUCTION
Régolini M./ Implementing quantitative pest risk analyses in planted
forest: the case study of the Pine processionary moth
17/05/2013
Risk = Hazard Χ Vulnerability Χ Impact
However such comprehensive risk analysis are rarely made due to a lack of knowledge or data
Susceptibility of tree or stand to hazard
Cause of damage (windstorm, pest insect)
Values at stake = socioeconomic impact of damage
To make a risk analysis we need to combine information about
- the likelihood of hazard (spatiotemporal dynamics of pest population)
- the level of tree/stand resistance to hazard
- the cost of damage

.04
INTRODUCTION
Pine processionary moth (PPM) on maritime pine in South-West France as an example
o PPM is the main pine defoliator in the mediterranean
Basin (including SW France).
Frequent defoliations (cyclic epidemics) are causing
significant growth reduction (Jacquet J.-S., 2012), and
then economic losses thus questioning the relevance of
pesticide application (Gatto et al., 2008)
o Well-studied insect (more than 30 years of research)
o Long-term monitored insect by the Forest Health
Department (since 1980)
Relevant case study for full risk analysis
Figure by A-M. Dulaurent, 2010
Photo By I. Van Halder
Régolini M./ Implementing quantitative pest risk analyses in planted
forest: the case study of the Pine processionary moth
17/05/2013

.05
Step by step risk analysis for PPM
Hazard Χ Vulnerability Χ Impact
Based on past outbreaks records Relationship between PPM
defoliation and tree growth loss
Patterns of individual tree and stand level PPM infestation
Régolini M./ Implementing quantitative pest risk analyses in planted
forest: the case study of the Pine processionary moth
17/05/2013

.06
Hazard Χ Vulnerability Χ Impact
Based on past outbreaks records Relationship between PPM
defoliation and tree growth loss
Patterns of individual tree and stand level PPM infestation
Régolini M./ Implementing quantitative pest risk analyses in planted
forest: the case study of the Pine processionary moth
17/05/2013
PPM temporal occurrence

.07
PPM temporal occurrence
PPM network-Winter 2009-2010 Percentage of defoliated tree per plot
Régolini M./ Implementing quantitative pest risk analyses in planted
forest: the case study of the Pine processionary moth
17/05/2013
The temporal occurrence of PPM has been monitored
for the last 30 years by the Forest Health Department
using standardized protocol in permanent plots.
Treatment against PPM
South-Western France

.08
0
0,05
0,1
0,15
0,2
0,25
0,3
0,35
0,4
0,45
19
81
19
82
19
83
19
84
19
85
19
86
19
87
19
88
19
89
19
90
19
91
19
92
19
93
19
94
19
95
19
96
19
97
19
98
19
99
20
00
20
01
20
02
20
03
20
04
20
05
20
06
20
07
20
08
20
09
20
10
20
11
20
12
Outbreaks cycle of PPM in the Landes de Gascogne : percent of infested trees
PPM hazard : maritime pine trees can experience at least 5 PPM outbreaks before the final harvesting
17/05/2013
PPM temporal occurrence
40 years
10 years
Stand rotation

.09
Hazard Χ Vulnerability Χ Impact
Based on past outbreaks records Relationship between PPM
defoliation and tree growth loss
Patterns of individual tree and stand level PPM infestation
Régolini M./ Implementing quantitative pest risk analyses in planted
forest: the case study of the Pine processionary moth
17/05/2013
Probability of pines to be infested by PPM

.010
0
0,05
0,1
0,15
0,2
0,25
0,3
0,35
0,4
0,45
19
81
19
82
19
83
19
84
19
85
19
86
19
87
19
88
19
89
19
90
19
91
19
92
19
93
19
94
19
95
19
96
19
97
19
98
19
99
20
00
20
01
20
02
20
03
20
04
20
05
20
06
20
07
20
08
20
09
20
10
20
11
20
12
Outbreaks cycle of PPM in the Landes de Gascogne : percent of infested trees
Régolini M./ Implementing quantitative pest risk analyses in planted
forest: the case study of the Pine processionary moth
17/05/2013
Zoom 2005 Probability of pines to be infested by PPM
2005 : year of our study
.011
Age
Fig.8
(Inside trees = trees from interior plots)
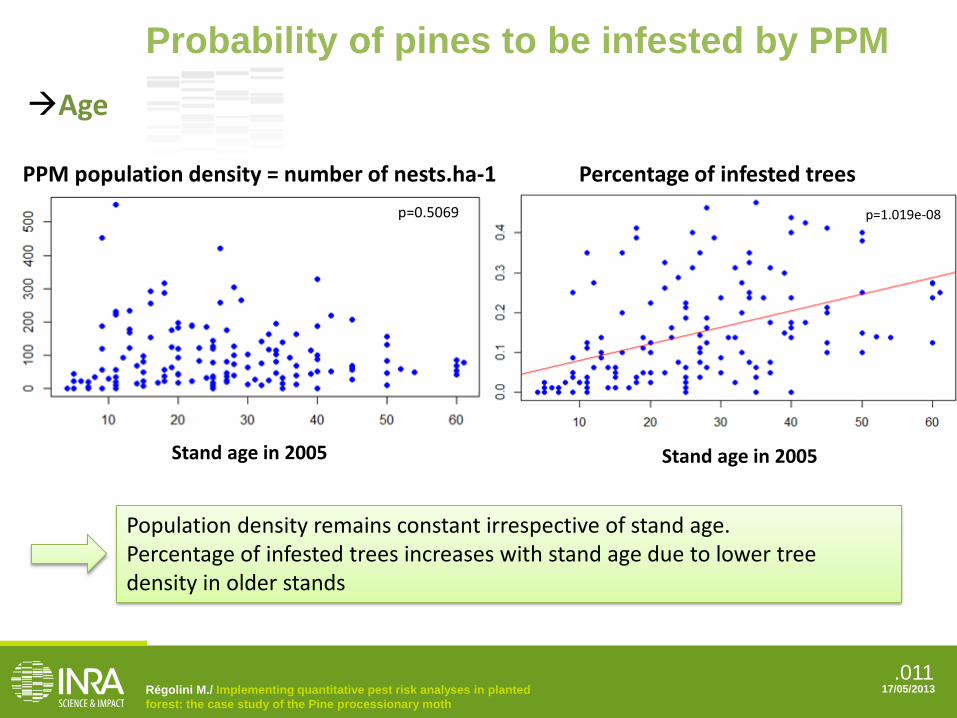
Population density remains constant irrespective of stand age. Percentage of infested trees increases with stand age due to lower tree density in older stands
Régolini M./ Implementing quantitative pest risk analyses in planted
forest: the case study of the Pine processionary moth
17/05/2013
Probability of pines to be infested by PPM
PPM population density = number of nests.ha-1
Stand age in 2005
Percentage of infested trees
Stand age in 2005
p=1.019e-08
p=0.5069

.012
Probability of pines to be infested by PPM
35-45 years 25-35 years
Age Χ Size (data from thesis : J.-C. Samalens, 2009 and A.-M. Dulaurent, 2010)
Fig.8
(Inside trees = trees from interior plots)
Taller trees are more likely to be infested by PPM regardless of their age
Régolini M./ Implementing quantitative pest risk analyses in planted
forest: the case study of the Pine processionary moth
17/05/2013
5-15 years 15-25 years
p<0.0001 p<0.0001
p<0.0001 p=0.006
Frequency distribution of tree diameters for infested vs. non-infested maritime pine trees by PPM for 4 classes of stand age (Kolmogorov Smirnov test)

.013
Tree location in the stand : edge vs. interior trees
Breakpoint =7.55 ± 0.55m demonstrating an edge effect ending after the 2nd row
Régolini M./ Implementing quantitative pest risk analyses in planted
forest: the case study of the Pine processionary moth
17/05/2013
stand
edge
interior
Probability of pines to be infested by PPM
Average number of nests per tree depending on tree distance to the edge
Distance to the edge (m)
.

.014
Tree location in the stand : edge vs. interior trees (data from thesis : J.-C. Samalens, 2009 and A.-M. Dulaurent, 2010)
Régolini M./ Implementing quantitative pest risk analyses in planted
forest: the case study of the Pine processionary moth
17/05/2013
stand stand
edge
interior
Probability of pines to be infested by PPM
Mean percent of infested trees per stand
Relationship between mean stand percent of infested trees and interior and edge percent of infested trees
interior edge

.015 JOUR / MOIS / ANNEE
Tree location in the stand : edge aspect (data from thesis : J.-C. Samalens, 2009 and A.-M. Dulaurent, 2010)
Fig.8
(Inside trees = trees from interior plots)
Stands facing West and South-West are significantly more infested
0
0,05
0,1
0,15
0,2
0,25
N
NE
E
SE
S
SW
W
NW
Effects of stand edge aspect on PP moth infestation
Expected proportion ofdamaged treesObserved proportion ofdamaged trees
Régolini M./ Implementing quantitative pest risk analyses in planted
forest: the case study of the Pine processionary moth
Probability of pines to be infested by PPM

.016 NOM DE L’AUTEUR / NOM DE LA PRESENTATION JOUR / MOIS / ANNEE
Relationship between infestation and defoliation
Fig.8
(Inside trees = trees from interior plots)
Probability of pines to be infested by PPM
y = 4,5812e2,27x R² = 0,9427
0
5
10
15
20
25
30
35
40
45
50
0 0,2 0,4 0,6 0,8 1 1,2
Mean percentage of infested trees
Relationship between % defoliation and mean percentage of infested trees

.017
Step by step risk analysis for PPM
Hazard Χ Vulnerability Χ Impact
Based on past outbreaks records Relationship between PPM
defoliation and tree growth loss
Patterns of individual tree and stand level PPM infestation
Régolini M./ Implementing quantitative pest risk analyses in planted
forest: the case study of the Pine processionary moth
17/05/2013
Impact resulting from PPM defoliation

.018
Impact resulting from PPM defoliation
Defoliation intensity
Rad
ial g
row
th lo
ss
(co
mp
aris
on
wit
h c
on
tro
l tre
es)
Meta-analysis of defoliation intensity resulting from Thaumetopoea pityocampa on maritime pine growth loss (Figure by J.-S. Jacquet, 2012)
PPM impact : Tree growth loss increases linearly with increasing defoliation intensity
Régolini M./ Implementing quantitative pest risk analyses in planted
forest: the case study of the Pine processionary moth
17/05/2013

.019
Data integration : PP3
Régolini M./ Implementing quantitative pest risk analyses in planted
forest: the case study of the Pine processionary moth
17/05/2013
To summarize, the probability of a tree to be more or less defoliated depends on : tree age, tree size, location in the stand and stand aspect.
We need to integrate this information in an individual-centered tree growth model.
PP3 is an empirical individual-centered tree growth model available for monospecific and even-aged stands of maritime pine of South-West France

.020
Data integration : PP3
t=n
t=1 Theoretical (or real) initial stand Initial stand: Age≥7 years, density, G, Hdom
Final stand: density, G, Hdom
Silvicultural practices : thinnings
Régolini M./ Implementing quantitative pest risk analyses in planted
forest: the case study of the Pine processionary moth
17/05/2013
Theoretical final stand
Dyear2=Dyear1+ΔDt
PP3 Empirical tree growth model for Maritime pine calibrated on undammaged, healthy stand and trees

.021
Data integration : Capsis- PP3
Theoretical (or real) initial stand Edge: yes-no Edge depth Aspect : N, S, E, W…
Initial stand: Age≥7 years, density, G, Hdom
Final stand: density, G, Hdom
Régolini M./ Implementing quantitative pest risk analyses in planted
forest: the case study of the Pine processionary moth
17/05/2013
Dyear2=Dyear1+ΔDt – growth loss
Final stand : exposed to PPM defoliation
Dyear2=Dyear1+ΔDt – growth loss
Initial edge part Initial interior part
Final edge Final interior
t=n
t=1
7-year cycles of PPM infestations : % of infested tree, defoliation for each year
Higher level of infestation Bigger trees infested in priority
Silvicultural practices : thinnings
Dyear2=Dyear1+ΔDt Dyear2=Dyear1+ΔDt

.022
Conclusion
Régolini M./ Implementing quantitative pest risk analyses in planted
forest: the case study of the Pine processionary moth
17/05/2013
Full risk analysis
Pest population dynamics
Stand susceptibility to pest
Tree response to pest damage
Tree growth model

.023
Prospects
Régolini M./ Implementing quantitative pest risk analyses in planted
forest: the case study of the Pine processionary moth
Stand
Region
New managment
Upscaling
17/05/2013
Use the modeling tool to perform risk analyses for two important issues: - The effect of new planted forest management strategies - Assessement of risk at the regional level
.024
Thank you !