Implementing New Continuous Integration Tooljultika.oulu.fi/files/nbnfioulu-201706022481.pdf ·...
78
Implementing New Continuous Integration Tool University of Oulu Degree Programme on Information Processing Science Master’s Thesis Marko Saari 24.05.2017
Transcript of Implementing New Continuous Integration Tooljultika.oulu.fi/files/nbnfioulu-201706022481.pdf ·...

Implementing New Continuous Integration Tool
University of Oulu
Degree Programme on Information
Processing Science
Master’s Thesis
Marko Saari
24.05.2017
2
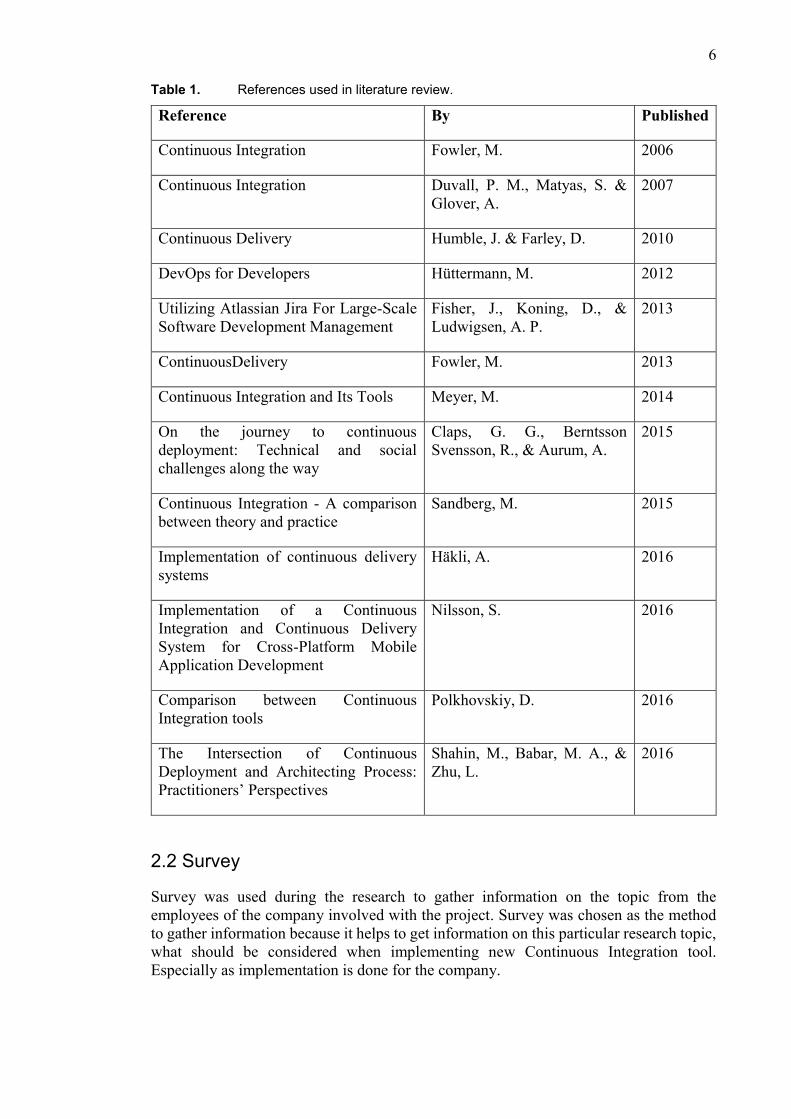
Abstract
This thesis studied the implementation of new Continuous Integration tool by focusing
on existing problems and possible arising problems when implementing the new
Continuous Integration tool. The thesis supported a project run by one international
software development company with the main goal of replacing the current Continuous
Integration tool from CruiseControl.NET with some more suitable alternative tool. The
purpose of this thesis was to research about the topic and the existing tool to support the
project in the implementation of the new Continuous Integration tool.
On the literature review, first the current state of Continuous Integration tool in the
company was discussed. Then the literature review focused on the research about
Continuous Integration, Continuous Delivery and Continuous Deployment. Alternative
Continuous Integration tools were also studied as the company had two Continuous
Integration tools to choose from: Bamboo and Jenkins.
The problems of the current Continuous Integration tool in the company were studied by
conducting a survey. This survey was based on existing studies on the problems of
Continuous Integration tools. Pilot testing and reviews also had impact on the final
survey. 37 people out of the target population (89) participated in the survey. Survey
results showed that those 37 people had different background but most of them had a long
history in the company. Some participants did not answer all of the questions.
Two lists of issues were created by analyzing the survey results: Issues of current
Continuous Integration tool and Issues when implementing new Continuous Integration
tool. Two biggest issues from the list of issues of the current Continuous Integration tool
were Lack of hardware and Build duration. Solution for these is that better hardware
solves the Lack of hardware and improves the build duration with better hardware
capacity and parallelization. Two biggest issues from the list of issues when
implementing new Continuous Integration tool were Resistance to change and Lack of
knowledge. The findings from past research suggest that implementing new Continuous
Integration tool requires change of work of everyone to actually work. The solution for
Lack of knowledge was that training is required for employees to actually know the way
of using the new Continuous Integration tool. Suggested solutions were based on existing
research and on the survey results.
The study provided two lists of Continuous Integration tool problems and proposals for
possible solutions for those. The results can be used for selecting Continuous Integration
tool as the study compared the results between Bamboo and Jenkins. Comprehensive
study on the problems of Continuous Integration tool and the comparison of Continuous
Integration tools provided reasoned support for the project of the company.
Keywords
Continuous Delivery, Continuous Integration, Continuous Deployment, Continuous
Integration tool
Supervisors
Professor Mika Mäntylä and Päivi Raulamo-Jurvanen

3
Contents
Abstract ........................................................................................................................................ 2 Contents ....................................................................................................................................... 3 1. Introduction ............................................................................................................................ 4 2. Research question and method .............................................................................................. 5
2.1 Literature review ............................................................................................................... 5 2.2 Survey ............................................................................................................................... 6 2.2.1 SurveyMonkey ............................................................................................................... 7 2.2.2 Target population........................................................................................................... 7 2.2.3 Survey answering time ................................................................................................... 7 2.2.4 Survey description .......................................................................................................... 7 2.2.5 Survey’s data-analysis .................................................................................................... 8
3. Literature review................................................................................................................... 10 3.1 Continuous Integration ................................................................................................... 10 3.2 Current Continuous Integration system in the company ................................................ 11 3.3 Continuous Delivery ........................................................................................................ 11 3.4 Continuous Deployment ................................................................................................. 13 3.5 Implementing Continuous Delivery system..................................................................... 14 3.6 Alternative Continuous Integration tools for the company............................................. 15
4. Findings ................................................................................................................................. 17 4.1 Background ..................................................................................................................... 17 4.2 Problems of the current Continuous Integration tool ..................................................... 21 4.3 Possible problems when implementing new Continuous Integration tool ..................... 30 4.4 Problems of the survey ................................................................................................... 33
5. Discussion ............................................................................................................................. 35 5.1 The biggest issues of the current Continuous Integration tool ....................................... 35 5.2 Solutions for the issues of current Continuous Integration tool ..................................... 37 5.3 The biggest issues when implementing new Continuous Integration tool ...................... 43 5.4 Solutions for the issues when implementing new Continuous Integration tool ............. 44 5.5 Benefits of Bamboo and Jenkins ..................................................................................... 48 5.6 Results ............................................................................................................................. 50
6. Conclusion............................................................................................................................. 52 6.1 Limitations of the research ............................................................................................. 52
References ................................................................................................................................. 53 Appendix A: Survey .................................................................................................................... 56 Appendix B: Results of Spearman’s Rho of the top 10 issues of current build platform ............ 62 Appendix C: Results of Spearman’s Rho of the top 7 possible issues when implementing
new build platform ............................................................................................................... 72

4
1. Introduction
At the end of 2016 a project started in one international software development company.
The goal of the project was to implement a new Continuous Integration tool for the
company to improve the building of its products. The project is divided to two parts:
research for the solution and actual implementation of a new Continuous Integration tool.
Like many other companies, the company saw a need to shorten software delivery times.
Continuous Delivery is one answer to that as it makes delivery faster and tries make sure
there are less bugs. In that way, it also makes the software more reliable. This Master’s
thesis is part of that project and is done to support the goal of the project by focusing on
the research question What should be considered when implementing new Continuous
Integration tool? So, the purpose of this thesis is to research about the topic and the
existing system to support the project in the implementation of the new Continuous
Integration tool.
This research is done with the help of the company. The company has current interest in
the topic and has a project going on which is related to the topic of this research. The
main goal of that project is to change automated Continuous Integration tool from
CruiseControl.NET to either Atlassian’s Bamboo or Jenkins. The company is involved in
the research mainly in the form of employees answering a survey. In an ideal situation,
this Master’s thesis would be finished after the whole project would be finished.
Unfortunately, this isn’t possible since the Master’s thesis is scheduled to be finished
during spring of 2017 while the implementation of the new Continuous Integration tool
is most likely finished during summer of 2017.
The structure of the thesis is as follows: Research question and method chapter introduces
the research question, its supportive research questions, research methods and
information on how the research was done. It also provides information on the literature
review, used survey and how the results of the survey data were analyzed. The next
chapter focuses on literature review. The literature review provides necessary background
information on the research topic to be able to understand it in more detail. The literature
review chapter has six sub chapters which describe different topics relating to the
Continuous Delivery: Continuous Integration, Current Continuous Integration tool in the
company, Continuous Delivery, Continuous Deployment, Implementing Continuous
Delivery system and Alternative Continuous Integration tools for the company.
Continuous Integration means in short that the development team is frequently integrating
their work and those integrations are then verified by automated build and tests to detect
possible integration errors as soon as possible. Then the Continuous Delivery means as
the name says, a software development where you continuously build software in a way
that it can be delivered and released to production at any time when wanted. And
Continuous Deployment means that every development change goes through the pipeline
and automatically gets put into production. Before implementing Continuous Delivery
you need to have implemented Continuous Integration.
The research focuses on the findings presented after the literature review. The chapter
Findings presents the results from the survey with supporting graphs and tables. Findings
chapter is followed by Discussion chapter which discusses the results of the survey with
a top list of issues and compares those with other existing research results on the topic.
Discussion chapter also answers the research question and it’s supportive research
questions. Then Conclusion chapter concludes the research. In the end of the thesis are
the survey and Spearman’s Rho statistic results for found issues included as appendixes.

5
2. Research question and method
The purpose and the research question of this Master’s thesis is to find out What should
be considered when implementing new Continuous Integration tool? To find the answer
to this research question, there are two sub-questions: Supportive research question 1 is
What are the biggest issues when implementing new Continuous Integration tool? And
the supportive research question 2 is How to solve the biggest issues when implementing
new Continuous Integration tool? This research focuses on the viewpoint of the
company when discussing the results for the research question and supportive research
questions. The answer will be based on the results of this research and comparing the
results to existing research. The results of the research will provide information to be used
for the project of the company to change Continuous Integration tool. As the company is
going to change the Continuous Integration tool, there is a need to find out the answer to
the research question and the supportive research questions. Even though there exist
similar research on this topic, there is no research where the biggest found issues would
be prioritized. This research will take into account the already existing research and use
a survey to gather more information from the employees of the company. Still, the results
will be based on the related company.
The thesis will first focus on literature review for the topic. As the topic is in general big
and has already been researched for long time, there already exists enough literature
material. Still even though the topic has been researched in general, the topic of this thesis
has more to research so this is valuable topic to focus on. After the literature review, the
thesis will focus on the results of the survey as the research included online survey which
was distributed to a target population by email for data collection on the topic. The survey
research was cross-sectional study as the survey was distributed once for certain target
population.
2.1 Literature review
The purpose of the literature review is to focus on describing and discussing related topics
for the research question (UNC College of Arts & Sciences, 2014). This is done based on
the existing research on related topics. The literature review chapter consists of the
following topics: Continuous Integration, Current Continuous Integration tool in the
company, Continuous Delivery, Continuous Deployment, Implementing Continuous
Delivery system and Alternative Continuous Integration tools for the company. These
needs to be understood to understand the research question of this thesis. The literature
review included 13 references and those are listed in Table 1 (ordered by the publication
year).
6 Table 1. References used in literature review.
Reference By Published
Continuous Integration Fowler, M. 2006
Continuous Integration Duvall, P. M., Matyas, S. &
Glover, A.
2007
Continuous Delivery Humble, J. & Farley, D. 2010
DevOps for Developers Hüttermann, M. 2012
Utilizing Atlassian Jira For Large-Scale
Software Development Management
Fisher, J., Koning, D., &
Ludwigsen, A. P.
2013
ContinuousDelivery Fowler, M. 2013
Continuous Integration and Its Tools Meyer, M. 2014
On the journey to continuous
deployment: Technical and social
challenges along the way
Claps, G. G., Berntsson
Svensson, R., & Aurum, A.
2015
Continuous Integration - A comparison
between theory and practice
Sandberg, M. 2015
Implementation of continuous delivery
systems
Häkli, A. 2016
Implementation of a Continuous
Integration and Continuous Delivery
System for Cross-Platform Mobile
Application Development
Nilsson, S. 2016
Comparison between Continuous
Integration tools
Polkhovskiy, D. 2016
The Intersection of Continuous
Deployment and Architecting Process:
Practitioners’ Perspectives
Shahin, M., Babar, M. A., &
Zhu, L.
2016
2.2 Survey
Survey was used during the research to gather information on the topic from the
employees of the company involved with the project. Survey was chosen as the method
to gather information because it helps to get information on this particular research topic,
what should be considered when implementing new Continuous Integration tool.
Especially as implementation is done for the company.

7
2.2.1 SurveyMonkey
SurveyMonkey was used for creating the survey. SurveyMonkey was chosen as the tool
to create the survey because it is free to use and suitable for creating this particular survey.
SurveyMonkey also provided more possibilities for modifications of the survey when
compared with Google Forms for example. There exist different versions of
SurveyMonkey to choose from but free version was used to create the survey even though
it has limited capabilities. Still, it was enough for this research to gather information.
2.2.2 Target population
The survey was distributed to all the employees of a particular office of the company who
are related to the change of a Continuous Integration tool. The survey was distributed
only to small amount of people when compared with the size of the company. The whole
company has over 5 000 employees currently. The reason for choosing these respondents
was because this Master’s thesis focuses mainly on the project to change the Continuous
Integration tool which is done in the same office. These respondents also know about the
current Continuous Integration tool and can answer the questions related to its problems.
To get a wider range of opinions, the survey was distributed not only for employees who
are working with the current Continuous Integration tool but also for employees who have
worked with it in past or have interest or knowledge about it. In total, the survey was
distributed to 89 people. Out of those 89 people at least half of them have knowledge
about the Continuous Integration tool. Because of this, non-probability sampling method
was used which means that the target population was not randomly selected. The survey
was sent to all those related employees.
2.2.3 Survey answering time
The survey was distributed to the target population at 15.3.2017 and it was open for 12
days, so until midnight of 26.3.2017. The answering time was longer than a week because
the survey was distributed during Finnish ski holiday season.
2.2.4 Survey description
The survey consisted questions of three categories: Background (of the participants),
Problems of the current build platform and Possible problems when implementing new
build platform. First part of the survey was related to already existing problems of the
Continuous Integration tool. The questions for that part were based on the research
Problems, causes and solutions when adopting continuous delivery—A systematic
literature review by Laukkanen, Itkonen & Lassenius, (2017). Laukkanen et al. (2017)
did research on the same topic and this research used the found problems and causes as
alternative questions in the survey to determine the biggest problems of the current
Continuous Integration tool of the company. Laukkanen et al. (2017) divided the
problems to six different categories: build, system, integration, testing, human and
resources. The questions of the survey were categorized based on those categories. There
were a couple of additional alternative questions added to the survey after pilot testing
and after discussing with one of the managers of the company who was supervising this
research in the part of the company. The manager has been working closely with the
Continuous Integration tool so his opinions were also considered. The second part of the
survey was related to possible issues when implementing new Continuous Integration
tool. The questions of the second part of the survey were based on the research The
8
Highways and Country Roads to Continuous Deployment by Leppänen, Mäkinen &
Pagels, (2015).
Almost every question was multiple-choice question but the survey included also a few
open-ended questions. The multiple-choice questions were formed in Likert scale way.
Most of the open-ended questions were used to gather more detailed information on those
multiple-choice questions. Another reason for the use of open-ended questions was that
the multiple-choice questions were closed questions with already specified alternative
answers so those restricted the way to answer to the survey. Still, closed questions are
easier to analyze so that’s why they were used and the open-ended questions mainly adds
more details for answers to make sure that different opinions are taken into account
(Kitchenham and Pfleeger, 2002a). The Likert scale allows the respondents to express
their strength of the agreement with several statements. In this case, the respondents can
answer by how they agree or disagree with the question (Wuensch, n.d.). There was no
mandatory questions because of the target population. That still may have affected the
results as some participants didn’t answer all the questions. Most of the questions used
term build platform to mean the Continuous Integration tool but for this thesis the term
was standardized to be Continuous Integration tool to be clearer when discussing the
results and comparing the results to earlier studies. Build platform term was used when
describing the questions of the survey but Continuous Integration tool term was used for
discussing the results. The survey (Appendix A) is provided as an appendix for this
Master’s thesis.
Before distributing the survey, pilot test was done to make sure that the survey is
understandable and works as intended. It also provided information how SurveyMonkey
shows results from this particular survey. It is also good to pilot test survey first before
actually distributing the survey for target population as pilot tests are intended to identify
problems of the survey itself (Kitchenham and Pfleeger, 2002b). Pilot test and opinions
of supervisors were taken into account when creating the final version of the survey. The
supervisor of the company also reviewed the survey. He mentioned that some of the
participants may not be able to answer for all of the questions and even he was not sure
about the meaning of some of the questions. A few questions were modified or removed
based on both the pilot test and reviewing of the survey. Design related questions had
only one possibly confusing question: inflexible build. This was removed from the final
survey because of possibly being confusing. Integration related questions had two
questions removed: Broken development flow and Slow integration approval. Resource
related questions had one question changed: Insufficient hardware resources was changed
to Lack of hardware because it describes it better. Only one question was changed for the
question of possible issues when implementing new build platform: Build structure, size
and duration was separated to three questions: Build structure, Build size and Build
duration. This was because in this way participants can answer for each of those
separately. The main reason for these changes was to have a survey which could be
understood. There could have been explanations for each of the question but that could
have made the survey look more confusing.
2.2.5 Survey’s data-analysis
The analyzing of the survey answers was done by IBM SPSS Statistics 24 (SPSS)
software. SPSS was chosen as the analyzing tool because earlier studies made it easy to
use and it was available to use from computers of the University of Oulu. SPSS also
seemed to be a suitable for analyzing the statistics of the survey. Even though
SurveyMonkey also provided a little bit of statistics, those were limited at least when

9
using the free version of SurveyMonkey. The free version also did not support exporting
the results of the survey so those had to be collected to SPSS by the researcher. As the
website of SPSS describes, SPSS is a statistical software which is used to solve research
and business problems by ad-hoc analysis, hypothesis testing and predictive analytics.
It’s usually used to understand data, analyze trends, forecast and plan to validate
assumptions and drive accurate conclusions. In the case of this thesis, the use is to
understand the survey result data and drive accurate conclusions from it (“Downloading
IBM SPSS Statistics 24,” n.d.).
10
3. Literature review
What does Continuous Delivery or other continuous practices mean? To understand more
about the Continuous Delivery, one need to understand the other continuous practices
also. This chapter describes Continuous Integration, Continuous Delivery and Continuous
Deployment, what they are and how they are related to each other and to this research.
3.1 Continuous Integration
As Fowler (2006) states, originally the term Continuous Integration comes from the
Extreme Programming development process as it is one of the practices of Extreme
Programming. The term became more familiar after the release of the same named book
Continuous Integration which was written by Duvall, Matyas & Glover, 2007. Basically,
it means that the development team is frequently integrating their work. This means that
usually each person integrates at least daily, so multiple integrations are done per each
day by the whole development team. Each of those integrations is then verified by an
automated build, with tests, to detect possible integration errors as quickly as possible.
Even though Continuous Integration does not require particular tooling to deploy, it is
useful to use a Continuous Integration server (Fowler, 2006).
But how the Continuous Integration works in practice? Usually Continuous Integration
uses source code management system which keeps all of the project’s source code in a
repository. Developer can make a controlled copy from mainline of the repository onto
his or her own computer with checking out. This copy on the developer’s own computer
is called working copy which can be updated to the mainline. Once the developer has
done the wanted work on the working copy, necessary automated tests for the code and
is ready to update it on the mainline, the developer needs to make sure that the working
copy is updated with other developers’ possible changes and rebuild the working copy to
make sure it still works. After that the developer can commit his or her changes to the
mainline, which updates the repository. After the commit, building is done on the
integration machine based on the mainline code. This is because there is chance that the
developer forgot to commit some necessary file or made some error during committing.
After this build succeeds, the developer’s work for that code is done. But this may not
finish the developer’s work. This integration build can be executed manually by the
developer or done automatically by the Continuous Integration server. Usually the failed
builds are detected by the Continuous Integration server’s build or by another developer
when he or she updates from mainline after the last commit. This means that errors are
detected early and can be fixed faster. And those errors should be fixed immediately.
Because of this the result is that there is a stable piece of software which works properly.
It may contain bugs but only few as it’s tested. And less time is spent trying to find bugs
because they show up early because of Continuous Integration server’s builds and tests.
But this does not mean that the code does not need more testing because like mentioned,
there might exist some bugs (Fowler, 2006).
But why would you use Continuous Integration? And what are the benefits of using it?
Fowler (2006) thinks that as whole the greatest and most wide ranging benefit of
Continuous Integration is reduced risk. Duvall et al. (2007) states that Continuous
Integration also reduces repetitive processes which saves time costs and effort across all
project activities, not only during the code compilation but also database integration,
testing, inspection, deployment and feedback. But by automating Continuous Integration,
you have better ability to ensure that the process run the same way every time, order of

11
the processes is always the same and that the processes occur every time a developer
makes a commit in the version control repository. This is also supported by Nilsson
(2016) as he came to conclusion that the use of a Continuous Integration system will
increase the productivity by 30-60 minutes per week and developer according to their
evaluation of one Continuous Integration system. He also found out that the quality will
most probably increase when using the system (Nilsson, 2016). Continuous Integration
also enables better visibility for the project which means that it provides information on
the recent build status and quality metrics making decisions effective based on the results.
Also as the integrations are done frequently, the ability to notice trends in build success
or failure, overall quality and other project information becomes possible (Duvall et al.,
2007). Continuous Integration also makes integration times shorter as there are small
daily commits and this makes it easier to see how far you are on the process of
development. You also know what works and what does not and about the existing bugs
in early phase. So, Continuous Integration does not remove bugs but makes it much easier
to find and fix the bugs. This is because a bug can be found earlier, making it easier to fix
the bug as the developer has only changed a little bit of the system. There is not so many
places to look for the bug because of that. It’s also easier for the developer to remember
what changes have been made and where the bug could be. But to make sure that the
project has less bugs with the use of Continuous Integration, it is important to have good
tests because the tests play important role in Continuous Integration as they find the bugs.
(Fowler, 2006) Duvall et al. (2007) also states that Continuous Integration provides
greater confidence for the product as the development team knows that the tests are run
to verify the software’s behavior and to make sure that there are less bugs.
3.2 Current Continuous Integration system in the company
The current Continuous Integration system has been in use since 2005 in the company.
At that time, it was not in use for every part of the product system. Since 2008 the
Continuous Integration system has been in use for the whole product. CruiseControl.NET
has been in use as the Continuous Integration tool for this whole time but there has been
discussion to change it for something else for five years. It is clear that there is a need for
new Continuous Integration system as it has been discussed so long and because the
CruiseControl.NET is not supported anymore. The Continuous Integration system is
mainly used for building to check whether the build is successful after changes. The
building is done automatically once per day but can be forced to run more often if it is
needed to check more often. The builds are for internal use, but with scheduled scripts
the builds are delivered for customers. The Continuous Integration system uses
automation tests but those are not used to their full potential. Developers are not actively
developing automation tests. These are based on a discussion with manager of the
company who has been working with the Continuous Integration system since it was
taken into use. A new project management software was taken into use by the company
during this research: Jira which is made by Atlassian. It provides visibility for
development processes, testing and delivering (Fisher, Koning & Ludwigsen, 2013).
3.3 Continuous Delivery
Continuous Delivery is more recent concept than Continuous Integration and it was
defined by Humble and Farley (2010) in their book called Continuous Delivery, which
was published in 2010 (Humble and Farley, 2010). Fowler (2013) describes also
Continuous Delivery in detail and he states that the Continuous Delivery is like the name
says, a software development discipline where you continuously build software in such a
way that the software can be delivered, released to production at any time when wanted.

12
Still, the software development needs a couple of things to be called Continuous Delivery.
This means that you are doing Continuous Delivery when you meet the following four
things which were introduced by Fowler (2013):
• Your software is deployable throughout its lifecycle.
• Your team prioritizes keeping the software deployable instead of focusing on
working on new features.
• Anybody can get fast, automated feedback on production readiness of their
systems any time somebody makes a change to the systems.
• You can perform push-button deployments of any version of the software to any
environment on demand.
You achieve the Continuous Delivery by continuously integrating the software which is
done by the development team, building the executables, and running automated tests on
those built executables to detect problems or bugs so that the development team can fix
those. This has impact on developers as instead of focusing on building bigger new
features they start thinking about how they can build those in ways that let them merge
their work regularly (Meyer, 2014). You also put the executables into increasingly
production-like environments to make sure that the software will work in production. This
is done by using a deployment pipeline (Fowler, 2013).
But what is deployment pipeline? Deployment pipeline is the answer to one of the
challenges of an automated build and test environment. The challenge is that you want
the builds to be fast so that you get feedback fast, but the comprehensive tests can take
long time to run. A deployment pipeline is a way to deal with this problem which means
breaking up your build into stages. Earlier stages can find most problems which means
faster feedback, while later stages provide slower and more through probing for problems.
Usually the first stage of the deployment pipeline does any compilation and provides
binaries for later stages. Then later stages can include manual checks which are tests that
cannot be automated. So, stages can be automatic, but they can also require human
authorization to proceed and they can also be parallelized between many computers to
speed up the building process. The final stage in deployment pipeline is usually the
deploying into production. Deployment pipeline’s main job or intention is to find any
changes that may lead to problems in production. These can include performance, security
or usability issues (Fowler, 2013).
The key test in Continuous Delivery is that the customer could request that the current
development version of the software product can be deployed into production at a
moment’s notice. This can be done with Continuous Delivery without any trouble. But to
achieve this Continuous Delivery, the company needs a close and collaborative working
relationship between everyone involved in the delivery. This is usually called DevOps
culture. Also, extensive automation of every possible parts of the delivery process, which
is usually done using the already mentioned deployment pipeline (Fowler, 2013).
But what are the benefits of using Continuous Delivery? The three main benefits listed
by Fowler (2013) are as follows: First is reduced deployment risk, as you are deploying
smaller changes, there is less to go wrong and it is easier to fix if there is found a problem.
The deployment risk is reduced also by the automatic building as there is also tests run
during building and that’s when possible bugs are found. With manual building, there
would be chance for human error (Häkli, 2016). Then the second benefit found by Fowler
(2013) was believable progress: many people track progress by tracking work marked as
done. If done means that the developer declares it to be done, that’s much less believable
13
than if it is deployed into a production environment. Then the last listed benefit of using
Continuous Delivery was user feedback: The biggest risk of any software effort is that
you end up doing something that is not useful. But the earlier and more frequently you
get working software running in front of the real end users, the faster you get feedback to
find out how valuable the result really is. That way you can also make changes
accordingly if needed (Fowler, 2013).
3.4 Continuous Deployment
Continuous Delivery can be and is sometimes confused with Continuous Deployment.
Those concepts are similar but they don’t mean the same thing. Continuous Deployment
means that every change goes through the pipeline and automatically gets put into
production which results in many production deployments every day. While then
Continuous Delivery means just that you are able to do frequent deployments but can
choose not to do it. This may be done because company may prefer a slower rate of
deployment because of business. But in order to do Continuous Deployment you have to
be doing Continuous Delivery (Fowler, 2013).
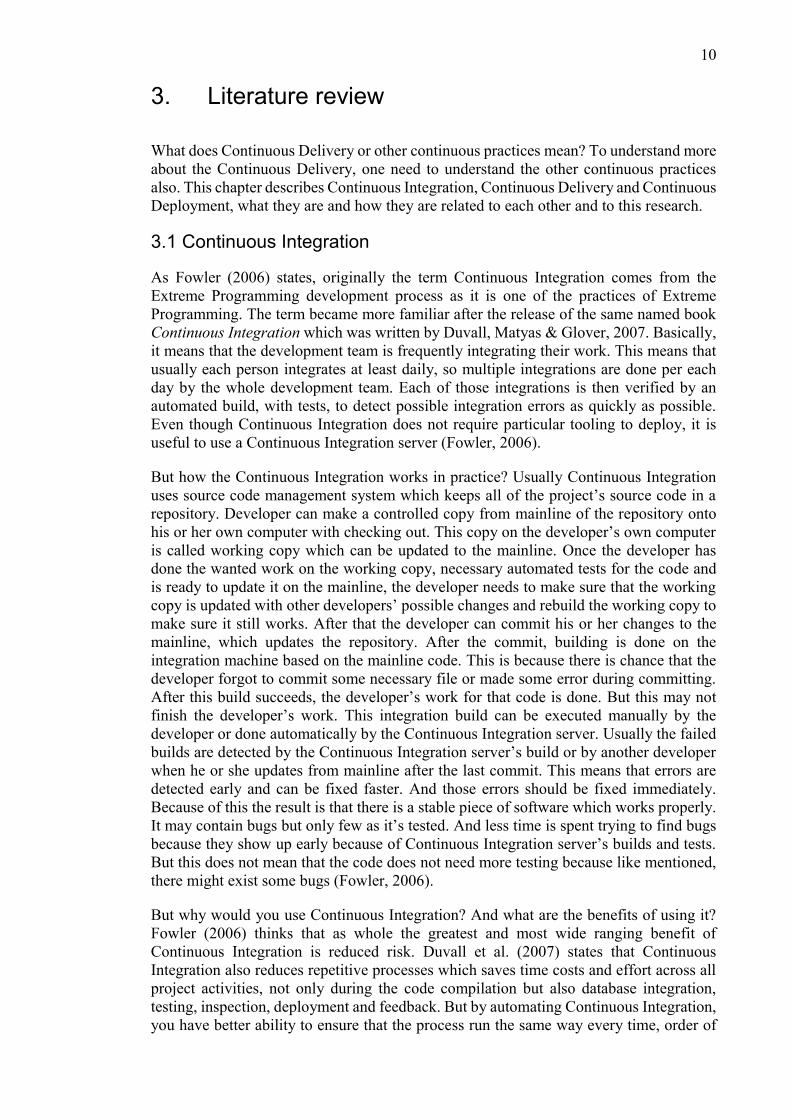
Relations between Continuous Integration, Continuous Delivery and Continuous
Deployment are shown in the Figure 1.
Figure 1. Relations between Continuous Integration, Continuous Delivery and Continuous Deployment (Häkli, 2016).
The relations of each can be seen as subsets and supersets of each other in the Figure 1.
Continuous Deployment cannot be implemented without implementing functional
Continuous Integration and Continuous Delivery systems first. Continuous Integration
needs to be implemented first, then Continuous Delivery can be implemented and after
that Continuous Deployment (Häkli, 2016). The differences between Continuous
Delivery and Continuous Deployment are shown in the Figure 2.
Continuous Deployment
Continuous Delivery
Continuous Integration

14
Figure 2. Differences between the Continuous Delivery and Continuous Deployment (Häkli, 2016).
The main difference between Continuous Delivery and Continuous Deployment is that in
the case of Continuous Delivery, the production deployment is done manually. And in
the case of Continuous Deployment, the production deployment is done automatically.
3.5 Implementing Continuous Delivery system
There are different ways and tools for implementing Continuous Delivery system. First
of all, a version control system is needed to implement Continuous Delivery system.
Version control system manages a centralized storage, repository, for source code where
developers fetch and submit their code changes (Sandberg, 2015). It is also necessary to
implement or already use Continuous Integration. This is because Continuous Integration
is part of Continuous Delivery (Häkli, 2016). There exist many tools for Continuous
Integration and Continuous Delivery as they have been around many years and the tools
are written in multiple languages so there is many to choose from. Some examples of
those tools are the following listed by Häkli (2016). Hudson Continuous Integration uses
Java which is used by many runtime powering services. Hudson Continuous Integration
is famous project but nowadays Jenkins has gained popularity which is also written in
Java. Jenkins was actually forked from Hudson Continuous Integration. Jenkins was one
of the possible Continuous Integration tools to choose for the company. There also exist
alternatives for Java powered platforms like Buildbot written in Python, Travis written in
Ruby, Strider and Drone written in Node.js. Then there is also Bamboo developed by
Atlassian and written also in Java. Bamboo was also one of the possible Continuous
Integration tools to choose for the company. Bamboo was easy choice for the company,
because of integration possibilities with other Atlassian’s products which are already in
use by the company. These products include Jira and Hipchat. Many of the listed tools
are partly or fully an open-source software (Häkli, 2016). For example, Jenkins is an
open-source tool but Bamboo is commercial tool.
There also exist many alternatives for architectural models for Continuous Integration
and Continuous Delivery systems. The alternative systems range from simple solutions
like running Python scripts to multi-tiered enterprise solutions that can be hosted in
multiple data centres. Häkli (2016) presented the simplest example for build systems, a
solution which can be implemented in hours on top of Buildbot on a single computer,
which requires only a Python runtime on any operating system. But Continuous Delivery
does not necessarily require any specifically manufactured tools. Continuous Integration
tools like Buildbot may be perfectly viable for implementing Continuous Delivery for a
Unit testing &
Integration testing
End-to-end testing
Acceptance testing
Staging
deployment Manual production
deployment
Unit testing &
Integration testing
End-to-end testing
Acceptance testing
Staging
deployment
Automated
production
deployment
Continuous Delivery
Continuous Deployment

15
software product but the setting up process of the pipeline from development to
production server deployments with configuration management and builds can be more
difficult to master and scale as it may differ very much from earlier solution. Although
there are some specifically tailored software platforms which may be much easier to set
up because they may support the scenarios that you can run into when setting up your
Continuous Delivery out of the box. So, there exists many options for developers for
adopting Continuous Delivery for their daily work and project flows. Three listed options
of Häkli (2016) are: using a free or licensed hosted Software as a Service solution like
Travis Continuous Integration or Snap Continuous Integration. Then the second option is
buying an enterprise solution with support and hosting it on-premises. Or the last of his
options is hosting an open-source solution, on premise or in the cloud (Häkli, 2016). The
current solution of the company is that the CruiseControl.NET runs on a local computer.
But the plan is that the new Continuous Integration tool run in the cloud but physically
somewhere else. The need for one or multiple servers depends on whether different
products would be better to be built on separate servers for better performance. Because
of this, there are things which may be needed to be taken into account when implementing
this new solution. For example, how this remote server affects manual testing or any other
work that requires accessing the remote server?
There has been research on adopting Continuous Delivery. A study by Claps, Svensson
& Aurum (2015) found several risks which were associated to the adoption of Continuous
Delivery. The found risks were: Product quality, Testing, Partner plugins, Source code
control, Changing database schemas, Process documentation, Customer adoption and
Customer feature discovery. That study found also other issues but these were the only
ones related to the adoption of Continuous Delivery (Claps et al., 2015). Another study
by Shahin, Babar & Zhu (2016) focused on architectural challenges when adopting
Continuous Delivery. They found three architectural challenges: Highly coupled
monolithic architecture, Team dependencies and Ever-changing environments and tools.
Their research revealed that Highly coupled monolithic architecture would be the biggest
challenge when organizations are going to start using Continuous Delivery practice.
Software with monolithic code or monolithic database can be hard to deploy because of
dependencies. For example, to deploy a piece of software on continuous basis, it is
necessary to deploy all other applications which have dependency. Refactoring the legacy
code can be a solution for this but it can be a challenge too in the case of big legacy
system. The solutions of these issues were discussed for the related issues found in this
research (Shahin et al., 2016).
Like Michael Hüttermann (2012) describes in his book called DevOps for developers,
DevOps describes the practices which streamline the software delivery process,
emphasizing the learning by streaming feedback from production to development and
improving the cycle time, the time from inception to delivery. It is related go Continuous
Delivery but DevOps is wider concept (Hüttermann, 2012).
3.6 Alternative Continuous Integration tools for the company
The company has two alternatives for Continuous Integration tools to choose when
implementing new Continuous Integration tool. The alternative tools are Atlassian’s
Bamboo and Jenkins. Bamboo is currently prioritized tool because the company has plans
to standardize the used tools. Recently the company took into use many products of
Atlassian and Bamboo has good integration with those tools. Especially with Jira, the
project management software. According to Curran (2017), Bamboo has the best Jira
integration and much better integration with other Atlassian products compared to other

16
combinations (Curran, 2017). Jenkins on the other hand is alternative tool to choose
because it is open-source software, popular and has many plugins. Jenkins has also Jira
integration plugins. Some of the plugins also help to solve problems of Jenkins. For
example, plugins for Jenkins allow implementation of complex and not sequential
pipelines, involving different jobs and promotion strategies. (Armenise, 2015) Still the
wide amount of plugins can be a problem also. It may be hard and time consuming to find
the right plugin amongst many, especially as there may be need for a different plugin for
each specific functionality. (Armenise, 2015) This research compares how the findings
suit for these alternative Continuous Integration tools. The company can use the results
as a reference for choosing the tool.

17
4. Findings
The survey was sent to people with specific knowledge and who have worked or have
connections to the build server which this thesis focuses on. So, the sampling method for
survey was non-probabilistic sampling method as the survey was not sent randomly. The
reason for choosing non-probabilistic sampling method was because the target population
was specific and rather small amount of people: 89. With this little amount of people and
because of being specific, it was important to send the survey to the whole target
population. This also helps to get different perspective for the topic from the different
answers. This reasoning is also good to use as it was stated by Kitchenham and Pfleeger
(2002c).
The target population consisted of 89 people. Out of those 89 people 37 answered the
survey so the answering percentage was 42%. Still some of the people didn’t answer all
of the questions but that was expected as all of them did not know as much about the topic
as others. Because of that there was mention about possibility to answer as neutral for
questions which the participant did not know the answer.
The survey had three different themes for the questions: Background (of the participants),
Problems of the current build platform and Possible issues when implementing new build
platform. The first theme had three questions related to the background of the person
answering the survey. The second theme had five questions related to the problems of the
current build platform. And the last theme had two questions related to possible problems
when implementing new build platform. So, in total ten questions. Out of those ten
questions, six were questions created based on Likert scale and had different sub-
questions in each of them. The Likert scale consisted of seven alternative answers of
different importance for each question, as follows: Strongly disagree: 1, Disagree: 2,
Partly disagree: 3, Neutral: 4, Partly agree: 5, Agree: 6 and Strongly agree: 7. These seven
response alternatives were chosen as those provides more reliability and validity than less
alternatives according to Lozano, García-Cueto, & Muñiz (2008). Alternative answers for
every Likert scale question was standardized so that the participants know the alternative
answers for each question (Kitchenham and Pfleeger, 2002a). The use of midpoint in
these response alternatives was chosen because it was considered necessary because of
the target population and to get more responses. Even though it might mean that the
presence of the midpoint may produce distortions in the results (Garland, 1991). It may
also lead participants to avoid answering the question, but still the Neutral option may
also force the participants to make a choice about which answer they feel ambivalent
(Kitchenham and Pfleeger, 2002a). So, each question could be answered as Neutral, if the
answerer could not or did not want to answer. Those Likert scale based questions also
had possibility to describe the answer in more detail (Kitchenham and Pfleeger, 2002a).
4.1 Background
Every responder did respond to the first question about the age of the responder. The
results can be seen in the Figure 3.

18
Figure 3. Age responses in pie chart.
Most of the responders’ age was between 35 and 44. Only 5 of the responders were
younger than 35 years. None of the responders were 65 or over years old. This survey did
not have alternative response for age of under 18 but it was not mentioned to have been
an issue in the open-ended questions. It can also be assumed that target population did
not have any underaged people. These results show that most of the company’s employees
or at least most of the responders for this survey are not so young and have more
knowledge. In this way, their answers can be more valuable as they can be based on their
gained knowledge.
The Figure 4 shows how the responses for the second question were divided in bar chart
format. The second question was a question about the work experience at the current
company.
35 to 44 = 59,5%
25 to 34 = 8,11%
18 to 24 = 5,41% 55 to 64 = 8,11%
45 to 64 = 18,92%

19
Figure 4. Work experience response table.
One participant did not answer to this question. A minor overlap of alternative answers
was noticed while analyzing the results: some of the alternative answers had same value
(1 – 2 years and 2 – 4 years). This may have led to dividing the results as there was two
ways to answer. But even though that may have affected the results, still it would not have
affected the placements of the most common work experience groups. This is because
even if similar answers were summed, still there would have been two groups which were
above other groups. Clearly most of the participants have been working at their current
company at least 15 years. As the Figure 5 shows, 14 participants had been working at
the company for at least 15 years. Second most common work experience group of people
was 8 – 10 years which had 9 of the participants. Most of the participants have been
working a lot of time at the current company as 27 of the participants have been working
at least 8 years. Out of 37 responders only two have joined the company recently: in less
than 6 months. According to Little and Harvey (2006) people learn tangibly from work
experience. So, most of the responders have been working at the company for years and
should have good knowledge at least about their current work. This still doesn’t mean
that most of the responders could have knowledge to answer most of the questions. This
is because the survey was sent to people with different job roles and different backgrounds
relating to their work.
As Figure 5 shows, most of the survey participants were software developers. The figure
shows the results by quantity of responses for the question.

20
Figure 5. Job role response bar chart.
The third question about the job role of the participant provided possibility to answer by
writing own job role as there is a large amount of different roles. Because of this the
results showed different versions for same role. Most of those were combined as they
were clearly same roles but some were for example shortened versions of these presented
ones. Some of the results could not be combined even though it could have meant same
as other one. For example, Manager may mean Product Manager, Project Manager, R&D
Manager or Regional Implementation Manager. But because answer was not clearly
related to any of these other answers it was left separately for analyzing. But when
combined, the third most common job role was Manager in general for the responders.
There was also 6 Analysts if different Analysts are combined. Most of the responders
were Developers as there was 8 developers in total when Software Developers and Senior
Software Developers were combined. All of the participants did not answer to this
question. Still clearly most of the survey participants were people with job roles that have
knowledge about the survey topic and were able to answer to the questions. This question
was added to provide information on the background of the survey participants because
the survey was distributed to people with different job roles. People with different job
roles have different knowledge about the topic of the survey and that was taken into
account when analyzing the results. Still, better results could have been gathered if this
question would have had already specified alternative answers and option to fill in a
missing job role. This was considered during creating the survey but was left out as it also

21
could have resulted in different results. For example, many could have answered by only
as some general job role, like Manager, and not the specified one like Regional
Implementation Manager.
The rest of the questions focused on the main topic of the survey: gathering information
on the problems of the current Continuous Integration tool relating to different kind of
problems and possible issues to be countered when implementing the new Continuous
Integration tool. The following six figures and tables show the results for questions which
were formed based on Likert scale. Results for response alternatives are shown in
percentages in figures. The tables show the resulting statistic median and mode for the
questions. Those medians and modes are based on the importance points of the alternative
answers.
4.2 Problems of the current Continuous Integration tool
In the Figure 6 is shown answers for questions related to build design problems in the
current Continuous Integration tool. The results are presented in the form of stack bar
diagram to show the results in a clear way.
Figure 6. Build design problems of the current Continuous Integration.

22
This Figure 6 shows that a little bit over half of the participants answered as Neutral for
Network latencies to be one of the design problems in the current build platform. It may
mean that the first question (Network latencies) may not have been understood or most
of the participants did not have an opinion for this question. It may also mean that the
participants avoided answering the question, but still the Neutral option may also force
the participants to make a choice about which answer they feel ambivalent (Kitchenham
and Pfleeger, 2002a).
The Table 2 shows the medians and modes of the alternative answers of the build design
problems. Number of valid answers and missing answers are also provided in the same
table to show how many have answered for the questions.
Table 2. Medians and Modes of build design problems.
Q4 Which of the following build design problems
do you see in the current build platform?
N
Median
Valid Missing Mode
Network latencies 23 14 4,00 4
Problematic deployment 23 14 5,00 5
Complex build 23 14 5,00 5
Unsuitable architecture 23 14 4,00 5
Problematic deployment and Complex build can be seen as the biggest build design
problems of the four alternative answers. Other two problems can be seen as minor
problems as their median is number four which was Neutral answer. 23 participants
answered for these all questions and 14 did not answer to any of these build design
problems related questions.
Build design problem related questions had two answers for its open-ended question.
Both answers were more build server related answers. Both answers stated that the current
build server is old and there seems to be a need for a better build server. According to the
two answers, the current build server seems to be insufficient for the workload. Also, the
CruiseControl.NET is not so well supported anymore. This seems to be true also
according to the official website of CruiseControl.NET as the newest version was released
26.5.2014 and there have not been any news after that (“CruiseControl.NET,” n.d.).
Figure 7 shows the results for questions related to integration problems existing in the
current build platform. The results are presented in the form of stack bar diagram.

23
Figure 7. Integration problems of the current build platform.
Like can be seen from this Figure 7, most of the participants answered with Neutral for
three of the questions included in this figure: Long-running branches, Large commits and
Merge conflicts. It is clear that for some participants these questions were difficult to
answer or for some reason they did not provide an answer. But as the Neutral answer is
so high for these three and there are less agreeing answers than in case of other questions,
it can be seen that these three are in the bottom issues of integration problems of the
current build platform: they don’t exist or the participants see them as minor issues
compared to other issues. When counting the percentages of answers agreeing different
integration problems to be the issue of current build platform, Build duration and Broken
build are clearly the top two problems as both of them had no disagreeing answers but
Build duration had 17,4% Strongly agree, 43,5% Agree and 4,3% Partly agree answers
while Broken build had 39,1% Agree, 17,4% Partly agree, but not any Strongly agree.
This means that 65,2% agree more or less that Build duration is one of the integration
problems existing in the current build platform. And likewise, 56,5% agree more or less
that Broken build is one of the current integration problems.
The following table (Table 3) shows the medians and modes of the alternative answers of
the integration problems. Number of valid answers and missing answers are also provided
in the same table.

24 Table 3. Medians and modes of integration problems.
Q5 Which of the following integration problems
exist in the current build platform?
N
Median
Valid Missing Mode
Build duration 23 14 6,00 6
Long-running branches 23 14 4,00 4
Large commits 23 14 4,00 4
Time-consuming testing 23 14 4,00 4
Merge conflicts 23 14 4,00 4
Work blockage 23 14 4,00 4
Broken build 23 14 5,00 4a
a. Multiple modes exist. The smallest value is shown
As can be seen, Build duration and Broken build are seen as bigger integration problems
than others. The medians of other problems are four which was Neutral answer so those
can be seen as minor problems. 23 participants answered for all of these questions and 14
participants did not answer to any of these integration problems related questions.
The answers of the open-ended question supported also the results shown on the Table 3.
There were only two answers for the open-ended question of this question and those
mentioned the build speed performance to cause work blockage in the way of waiting
time.
Figure 8 shows the results for the questions about the testing related problems existing in
the current build platform. The results are presented in the form of stack bar diagram.
25
Figure 8. Testing related problems of the current build platform.
There were fairly many Neutral answers for these testing related questions but on the
other hand for most of the questions there were many responses which agreed for the
question more or less so the reason for Neutral answers may have been that the
participants could not answer to the questions for some reason or did not have an opinion.
Ambiguous test results, Flaky tests, Time-consuming testing and Unsuitable architecture
had almost same amount of Disagree and Partially Disagree answers as there was Partially
agree, Agree and Strongly agree answers. This kind of dividing between answers may be
relating to job roles of participants. When comparing the results of the two biggest job
role categories: developers and managers, there was two out of those four issues which
had differences: Time-consuming testing and Flaky tests. The reason for this comparison
was because those were the biggest job role categories from the results. Time-consuming
testing had median 5,50 and mode 4a from the results of managers and median 5,00 and
mode 5a from the results of developers. This shows that developers agree more than
managers that Time-consuming testing is a testing related problem of the current build
platform. Flaky tests had median 5,00 and mode 4 from the results of managers and
median 4,00 and mode 4 from the results of developers. This shows that managers agree
more than developers that the Flaky tests are a testing related problem of the current build
platform.

26
The following table (Table 4) shows the medians and modes of the alternative answers of
the testing related problems. Number of valid answers and missing answers are also
provided in the same table.
Table 4. Medians and modes of testing related problems.
Q6 Which of the following testing related problems
exist in the current build platform?
N
Median
Valid Missing Mode
Efficiency 20 17 5,00 4
Reliability 20 17 4,50 4
Insufficient feedback 20 17 4,00 4
Ambiguous test results 20 17 4,00 4
Flaky tests 20 17 4,00 4
Problematic deployment 20 17 5,00 5
Complex testing 20 17 5,00 6
Time-consuming testing 20 17 4,50 4
Untestable code 20 17 4,00 4
Unsuitable architecture 20 17 4,00 4
Complex testing can be seen as the biggest testing related problem when taking into
account both median and mode. It is followed by Problematic deployment, Efficiency,
Time-consuming testing and Reliability. Medians of other problems were number four
which was Neutral answer so they can be seen as minor problems. 20 of the participants
answered these testing related questions and 17 did not answer to any of these questions.
This can mean that those 17 participants did not have knowledge or opinion about testing.
There were two answers also for the testing related open-ended question. One participant
wasn’t aware of the automated tests and the other one stated the reason: in the company
the automated tests and their results are not visible and transparent for whole Research
and Development (R&D) organization. Also, the automated tests are not actively used in
the company. Because of this, every participant did not know about the existence of
automated tests.
The Figure 9 shows the results for questions about the human and organizational related
problems existing in the current build platform. The results are presented in the form of
stack bar diagram.
27
Figure 9. Human and organizational problems of the current build platform.
As the Figure 9 shows, there was many Neutral answers for these human and
organizational related problems. Still there were some agreeing and disagreeing answers
but only two problems seems to stand out from the rest: Time-consuming testing as even
68,5% of the participants agreed with this more or less. The second problem was Lack of
knowledge which 58% of the participants agreed more or less. For these two problems
the Figure 9 showed about as many agreeing as disagreeing results so difference between
opinions may be found in the job roles. This kind of dividing between answers may be
relating to job roles of participants. Because of this the results between managers and
developers were compared as they are the biggest job role categories of the participants.
Time-consuming testing had median 6,00 and mode 6 from the results of managers and
median 5,50 and mode 6 from the results of developers. This shows that the managers
agree a little bit more than developers that Time-consuming testing is a human and
organizational problem of the current build platform. Lack of knowledge had median 4,50
and mode 4 from the results of managers and median 4,50 and mode 3a from the results
of developers. This shows the developers disagree a little bit more than managers that
Lack of knowledge is a human and organizational problem of the current build platform.

28
The following table (Table 5) shows medians and modes of the alternative answers of the
human and organizational related problems. Number of valid answers and missing
answers are also provided in the same table.
Table 5. Medians and modes of human and organizational related problems.
Q7 Which of the following human and
organizational related problems exist in the
current build platform?
N
Median
Valid Missing Mode
Lack of co-operation 19 18 4,00 4
Lack of support 19 18 4,00 4
Lack of knowledge 19 18 5,00 5
More pressure 19 18 4,00 4
Lack of experience 19 18 4,00 4a
Ambiguous test results 19 18 4,00 4
Lack of motivation 19 18 4,00 4
Effort 19 18 4,00 4
Lack of discipline 19 18 5,00 4
Time-consuming testing 19 18 5,00 6
a. Multiple modes exist. The smallest value is shown
Time-consuming testing can be seen as the biggest human and organizational related
problem when taking into account median and mode. It is followed by Lack of discipline,
Lack of knowledge and Lack of experience. Medians of other problems were number four
which was Neutral, so they can be seen as minor problems. But when taking into account
the results shown in Figure 9, Lack of knowledge seems to be more important than Lack
of discipline and Lack of experience. This is clear as there is less disagreeing answers for
Lack of knowledge than for those two. This may mean that some of the employees would
like to have more training. 19 of the participants answered for all of these human and
organizational related questions and 18 did not answer to any of these questions. This a
little bit of increase in missing answers may be related to the theme of these problems.
Maybe more people did not have opinion for human and organizational related questions
or did not want to answer.
There was only one answer to human and organizational related open-ended question.
The only answer questioned again the existence of automated tests in the company like
in the testing related open-ended question.
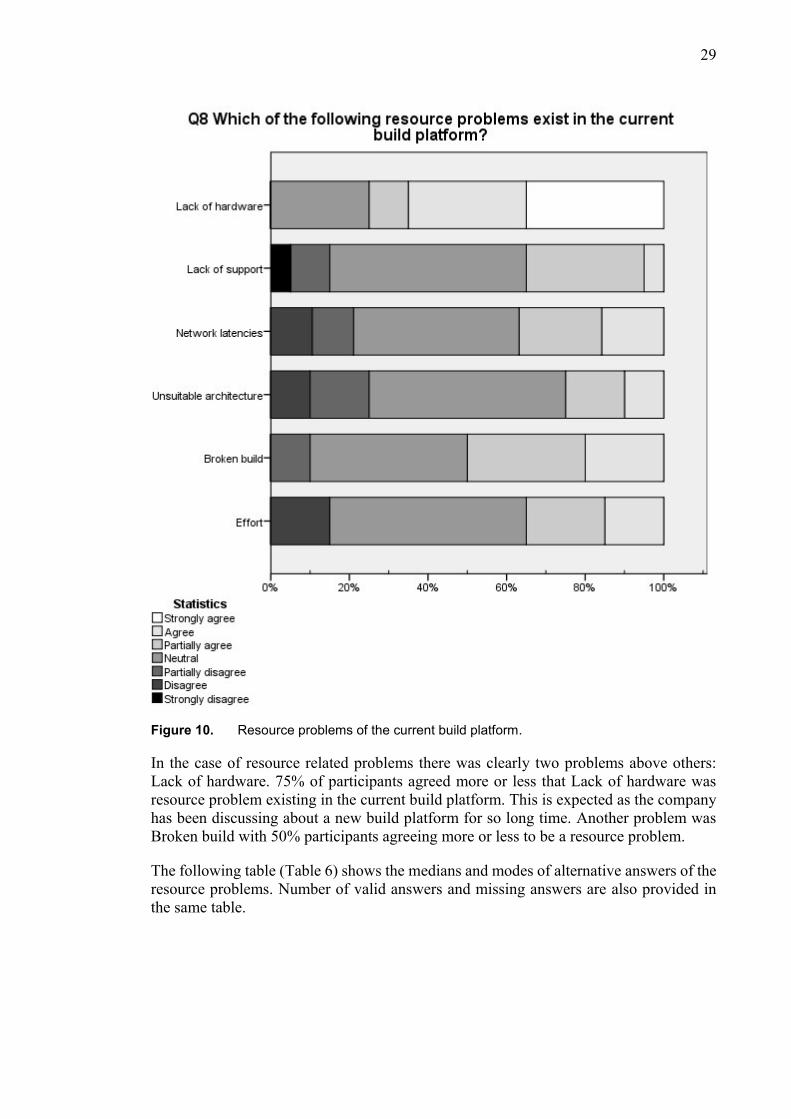
The Figure 10 shows the results for the question about the resource problems existing in
the current build platform. The results are presented in the form of stack bar diagram.
29
Figure 10. Resource problems of the current build platform.
In the case of resource related problems there was clearly two problems above others:
Lack of hardware. 75% of participants agreed more or less that Lack of hardware was
resource problem existing in the current build platform. This is expected as the company
has been discussing about a new build platform for so long time. Another problem was
Broken build with 50% participants agreeing more or less to be a resource problem.
The following table (Table 6) shows the medians and modes of alternative answers of the
resource problems. Number of valid answers and missing answers are also provided in
the same table.

30 Table 6. Medians and modes of resource problems.
Q8 Which of the following resource problems
exist in the current build platform?
N
Median
Valid Missing Mode
Lack of hardware 20 17 6,00 7
Lack of support 20 17 4,00 4
Network latencies 19 18 4,00 4
Unsuitable architecture 20 17 4,00 4
Broken build 20 17 4,50 4
Effort 20 17 4,00 4
Lack of hardware was clearly the biggest resource problem. It is followed by Broken
build. Medians of other problems were number four so they can be seen as minor
problems. 20 of the participants answered for most of these resource related questions
and 17 did not answer to most of these questions. There were different results for Network
latencies which had 19 answers and 18 missing answers. This can mean that those
participants who did not answer, did not have have knowledge or opinion about resource
problems.
There was only one answer in the open-ended question of resource problems. The only
answer was questioning whether Broken build is a resource problem. It clearly is a
confusing question in this case to answer. But for this question Broken build was meant
as a part of resource problem. Broken build was placed for this question because this
question was based on problem category from Laukkanen et al. (2017) Broken build was
one of the causes of resource problem category (Laukkanen et al., 2017).
4.3 Possible problems when implementing new Continuous Integration tool
The next Figure (Figure 11) shows the results of questions related to possible issues which
are likely to be encountered when implementing new build platform. These were the only
questions clearly relating to the new build platform.

31
Figure 11. Possible issues when implementing new build platform.
Only one of the new build platform related problems had more Neutral answers than
others: Customer preferences. Other problems had similar amount of answers between
them but two had more agreeing answers than others. Different development and
production environments had 68,4% and Legacy code considerations had 68,5% more or
less agreeing answers.
The following table (Table 7) shows the medians and modes of the alternative answers of
possible issues which are likely to be encountered when implementing new build
platform. Number of valid answers and missing answers are also provided in the same
table.

32 Table 7. Median and modes of possible issues when implementing new build platform.
Q9 Which of the following possible issues do you
think are likely to be encountered when
implementing new build platform?
N
Median
Valid Missing Mode
Network latencies 19 18 5,00 4a
Lack of knowledge 19 18 5,00 6
Lack of resources 19 18 5,00 5
Costs 19 18 4,00 4
Manual and nonfunctional
testing
19 18 5,00 4
Different development and
production environments
19 18 5,00 4
Build structure 19 18 5,00 4
Build size 19 18 5,00 4
Build duration 19 18 5,00 4
Legacy code considerations 19 18 5,00 5
Developer trust and
confidence
19 18 5,00 5
Domain constraints 19 18 5,00 5
Customer preferences 19 18 4,00 4
Resistance to change 19 18 5,00 6
a. Multiple modes exist. The smallest value is shown
As can be seen from Table 7, the biggest possible problems when implementing new
build platform were Resistance to change and Lack of knowledge when taking into
account both median and mode. They were followed closely by most of other issues. Each
of the issues had fairly many Neutral answers which have affected the median and mode
even though there were participants who strongly agreed for most of these problems as
can be seen in the Figure 11. Only two other problems can be seen as minor problems as
their median was number four which was Neutral: Customer preferences and Costs. For
these two problems the Figure 11 showed about as many agreeing as disagreeing results
so difference between opinions may be found in the job roles. Because of this the results
between managers and developers were compared as they were the biggest job roles of
the participants. Customer preferences had median 3,00 and mode 2 from the results of
managers and median 4,00 and mode 4 from the results of developers. This shows that
managers disagree more than developers that Customer preferences is a possible issue
when implementing new build platform. Costs had median 4,50 and mode 1a from the
results of managers and median 3,50 and mode 5 from the results of developers. This
shows that developers agree more than managers that Costs is a possible issue when
implementing new build platform.
The last question of the survey was “What do you think are the top three issues for the
need to change the current build platform?” This question was an open-ended question to
get more information on opinions of the participants on the top three issues which could

33
be described in more detail because of this. The Figure 12 shows how the results were
divided. 9 survey participants answered this question while 28 did not. It may be that
participants did not see a need to answer to this as there was so many questions and those
already provide the top issues in their own way. Still those answers also provide valuable
information for the issues of current build platform.
Figure 12. Top issues for the need to change the current build platform.
Build performance was mentioned to be one of the top issues followed by Reliability and
Build speed. Other issues were mentioned by only one respondent. Those issues are still
also important issues. The difference between answers can be explained by this question
being open-ended question. The fact that there were only 9 participants who answered
this question also affects the results of this question.
4.4 Problems of the survey
In the end the survey had few problems which were noticed after distributing the survey
when there were already some answers. First of all, some of the questions can be

34
misunderstood. This was mentioned in the open-ended questions. This was taken into
account when analyzing the results. It was also clear that some participants were not able
to answer to all the questions and left Neutral answer because of that. The confusing
question may be reason for some of the Neutral answers but not for all because the target
population had people with different knowledge so everyone did not have enough
knowledge to answer all the questions. And that is fine as it is better to answer by Neutral
than by some misleading answer because of confusion. Another reason for Neutral
answers may be because the Neutral option may have lead participants to avoid answering
the question (Kitchenham and Pfleeger, 2002a). There may be minor error marginal for
the results because of different people and some confusing questions. Still the Neutral
answer was included to the survey even though there was possibility for this. The reason
for including Neutral answer was because of the background of participants. Problems of
some questions were noticed during creating the survey and because of that some of the
early versions were modified or removed from the final survey. It still seems that there
remained some questions which could be understood in different ways as some
participants mentioned in the open-ended questions.

35
5. Discussion
The survey had alternative problems separated on different questions which were
problems with similar theme. There was a total of 51 different issues included in the
survey when counted separately same issues which were in different questions. For
example, Network latencies was an alternative answer in three different questions: build
design problems, resource problems and the possible issues when implementing the new
build platform. The reason why same issue was in multiple questions was because same
issue had multiple themes defined by Laukkanen et al. (2017). Of course, all alternative
issues of the survey were not seen as issues. Those were included in the survey to find
out whether they are seen as issues by participants. There were small differences when
comparing the survey results in bar graph format and statistic median and mode tables. In
some cases, there was more agreeing answers shown in the bar graph but the statistic
median table listed the results in different order. The reason for this was importance points
which were used to calculate the median and mode of each issue as it was recommended
by Jamieson (2004). Other issues had stronger agreeing answers than other. The statistic
median and mode describes the results in a better way as it takes into account the
importance points of answers in more detail and not only sum the amount of the agreeing
answers. As the Likert scale questions provide ordinal data, statistic median and mode
was decided to be calculated for each issue because they are appropriate for ordinal data.
Calculating mean was considered but it was left out as it is inappropriate for ordinal data
because different answers in Likert scale questions are not equal. For example, the
intensity of feeling between Strongly agree and Agree are not the same as the intensity of
feeling between other alternative answers (Jamieson, 2004).
5.1 The biggest issues of the current Continuous Integration tool
The list of biggest issues was constructed based on the median and mode of the issues.
The Table 8 shows what are the biggest issues of the current Continuous Integration tool
found by the survey. The issues are presented in descending order.

36 Table 8. Top 10 issues of current Continuous Integration tool.
Issue Median Mode
Lack of hardware 6 7
Build duration 6 6
Complex testing 5 6
Time-consuming testing 5 6
Complex build 5 5
Problematic deployment 5 5
Lack of knowledge 5 5
Broken build 5 4 a
Efficiency 5 4
Lack of discipline 5 4
a. Multiple modes exist. The smallest value is shown
The Table 8 has top 10 biggest issues found from the survey results. These were gathered
from all of the questions related to the current Continuous Integration tool. The results
show that Lack of hardware was the biggest issue of the current Continuous Integration
tool when taking into account both median and mode. The importance of this issue was
also supported by the answers of open-ended questions where participants described the
need for new hardware with better build duration. Also, the current Continuous
Integration tool uses CruiseControl.NET which has not been getting updates for few years
anymore (“CruiseControl.NET,” n.d.). So, in this case the lack of hardware means the
lack of good hardware. The company has had plans to change the current Continuous
Integration tool for many years so that can be seen to affect the results. Also, participants
provided more detail for this in the open-ended question of design related problems
question. They said that the current build server is old and insufficient for the workload.
Because of that the Lack of hardware can be seen to be the biggest issue by the viewpoint
of the employees. Claps et al. (2015) also states that Continuous Delivery requires a
proper hardware and software to handle the Continuous Delivery process and its related
problems so it is an important issue. Build duration was also the second most important
issue on the list. It was also mentioned with different word in the question about top three
issues for the need to change the current Continuous Integration tool: Build speed. There
were two issues on the list which are results from more than one different questions:
Time-consuming testing and Broken build. Median and mode of the Time-consuming
testing on the Table 8 are from question related to human and organizational problems. It
was also in the question related to testing problems with median 4,5 and mode 4 and in
the question related to integration problems with median 4 and mode 4. Because of this,
Time-consuming testing placed in the fourth position on the Table 8 even though it has
same median and mode as Complex testing. Testing in general was also one of the found
risks which were associated to the adoption of Continuous Delivery found by Claps et al.
(2015). Similarly, median and mode of the Broken build on the Table 8 are from question

37
related to integration problems but it was also in the question related to resource problems
with median 4,5 and mode 4. This on the other hand did not affect the placing of Broken
build issue on the Table 8 because it had different mode than other issues. But article by
Meyer (2014) states that broken build should have highest priority to get it fixed. This is
because only working builds can be deployed to production at any time (Meyer, 2014).
But how do you know when the build is broken? The Continuous Integration tool should
be able to tell with good monitoring when the build is broken as the system tries to build
at some point (depending on the settings) after changes has been committed (Meyer,
2014).
5.2 Solutions for the issues of current Continuous Integration tool
Solutions for the issues of current Continuous Integration tool are based on earlier
researches. Some of the solutions support multiple issues and some of the solutions were
similar to each other. Some of the biggest issues also had similarity between them.
Spearman’s Rho was chosen method for analyzing the correlation as the issues are based
on Likert scale which is ordinal data. Appropriate inferential statistics for ordinal data are
non-parametric tests like Spearman’s Rho (Jamieson, 2004). That is another reason why
the issues were grouped for discussing solutions for them. The results of Spearman’s Rho
of the top 10 issues of the current Continuous Integration tool are included as an appendix
(Appendix B). The following Table 9 was used as a guide to describe the strength of the
correlations. It was based on a table in journal article by Mukaka, (2012). Issues were
grouped based on critical values of Spearman’s Rho. So, for issues with N (participants)
being 19, correlation coefficient had to be at least 0,388 for issues to be grouped together.
And for issues with N being 20, correlation coefficient had to be at least 0,377 for issues
to be grouped together.
Table 9. Guide to describe the strength of the correlation (Mukaka, 2012).
Very weak correlation
Weak correlation
Moderate correlation
Strong correlation
Very strong correlation
Positive correlation coefficient
0,00 to
0.30
0,30 to
0,50
0,50 to
0,70
0,70 to
0,90
0,90 to
1,00
Negative correlation coefficient
-0,00 to
-0.30
-0,30 to
-0,50
-0,50 to
-0,70
-0,70 to
-0,90
-0,90 to
-1,00
The following tables describe how the groups were formed. The Table 10 shows the
results of Spearman’s Rho for Lack of hardware.

38 Table 10. Results of Spearman’s Rho for Lack of hardware.
Lack of
hardware
Spearman's rho Complex build Correlation Coefficient -,190
Sig. (1-tailed) ,211
N 20
Problematic deployment Correlation Coefficient -,097
Sig. (1-tailed) ,342
N 20
Broken build Correlation Coefficient ,362
Sig. (1-tailed) ,058
N 20
Build duration Correlation Coefficient ,580**
Sig. (1-tailed) ,004
N 20
Efficiency Correlation Coefficient ,096
Sig. (1-tailed) ,344
N 20
Complex testing Correlation Coefficient ,049
Sig. (1-tailed) ,419
N 20
Time-consuming testing Correlation Coefficient ,168
Sig. (1-tailed) ,246
N 19
Lack of discipline Correlation Coefficient -,001
Sig. (1-tailed) ,498
N 19
Lack of knowledge Correlation Coefficient -,126
Sig. (1-tailed) ,304
N 19
*. Correlation is significant at the 0.05 level (1-tailed).
**. Correlation is significant at the 0.01 level (1-tailed).
Table 10 shows that Build duration (correlation coefficient 0,580, Sig. (1-tailed) 0,004)
have the strongest correlation with Lack of hardware. Build duration has correlation
coefficient 0,580 which is moderate correlation with Lack of hardware. As Build duration
correlate most with Lack of hardware, they were grouped together for solution discussion.
Also, Efficiency has the strongest correlation with Build duration as the correlation
coefficient is 0,385 which means that they have weak correlation (Appendix B, page 64).
Efficiency had N 20 so correlation coefficient is high enough (over 0,377) for correlation
to be significant. So, it can be grouped together with the other issues for solution
discussion.
39
Solution for Lack of hardware is simple as the issue itself states it: new and better
hardware. Better hardware or more hardware resources allow the software product to be
continuously integrated as often as necessary and that allows the software product to be
deployed at any time (Claps et al., 2015). Better hardware can also help to solve three
other issues: Build duration, Efficiency and Time-consuming testing (Laukkanen et al.,
2017). Improving hardware capacity of the build machine is a faster and low-cost
approach to reducing integration build duration. But it only works if the machine is
upgradeable and not maximized the upgrade capability (Duvall et al., 2007). Still, the
company plans to get a new build machine for this new Continuous Integration tool or at
least implement it on another computer than the current one. These three issues are also
related to each other when considering the name of the issues: Build duration affects the
time to be able to test and Time-consuming testing affects the Efficiency of testing. With
good enough hardware, the building is faster and testing time can be reduced. The
hardware should provide production-like testing environments and have enough
capabilities for parallelization (Laukkanen et al., 2017).
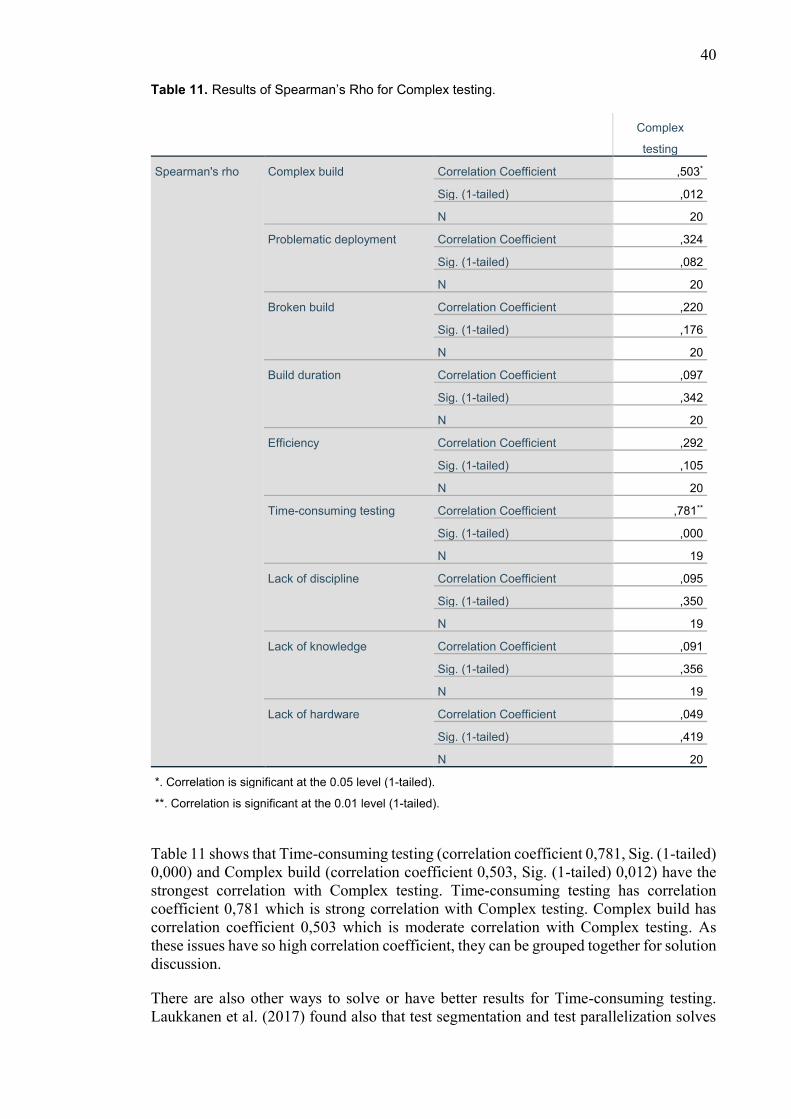
40 Table 11. Results of Spearman’s Rho for Complex testing.
Complex
testing
Spearman's rho Complex build Correlation Coefficient ,503*
Sig. (1-tailed) ,012
N 20
Problematic deployment Correlation Coefficient ,324
Sig. (1-tailed) ,082
N 20
Broken build Correlation Coefficient ,220
Sig. (1-tailed) ,176
N 20
Build duration Correlation Coefficient ,097
Sig. (1-tailed) ,342
N 20
Efficiency Correlation Coefficient ,292
Sig. (1-tailed) ,105
N 20
Time-consuming testing Correlation Coefficient ,781**
Sig. (1-tailed) ,000
N 19
Lack of discipline Correlation Coefficient ,095
Sig. (1-tailed) ,350
N 19
Lack of knowledge Correlation Coefficient ,091
Sig. (1-tailed) ,356
N 19
Lack of hardware Correlation Coefficient ,049
Sig. (1-tailed) ,419
N 20
*. Correlation is significant at the 0.05 level (1-tailed).
**. Correlation is significant at the 0.01 level (1-tailed).
Table 11 shows that Time-consuming testing (correlation coefficient 0,781, Sig. (1-tailed)
0,000) and Complex build (correlation coefficient 0,503, Sig. (1-tailed) 0,012) have the
strongest correlation with Complex testing. Time-consuming testing has correlation
coefficient 0,781 which is strong correlation with Complex testing. Complex build has
correlation coefficient 0,503 which is moderate correlation with Complex testing. As
these issues have so high correlation coefficient, they can be grouped together for solution
discussion.
There are also other ways to solve or have better results for Time-consuming testing.
Laukkanen et al. (2017) found also that test segmentation and test parallelization solves

41
Time-consuming testing. Test segmentation can solve Time-consuming testing by
running the most critical tests first and then other tests if the first tests pass. Test
parallelization solves the issue by the tests running simultaneously and on multiple
machines to speed up testing. Even though the testing can be time-consuming, it is
important that the testing is thorough since deploying the software is dependent on tests
passing on the Continuous Integration tool (Claps et al., 2015). Complex testing issue can
also be seen to be related to Lack of hardware a little bit as Laukkanen et al. (2017)
describe the issue as “Testing is complex, e.g., setting up environment.” So, complexity
of testing can be reduced by hardware which provide production-like testing
environments and by keeping the environments up to date. Complex build and Broken
build issues can be seen to be related to each other as complex build can cause builds to
be broken more often (Laukkanen et al., 2017).

42 Table 12. Results of Spearman’s Rho for Lack of discipline.
Lack of
discipline
Spearman's rho Complex build Correlation Coefficient -,123
Sig. (1-tailed) ,308
N 19
Problematic deployment Correlation Coefficient ,230
Sig. (1-tailed) ,171
N 19
Broken build Correlation Coefficient ,165
Sig. (1-tailed) ,250
N 19
Build duration Correlation Coefficient ,352
Sig. (1-tailed) ,070
N 19
Efficiency Correlation Coefficient ,338
Sig. (1-tailed) ,078
N 19
Complex testing Correlation Coefficient ,095
Sig. (1-tailed) ,350
N 19
Time-consuming testing Correlation Coefficient ,352
Sig. (1-tailed) ,070
N 19
Lack of knowledge Correlation Coefficient ,849**
Sig. (1-tailed) ,000
N 19
Lack of hardware Correlation Coefficient -,001
Sig. (1-tailed) ,498
N 19
*. Correlation is significant at the 0.05 level (1-tailed).
**. Correlation is significant at the 0.01 level (1-tailed).
Table 12 shows that Lack of knowledge (correlation coefficient 0,849, Sig. (1-tailed)
0,000) have the strongest correlation with Lack of discipline. The Lack of knowledge has
correlation coefficient 0,849 which is strong correlation with Lack of discipline. As the
correlation coefficient was so high and they are both related to employees, they can be
grouped together for solution discussion.
Rejecting automatically bad commits that would break the build was suggested solution
for Broken build by Laukkanen et al. (2017) but it was suggested solution for Lack of
discipline also. In this case, the Lack of discipline means the discipline to commit often,
test diligently, monitor the build status and fix problems as a team. Another solution for

43
the Lack of discipline is to make sure that the whole team is trained to practice Continuous
Delivery. This can be seen as the solution for the Lack of knowledge. Another solution
for Lack of knowledge can be to learn to understand the source code. Because Lack of
knowledge can be seen to mean understanding of the source code which is necessary to
write unit tests for it (Anastasia, 2015). Third solution for the Lack of discipline is to
provide tooling to make the process easier to follow, to allow interpreting the test results
and to document a changing software system (Laukkanen et al., 2017). As mentioned,
company took into use a new project management software, Jira, during this research.
Jira provides the necessary tooling which were mentioned as the solution by Laukkanen
et al. (2017): allow all team members to follow process, allow following test results and
allow documentation (Fisher et al., 2013).
There were two issues which did not have significant correlation with any issues: Broken
build and Problematic deployment. Because they did not have significant correlation with
any issues, their solution discussion was done last. One solution for Broken build found
by Laukkanen et al. (2017) was to remove any blockages. Another solution for Broken
build found also by Laukkanen et al. (2017) was to reject automatically bad commits that
would break the build. The found solution for Problematic deployment was to modularize
the system to units that can be independently tested and deployed (Laukkanen et al.,
2017).
5.3 The biggest issues when implementing new Continuous Integration tool
Table 13 shows the found biggest issues when implementing new Continuous Integration
tool. The table is based on medians and modes of the found issues. The issues are listed
in descending order.
Table 13. Top 7 issues when implementing new Continuous Integration tool.
Issue Median Mode
Resistance to change 5 6
Lack of knowledge 5 6
Domain constraints 5 5
Developer trust and
confidence
5 5
Legacy code
considerations
5 5
Lack of resources 5 5
Network latencies 5 4 a
a. Multiple modes exist. The smallest value is shown
The Table 13 shows the top 7 possible issues when implementing new Continuous
Integration tool found from the survey results. These results were gathered from only one
question as there was only one Likert scale question related to the new Continuous

44
Integration tool. The biggest two issues were Resistance to change and Lack of
knowledge as both of them had same median and mode. Lack of knowledge is an
important issue when implementing the new Continuous Integration tool because the
people who do the implementation and those who use the new Continuous Integration
tool should understand or learn to understand the source code because of unit tests
(Anastasia, 2015). Other found issues had same median and mode between them: median
5,00 and mode 5. Only Network latencies had different results: median 5,00 and mode 4
a. Job roles of the participants may have affected the results of this top list. The results
from managers and developers were compared to find out whether the job role has
affected the results of the first two issues as they were above other issues. Resistance to
change had median 5,00 and mode 5 from the results of managers and median 5,50 and
mode 7 from the results of developers. This shows that developers agree more than
managers that Resistance to change is an issue when implementing new Continuous
Integration tool. Lack of knowledge had median 5,00 and mode 5 from results of
managers and median 4,50 and mode 4 a from results of developers. This shows that
managers agree more than developers that the Lack of knowledge is an issue when
implementing new Continuous Integration tool. So, it is important for both, managers and
developers, to understand how to install and use the new Continuous Integration tool or
learn about it (Anastasia, 2015). This may also mean that managers think that developers
need more training. Also, when thinking about the unit tests, it is important that at least
developers have enough knowledge about the source code. Claps et al. (2015) also
highlighted the importance of the need to be well prepared to handle technical and social
adoption challenges with existing expertise, processes and tools before adopting
Continuous Delivery process. The results of this study also show that at least developers
believe that they have knowledge. Also, it seems that there is difference between the
results of managers and developers and especially for the issue of Resistance to change.
The reason may be that the developers think that the change is not happening because of
resistance to change as there has been discussion about changing Continuous Integration
tool for many years. Still, managers may also be thinking that the change is not happening
as they also partly agreed with Resistance to change to be an issue. Results of the open-
ended question of this question supported only the last issue, Network latencies. One
participant stated that location of build server will cause problems when trying to transfer
full build over too insufficient bandwidth for testing. This may be an issue if the
Continuous Integration tool is on hosted server. Costs issue did not make it for this top 7
list of issues even though Abeillé, Buteau & Elattaoui (2015) states that the cost for
putting the Continuous Integration process smoothly in operation is always
underestimated. Still it seems that the participants did not see Costs as an important issue.
This may mean that the Costs may not be relevant at least for developers.
5.4 Solutions for the issues when implementing new Continuous Integration tool
Solutions for issues when implementing new Continuous Integration tool were based on
earlier research. Like in the case of issues of current Continuous Integration tool, some
of the solutions support multiple issues and some of the solutions were similar to each
other. Some of the biggest issues also had similarity between them. Spearman's Rho was
used for analyzing the correlation for these issues also. Table 9 was used as a guide to
describe the strength of the correlations.

45 Table 14. Results of Spearman’s Rho for Developer trust and confidence.
Developer trust
and confidence
Spearman's rho Resistance to change Correlation Coefficient ,628**
Sig. (1-tailed) ,002
N 19
Domain constraints Correlation Coefficient ,199
Sig. (1-tailed) ,207
N 19
Legacy code considerations Correlation Coefficient ,322
Sig. (1-tailed) ,090
N 19
Lack of resources Correlation Coefficient ,449*
Sig. (1-tailed) ,027
N 19
Lack of knowledge Correlation Coefficient ,639**
Sig. (1-tailed) ,002
N 19
Network latencies Correlation Coefficient ,001
Sig. (1-tailed) ,498
N 19
*. Correlation is significant at the 0.05 level (1-tailed).
**. Correlation is significant at the 0.01 level (1-tailed).
Table 14 shows that Resistance to change (correlation coefficient 0,628, Sig. (1-tailed)
0,002) and Lack of knowledge (correlation coefficient 0,639, Sig. (1-tailed) 0,002) have
the strongest correlation with Developer trust and confidence. Resistance to change has
correlation coefficient 0,628 which is moderate correlation with Developer trust and
confidence. Lack of knowledge has correlation coefficient 0,639 which is moderate
correlation with Developer trust and confidence. These three issues can be grouped
together for solution discussion as their correlation coefficient is so high compared to
other issues.
Resistance to change may come up if all of the employees of the company are not
receptive towards new ideas. Implementing new Continuous Integration tool requires
change of working of everyone to actually work. Still this issue may be on the top list of
the issues because the company has been discussing about changing the Continuous
Integration tool for many years. So, if that is the reason, then the change will solve it. If
the Resistance to change is because of lack of motivation, the top-management should
implement a strategy to push the need to implement the Continuous Integration process
(Claps et al., 2015). Documentation of the Continuous Integration process is important so
that it can be understood by novice developers also (Claps et al., 2015). Lack of
knowledge in this case relates to the knowledge of new Continuous Integration tool but
also to understanding of the source code. It is required that a training is done for

46
employees to actually know the new way of using the new Continuous Integration tool.
In this sense, the Developer trust and confidence issue is similar: developers must have
sufficient proficiency and knowledge of Continuous Deployment practices (Leppänen et
al., 2015). It is also important that developers understand the source code or learn it so
that they can write unit tests for it (Anastasia, 2015). Also, the code which is going straight
to production must be as defect-free as possible. This can be solved by good testing and
with the Continuous Integration tool.
Table 15. Results of Spearman’s Rho for Domain constraints.
Domain
constraints
Spearman's rho Resistance to change Correlation Coefficient ,105
Sig. (1-tailed) ,335
N 19
Developer trust and
confidence
Correlation Coefficient ,199
Sig. (1-tailed) ,207
N 19
Legacy code considerations Correlation Coefficient ,441*
Sig. (1-tailed) ,029
N 19
Lack of resources Correlation Coefficient ,152
Sig. (1-tailed) ,268
N 19
Lack of knowledge Correlation Coefficient ,127
Sig. (1-tailed) ,303
N 19
Network latencies Correlation Coefficient ,158
Sig. (1-tailed) ,259
N 19
*. Correlation is significant at the 0.05 level (1-tailed).
**. Correlation is significant at the 0.01 level (1-tailed).
Table 15 shows that Legacy code considerations (correlation coefficient 0,441, Sig. (1-
tailed) 0,029) has the strongest correlation with Domain constraints. Legacy code
considerations has correlation coefficient 0,441 which is weak correlation with Domain
constraints. So, these two issues can be grouped together for solution discussion as their
correlation coefficient is so high compared to other issues.
Domain constraints should be taken into account when developing and deploying. Legacy
code considerations may also become an issue. This is because in some cases, the legacy
software has been built over decades and might not be designed to be automatically tested.
This is actually the case in the company also as mentioned. One solution is to
automatically generate a proper test harness for large legacy systems and write additional
tests for the largest, recent and most fixed source codes. But to write additional tests, it is
required that the developer understands the source code because otherwise writing the

47
additional tests would be impossible (Anastasia, 2015). Highly coupled monolithic
architecture was also one of the challenges when adopting Continuous Delivery found by
Shahin et al. (2016). It is similar issue as Legacy code considerations as it means that
software with monolithic code or monolithic database can be hard to deploy because of
dependencies. Their found solution was to refactor the legacy code (Shahin et al., 2016).
Table 16. Results of Spearman’s Rho for Network latencies.
Network
latencies
Spearman's rho Resistance to change Correlation Coefficient -,055
Sig. (1-tailed) ,412
N 19
Domain constraints Correlation Coefficient ,158
Sig. (1-tailed) ,259
N 19
Developer trust and
confidence
Correlation Coefficient ,001
Sig. (1-tailed) ,498
N 19
Legacy code considerations Correlation Coefficient ,169
Sig. (1-tailed) ,245
N 19
Lack of resources Correlation Coefficient ,542**
Sig. (1-tailed) ,008
N 19
Lack of knowledge Correlation Coefficient ,057
Sig. (1-tailed) ,408
N 19
*. Correlation is significant at the 0.05 level (1-tailed).
**. Correlation is significant at the 0.01 level (1-tailed).
Table 16 shows that Lack of resources (correlation coefficient 0,542, Sig. (1-tailed)
0,008) has the strongest correlation with Network latencies. Lack of resources has
correlation coefficient 0,542 which is moderate correlation with Network latencies. So,
these two issues can be grouped together for solution discussion as their correlation
coefficient is so high. Lack of resources (Appendix C, page 75) has high correlation
coefficient (0,478) also with Lack of knowledge and Developer trust and confidence
(0,449) but it is highest with Network latencies. Lack of knowledge and Developer trust
and confidence had higher correlation coefficient with Resistance to change so that is why
they are not in this group.
Lack of resources in this case meant hardware resources. The new Continuous Integration
tool should have good enough hardware to solve this problem. But different word could
have been used for this issue as Lack of resources could mean the lack of employees too.
Network latencies may be an issue when implementing new Continuous Integration tool
if the Continuous Integration tool is located somewhere else than where the builds are
needed. For example, this could be an issue when testing manually the software if the

48
network bandwidth is not good enough. This was stated by one participant in one open-
ended question. So, a good enough network bandwidth is solution for this if the
Continuous Integration tool has to be located somewhere else (Leppänen et al., 2015).
Another solution for Network latencies would be to locate the Continuous Integration tool
physically at the same place and network as where the builds are needed more. When
considering the Network latencies, Jenkins would be better choice if the Continuous
Integration tool is located locally because in that way the builds would be in the same
network as where they are tested manually. The company already uses Bamboo in some
other offices as a hosted service so it would not be located locally. Even though the
company uses Bamboo in some other offices, it has not been decided yet which
Continuous Integration tool will be taken into use in the office which is related to this
study. Also, it is not sure that if the company starts using Jenkins that it would be located
locally at the same network as where the manual testing happens (Meyer, 2014).
5.5 Benefits of Bamboo and Jenkins
Bamboo is a flexible Continuous Integration tool with Atlassian products integration like
Jira. Bamboo has the best Jira integration and much better integration with other Atlassian
products compared to Jenkins (Curran, 2017). On the other hand, Bamboo is free only for
open-source projects but for other projects it will be free only for first seven days.
According to Polkhovskiy (2016), some reviewers have said that the user-interface of
Bamboo is not good. Also, the first work experience may be complicated and the setup
process was said to be difficult and not clear enough to understand for some users
(Polkhovskiy, 2016).
Open-source and ability for extensions are the main factors of success of Jenkins
according to Polkhovskiy, 2016. Also, most of reviewers of Jenkins say that initial setup
of Jenkins is easy and the configuration is straightforward. But to use complex plugins is
not easy and it needs some more pre-configuration. Jenkins documentation also seems to
be hard to deal with. Some plugins can also crash after an update and it needs time for
restoring a system to functional state. So, the plugins have benefits and disadvantages.
Polkhovskiy (2016) states that the users of Jenkins tend to think that interface of Jenkins
is poor and old-fashioned. Sometimes Jenkins forces the user to make many clicks to find
desirable information (Polkhovskiy, 2016). But both Continuous Integration tools,
Bamboo and Jenkins, can be hosted internally (Meyer, 2014). The Table 17 shows the
benefits of Bamboo and Jenkins. The Table 17 is based on the table created by
Polkhovskiy (2016).

49 Table 17 Benefits of Bamboo and Jenkins (Polkhovskiy, 2016)
Benefit Jenkins Bamboo
GitHub ✔ ✔
Other repositories ✔ ✔
Multi-Language ✔ ✔
Feedback ✔ ✔
Usability ✖ ✔
Security ✔ ✔
Extensibility ✔✔✔ ✔✔
Compatibility ✔✔✔ ✔
Reliability ✔✔✔ ✔
Longevity ✔✔✔ ✔
Commercial ✖ ✔
Totally free ✔ ✖
Trial ✖ ✔
Free for open-source ✔ ✔
Support ✖ ✔
Easy entry period ✖ ✖
Flexibility ✔ ✖
Community ✔✔✔ ✔
So, as can be seen from Table 17, Bamboo and Jenkins have only little differences
between them. The biggest differences are that Bamboo had better usability, support and
is commercial. But the flexibility is better for Jenkins and it is totally free to use. Usability
is better in case of Bamboo even though some users say that the user interface is poor.
Still, Curran (2017) states that Bamboo has simple and intuitive drag and drop user
interface for designing pipelines. But the biggest benefits of Jenkins are extensibility,
compatibility, reliability, longevity and community. Still the Bamboo also has good
extensibility, compatibility, reliability, longevity and community (Polkhovskiy, 2016).
On the other hand, Jenkins had better extensibility, compatibility, reliability, longevity,

50
community and is totally free (Polkhovskiy, 2016). From the viewpoint of the company,
integration with Atlassian products is great benefit as the company uses many Atlassian
products. Usability is also an important benefit for the users. But on the other hand,
possibility to host locally is an important benefit when thinking about network latencies.
Based on the results, it is recommended to compare the features and limitations of the
Continuous Integration tools before choosing the Continuous Integration tool. This is
because Bamboo and Jenkins are so similar and there are so little differences between
them.
5.6 Results
The research focused on What should be considered when implementing new
Continuous Integration tool? Two top lists of issues were created to answer that research
question. The research found 10 issues of the current Continuous Integration tool which
were more serious than others (Table 8). From that top 10 list of issues of current
Continuous Integration tool, Lack of hardware and Build duration were above other
issues. Other 8 issues were: Complex testing, Time-consuming testing, Complex build,
Problematic deployment, Lack of knowledge, Broken build, Efficiency and Lack of
discipline. There were found solutions from other research for the biggest issues. The
research had a supportive research question: What are the biggest issues when
implementing new Continuous Integration tool? Top 7 list of issues was created to
answer that supportive research question. The top 7 list consisted of issues which may
come up when implementing a new Continuous Integration tool (Table 10). From that top
7 list of issues which may come up when implementing a new Continuous Integration
tool, Resistance to change and Lack of knowledge were above other issues. Other 5 issues
were: Domain constraints, Developer trust and confidence, Legacy code considerations,
Lack of resources and Network latencies.
Another supportive research question of the research was How to solve the biggest issues
when implementing new Continuous Integration tool? This research provided solutions
for all of issues included in the top lists of issues. The biggest issues of the current
Continuous Integration tool were Lack of hardware and Build duration. The solution for
Lack of hardware was new and better hardware. Better hardware allows the software
product to be continuously integrated as often as necessary and allows the software
product to be deployed at any time (Claps et al., 2015). Better hardware also solves the
Build duration as improving hardware of the build machine is fast and low-cost approach
to reducing integration build duration (Duvall et al., 2007). The biggest possible issues
when implementing a new Continuous Integration tool were Resistance to change and
Lack of knowledge. Solution for Resistance to change depends on the reason of
resistance. Resistance to change may come up if all of the employees of the company are
not receptive towards new ideas. Implementing new Continuous Integration tool requires
change of working of everyone to actually work. If the Resistance to change is because
of delayed discussion about the change of the Continuous Integration tool, then the
change will solve it. If the reason for resistance is because of lack of motivation, then the
top-management should implement a strategy to push the need to implement the
Continuous Integration process (Claps et al., 2015). Lack of knowledge related to the
knowledge of new Continuous Integration tool but also to understanding of the source
code. Training is required for the employees to actually know the new way of using the
new Continuous Integration tool (Leppänen et al., 2015). It is also important for
developers to understand or learn to understand the existing source code so that they are
able to create new unit tests if necessary (Anastasia, 2015). The following issues were
also found in earlier studies but those were not seen to fit into any of the results from the

51
survey: Product quality, Partner plugins (of the company), Source code control, Changing
database schemas, Customer adoption, Customer feature discovery, Team dependencies
and Ever-changing environments and tools (Claps et al., 2015; Shahin et al., 2016). These
issues should also be considered when implementing the new Continuous Integration tool
even though these issues did not match with the results of the survey.

52
6. Conclusion
Solutions for the found issues were based on earlier research and results of the survey.
So, the answer to the research question of this thesis is that when implementing a new
Continuous Integration tool for the case organization, one need to consider and solve the
biggest issues found during this research. The top lists of issues can be used for making
sure that the biggest issues have been taken into account when implementing new
Continuous Integration tool. There were similar results in earlier studies but not exactly
same. The most similarity was between the studies which the survey was based on but it
is because the survey was based on those studies. Those studies also did not provide
prioritized list of issues but only big lists of issues. Also, the difference of the results is
understandable because of different context. The earlier studies were based on different
companies and earlier studies. Earlier studies focused on challenges when adopting the
Continuous Delivery while this research focused on change of the Continuous Integration
tool. Still those earlier studies were comparable for the results of this research as adopting
Continuous Delivery includes choosing and starting to use Continuous Integration tool.
This is because Continuous Integration has to be in use before starting to use Continuous
Delivery as they can be seen as subsets of each other.
In the end, comparison of two Continuous Integration tools was also one topic of this
research: Bamboo and Jenkins. These Continuous Integration tools were chosen for
comparing as the company is considering to choose either Bamboo or Jenkins.
Comparison was done based on which Continuous Integration tool would be more
suitable for the company.
The biggest found differences between Bamboo and Jenkins were user interface related
and the fact that Bamboo is a commercial tool and Jenkins is an open-source tool. Support
seems to be better for Bamboo, but flexibility is better for Jenkins. Usability is also better
in case of Bamboo even though some users have said that the user interface of Bamboo
is poor. The biggest benefits of Jenkins are easy initial setup and straightforward
configuration and being open-source tool. When considering the user interface, Bamboo
is better choice but when considering the cost, Jenkins is better. Both have good
extensibility but Jenkins is more popular so it has great amount of plugins. Based on the
results, it is recommended to compare the features and limitations of the Continuous
Integration tools before choosing the Continuous Integration tool. This is because
Bamboo and Jenkins are so similar and there is so little differences between them. Results
of this research can be used for comparing the features and limitations of the Continuous
Integration tools.
6.1 Limitations of the research
The schedule of this thesis added some limitations for the research. The target population
was also rather small and consisted of employees from only one company. But it was
intended decision also because of the related project. So, for future research, it is
recommended to focus on multiple companies and to see through at least one
implementation of Continuous Integration tool. The project of the company did not finish
during this research so the results of that project could not be included for this Master’s
thesis. The free version of SurveyMonkey also added some limitations on how to collect
results to be analyzed in SPSS because the free version did not support exporting of the
results. So, in the end, the results had to be copied manually.
53
References
Abeillé, G., Buteau, A., Elattaoui, X., Lê, S., Soleil, S., & Boissinot, G. (2015).
Continuous Delivery At Soleil. In Proceedings of ICALEPCS2015 (pp. 51–55).
Melbourne, Australia.
Anastasia, A. (2015). Unit Test Automation with Jenkins-CI tool (Bachelor’s thesis).
Laurea University of Applied Sciences.
Armenise, V. (2015). Continuous Delivery with Jenkins: Jenkins Solutions to
Implement Continuous Delivery. In 2015 IEEE/ACM 3rd International Workshop
on Release Engineering (pp. 24–27). doi:10.1109/RELENG.2015.19
Claps, G. G., Berntsson Svensson, R., & Aurum, A. (2015). On the journey to
continuous deployment: Technical and social challenges along the way.
Information and Software Technology, 57(1), 21–31.
doi:10.1016/j.infsof.2014.07.009
CruiseControl.NET. (n.d.). Retrieved 14.4.2017 from CruiseControl.NET website:
http://www.cruisecontrolnet.org/
Curran, P. (12.5.2017) Bamboo vs Jenkins [Web blog post]. Retrieved from
https://www.checkmarx.com/2017/03/12/bamboo-vs-jenkins/
Downloading IBM SPSS Statistics 24. (n.d.).
Retrieved 18.3.2017 from IBM Support website:
http://www-01.ibm.com/support/docview.wss?uid=swg24041224
Duvall, P. M., Matyas, S. & Glover, A. (2007). Continuous Integration. Pearson
Education, Inc. & Dorling Kindersley Publishing Inc.
Fisher, J., Koning, D., & Ludwigsen, A. P. (2013). Utilizing Atlassian Jira For Large-
Scale Software Development Management. In Proceedings of the 14th
International Conference on Accelerator & Large Experimental Physics Control
Systems (ICALEPCS) (pp. 1–7). San Francisco, CA, United States.
Fowler, M. (2006). Continuous Integration.
Retrieved 3.4.2017 from
https://martinfowler.com/articles/continuousIntegration.html
Fowler, M. (2013). ContinuousDelivery.
Retrieved 3.4.2017 from
https://martinfowler.com/bliki/ContinuousDelivery.html
Garland, R. (1991). The mid-point on a rating scale: Is it desirable? Marketing Bulletin,
2, 66–70.
Humble, J. & Farley, D. (2010). Continuous Delivery. Pearson Education, Inc.
Hüttermann, M. (2012). DevOps for Developers. Paul Manning.

54
Häkli, A. (2016). Implementation of continuous delivery systems (Master’s thesis).
Tampere University of Technology, Tampere, Finland.
Jamieson, S. (2004). Likert scales: how to (ab)use them. Medical Education, 38, 1217–
1218. doi:10.1111/j.1365-2929.2004.02012.x
Kitchenham, B. a, & Pfleeger, S. L. (2002a). Principles of Survey Research Part 3:
Constructing a Survey Instrument. ACM SIGSOFT Software Engineering Notes,
27(2), 20-24. doi:10.1145/511152.511155
Kitchenham, B., & Pfleeger, S. L. (2002b). Principles of survey research part 4:
questionnaire evaluation. ACM SIGSOFT Software Engineering Notes, 27(3), 20-
23. doi:10.1145/638574.638580
Kitchenham, B., & Pfleeger, S. L. (2002c). Principles of Survey Research Part 5:
Populations and Samples. ACM SIGSOFT Software Engineering Notes, 27(5), 17-
20. doi:10.1145/571681.571686
Laukkanen, E., Itkonen, J., & Lassenius, C. (2017). Problems, causes and solutions
when adopting continuous delivery — A systematic literature review. Information
and Software Technology, 82, 55–79. doi:10.1016/j.infsof.2016.10.001
Leppänen, M., Mäkinen, S., & Pagels, M. (2015). The highways and country roads to
continuous deployment. IEEE Software, 32(2), 64–72. doi:10.1109/MS.2015.50
Little, B., & Harvey, L. (2006). Learning Through Work Placements and Beyond.
Retrieved from
https://www.hecsu.ac.uk/assets/assets/documents/Learning_through_work_placem
ents_and_beyond.pdf
Lozano, L. M., García-Cueto, E., & Muñiz, J. (2008). Effect of the number of response
categories on the reliability and validity of rating scales. Methodology, 4(2), 73–79.
doi:10.1027/1614-2241.4.2.73
Meyer, M. (2014). Continuous Integration and Its Tools. IEEE Software, 31(3), 14–16.
doi:10.1109/MS.2014.58
Mukaka, M. M. (2012). Statistic Corner: A guide to appropriate use of Correlation
coefficient in medical research. Malawi Medical Journal, 24(3), 69–71.
doi:10.1016/j.cmpb.2016.01.020
Nilsson, S. (2016). Implementation of a Continuous Integration and Continuous
Delivery System for Cross-Platform Mobile Application Development (Master’s
thesis). Linköping University, Linköping, Sweden.
Polkhovskiy, D. (2016). Comparison between Continuous Integration tools (Master’s
thesis). Tampere University of Technology, Tampere, Finland.
Sandberg, M. (2015). Continuous Integration - A comparison between theory and
practice (Master’s thesis). Linköping University, Linköping, Sweden.

55
Shahin, M., Babar, M. A., & Zhu, L. (2016). The Intersection of Continuous
Deployment and Architecting Process: Practitioners’ Perspectives. In Proceedings
of the 10th ACM/IEEE International Symposium on Empirical Software
Engineering and Measurement (pp. 11–10). Ciudad Real, Spain.
doi:10.1145/2961111.2962587
UNC College of Arts & Sciences (2014). Literature reviews. Retrieved 18.3.2017, from
The Writing Center website: https://writingcenter.unc.edu/files/2012/09/Literature-
Reviews-The-Writing-Center.pdf
Wuensch, K. (n.d.). How do you pronounce “Likert” What is a Likert Scale?
Retrieved 9.3.2017 from East Caroline University Department of Psychology
website: http://core.ecu.edu/psyc/wuenschk/StatHelp/Likert.htm

56
Appendix A: Survey

57

58
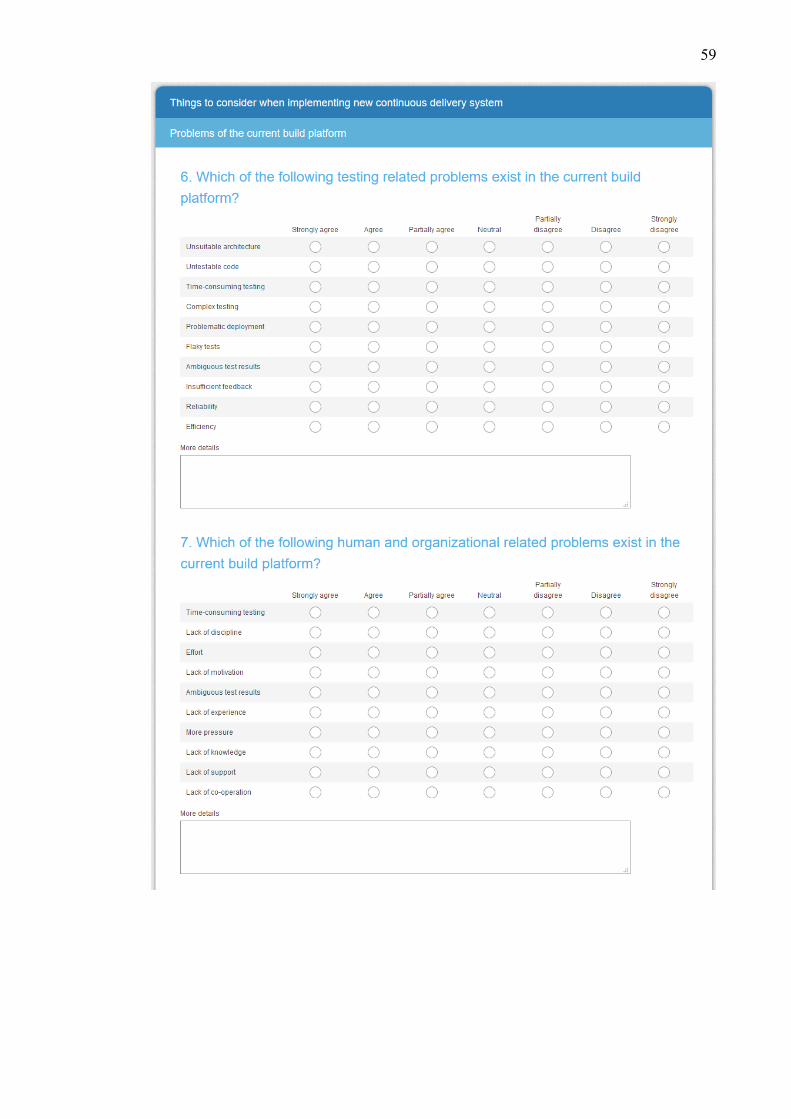
59

60

61

62
Appendix B: Results of Spearman’s Rho of the top 10 issues of current build platform
Complex build
Spearman's rho Problematic deployment Correlation Coefficient ,350
Sig. (1-tailed) ,051
N 23
Broken build Correlation Coefficient ,197
Sig. (1-tailed) ,184
N 23
Build duration Correlation Coefficient -,044
Sig. (1-tailed) ,421
N 23
Efficiency Correlation Coefficient ,031
Sig. (1-tailed) ,449
N 20
Complex testing Correlation Coefficient ,503*
Sig. (1-tailed) ,012
N 20
Time-consuming testing Correlation Coefficient ,196
Sig. (1-tailed) ,211
N 19
Lack of discipline Correlation Coefficient -,123
Sig. (1-tailed) ,308
N 19
Lack of knowledge Correlation Coefficient -,254
Sig. (1-tailed) ,147
N 19
Lack of hardware Correlation Coefficient -,190
Sig. (1-tailed) ,211
N 20
*. Correlation is significant at the 0.05 level (1-tailed).
**. Correlation is significant at the 0.01 level (1-tailed).

63
Problematic
deployment
Spearman's rho Complex build Correlation Coefficient ,350
Sig. (1-tailed) ,051
N 23
Broken build Correlation Coefficient ,006
Sig. (1-tailed) ,489
N 23
Build duration Correlation Coefficient -,028
Sig. (1-tailed) ,450
N 23
Efficiency Correlation Coefficient ,194
Sig. (1-tailed) ,206
N 20
Complex testing Correlation Coefficient ,324
Sig. (1-tailed) ,082
N 20
Time-consuming testing Correlation Coefficient ,329
Sig. (1-tailed) ,085
N 19
Lack of discipline Correlation Coefficient ,230
Sig. (1-tailed) ,171
N 19
Lack of knowledge Correlation Coefficient ,306
Sig. (1-tailed) ,101
N 19
Lack of hardware Correlation Coefficient -,097
Sig. (1-tailed) ,342
N 20
*. Correlation is significant at the 0.05 level (1-tailed).
**. Correlation is significant at the 0.01 level (1-tailed).

64
Broken build
Spearman's rho Complex build Correlation Coefficient ,197
Sig. (1-tailed) ,184
N 23
Problematic deployment Correlation Coefficient ,006
Sig. (1-tailed) ,489
N 23
Build duration Correlation Coefficient ,165
Sig. (1-tailed) ,225
N 23
Efficiency Correlation Coefficient ,062
Sig. (1-tailed) ,397
N 20
Complex testing Correlation Coefficient ,220
Sig. (1-tailed) ,176
N 20
Time-consuming testing Correlation Coefficient ,226
Sig. (1-tailed) ,176
N 19
Lack of discipline Correlation Coefficient ,165
Sig. (1-tailed) ,250
N 19
Lack of knowledge Correlation Coefficient ,018
Sig. (1-tailed) ,471
N 19
Lack of hardware Correlation Coefficient ,362
Sig. (1-tailed) ,058
N 20
*. Correlation is significant at the 0.05 level (1-tailed).
**. Correlation is significant at the 0.01 level (1-tailed).

65
Build duration
Spearman's rho Complex build Correlation Coefficient -,044
Sig. (1-tailed) ,421
N 23
Problematic deployment Correlation Coefficient -,028
Sig. (1-tailed) ,450
N 23
Broken build Correlation Coefficient ,165
Sig. (1-tailed) ,225
N 23
Efficiency Correlation Coefficient ,385*
Sig. (1-tailed) ,047
N 20
Complex testing Correlation Coefficient ,097
Sig. (1-tailed) ,342
N 20
Time-consuming testing Correlation Coefficient ,288
Sig. (1-tailed) ,116
N 19
Lack of discipline Correlation Coefficient ,352
Sig. (1-tailed) ,070
N 19
Lack of knowledge Correlation Coefficient ,255
Sig. (1-tailed) ,146
N 19
Lack of hardware Correlation Coefficient ,580**
Sig. (1-tailed) ,004
N 20
*. Correlation is significant at the 0.05 level (1-tailed).
**. Correlation is significant at the 0.01 level (1-tailed).

66
Efficiency
Spearman's rho Complex build Correlation Coefficient ,031
Sig. (1-tailed) ,449
N 20
Problematic deployment Correlation Coefficient ,194
Sig. (1-tailed) ,206
N 20
Broken build Correlation Coefficient ,062
Sig. (1-tailed) ,397
N 20
Build duration Correlation Coefficient ,385*
Sig. (1-tailed) ,047
N 20
Complex testing Correlation Coefficient ,292
Sig. (1-tailed) ,105
N 20
Time-consuming testing Correlation Coefficient ,191
Sig. (1-tailed) ,216
N 19
Lack of discipline Correlation Coefficient ,338
Sig. (1-tailed) ,078
N 19
Lack of knowledge Correlation Coefficient ,239
Sig. (1-tailed) ,162
N 19
Lack of hardware Correlation Coefficient ,096
Sig. (1-tailed) ,344
N 20
*. Correlation is significant at the 0.05 level (1-tailed).
**. Correlation is significant at the 0.01 level (1-tailed).
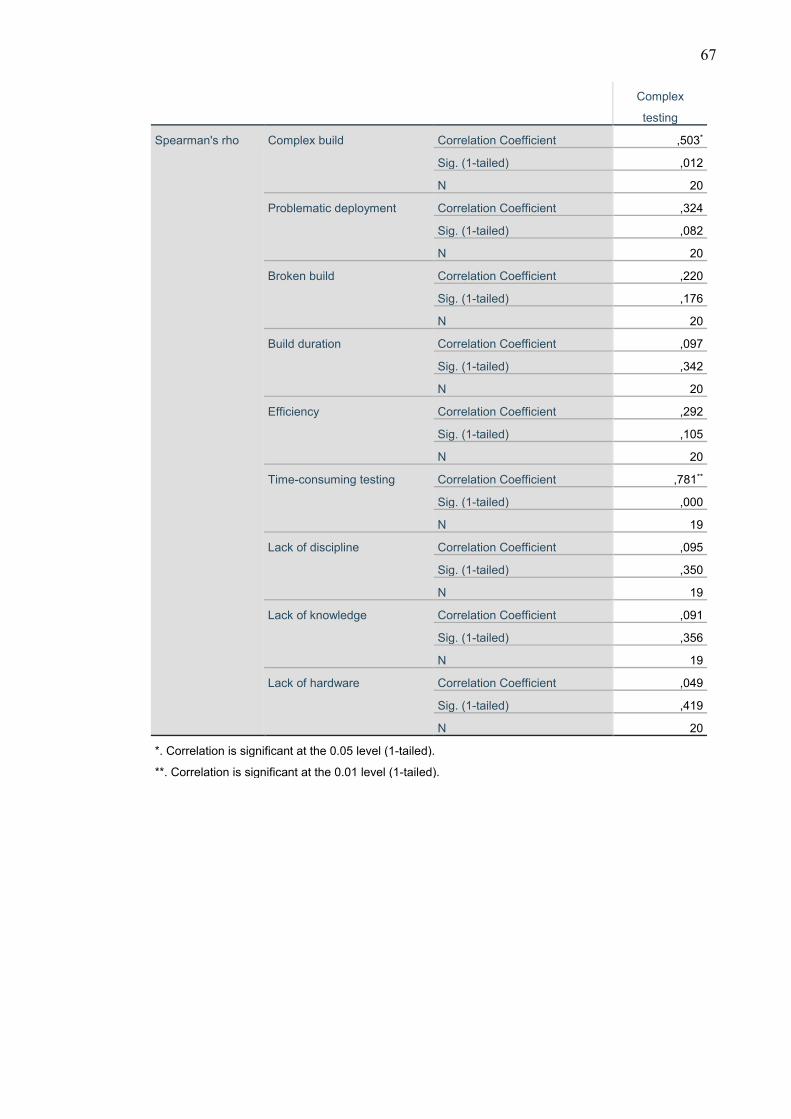
67
Complex
testing
Spearman's rho Complex build Correlation Coefficient ,503*
Sig. (1-tailed) ,012
N 20
Problematic deployment Correlation Coefficient ,324
Sig. (1-tailed) ,082
N 20
Broken build Correlation Coefficient ,220
Sig. (1-tailed) ,176
N 20
Build duration Correlation Coefficient ,097
Sig. (1-tailed) ,342
N 20
Efficiency Correlation Coefficient ,292
Sig. (1-tailed) ,105
N 20
Time-consuming testing Correlation Coefficient ,781**
Sig. (1-tailed) ,000
N 19
Lack of discipline Correlation Coefficient ,095
Sig. (1-tailed) ,350
N 19
Lack of knowledge Correlation Coefficient ,091
Sig. (1-tailed) ,356
N 19
Lack of hardware Correlation Coefficient ,049
Sig. (1-tailed) ,419
N 20
*. Correlation is significant at the 0.05 level (1-tailed).
**. Correlation is significant at the 0.01 level (1-tailed).

68
Time-
consuming
testing
Spearman's rho Complex build Correlation Coefficient ,196
Sig. (1-tailed) ,211
N 19
Problematic deployment Correlation Coefficient ,329
Sig. (1-tailed) ,085
N 19
Broken build Correlation Coefficient ,226
Sig. (1-tailed) ,176
N 19
Build duration Correlation Coefficient ,288
Sig. (1-tailed) ,116
N 19
Efficiency Correlation Coefficient ,191
Sig. (1-tailed) ,216
N 19
Complex testing Correlation Coefficient ,781**
Sig. (1-tailed) ,000
N 19
Lack of discipline Correlation Coefficient ,352
Sig. (1-tailed) ,070
N 19
Lack of knowledge Correlation Coefficient ,490*
Sig. (1-tailed) ,017
N 19
Lack of hardware Correlation Coefficient ,168
Sig. (1-tailed) ,246
N 19
*. Correlation is significant at the 0.05 level (1-tailed).
**. Correlation is significant at the 0.01 level (1-tailed).

69
Lack of
discipline
Spearman's rho Complex build Correlation Coefficient -,123
Sig. (1-tailed) ,308
N 19
Problematic deployment Correlation Coefficient ,230
Sig. (1-tailed) ,171
N 19
Broken build Correlation Coefficient ,165
Sig. (1-tailed) ,250
N 19
Build duration Correlation Coefficient ,352
Sig. (1-tailed) ,070
N 19
Efficiency Correlation Coefficient ,338
Sig. (1-tailed) ,078
N 19
Complex testing Correlation Coefficient ,095
Sig. (1-tailed) ,350
N 19
Time-consuming testing Correlation Coefficient ,352
Sig. (1-tailed) ,070
N 19
Lack of knowledge Correlation Coefficient ,849**
Sig. (1-tailed) ,000
N 19
Lack of hardware Correlation Coefficient -,001
Sig. (1-tailed) ,498
N 19
*. Correlation is significant at the 0.05 level (1-tailed).
**. Correlation is significant at the 0.01 level (1-tailed).

70
Lack of
knowledge
Spearman's rho Complex build Correlation Coefficient -,254
Sig. (1-tailed) ,147
N 19
Problematic deployment Correlation Coefficient ,306
Sig. (1-tailed) ,101
N 19
Broken build Correlation Coefficient ,018
Sig. (1-tailed) ,471
N 19
Build duration Correlation Coefficient ,255
Sig. (1-tailed) ,146
N 19
Efficiency Correlation Coefficient ,239
Sig. (1-tailed) ,162
N 19
Complex testing Correlation Coefficient ,091
Sig. (1-tailed) ,356
N 19
Time-consuming testing Correlation Coefficient ,490*
Sig. (1-tailed) ,017
N 19
Lack of discipline Correlation Coefficient ,849**
Sig. (1-tailed) ,000
N 19
Lack of hardware Correlation Coefficient -,126
Sig. (1-tailed) ,304
N 19
*. Correlation is significant at the 0.05 level (1-tailed).
**. Correlation is significant at the 0.01 level (1-tailed).

71
Lack of
hardware
Spearman's rho Complex build Correlation Coefficient -,190
Sig. (1-tailed) ,211
N 20
Problematic deployment Correlation Coefficient -,097
Sig. (1-tailed) ,342
N 20
Broken build Correlation Coefficient ,362
Sig. (1-tailed) ,058
N 20
Build duration Correlation Coefficient ,580**
Sig. (1-tailed) ,004
N 20
Efficiency Correlation Coefficient ,096
Sig. (1-tailed) ,344
N 20
Complex testing Correlation Coefficient ,049
Sig. (1-tailed) ,419
N 20
Time-consuming testing Correlation Coefficient ,168
Sig. (1-tailed) ,246
N 19
Lack of discipline Correlation Coefficient -,001
Sig. (1-tailed) ,498
N 19
Lack of knowledge Correlation Coefficient -,126
Sig. (1-tailed) ,304
N 19
*. Correlation is significant at the 0.05 level (1-tailed).
**. Correlation is significant at the 0.01 level (1-tailed).

72
Appendix C: Results of Spearman’s Rho of the top 7 possible issues when implementing new build platform
Resistance to
change
Spearman's rho Domain constraints Correlation Coefficient ,105
Sig. (1-tailed) ,335
N 19
Developer trust and
confidence
Correlation Coefficient ,628**
Sig. (1-tailed) ,002
N 19
Legacy code considerations Correlation Coefficient ,183
Sig. (1-tailed) ,227
N 19
Lack of resources Correlation Coefficient ,073
Sig. (1-tailed) ,383
N 19
Lack of knowledge Correlation Coefficient ,380
Sig. (1-tailed) ,055
N 19
Network latencies Correlation Coefficient -,055
Sig. (1-tailed) ,412
N 19
*. Correlation is significant at the 0.05 level (1-tailed).
**. Correlation is significant at the 0.01 level (1-tailed).
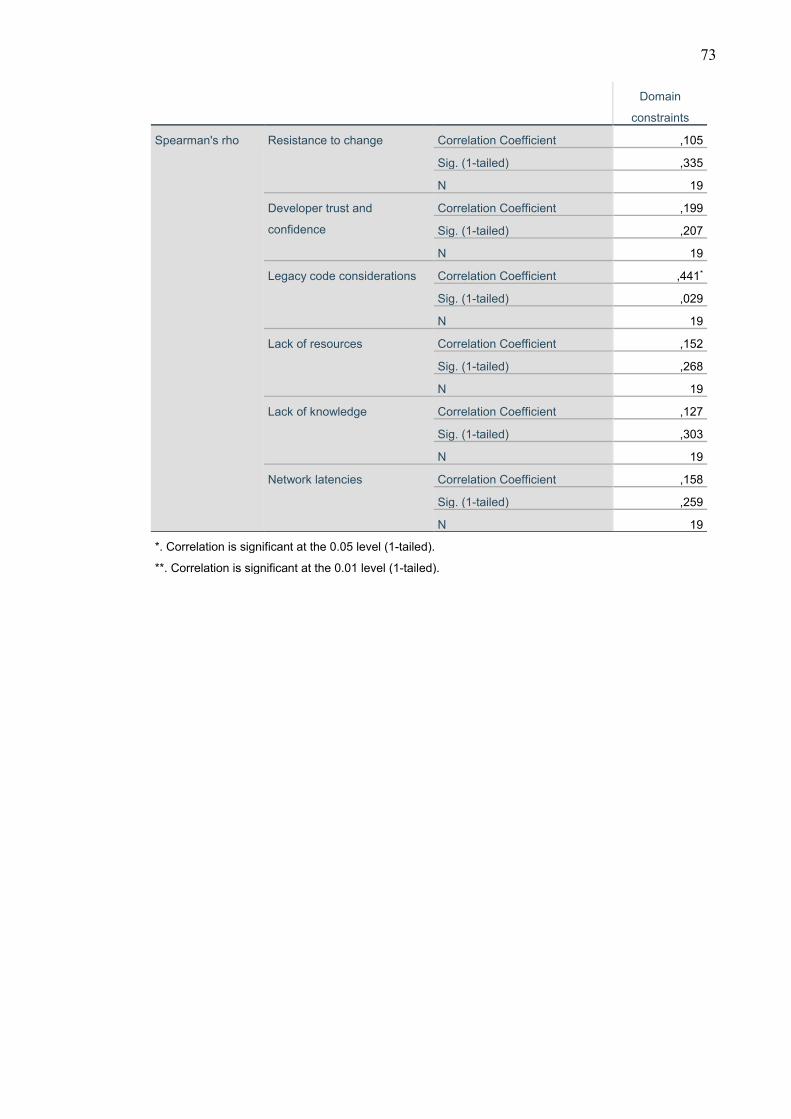
73
Domain
constraints
Spearman's rho Resistance to change Correlation Coefficient ,105
Sig. (1-tailed) ,335
N 19
Developer trust and
confidence
Correlation Coefficient ,199
Sig. (1-tailed) ,207
N 19
Legacy code considerations Correlation Coefficient ,441*
Sig. (1-tailed) ,029
N 19
Lack of resources Correlation Coefficient ,152
Sig. (1-tailed) ,268
N 19
Lack of knowledge Correlation Coefficient ,127
Sig. (1-tailed) ,303
N 19
Network latencies Correlation Coefficient ,158
Sig. (1-tailed) ,259
N 19
*. Correlation is significant at the 0.05 level (1-tailed).
**. Correlation is significant at the 0.01 level (1-tailed).

74
Developer trust
and confidence
Spearman's rho Resistance to change Correlation Coefficient ,628**
Sig. (1-tailed) ,002
N 19
Domain constraints Correlation Coefficient ,199
Sig. (1-tailed) ,207
N 19
Legacy code considerations Correlation Coefficient ,322
Sig. (1-tailed) ,090
N 19
Lack of resources Correlation Coefficient ,449*
Sig. (1-tailed) ,027
N 19
Lack of knowledge Correlation Coefficient ,639**
Sig. (1-tailed) ,002
N 19
Network latencies Correlation Coefficient ,001
Sig. (1-tailed) ,498
N 19
*. Correlation is significant at the 0.05 level (1-tailed).
**. Correlation is significant at the 0.01 level (1-tailed).

75
Legacy code
considerations
Spearman's rho Resistance to change Correlation Coefficient ,183
Sig. (1-tailed) ,227
N 19
Domain constraints Correlation Coefficient ,441*
Sig. (1-tailed) ,029
N 19
Developer trust and
confidence
Correlation Coefficient ,322
Sig. (1-tailed) ,090
N 19
Lack of resources Correlation Coefficient ,290
Sig. (1-tailed) ,114
N 19
Lack of knowledge Correlation Coefficient ,568**
Sig. (1-tailed) ,006
N 19
Network latencies Correlation Coefficient ,169
Sig. (1-tailed) ,245
N 19
*. Correlation is significant at the 0.05 level (1-tailed).
**. Correlation is significant at the 0.01 level (1-tailed).

76
Lack of
resources
Spearman's rho Resistance to change Correlation Coefficient ,073
Sig. (1-tailed) ,383
N 19
Domain constraints Correlation Coefficient ,152
Sig. (1-tailed) ,268
N 19
Developer trust and
confidence
Correlation Coefficient ,449*
Sig. (1-tailed) ,027
N 19
Legacy code considerations Correlation Coefficient ,290
Sig. (1-tailed) ,114
N 19
Lack of knowledge Correlation Coefficient ,478*
Sig. (1-tailed) ,019
N 19
Network latencies Correlation Coefficient ,542**
Sig. (1-tailed) ,008
N 19
*. Correlation is significant at the 0.05 level (1-tailed).
**. Correlation is significant at the 0.01 level (1-tailed).
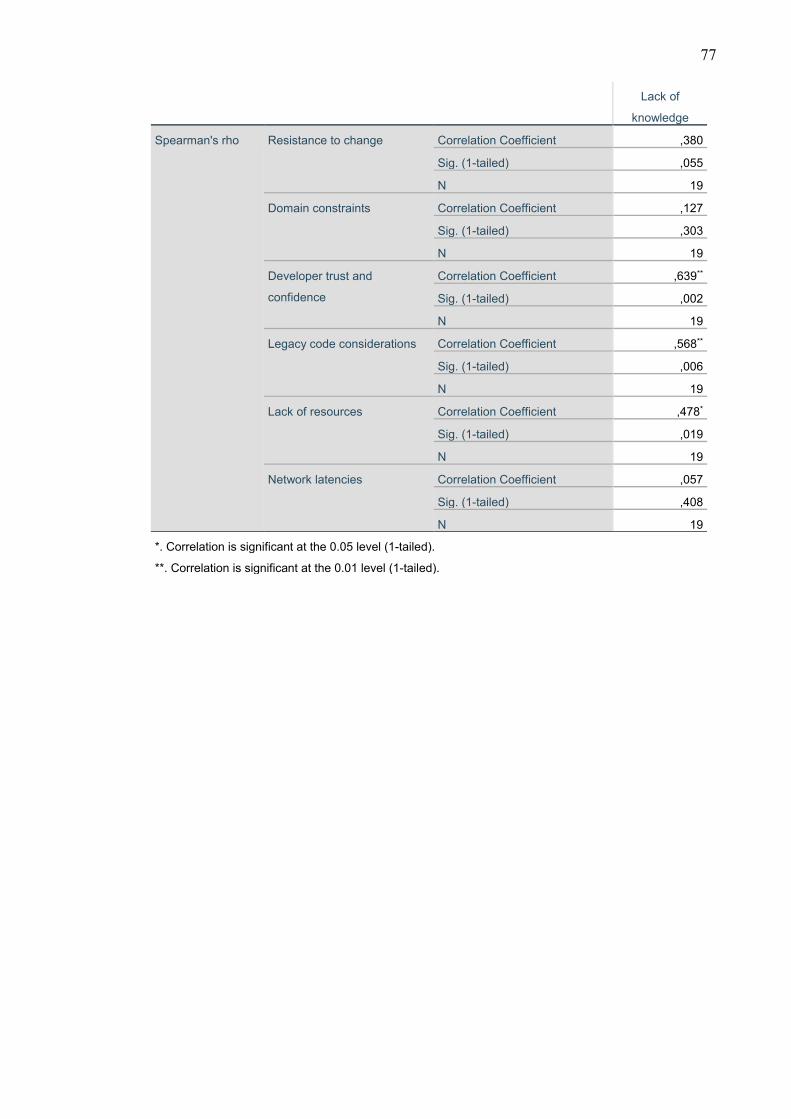
77
Lack of
knowledge
Spearman's rho Resistance to change Correlation Coefficient ,380
Sig. (1-tailed) ,055
N 19
Domain constraints Correlation Coefficient ,127
Sig. (1-tailed) ,303
N 19
Developer trust and
confidence
Correlation Coefficient ,639**
Sig. (1-tailed) ,002
N 19
Legacy code considerations Correlation Coefficient ,568**
Sig. (1-tailed) ,006
N 19
Lack of resources Correlation Coefficient ,478*
Sig. (1-tailed) ,019
N 19
Network latencies Correlation Coefficient ,057
Sig. (1-tailed) ,408
N 19
*. Correlation is significant at the 0.05 level (1-tailed).
**. Correlation is significant at the 0.01 level (1-tailed).

78
Network
latencies
Spearman's rho Resistance to change Correlation Coefficient -,055
Sig. (1-tailed) ,412
N 19
Domain constraints Correlation Coefficient ,158
Sig. (1-tailed) ,259
N 19
Developer trust and
confidence
Correlation Coefficient ,001
Sig. (1-tailed) ,498
N 19
Legacy code considerations Correlation Coefficient ,169
Sig. (1-tailed) ,245
N 19
Lack of resources Correlation Coefficient ,542**
Sig. (1-tailed) ,008
N 19
Lack of knowledge Correlation Coefficient ,057
Sig. (1-tailed) ,408
N 19
*. Correlation is significant at the 0.05 level (1-tailed).
**. Correlation is significant at the 0.01 level (1-tailed).