Implementing Integrated Guidance -...
32
Implementing Integrated Guidance Case studies in communicating value-relevant information November 2015
Transcript of Implementing Integrated Guidance -...
Implementing Integrated GuidanceCase studies in communicating value-relevant information
November 2015

All text, artwork, photographs, layouts and other content and associated intellectual property rights, including copyright, and are owned by The Generation Foundation or used with permission.
The content is provided to you for general, non-commercial purposes only. Although we endeavour to ensure that the content is accurate and up to date, The Generation Foundation accepts no responsibility for loss or damages arising from reliance on information contained in this document.
Unless otherwise stated, all content is licensed to you under the Creative Commons Attribution-Non-Commercial 3.0 Unported licence (http://creativecommons.org/licenses/by-nc/3.0/). This means that you are free to share the content by copying, distributing, and transmitting it, and you may produce derivative works from the content, but you may not make commercial use of it and you must always attribute it to The Generation Foundation.
You must always make reference to the Creative Commons Attribution-Non-commercial 3.0 Unported licence with your use of the Content and retain any other copyright or proprietary notices or other licensing information specified by The General Foundation.
Some of the icons used were made by Freepik from www.flaticon.com
Disclaimer
This report was written by Sakis Kotsantonis and George Serafeim of KKS Advisors, with Daniela Saltzman and Shalini Rao of The Generation Foundation.
About KKS AdvisorsKKS advisors is an advisory services firm working with companies, investors, NGOs, and public officials to find innovative solutions that enable the creation of more sustainable business models and communities. Private and public sector leaders come to KKS when they face the most challenging issues for their organizations.
For more information, please contact Sakis Kotsantonis at [email protected] www.kksadvisors.com
About Generation FoundationThe Generation Foundation (the ‘Foundation’) was part of the original vision of Generation Investment Management LLP (the ‘LLP’) since the firm was founded in 2004. The Foundation was established alongside Generation in order to strengthen the case for Sustainable Capitalism. Our strategy in pursuit of this vision is to mobilise asset owners, asset managers, companies and other key participants in financial markets in support of the business case for Sustainable Capitalism and to persuade them to allocate capital accordingly. In our effort to accelerate the transition to a more sustainable form of capitalism, we primarily use a partnership model to collaborate with individuals, organisations and institutions across sectors and geographies and provide catalytic capital when appropriate. In addition, The Foundation publishes in-house research, gives select grants related to the field of Sustainable Capitalism, engages with the local communities where we operate and supports a gift-matching programme for the employees of Generation. All of the activities of The Foundation, a not-for-profit entity, are funded by a distribution of Generation’s annual profitability.
For more information, please contact Daniela Saltzman at [email protected]
About UsGeneration Foundation & KKS Advisors
Executive Summary 4
IntroductionWhat is the current state of play?
55
Catalyzing ChangeIntegrated Guidance: a timely ideaHow to abandon earnings guidance
667
Integrated GuidanceFrameworkResearch approachKey indicators of long-term value
889
10
Sector AnalysisCommercial BanksPharmaceuticalsSoftware & ITAutomobilesSummary chart - most discussed indicators
111112131415
DiscussionSummary of our findingsTop analysts are initiating conversations on leading indicators
161617
What’s NextKey conclusionsRecommendations
181819
Appendix 20
Contents
P5Executive Summary
In our previous report, ‘Earnings Guidance – Part of the Future or the Past?’ we reviewed the long-standing debate about the impact of quarterly earnings guidance. Our findings revealed that the costs of the practice outweigh the benefits. We proposed a framework for action by CEOs of companies that wish to abandon earnings guidance, assisting them in ceasing the practice and moving to the next generation of corporate communications. We also introduced the question of what should replace earnings guidance by providing an overview of a framework we termed ‘Integrated Guidance.’
Integrated Guidance is a corporate communications strategy that aims to support long-term investors by providing them with relevant and meaningful information. In this report we aim to expand on the idea of Integrated Guidance and focus on the practical steps that companies need to take in order to implement it.
We argue that ceasing earnings guidance and adopting Integrated Guidance, does not mean less information is provided to the investment community, but rather that the type of information provided is more material and reflective of the long-term strategic vision of the company.
The first part of this report (Catalyzing Change) describes how companies should cease earnings guidance by answering two critical questions:1. Is quarterly earnings guidance really important to investors? 2. What happens to companies that cease guidance?
We also provide examples of companies that have used the recommendations outlined in the action framework for CEOs to illustrate emerging practices.
The second part of this paper (Integrated Guidance) discusses the Integrated Guidance framework in further detail, expanding on how it can replace traditional quarterly earnings guidance. In this section we present new data on how companies are already employing certain tenets of Integrated Guidance in their communication practices. In order to make this assessment, we analysed financial and sustainability reports and quarterly earnings call transcripts.
The last section (What’s Next) summarizes the key conclusions of the report and also discusses recommendations on next steps.
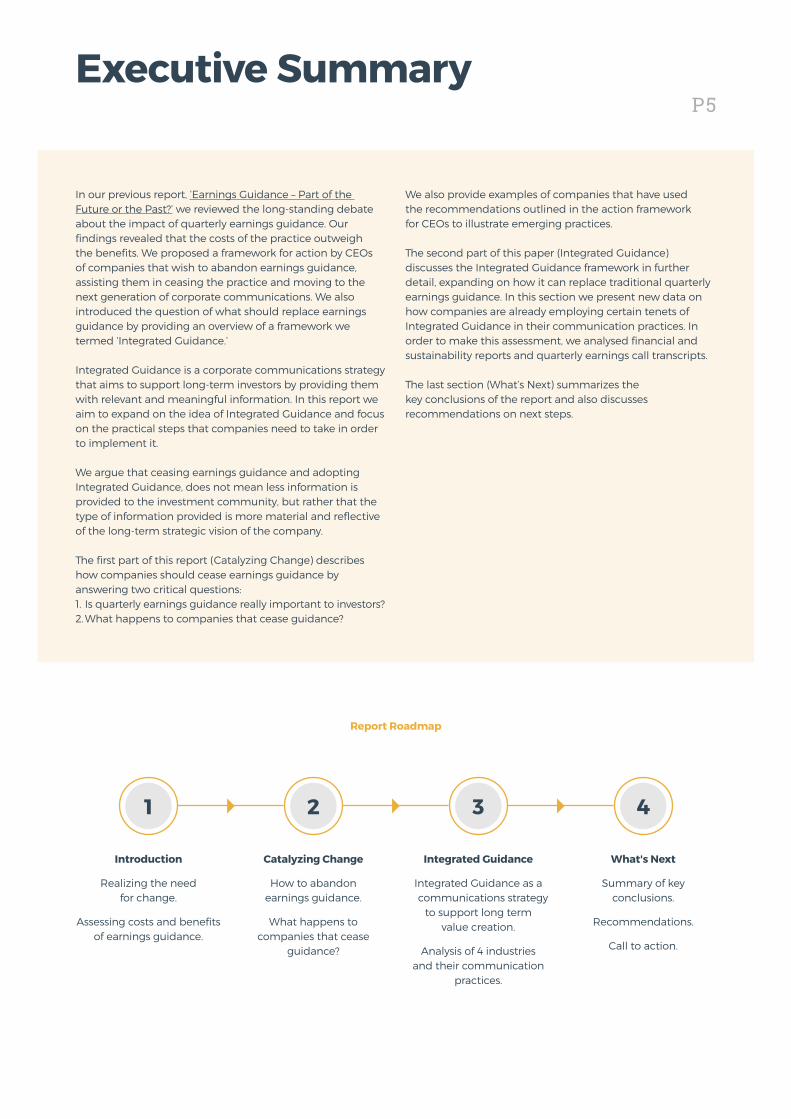
Report Roadmap
Introduction
Realizing the need for change.
Assessing costs and benefits of earnings guidance.
Catalyzing Change
How to abandon earnings guidance.
What happens to companies that cease
guidance?
Integrated Guidance
Integrated Guidance as a communications strategy
to support long term value creation.
Analysis of 4 industries and their communication
practices.
What's Next
Summary of key conclusions.
Recommendations.
Call to action.
1 2 3 4
P6IntroductionWhat is the current state of play?
Short-termism is a fundamental problem in our global capital markets as it leads to the inefficient management of resources. Short-termism in corporate management has repeatedly influenced the long-term competitiveness of corporations that have been held hostage to the pressures and incentives of condensed time horizons. A managerial practice that has been associated with short-termism is the practice of quarterly earnings guidance, which focuses organizations on meeting or beating short-term financial targets, an expectation held by investment analysts.1
Our 2014 report presented a comprehensive literature review on the perceived benefits and actual costs of the practice, concluding that the costs of earnings guidance outweighed the benefits. After further investigation, the report empirically proved that the benefits were actually ‘perceived benefits’, instead of tangible benefits, further dismantling the case for earnings guidance.2
As companies came to realize the costs of short-term targets, many either ceased quarterly earnings guidance or shifted to annual guidance. Big firms such as Coca-Cola, Google and Unilever were some of the first to announce that providing earnings guidance was not aligned with their long- term vision and strategy. Other blue-chip firms have followed suit and over the last few years, brand-name companies such as Costco, Ford,
UPS, AT&T and Berkshire Hathaway have stopped posting quarterly earnings forecasts. Even newly formed public corporations, coming out from their initial public offerings, have decided not to adopt the practice.
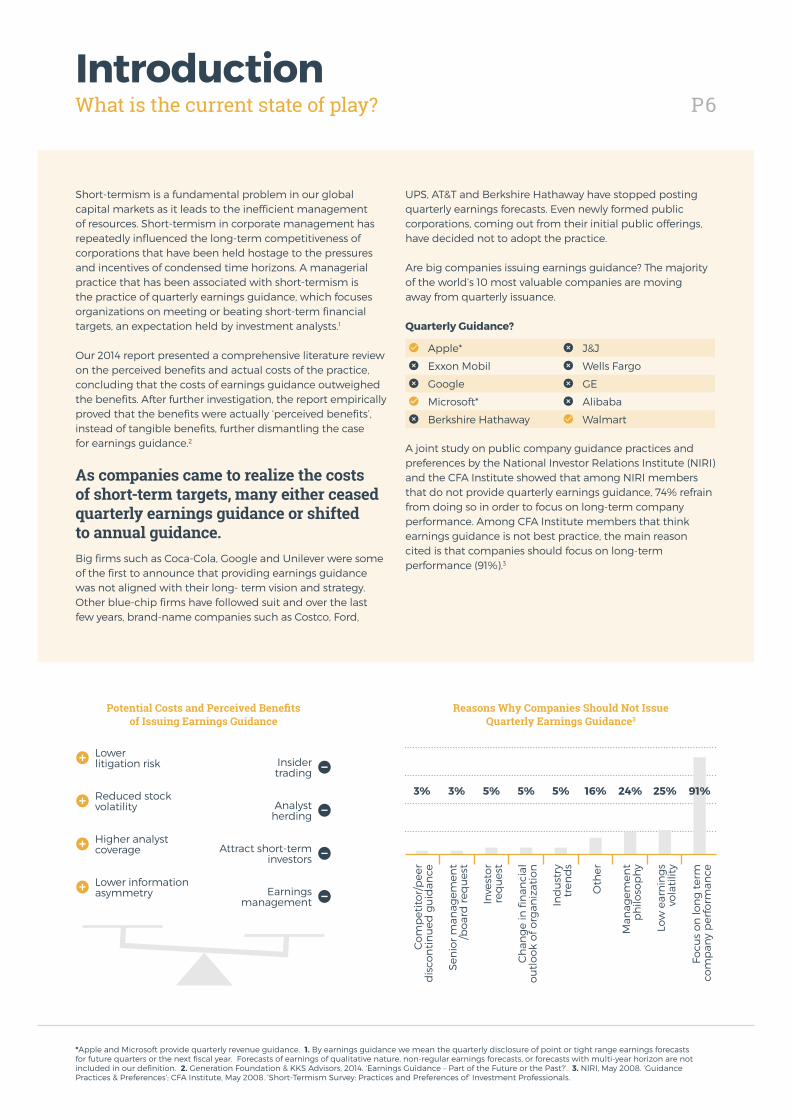
Are big companies issuing earnings guidance? The majority of the world’s 10 most valuable companies are moving away from quarterly issuance.
Quarterly Guidance?
Apple* J&J
Exxon Mobil Wells Fargo
Google GE
Microsoft* Alibaba
Berkshire Hathaway Walmart
A joint study on public company guidance practices and preferences by the National Investor Relations Institute (NIRI) and the CFA Institute showed that among NIRI members that do not provide quarterly earnings guidance, 74% refrain from doing so in order to focus on long-term company performance. Among CFA Institute members that think earnings guidance is not best practice, the main reason cited is that companies should focus on long-term performance (91%).3
*Apple and Microsoft provide quarterly revenue guidance. 1. By earnings guidance we mean the quarterly disclosure of point or tight range earnings forecasts for future quarters or the next fiscal year. Forecasts of earnings of qualitative nature, non-regular earnings forecasts, or forecasts with multi-year horizon are not included in our definition. 2. Generation Foundation & KKS Advisors, 2014. ‘Earnings Guidance – Part of the Future or the Past?’. 3. NIRI, May 2008. ‘Guidance Practices & Preferences’; CFA Institute, May 2008. ‘Short-Termism Survey: Practices and Preferences of’ Investment Professionals.
Potential Costs and Perceived Benefits of Issuing Earnings Guidance
Co
mp
etit
or/
pee
r d
isco
nti
nu
ed g
uid
ance
Ind
ust
ry
tren
ds
Inve
sto
r re
qu
est
Man
agem
ent
ph
iloso
ph
y
Sen
ior
man
agem
ent
/bo
ard
req
ues
t
Oth
er
Ch
ang
e in
fin
anci
al
ou
tlo
ok
of o
rgan
izat
ion
Low
ear
nin
gs
vola
tilit
y
Focu
s o
n lo
ng
ter
m
com
pan
y p
erfo
rman
ce
91%25%24%16%5%5%5%3%3%
Reasons Why Companies Should Not Issue Quarterly Earnings Guidance3
Lower litigation risk
Higher analyst coverage
Reduced stock volatility
Lower information asymmetry
Analyst herding
Insider trading
Attract short-term investors
Earnings management
P7S
ho
rt T
erm
Inve
sto
rs
Regularity of Issued Guidance
Catalyzing ChangeIntegrated Guidance: a timely idea
A recent study in the Journal of Contemporary Accounting Research examined the impact of ending quarterly earnings guidance on information asymmetry using a large sample of firms during the years 2002-11.4 The results showed that guidance cessation significantly reduced information asymmetry and that firms engaged in less earnings management after guidance cessation, especially firms that had provided guidance on a regular basis.
Another study found an increase in long- term investor holdings after ending guidance.5 Research has also found no significant decline in analyst following and no change in return volatility for firms that stopped issuing guidance.6
However, companies are sometimes reluctant to cease earnings guidance for two reasons. First, cessation of earnings guidance can potentially be perceived as a sign of the company’s economic uncertainty. Second, companies tend to operate under the principle that the more information provided, the better. As such, ending earnings guidance can potentially signal corporate opacity and bad governance.
In general, studies have not distinguished between companies that abandon guidance to concentrate on the long-term success of the business, companies that do so because they are facing uncertain futures and others that cease guidance to avoid accountability.
In our first report we stressed the mutual importance of not only abandoning earnings guidance, but of also expressing a commitment towards meaningful transparency.
The fear that some firms may end guidance in order to avoid accountability is confirmed in the results of Houston et al., who find that poor firm operating performance is the main reason that company’s cease guidance.7 These results illustrate the importance of replacing earnings guidance with a commitment to transparency, coupled with the release of more material information to investors. We believe that Integrated Guidance is the framework through which this can be achieved.
Efficient capital allocation requires information that allows investors to assess the future potential of a business, without being distracted by short-term financial figures. Even if companies choose to cease earnings guidance, they still need to provide market participants with adequate information for investment decisions. Companies should disclose information that is material to investors in order to reduce information asymmetry. This kind of information should include: i) financial and ESG (Environmental, Social and Governance*) challenges and opportunities, ii) the company’s strategic plan short and long-term, and iii) how the company is using its different types of capital in the most effective ways.
* For examples of environmental, social and governance (ESG) factors that collectively form the key pillars of a sustainability analysis, please see Figure 1, p. 2: Generation Foundation. May 2015. Allocating Capital for Long-Term Returns – The strengthened case for sustainable capitalism. 4. Houston, J., B. Lev, and J. Tucker. 2010. To guide or not to guide? Causes and consequences of stopping quarterly earnings guidance. Contemporary Accounting Research 27 (1): 143–185. 5. Cheng, M., K.R. Subramanyam, and Y. Zhang. 2014. Earnings Guidance and Managerial Myopia. Working Paper. 6. Chen, S., D. Matsumoto and S. Rajgopal. 2011. Is silence golden? An empirical analysis of firms that stop giving quarterly earnings guidance. Journal of Accounting and Economics 51(1-2): 134-150. 7. Hu, Bill and Hwang, Joon Ho and Jiang, Christine X., 2014. ‘ The Impact of Earnings Guidance Cessation on Information Asymmetry’ Journal of Business Finance & Accounting, Vol. 41, Issue 1-2, pp. 73-99. 8. Generation Foundation & KKS Advisors, 2014. ‘Earnings Guidance – Part of the Future or the Past?’.
Medium-High HighLow-MediumLow
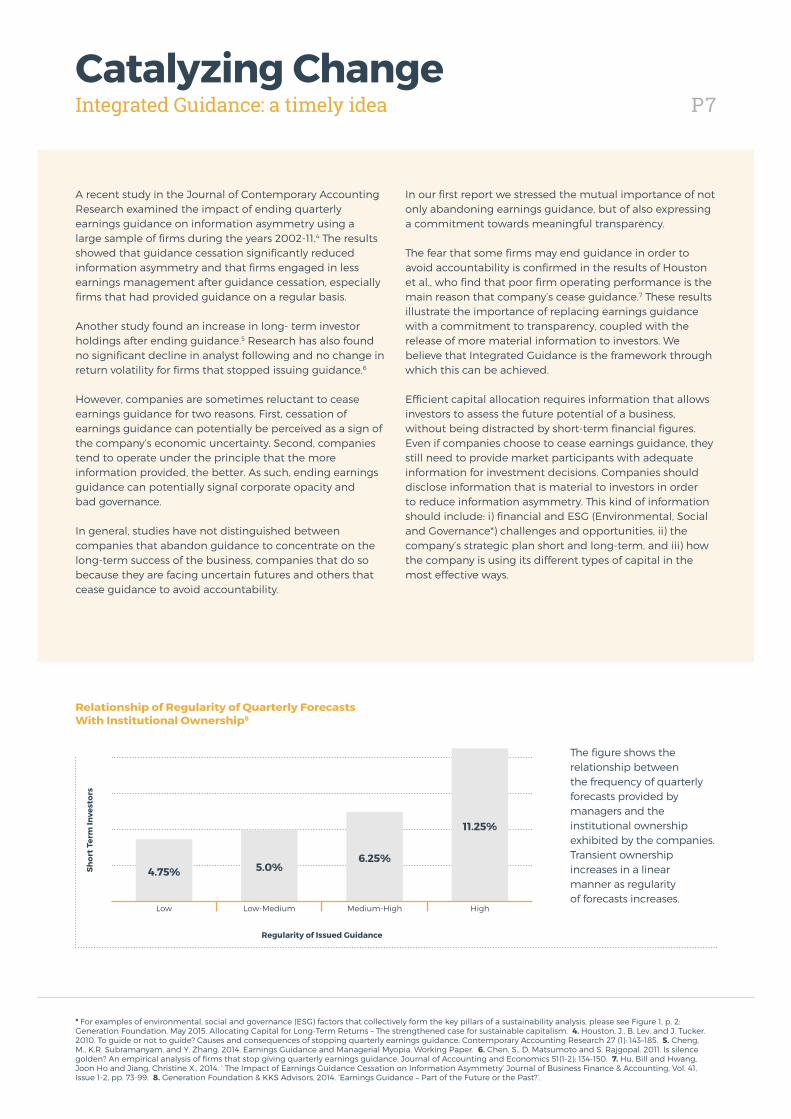
Relationship of Regularity of Quarterly Forecasts With Institutional Ownership8
4.75% 5.0%6.25%
11.25%
The figure shows the relationship between the frequency of quarterly forecasts provided by managers and the institutional ownership exhibited by the companies. Transient ownership increases in a linear manner as regularity of forecasts increases.
P8Catalyzing ChangeHow to abandon earnings guidance P8
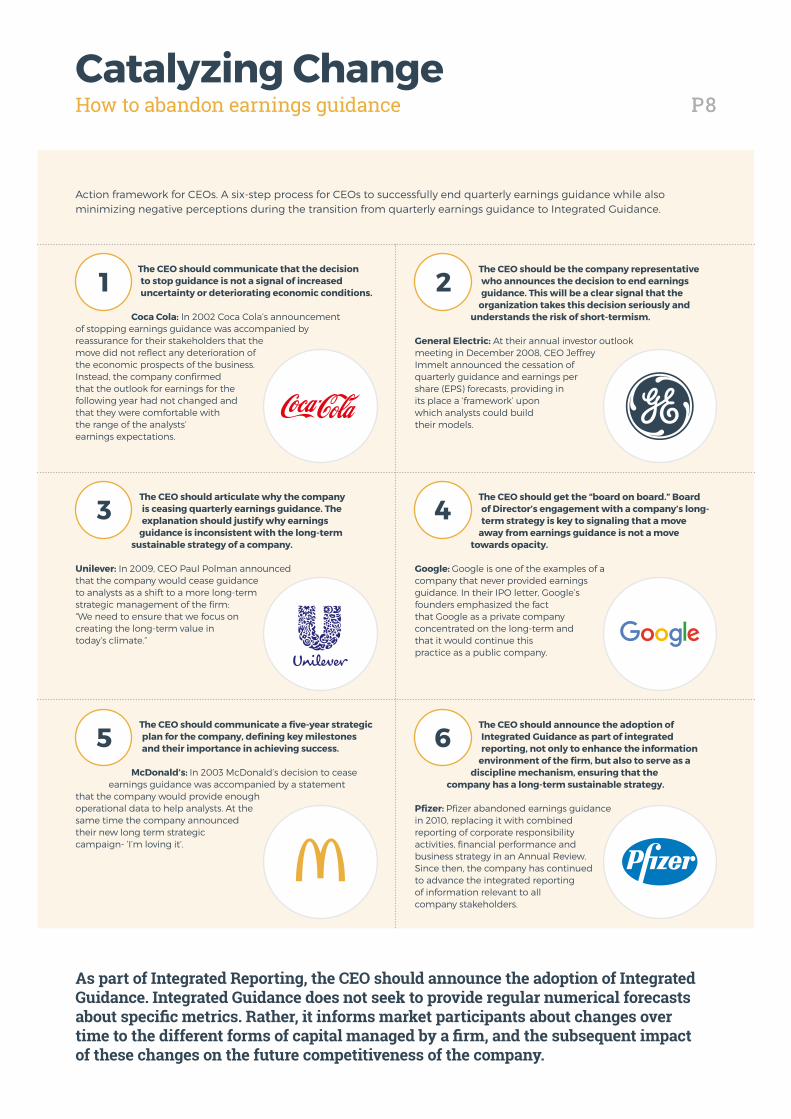
The CEO should communicate that the decision to stop guidance is not a signal of increased uncertainty or deteriorating economic conditions.
Coca Cola: In 2002 Coca Cola’s announcement of stopping earnings guidance was accompanied by reassurance for their stakeholders that the move did not reflect any deterioration of the economic prospects of the business. Instead, the company confirmed that the outlook for earnings for the following year had not changed and that they were comfortable with the range of the analysts’ earnings expectations.
The CEO should articulate why the company is ceasing quarterly earnings guidance. The explanation should justify why earnings
guidance is inconsistent with the long-term sustainable strategy of a company.
Unilever: In 2009, CEO Paul Polman announced that the company would cease guidance to analysts as a shift to a more long-term strategic management of the firm: “We need to ensure that we focus on creating the long-term value in today’s climate.”
The CEO should communicate a five-year strategic plan for the company, defining key milestones and their importance in achieving success.
McDonald’s: In 2003 McDonald’s decision to cease earnings guidance was accompanied by a statement
that the company would provide enough operational data to help analysts. At the same time the company announced their new long term strategic campaign- ‘I’m loving it’.
The CEO should announce the adoption of Integrated Guidance as part of integrated reporting, not only to enhance the information
environment of the firm, but also to serve as a discipline mechanism, ensuring that the
company has a long-term sustainable strategy.
Pfizer: Pfizer abandoned earnings guidance in 2010, replacing it with combined reporting of corporate responsibility activities, financial performance and business strategy in an Annual Review. Since then, the company has continued to advance the integrated reporting of information relevant to all company stakeholders.
The CEO should get the “board on board.” Board of Director’s engagement with a company’s long-term strategy is key to signaling that a move
away from earnings guidance is not a move towards opacity.
Google: Google is one of the examples of a company that never provided earnings guidance. In their IPO letter, Google’s founders emphasized the fact that Google as a private company concentrated on the long-term and that it would continue this practice as a public company.
The CEO should be the company representative who announces the decision to end earnings guidance. This will be a clear signal that the
organization takes this decision seriously and understands the risk of short-termism.
General Electric: At their annual investor outlook meeting in December 2008, CEO Jeffrey Immelt announced the cessation of quarterly guidance and earnings per share (EPS) forecasts, providing in its place a ‘framework’ upon which analysts could build their models.
1
3
5
2
4
6
Action framework for CEOs. A six-step process for CEOs to successfully end quarterly earnings guidance while also minimizing negative perceptions during the transition from quarterly earnings guidance to Integrated Guidance.
As part of Integrated Reporting, the CEO should announce the adoption of Integrated Guidance. Integrated Guidance does not seek to provide regular numerical forecasts about specific metrics. Rather, it informs market participants about changes over time to the different forms of capital managed by a firm, and the subsequent impact of these changes on the future competitiveness of the company.
P9Integrated GuidanceFramework
Integrated Guidance is a communications strategy that aims to support long-term investors by providing them with relevant and meaningful information. Integrated Guidance ensures that ceasing earnings guidance does not mean less information is provided to the investment community, but rather that the type of information provided is more material and reflective of the long-term strategic vision of the company. The Integrated Guidance framework has been used throughout the report to guide the research approach, the discussion around the findings and the recommendations.
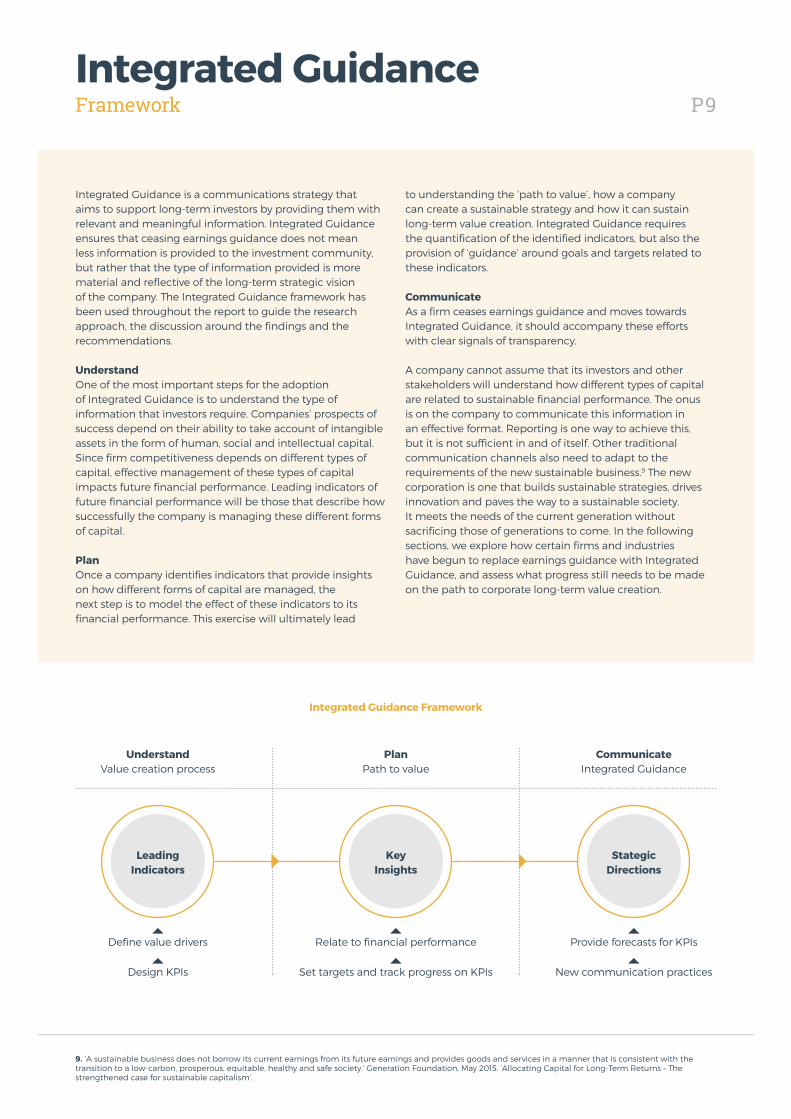
UnderstandOne of the most important steps for the adoption of Integrated Guidance is to understand the type of information that investors require. Companies’ prospects of success depend on their ability to take account of intangible assets in the form of human, social and intellectual capital. Since firm competitiveness depends on different types of capital, effective management of these types of capital impacts future financial performance. Leading indicators of future financial performance will be those that describe how successfully the company is managing these different forms of capital.
PlanOnce a company identifies indicators that provide insights on how different forms of capital are managed, the next step is to model the effect of these indicators to its financial performance. This exercise will ultimately lead
to understanding the ‘path to value’, how a company can create a sustainable strategy and how it can sustain long-term value creation. Integrated Guidance requires the quantification of the identified indicators, but also the provision of ‘guidance’ around goals and targets related to these indicators.
CommunicateAs a firm ceases earnings guidance and moves towards Integrated Guidance, it should accompany these efforts with clear signals of transparency.
A company cannot assume that its investors and other stakeholders will understand how different types of capital are related to sustainable financial performance. The onus is on the company to communicate this information in an effective format. Reporting is one way to achieve this, but it is not sufficient in and of itself. Other traditional communication channels also need to adapt to the requirements of the new sustainable business.9 The new corporation is one that builds sustainable strategies, drives innovation and paves the way to a sustainable society. It meets the needs of the current generation without sacrificing those of generations to come. In the following sections, we explore how certain firms and industries have begun to replace earnings guidance with Integrated Guidance, and assess what progress still needs to be made on the path to corporate long-term value creation.
9. ‘A sustainable business does not borrow its current earnings from its future earnings and provides goods and services in a manner that is consistent with thetransition to a low-carbon, prosperous, equitable, healthy and safe society.’ Generation Foundation, May 2015. ‘Allocating Capital for Long-Term Returns – The strengthened case for sustainable capitalism’.
Define value drivers
Design KPIs
Relate to financial performance
Set targets and track progress on KPIs
Provide forecasts for KPIs
New communication practices
Integrated Guidance Framework
UnderstandValue creation process
PlanPath to value
CommunicateIntegrated Guidance
Leading Indicators
Key Insights
Stategic Directions
P10Integrated GuidanceResearch approach
With the recent trend of moving away from quarterly earnings guidance, this report seeks to shed more light on the communication practices that different companies have adopted.
Some of the questions this report seeks to address are:
• In which leading indicators of future financial performance are investors most interested, and how are these reported?
• Does the mode of communication affect the information that is provided (published vs. quarterly earnings calls)?
• Who is initiating the conversation around the leading indicators of future financial performance (presentation section vs. Q&A)?
• What are the steps that companies need to take to move to Integrated Guidance?
The sectors examined (Healthcare, Financials, Technology & Communication, Transportation) were selected based on the availability of related standards released as a result of SASB’s materiality analysis at the time of the research.10 For each sector we randomly chose one industry (Commercial Banks, Pharmaceuticals, Software & IT, Automobiles). For each industry the top 5 companies by revenue listed or cross listed in the US were selected as the research sample. The first step was to create a research framework based on leading indicators of future financial performance that would be used to examine the communication practices of various companies.
The goal was to identify which companies were adopting elements of the Integrated Guidance framework.For the purpose of this study, financial and sustainability reports together with quarterly earnings call transcripts were analyzed in terms of the level of disclosure/discussion around the identified leading indicators. A ranking was created in each sector among the companies under investigation based on the extent of the conversation around these indicators.
For the remainder of the report:
• By reporting we mean financial and sustainability reports.
• By presentation section we mean the prepared company narrative part of the quarterly earnings call, most commonly delivered by the CEO,CFO, VP IR.
• By Q&A we mean the questions and answers session of the quarterly earnings call.
10. SASB is the Sustainability Accounting Standards Board, an independent not for profit. Its mission is to develop and disseminate sustainability accountingstandards to assist public corporations disclose material, decision-useful information to investors. SASB is engaging in a multi-stakeholder communication process to create standards for more than 80 industries in 10 sectors. www.sasb.org
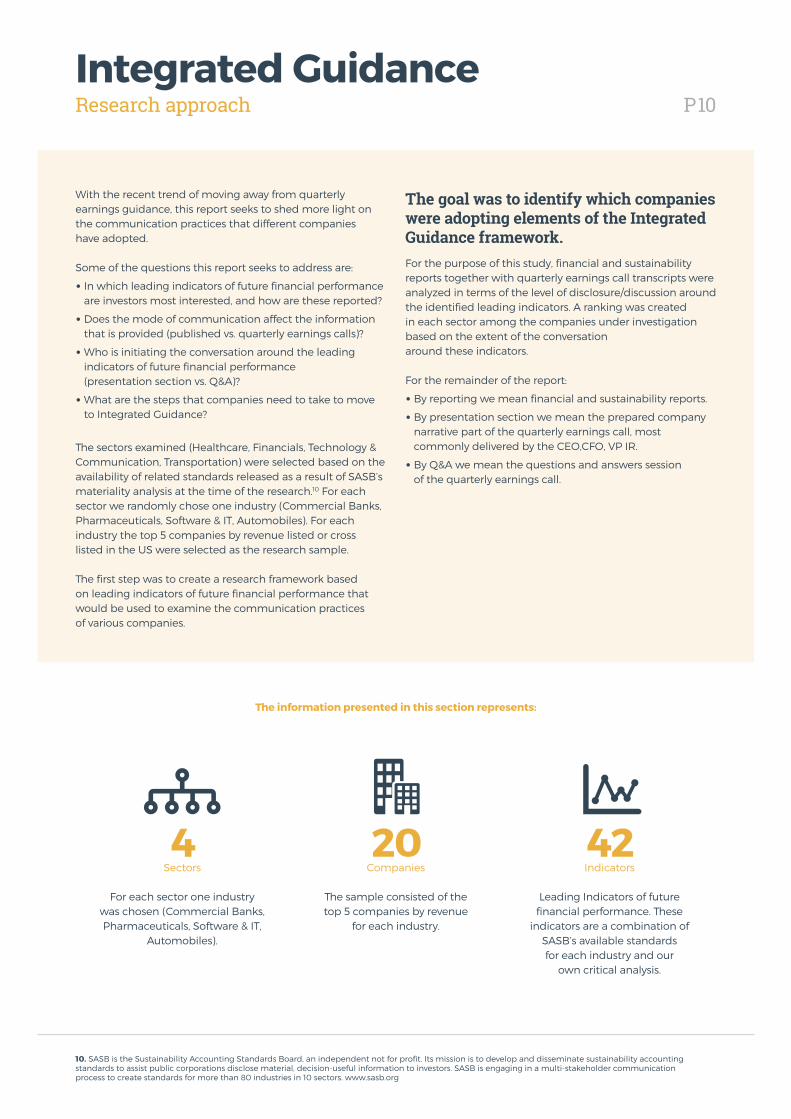
The information presented in this section represents:
4Sectors
For each sector one industry was chosen (Commercial Banks, Pharmaceuticals, Software & IT,
Automobiles).
20Companies
The sample consisted of the top 5 companies by revenue
for each industry.
42Indicators
Leading Indicators of future financial performance. These
indicators are a combination of SASB’s available standards for each industry and our
own critical analysis.
P11Integrated GuidanceKey indicators of long-term value
Firm competitiveness largely depends on the effective management of different types of capital. As an example, in the Commercial Banking Industry, the recent financial crisis and regulatory developments have highlighted how important some of these forms of capital are and the impact they can have on revenue, assets, liabilities and additional cost of capital.
As a result, companies face an increased need to focus on material capital that might otherwise not have been captured in original financial reporting. These forms of capital will impact long-term value. Investors need to be able to evaluate this information and integrate it into their decision-making process.
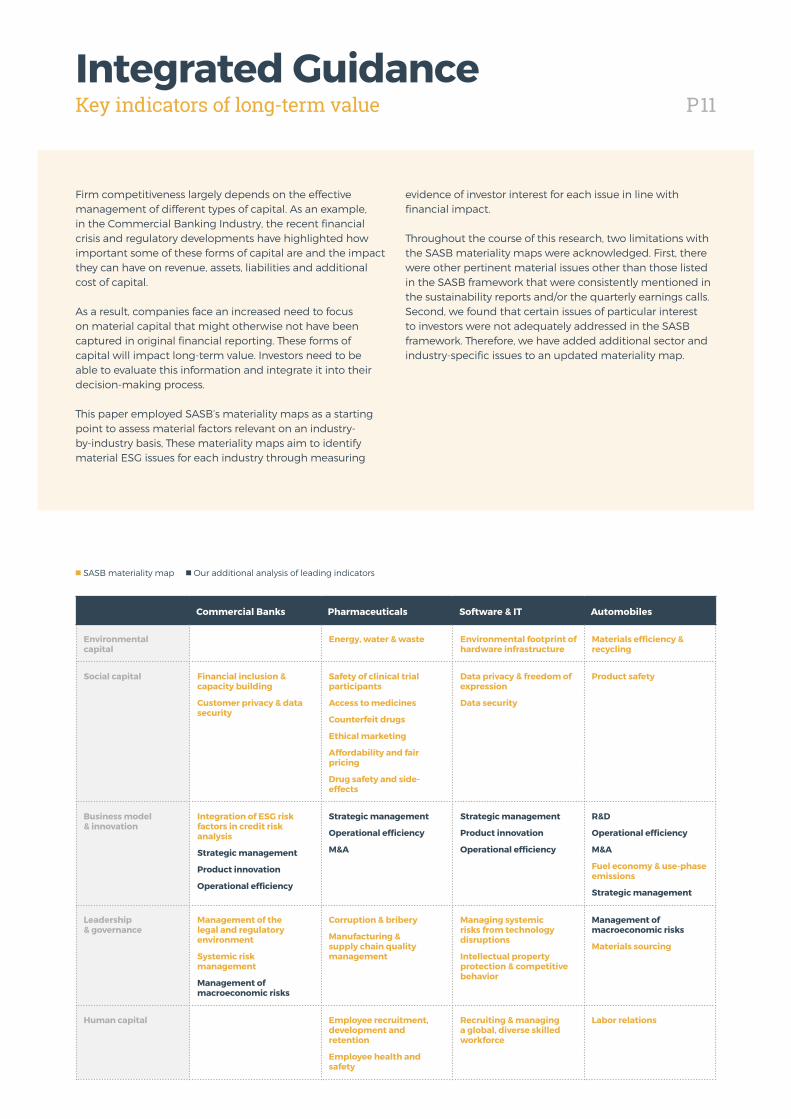
This paper employed SASB’s materiality maps as a starting point to assess material factors relevant on an industry-by-industry basis, These materiality maps aim to identify material ESG issues for each industry through measuring
evidence of investor interest for each issue in line with financial impact.
Throughout the course of this research, two limitations with the SASB materiality maps were acknowledged. First, there were other pertinent material issues other than those listed in the SASB framework that were consistently mentioned in the sustainability reports and/or the quarterly earnings calls. Second, we found that certain issues of particular interest to investors were not adequately addressed in the SASB framework. Therefore, we have added additional sector and industry-specific issues to an updated materiality map.
Commercial Banks Pharmaceuticals Software & IT Automobiles
Environmental capital
Energy, water & waste Environmental footprint of hardware infrastructure
Materials efficiency & recycling
Social capital Financial inclusion & capacity building
Customer privacy & data security
Safety of clinical trial participants
Access to medicines
Counterfeit drugs
Ethical marketing
Affordability and fair pricing
Drug safety and side-effects
Data privacy & freedom of expression
Data security
Product safety
Business model & innovation
Integration of ESG risk factors in credit risk analysis
Strategic management
Product innovation
Operational efficiency
Strategic management
Operational efficiency
M&A
Strategic management
Product innovation
Operational efficiency
R&D
Operational efficiency
M&A
Fuel economy & use-phase emissions
Strategic management
Leadership & governance
Management of the legal and regulatory environment
Systemic risk management
Management of macroeconomic risks
Corruption & bribery
Manufacturing & supply chain quality management
Managing systemic risks from technology disruptions
Intellectual property protection & competitive behavior
Management of macroeconomic risks
Materials sourcing
Human capital Employee recruitment, development and retention
Employee health and safety
Recruiting & managing a global, diverse skilled workforce
Labor relations
■ SASB materiality map ■ Our additional analysis of leading indicators
P12Sector AnalysisCommercial banks
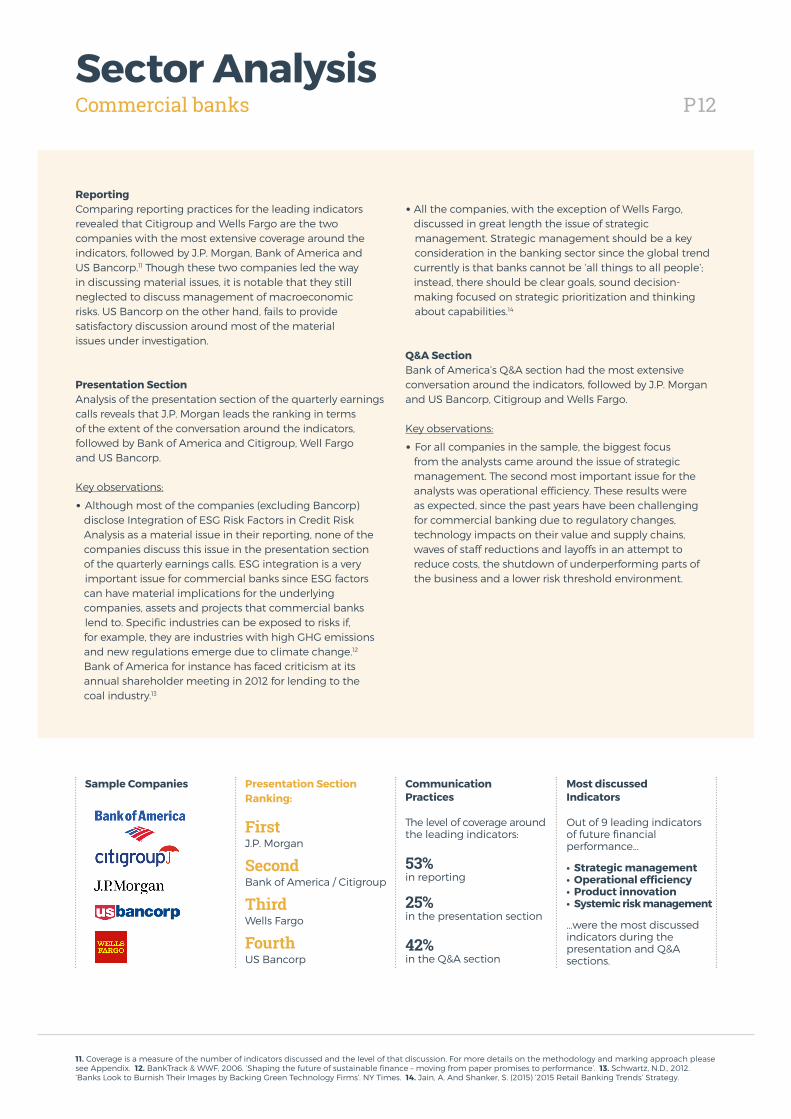
ReportingComparing reporting practices for the leading indicators revealed that Citigroup and Wells Fargo are the two companies with the most extensive coverage around the indicators, followed by J.P. Morgan, Bank of America and US Bancorp.11 Though these two companies led the way in discussing material issues, it is notable that they still neglected to discuss management of macroeconomic risks. US Bancorp on the other hand, fails to provide satisfactory discussion around most of the material issues under investigation.
Presentation SectionAnalysis of the presentation section of the quarterly earnings calls reveals that J.P. Morgan leads the ranking in terms of the extent of the conversation around the indicators, followed by Bank of America and Citigroup, Well Fargo and US Bancorp.
Key observations:
• Although most of the companies (excluding Bancorp) disclose Integration of ESG Risk Factors in Credit Risk Analysis as a material issue in their reporting, none of the companies discuss this issue in the presentation section of the quarterly earnings calls. ESG integration is a very important issue for commercial banks since ESG factors can have material implications for the underlying companies, assets and projects that commercial banks lend to. Specific industries can be exposed to risks if, for example, they are industries with high GHG emissions and new regulations emerge due to climate change.12 Bank of America for instance has faced criticism at its annual shareholder meeting in 2012 for lending to the coal industry.13
• All the companies, with the exception of Wells Fargo, discussed in great length the issue of strategic management. Strategic management should be a key consideration in the banking sector since the global trend currently is that banks cannot be ‘all things to all people’; instead, there should be clear goals, sound decision- making focused on strategic prioritization and thinking about capabilities.14
Q&A SectionBank of America’s Q&A section had the most extensive conversation around the indicators, followed by J.P. Morgan and US Bancorp, Citigroup and Wells Fargo. Key observations:
• For all companies in the sample, the biggest focus from the analysts came around the issue of strategic management. The second most important issue for the analysts was operational efficiency. These results were as expected, since the past years have been challenging for commercial banking due to regulatory changes, technology impacts on their value and supply chains, waves of staff reductions and layoffs in an attempt to reduce costs, the shutdown of underperforming parts of the business and a lower risk threshold environment.
11. Coverage is a measure of the number of indicators discussed and the level of that discussion. For more details on the methodology and marking approach please see Appendix. 12. BankTrack & WWF, 2006. ‘Shaping the future of sustainable finance – moving from paper promises to performance’. 13. Schwartz, N.D., 2012. ‘Banks Look to Burnish Their Images by Backing Green Technology Firms’. NY Times. 14. Jain, A. And Shanker, S. (2015) ‘2015 Retail Banking Trends’ Strategy.
CommunicationPractices
Presentation Section Ranking:
Most discussedIndicators
Sample Companies
The level of coverage around the leading indicators:
53% in reporting
25% in the presentation section
42% in the Q&A section
First J.P. Morgan
SecondBank of America / Citigroup
ThirdWells Fargo
FourthUS Bancorp
Out of 9 leading indicators of future financial performance...
• Strategic management • Operational efficiency • Product innovation • Systemic risk management
...were the most discussed indicators during the presentation and Q&A sections.
P13Sector AnalysisPharmaceuticals
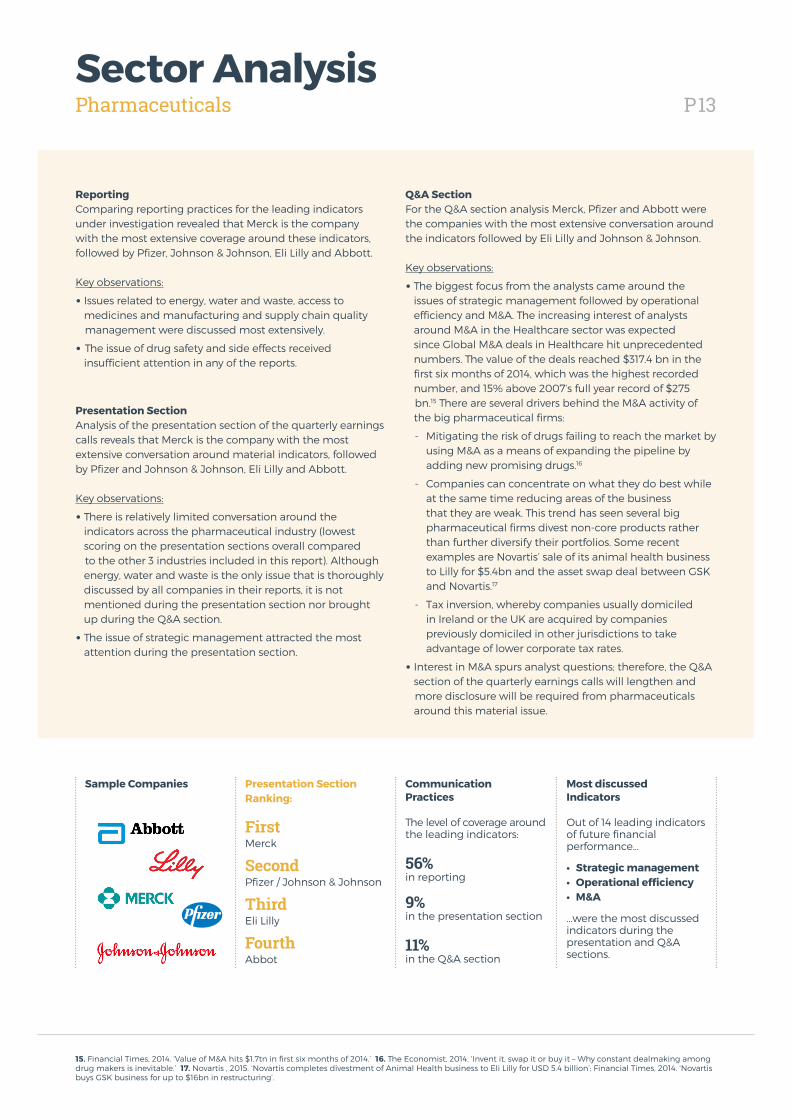
ReportingComparing reporting practices for the leading indicators under investigation revealed that Merck is the company with the most extensive coverage around these indicators, followed by Pfizer, Johnson & Johnson, Eli Lilly and Abbott.
Key observations:
• Issues related to energy, water and waste, access to medicines and manufacturing and supply chain quality management were discussed most extensively.
• The issue of drug safety and side effects received insufficient attention in any of the reports.
Presentation SectionAnalysis of the presentation section of the quarterly earnings calls reveals that Merck is the company with the most extensive conversation around material indicators, followed by Pfizer and Johnson & Johnson, Eli Lilly and Abbott.
Key observations:
• There is relatively limited conversation around the indicators across the pharmaceutical industry (lowest scoring on the presentation sections overall compared to the other 3 industries included in this report). Although energy, water and waste is the only issue that is thoroughly discussed by all companies in their reports, it is not mentioned during the presentation section nor brought up during the Q&A section.
• The issue of strategic management attracted the most attention during the presentation section.
Q&A SectionFor the Q&A section analysis Merck, Pfizer and Abbott were the companies with the most extensive conversation around the indicators followed by Eli Lilly and Johnson & Johnson.
Key observations:
• The biggest focus from the analysts came around the issues of strategic management followed by operational efficiency and M&A. The increasing interest of analysts around M&A in the Healthcare sector was expected since Global M&A deals in Healthcare hit unprecedented numbers. The value of the deals reached $317.4 bn in the first six months of 2014, which was the highest recorded number, and 15% above 2007’s full year record of $275 bn.15 There are several drivers behind the M&A activity of the big pharmaceutical firms:
- Mitigating the risk of drugs failing to reach the market by using M&A as a means of expanding the pipeline by adding new promising drugs.16
- Companies can concentrate on what they do best while at the same time reducing areas of the business that they are weak. This trend has seen several big pharmaceutical firms divest non-core products rather than further diversify their portfolios. Some recent examples are Novartis’ sale of its animal health business to Lilly for $5.4bn and the asset swap deal between GSK and Novartis.17
- Tax inversion, whereby companies usually domiciled in Ireland or the UK are acquired by companies previously domiciled in other jurisdictions to take advantage of lower corporate tax rates.
• Interest in M&A spurs analyst questions; therefore, the Q&A section of the quarterly earnings calls will lengthen and more disclosure will be required from pharmaceuticals around this material issue.
15. Financial Times, 2014. ‘Value of M&A hits $1.7tn in first six months of 2014.’ 16. The Economist, 2014. ‘Invent it, swap it or buy it – Why constant dealmaking among drug makers is inevitable.’ 17. Novartis , 2015. ‘Novartis completes divestment of Animal Health business to Eli Lilly for USD 5.4 billion’; Financial Times, 2014. ‘Novartis buys GSK business for up to $16bn in restructuring’.
The level of coverage around the leading indicators:
56% in reporting
9% in the presentation section
11% in the Q&A section
First Merck
SecondPfizer / Johnson & Johnson
ThirdEli Lilly
FourthAbbot
Out of 14 leading indicators of future financial performance...
• Strategic management • Operational efficiency • M&A
...were the most discussed indicators during the presentation and Q&A sections.
CommunicationPractices
Presentation Section Ranking:
Most discussedIndicators
Sample Companies
P14Sector AnalysisSoftware and IT
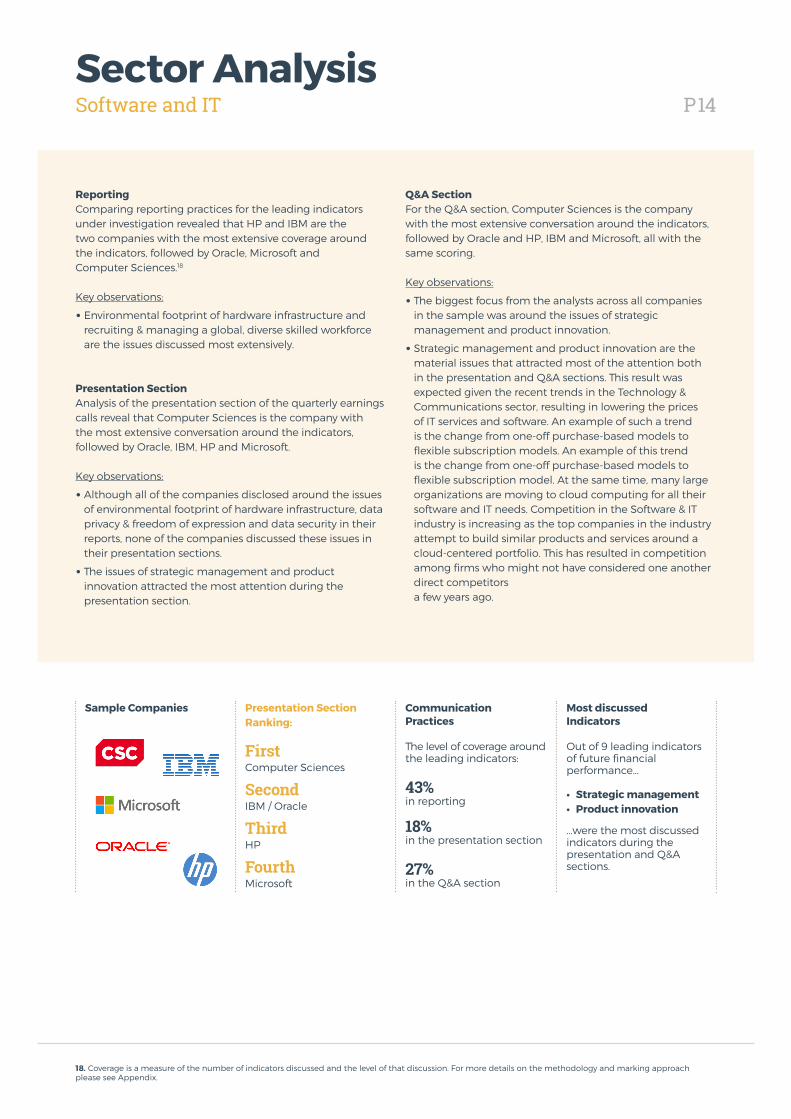
ReportingComparing reporting practices for the leading indicators under investigation revealed that HP and IBM are the two companies with the most extensive coverage around the indicators, followed by Oracle, Microsoft and Computer Sciences.18
Key observations:
• Environmental footprint of hardware infrastructure and recruiting & managing a global, diverse skilled workforce are the issues discussed most extensively.
Presentation SectionAnalysis of the presentation section of the quarterly earnings calls reveal that Computer Sciences is the company with the most extensive conversation around the indicators, followed by Oracle, IBM, HP and Microsoft.
Key observations:
• Although all of the companies disclosed around the issues of environmental footprint of hardware infrastructure, data privacy & freedom of expression and data security in their reports, none of the companies discussed these issues in their presentation sections.
• The issues of strategic management and product innovation attracted the most attention during the presentation section.
Q&A SectionFor the Q&A section, Computer Sciences is the company with the most extensive conversation around the indicators, followed by Oracle and HP, IBM and Microsoft, all with the same scoring.
Key observations:
• The biggest focus from the analysts across all companies in the sample was around the issues of strategic management and product innovation.
• Strategic management and product innovation are the material issues that attracted most of the attention both in the presentation and Q&A sections. This result was expected given the recent trends in the Technology & Communications sector, resulting in lowering the prices of IT services and software. An example of such a trend is the change from one-off purchase-based models to flexible subscription models. An example of this trend is the change from one-off purchase-based models to flexible subscription model. At the same time, many large organizations are moving to cloud computing for all their software and IT needs. Competition in the Software & IT industry is increasing as the top companies in the industry attempt to build similar products and services around a cloud-centered portfolio. This has resulted in competition among firms who might not have considered one another direct competitors a few years ago.
18. Coverage is a measure of the number of indicators discussed and the level of that discussion. For more details on the methodology and marking approach please see Appendix.
The level of coverage around the leading indicators:
43% in reporting
18% in the presentation section
27% in the Q&A section
First Computer Sciences
SecondIBM / Oracle
ThirdHP
FourthMicrosoft
Out of 9 leading indicators of future financial performance...
• Strategic management • Product innovation
...were the most discussed indicators during the presentation and Q&A sections.
CommunicationPractices
Presentation Section Ranking:
Most discussedIndicators
Sample Companies
P15Sector AnalysisAutomobiles
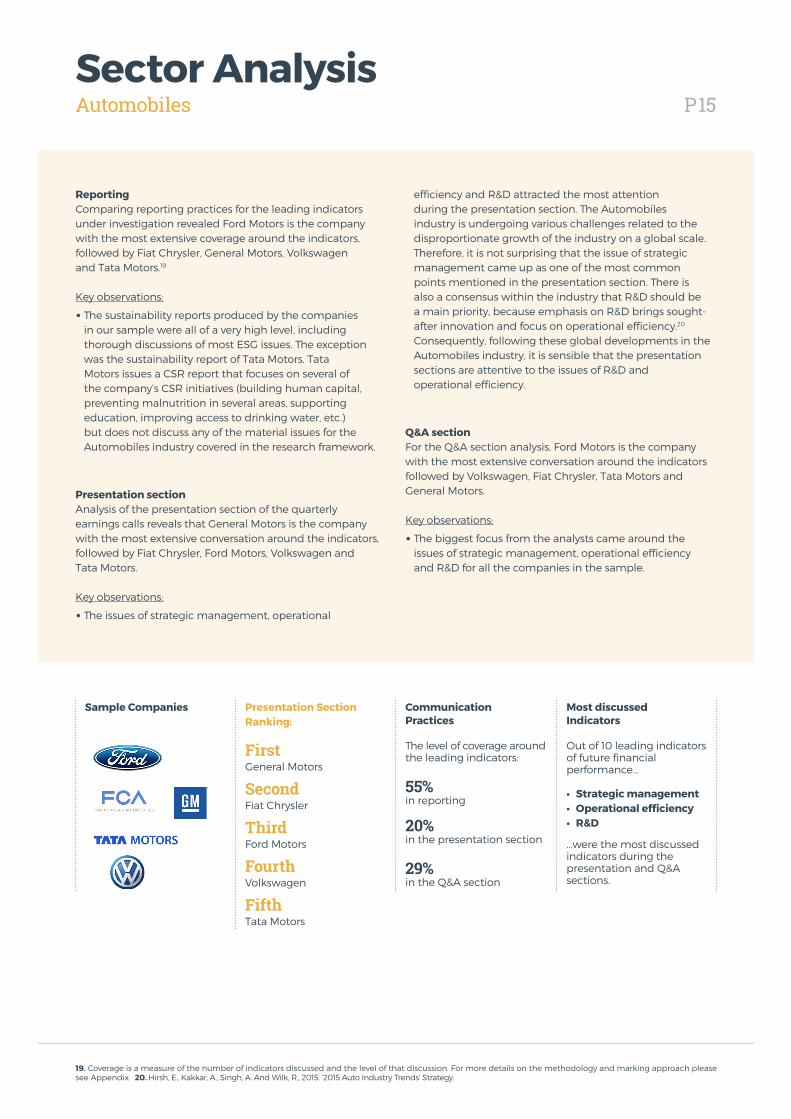
ReportingComparing reporting practices for the leading indicators under investigation revealed Ford Motors is the company with the most extensive coverage around the indicators, followed by Fiat Chrysler, General Motors, Volkswagen and Tata Motors.19
Key observations:
• The sustainability reports produced by the companies in our sample were all of a very high level, including thorough discussions of most ESG issues. The exception was the sustainability report of Tata Motors. Tata Motors issues a CSR report that focuses on several of the company’s CSR initiatives (building human capital, preventing malnutrition in several areas, supporting education, improving access to drinking water, etc.) but does not discuss any of the material issues for the Automobiles industry covered in the research framework.
Presentation sectionAnalysis of the presentation section of the quarterly earnings calls reveals that General Motors is the company with the most extensive conversation around the indicators, followed by Fiat Chrysler, Ford Motors, Volkswagen and Tata Motors. Key observations:
• The issues of strategic management, operational
efficiency and R&D attracted the most attention during the presentation section. The Automobiles industry is undergoing various challenges related to the disproportionate growth of the industry on a global scale. Therefore, it is not surprising that the issue of strategic management came up as one of the most common points mentioned in the presentation section. There is also a consensus within the industry that R&D should be a main priority, because emphasis on R&D brings sought-after innovation and focus on operational efficiency.20
Consequently, following these global developments in the Automobiles industry, it is sensible that the presentation sections are attentive to the issues of R&D and operational efficiency.
Q&A sectionFor the Q&A section analysis, Ford Motors is the company with the most extensive conversation around the indicators followed by Volkswagen, Fiat Chrysler, Tata Motors and General Motors.
Key observations:
• The biggest focus from the analysts came around the issues of strategic management, operational efficiency and R&D for all the companies in the sample.
19. Coverage is a measure of the number of indicators discussed and the level of that discussion. For more details on the methodology and marking approach please see Appendix. 20. Hirsh, E., Kakkar, A., Singh, A. And Wilk, R., 2015. ‘2015 Auto Industry Trends’ Strategy.
The level of coverage around the leading indicators:
55% in reporting
20% in the presentation section
29% in the Q&A section
First General Motors
SecondFiat Chrysler
ThirdFord Motors
FourthVolkswagen
FifthTata Motors
Out of 10 leading indicators of future financial performance...
• Strategic management • Operational efficiency • R&D
...were the most discussed indicators during the presentation and Q&A sections.
CommunicationPractices
Presentation Section Ranking:
Most discussedIndicators
Sample Companies
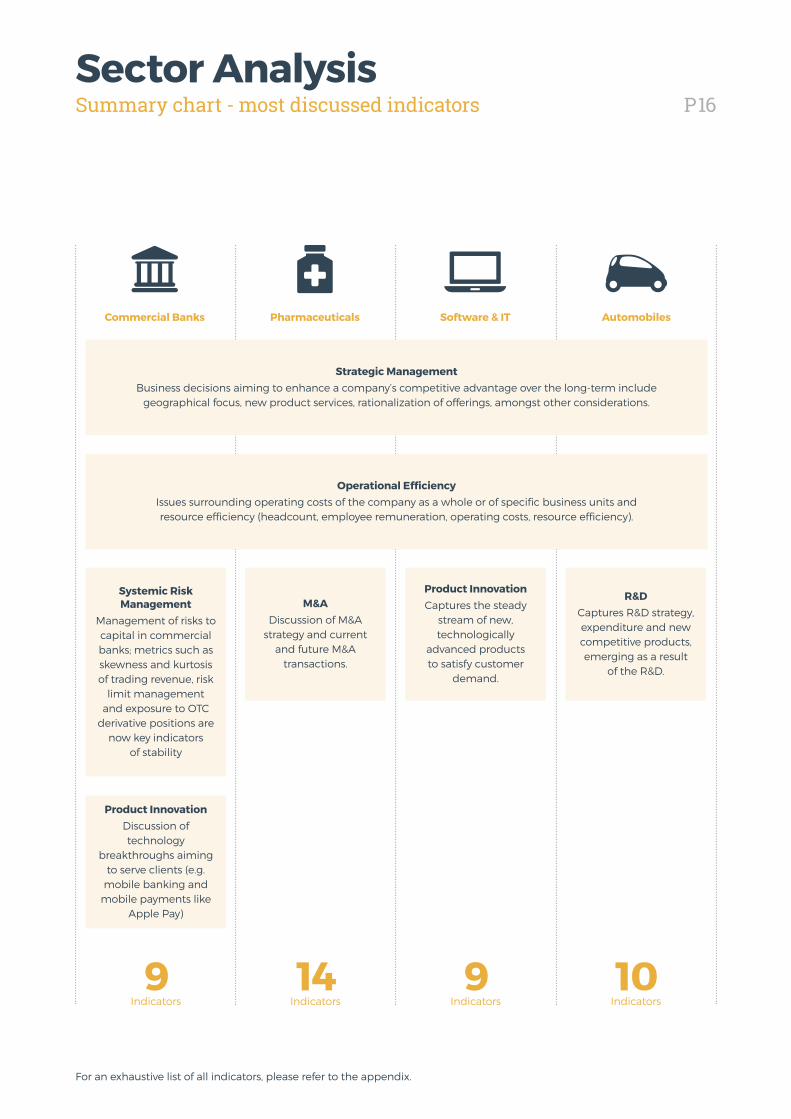
P16Sector AnalysisSummary chart - most discussed indicators
For an exhaustive list of all indicators, please refer to the appendix.
9Indicators
14Indicators
9Indicators
10Indicators
Strategic ManagementBusiness decisions aiming to enhance a company’s competitive advantage over the long-term include
geographical focus, new product services, rationalization of offerings, amongst other considerations.
Operational EfficiencyIssues surrounding operating costs of the company as a whole or of specific business units and resource efficiency (headcount, employee remuneration, operating costs, resource efficiency).
R&DCaptures R&D strategy, expenditure and new competitive products, emerging as a result
of the R&D.
Product InnovationCaptures the steady
stream of new, technologically
advanced products to satisfy customer
demand.
M&ADiscussion of M&A
strategy and current and future M&A
transactions.
Product InnovationDiscussion of technology
breakthroughs aiming to serve clients (e.g.
mobile banking and mobile payments like
Apple Pay)
Systemic Risk Management
Management of risks to capital in commercial banks; metrics such as skewness and kurtosis of trading revenue, risk
limit management and exposure to OTC
derivative positions are now key indicators
of stability
Software & ITCommercial Banks AutomobilesPharmaceuticals
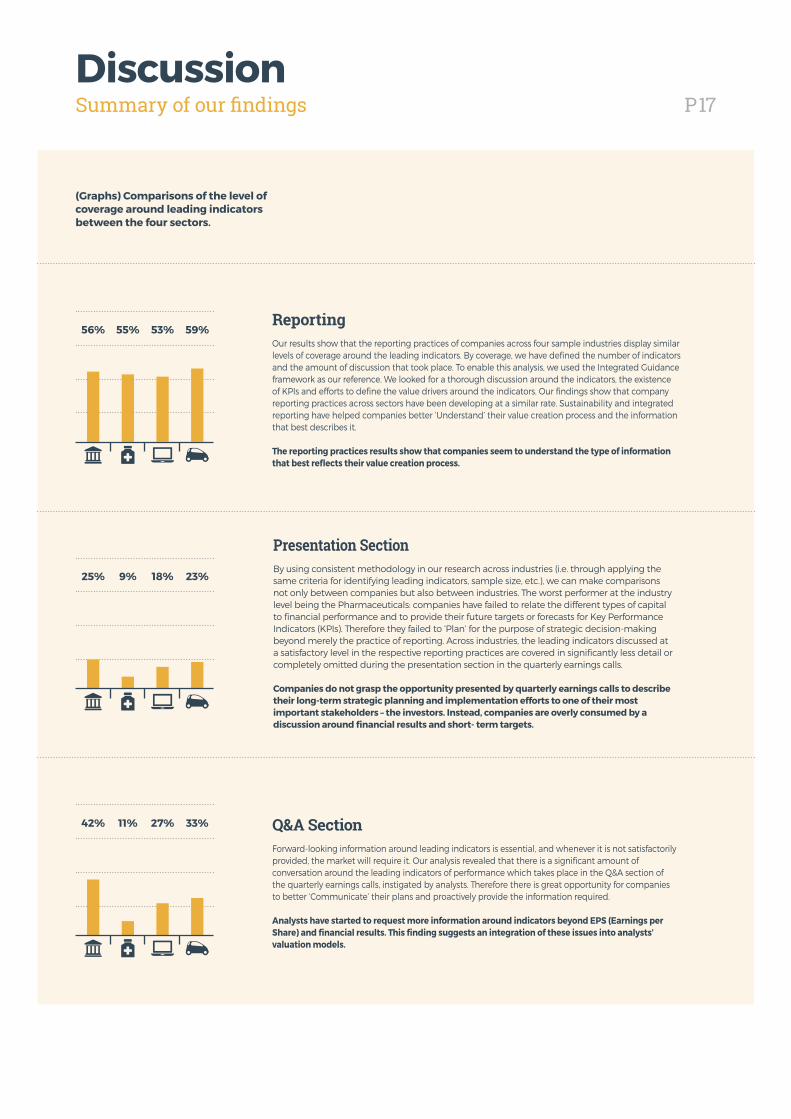
P17DiscussionSummary of our findings
ReportingOur results show that the reporting practices of companies across four sample industries display similar levels of coverage around the leading indicators. By coverage, we have defined the number of indicators and the amount of discussion that took place. To enable this analysis, we used the Integrated Guidance framework as our reference. We looked for a thorough discussion around the indicators, the existence of KPIs and efforts to define the value drivers around the indicators. Our findings show that company reporting practices across sectors have been developing at a similar rate. Sustainability and integrated reporting have helped companies better ‘Understand’ their value creation process and the information that best describes it.
The reporting practices results show that companies seem to understand the type of information that best reflects their value creation process.
Presentation SectionBy using consistent methodology in our research across industries (i.e. through applying the same criteria for identifying leading indicators, sample size, etc.), we can make comparisons not only between companies but also between industries. The worst performer at the industry level being the Pharmaceuticals: companies have failed to relate the different types of capital to financial performance and to provide their future targets or forecasts for Key Performance Indicators (KPIs). Therefore they failed to ‘Plan’ for the purpose of strategic decision-making beyond merely the practice of reporting. Across industries, the leading indicators discussed at a satisfactory level in the respective reporting practices are covered in significantly less detail or completely omitted during the presentation section in the quarterly earnings calls.
Companies do not grasp the opportunity presented by quarterly earnings calls to describe their long-term strategic planning and implementation efforts to one of their most important stakeholders – the investors. Instead, companies are overly consumed by a discussion around financial results and short- term targets.
Q&A SectionForward-looking information around leading indicators is essential, and whenever it is not satisfactorily provided, the market will require it. Our analysis revealed that there is a significant amount of conversation around the leading indicators of performance which takes place in the Q&A section of the quarterly earnings calls, instigated by analysts. Therefore there is great opportunity for companies to better ‘Communicate’ their plans and proactively provide the information required.
Analysts have started to request more information around indicators beyond EPS (Earnings per Share) and financial results. This finding suggests an integration of these issues into analysts’ valuation models.
59%53%55%56%
23%18%9%25%
33%27%11%42%
(Graphs) Comparisons of the level of coverage around leading indicators between the four sectors.
P18DiscussionTop analysts are initiating conversations on leading indicators
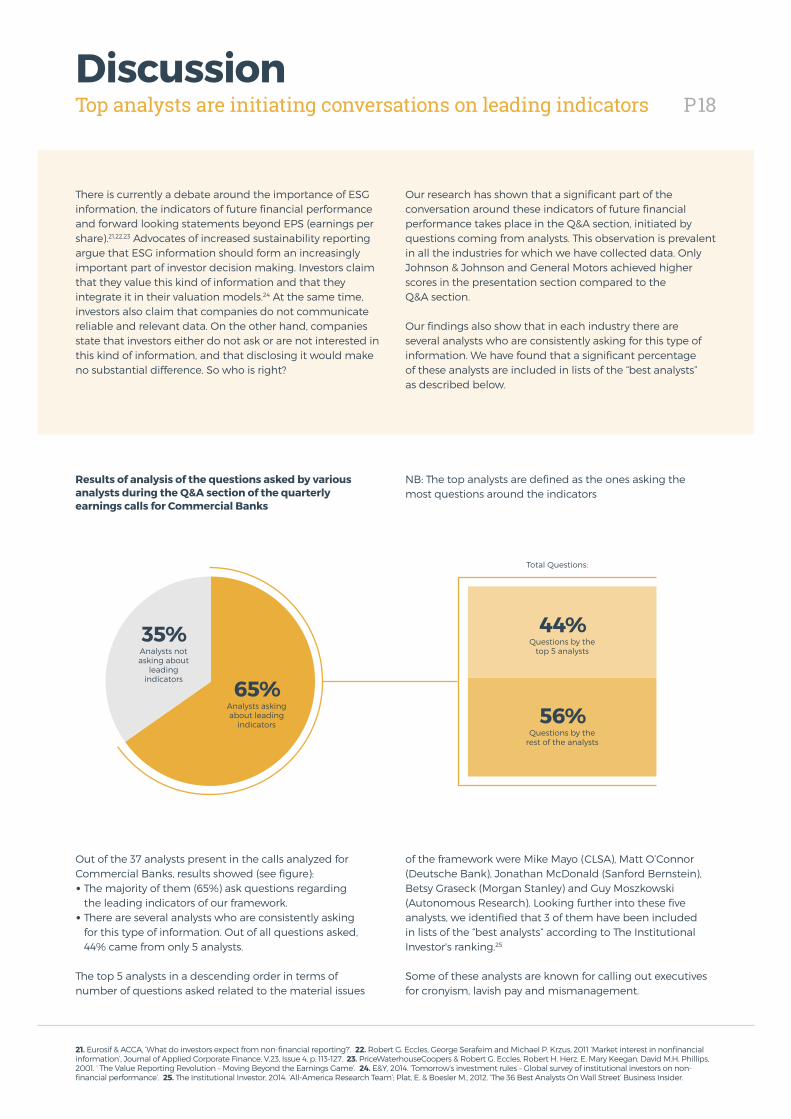
There is currently a debate around the importance of ESG information, the indicators of future financial performance and forward looking statements beyond EPS (earnings per share).21,22,23 Advocates of increased sustainability reporting argue that ESG information should form an increasingly important part of investor decision making. Investors claim that they value this kind of information and that they integrate it in their valuation models.24 At the same time, investors also claim that companies do not communicate reliable and relevant data. On the other hand, companies state that investors either do not ask or are not interested in this kind of information, and that disclosing it would make no substantial difference. So who is right?
Results of analysis of the questions asked by various analysts during the Q&A section of the quarterly earnings calls for Commercial Banks
NB: The top analysts are defined as the ones asking the most questions around the indicators
Out of the 37 analysts present in the calls analyzed for Commercial Banks, results showed (see figure):• The majority of them (65%) ask questions regarding
the leading indicators of our framework.• There are several analysts who are consistently asking
for this type of information. Out of all questions asked, 44% came from only 5 analysts.
The top 5 analysts in a descending order in terms of number of questions asked related to the material issues
of the framework were Mike Mayo (CLSA), Matt O’Connor (Deutsche Bank), Jonathan McDonald (Sanford Bernstein), Betsy Graseck (Morgan Stanley) and Guy Moszkowski (Autonomous Research). Looking further into these five analysts, we identified that 3 of them have been included in lists of the “best analysts” according to The Institutional Investor's ranking.25
Some of these analysts are known for calling out executives for cronyism, lavish pay and mismanagement.
Our research has shown that a significant part of the conversation around these indicators of future financial performance takes place in the Q&A section, initiated by questions coming from analysts. This observation is prevalent in all the industries for which we have collected data. Only Johnson & Johnson and General Motors achieved higher scores in the presentation section compared to the Q&A section.
Our findings also show that in each industry there are several analysts who are consistently asking for this type of information. We have found that a significant percentage of these analysts are included in lists of the “best analysts” as described below.
21. Eurosif & ACCA, ‘What do investors expect from non-financial reporting?’. 22. Robert G. Eccles, George Serafeim and Michael P. Krzus, 2011 ‘Market interest in nonfinancial information’, Journal of Applied Corporate Finance, V.23, Issue 4, p. 113-127. 23. PriceWaterhouseCoopers & Robert G. Eccles, Robert H. Herz, E. Mary Keegan, David M.H. Phillips, 2001. ‘ The Value Reporting Revolution – Moving Beyond the Earnings Game’. 24. E&Y, 2014. ‘Tomorrow’s investment rules – Global survey of institutional investors on non-financial performance’. 25. The Institutional Investor, 2014. ‘All-America Research Team’; Plat, E. & Boesler M., 2012. ‘The 36 Best Analysts On Wall Street’ Business Insider.
Total Questions:
44%Questions by the
top 5 analysts
56%Questions by the
rest of the analysts
65%Analysts asking about leading
indicators
35%Analysts not asking about
leading indicators
P19What's Next?Key conclusions
The impact of ESG indicators on the financial performance of a company has been extensively researched and documented*. Companies that successfully integrate ESG considerations in their business strategy gain significant economic, accounting, reputational and market advantages. For example, research has shown that companies that adopted corporate policies related to environmental and social issues before the adoption of such policies became widespread, outperformed their peers over the long-term, both in terms of stock market and accounting performance.26 Furthermore, these companies are significantly more likely to attract dedicated long-term investors rather than transient investors.
This paper analyses both the presentation section and the Q&A section of the quarterly earnings calls across select companies in certain industries. The purpose of this analysis was twofold: first, to understand to what degree these indicators are being mentioned during the calls; and second, to identify who is initiating the discussion around these indicators. During these calls, company management is presented with a rare opportunity to communicate value-relevant information. At the same time, the investment community can uses these calls to ask questions that are of importance to their valuation models.
Given the importance of the leading indicators to the overall performance of a company one would expect that these indicators would be standardized for disclosure across all corporate reports and extensively mentioned during the quarterly earnings calls of every company. However as evidenced by our research, this is not the case.
There were two key findings from our research:
1. Material issues identified by companies in their respective reports are either not mentioned – or are given far less priority—during the company presentation section of quarterly earnings calls. This finding was expected since companies are still trying to understand how to best integrate ESG issues in their corporate strategies.
2. However, though companies are not presenting on these material issues, analysts are driving the conversation around these leading indicators during the Q&A sections of these calls. This result was unexpected and sheds light on the role of analysts as the primary instigator driving discussion around long-term issues.
Companies spend significant resources building sustainability reports and highlighting the importance of issues around different types of capital (e.g. environmental, human, social capital) and governance practices for their strategy. They might also spend significantresources in projects and initiatives aiming to address these issues. Yet they do not grasp the opportunity to describe these efforts to one of their most important stakeholders -- their investors. Companies also face difficulties in linking these types of capital to financial performance, though evidence of this link prevails.
A comparison of reporting scores with company statement scores reveals that discussion around these indicators is much more thorough in reports. One might argue that the report provides more room for companies to expand on these issues compared to a quarterly earnings call. However, comparing across companies shows that certain companies fare better than others in terms of the consistency of information communicated through their two communication channels. Integration is possible, and companies who pursue it reduce information asymmetry with investors. A high deviation between information disclosed as material in the sustainability reports and information discussed in the presentation section could imply a lack of clear integration of these material issues in the strategy of the firm.
* See “New Research.” Generation Foundation. May 2015. Allocating Capital for Long-Term Returns – The strengthened case for sustainable capitalism. 26. Eccles, R., Ioannou I., and Serafeim G. 2014. The Impact of Corporate Sustainability on Organizational Processes and Performance. Management Science 60, no. 11: 2835–2857.
P20What's Next?Recommendations
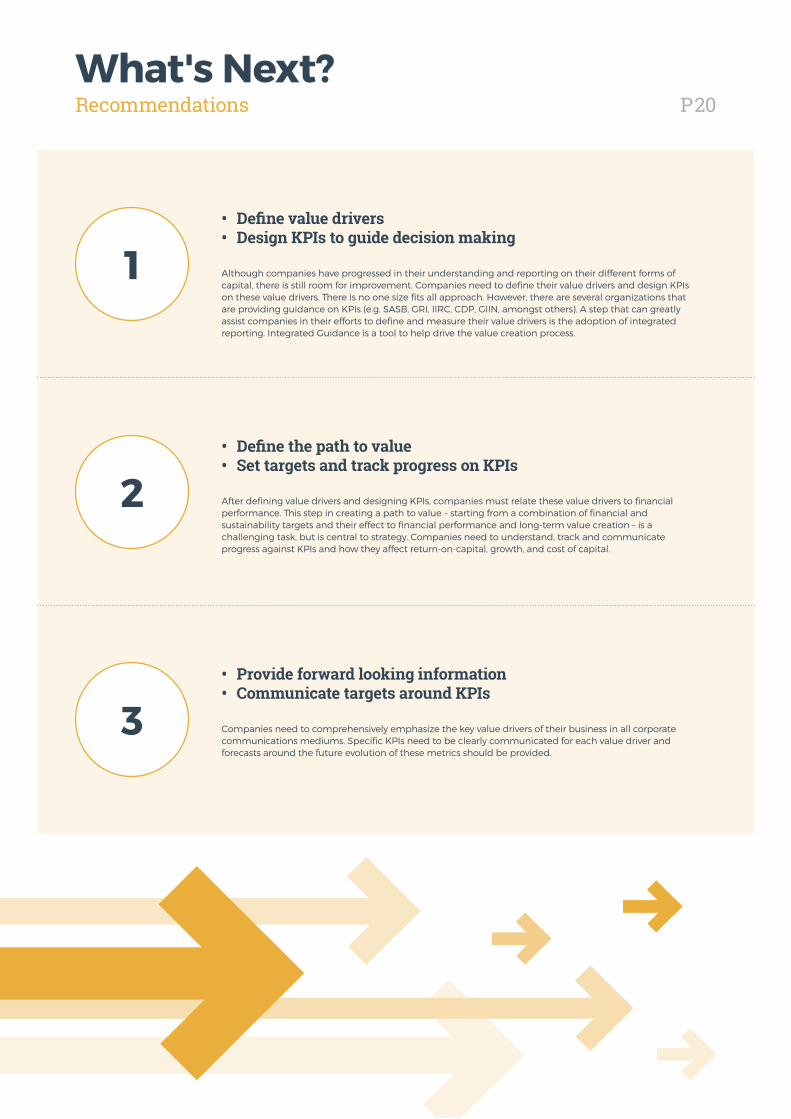
• Define value drivers • Design KPIs to guide decision making
Although companies have progressed in their understanding and reporting on their different forms of capital, there is still room for improvement. Companies need to define their value drivers and design KPIs on these value drivers. There is no one size fits all approach. However, there are several organizations that are providing guidance on KPIs (e.g. SASB, GRI, IIRC, CDP, GIIN, amongst others). A step that can greatly assist companies in their efforts to define and measure their value drivers is the adoption of integrated reporting. Integrated Guidance is a tool to help drive the value creation process.
• Define the path to value • Set targets and track progress on KPIs
After defining value drivers and designing KPIs, companies must relate these value drivers to financial performance. This step in creating a path to value – starting from a combination of financial and sustainability targets and their effect to financial performance and long-term value creation – is a challenging task, but is central to strategy. Companies need to understand, track and communicate progress against KPIs and how they affect return-on-capital, growth, and cost of capital.
• Provide forward looking information • Communicate targets around KPIs
Companies need to comprehensively emphasize the key value drivers of their business in all corporate communications mediums. Specific KPIs need to be clearly communicated for each value driver and forecasts around the future evolution of these metrics should be provided.
1
2
3
P21AppendixFull list of key indicators
The Appendix provides the complete list of all the indicators used for the data collection process for each industry. SASB’s classification was used for the different forms of capital under which the indicators were grouped. The Appendix tables include a brief description and the potential impact of each indicator for the industry under consideration.
Commercial banks 20
Pharmaceuticals 22
Software & IT 25
Automobiles 28
P21
P22AppendixCommercial banks
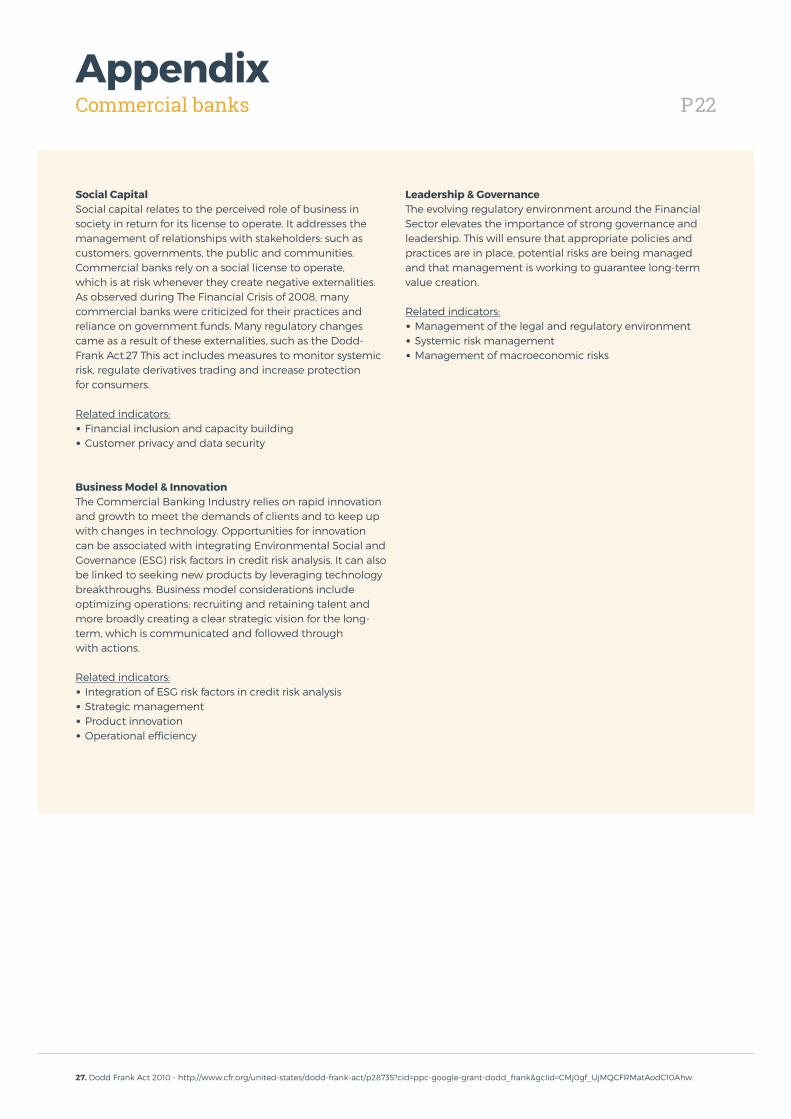
Social CapitalSocial capital relates to the perceived role of business in society in return for its license to operate. It addresses the management of relationships with stakeholders: such as customers, governments, the public and communities. Commercial banks rely on a social license to operate, which is at risk whenever they create negative externalities. As observed during The Financial Crisis of 2008, many commercial banks were criticized for their practices and reliance on government funds. Many regulatory changes came as a result of these externalities, such as the Dodd-Frank Act.27 This act includes measures to monitor systemic risk, regulate derivatives trading and increase protection for consumers.
Related indicators:• Financial inclusion and capacity building • Customer privacy and data security
Business Model & InnovationThe Commercial Banking Industry relies on rapid innovation and growth to meet the demands of clients and to keep up with changes in technology. Opportunities for innovation can be associated with integrating Environmental Social and Governance (ESG) risk factors in credit risk analysis. It can also be linked to seeking new products by leveraging technology breakthroughs. Business model considerations include optimizing operations; recruiting and retaining talent and more broadly creating a clear strategic vision for the long-term, which is communicated and followed through with actions.
Related indicators:• Integration of ESG risk factors in credit risk analysis• Strategic management • Product innovation• Operational efficiency
Leadership & GovernanceThe evolving regulatory environment around the Financial Sector elevates the importance of strong governance and leadership. This will ensure that appropriate policies and practices are in place, potential risks are being managed and that management is working to guarantee long-term value creation.
Related indicators:• Management of the legal and regulatory environment• Systemic risk management• Management of macroeconomic risks
27. Dodd Frank Act 2010 - http://www.cfr.org/united-states/dodd-frank-act/p28735?cid=ppc-google-grant-dodd_frank&gclid=CMj0gf_UjMQCFRMatAodC10Ahw.
P23AppendixCommercial banks
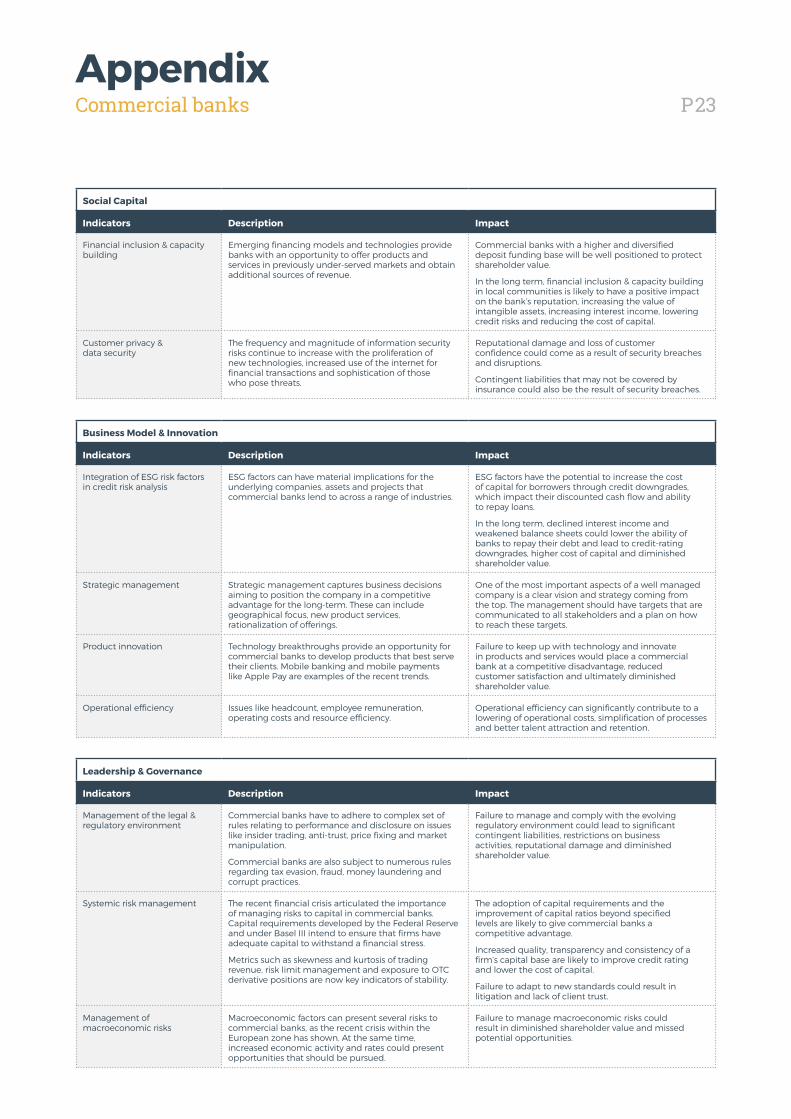
Social Capital
Indicators Description Impact
Financial inclusion & capacity building
Emerging financing models and technologies provide banks with an opportunity to offer products and services in previously under-served markets and obtain additional sources of revenue.
Commercial banks with a higher and diversified deposit funding base will be well positioned to protect shareholder value.
In the long term, financial inclusion & capacity building in local communities is likely to have a positive impact on the bank’s reputation, increasing the value of intangible assets, increasing interest income, lowering credit risks and reducing the cost of capital.
Customer privacy & data security
The frequency and magnitude of information security risks continue to increase with the proliferation of new technologies, increased use of the internet for financial transactions and sophistication of those who pose threats.
Reputational damage and loss of customer confidence could come as a result of security breaches and disruptions.
Contingent liabilities that may not be covered by insurance could also be the result of security breaches.
Business Model & Innovation
Indicators Description Impact
Integration of ESG risk factors in credit risk analysis
ESG factors can have material implications for the underlying companies, assets and projects that commercial banks lend to across a range of industries.
ESG factors have the potential to increase the cost of capital for borrowers through credit downgrades, which impact their discounted cash flow and ability to repay loans.
In the long term, declined interest income and weakened balance sheets could lower the ability of banks to repay their debt and lead to credit-rating downgrades, higher cost of capital and diminished shareholder value.
Strategic management Strategic management captures business decisions aiming to position the company in a competitive advantage for the long-term. These can include geographical focus, new product services, rationalization of offerings.
One of the most important aspects of a well managed company is a clear vision and strategy coming from the top. The management should have targets that are communicated to all stakeholders and a plan on how to reach these targets.
Product innovation Technology breakthroughs provide an opportunity for commercial banks to develop products that best serve their clients. Mobile banking and mobile payments like Apple Pay are examples of the recent trends.
Failure to keep up with technology and innovate in products and services would place a commercial bank at a competitive disadvantage, reduced customer satisfaction and ultimately diminished shareholder value.
Operational efficiency Issues like headcount, employee remuneration, operating costs and resource efficiency.
Operational efficiency can significantly contribute to a lowering of operational costs, simplification of processes and better talent attraction and retention.
Leadership & Governance
Indicators Description Impact
Management of the legal & regulatory environment
Commercial banks have to adhere to complex set of rules relating to performance and disclosure on issues like insider trading, anti-trust, price fixing and market manipulation.
Commercial banks are also subject to numerous rules regarding tax evasion, fraud, money laundering and corrupt practices.
Failure to manage and comply with the evolving regulatory environment could lead to significant contingent liabilities, restrictions on business activities, reputational damage and diminished shareholder value.
Systemic risk management The recent financial crisis articulated the importance of managing risks to capital in commercial banks. Capital requirements developed by the Federal Reserve and under Basel III intend to ensure that firms have adequate capital to withstand a financial stress.
Metrics such as skewness and kurtosis of trading revenue, risk limit management and exposure to OTC derivative positions are now key indicators of stability.
The adoption of capital requirements and the improvement of capital ratios beyond specified levels are likely to give commercial banks a competitive advantage.
Increased quality, transparency and consistency of a firm’s capital base are likely to improve credit rating and lower the cost of capital.
Failure to adapt to new standards could result in litigation and lack of client trust.
Management of macroeconomic risks
Macroeconomic factors can present several risks to commercial banks, as the recent crisis within the European zone has shown. At the same time, increased economic activity and rates could present opportunities that should be pursued.
Failure to manage macroeconomic risks could result in diminished shareholder value and missed potential opportunities.
P24AppendixPharmaceuticals
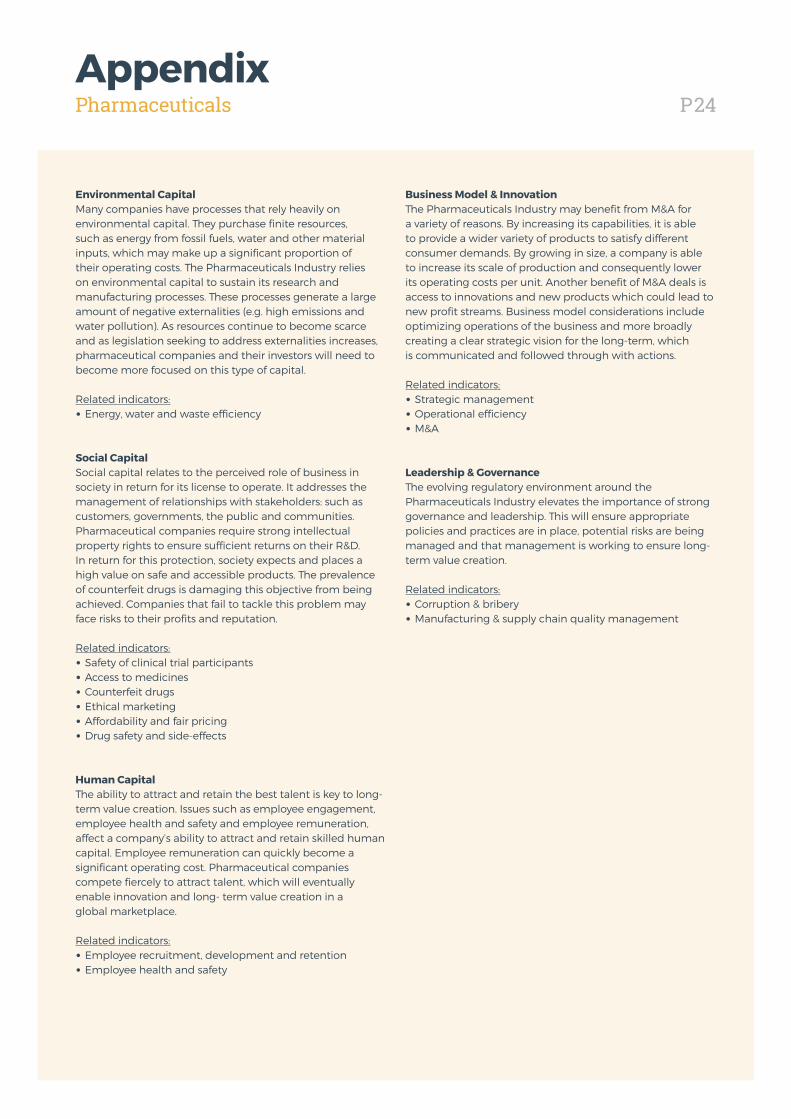
Environmental CapitalMany companies have processes that rely heavily on environmental capital. They purchase finite resources, such as energy from fossil fuels, water and other material inputs, which may make up a significant proportion of their operating costs. The Pharmaceuticals Industry relies on environmental capital to sustain its research and manufacturing processes. These processes generate a large amount of negative externalities (e.g. high emissions and water pollution). As resources continue to become scarce and as legislation seeking to address externalities increases, pharmaceutical companies and their investors will need to become more focused on this type of capital.
Related indicators:• Energy, water and waste efficiency
Social CapitalSocial capital relates to the perceived role of business in society in return for its license to operate. It addresses the management of relationships with stakeholders: such as customers, governments, the public and communities. Pharmaceutical companies require strong intellectual property rights to ensure sufficient returns on their R&D. In return for this protection, society expects and places a high value on safe and accessible products. The prevalence of counterfeit drugs is damaging this objective from being achieved. Companies that fail to tackle this problem may face risks to their profits and reputation.
Related indicators:• Safety of clinical trial participants • Access to medicines• Counterfeit drugs• Ethical marketing• Affordability and fair pricing • Drug safety and side-effects
Human CapitalThe ability to attract and retain the best talent is key to long-term value creation. Issues such as employee engagement,employee health and safety and employee remuneration, affect a company’s ability to attract and retain skilled human capital. Employee remuneration can quickly become a significant operating cost. Pharmaceutical companies compete fiercely to attract talent, which will eventually enable innovation and long- term value creation in a global marketplace.
Related indicators:• Employee recruitment, development and retention• Employee health and safety
Business Model & InnovationThe Pharmaceuticals Industry may benefit from M&A for a variety of reasons. By increasing its capabilities, it is able to provide a wider variety of products to satisfy different consumer demands. By growing in size, a company is able to increase its scale of production and consequently lower its operating costs per unit. Another benefit of M&A deals is access to innovations and new products which could lead to new profit streams. Business model considerations include optimizing operations of the business and more broadly creating a clear strategic vision for the long-term, which is communicated and followed through with actions.
Related indicators:• Strategic management • Operational efficiency • M&A
Leadership & GovernanceThe evolving regulatory environment around the Pharmaceuticals Industry elevates the importance of strong governance and leadership. This will ensure appropriate policies and practices are in place, potential risks are being managed and that management is working to ensure long-term value creation.
Related indicators:• Corruption & bribery• Manufacturing & supply chain quality management
P25AppendixPharmaceuticals
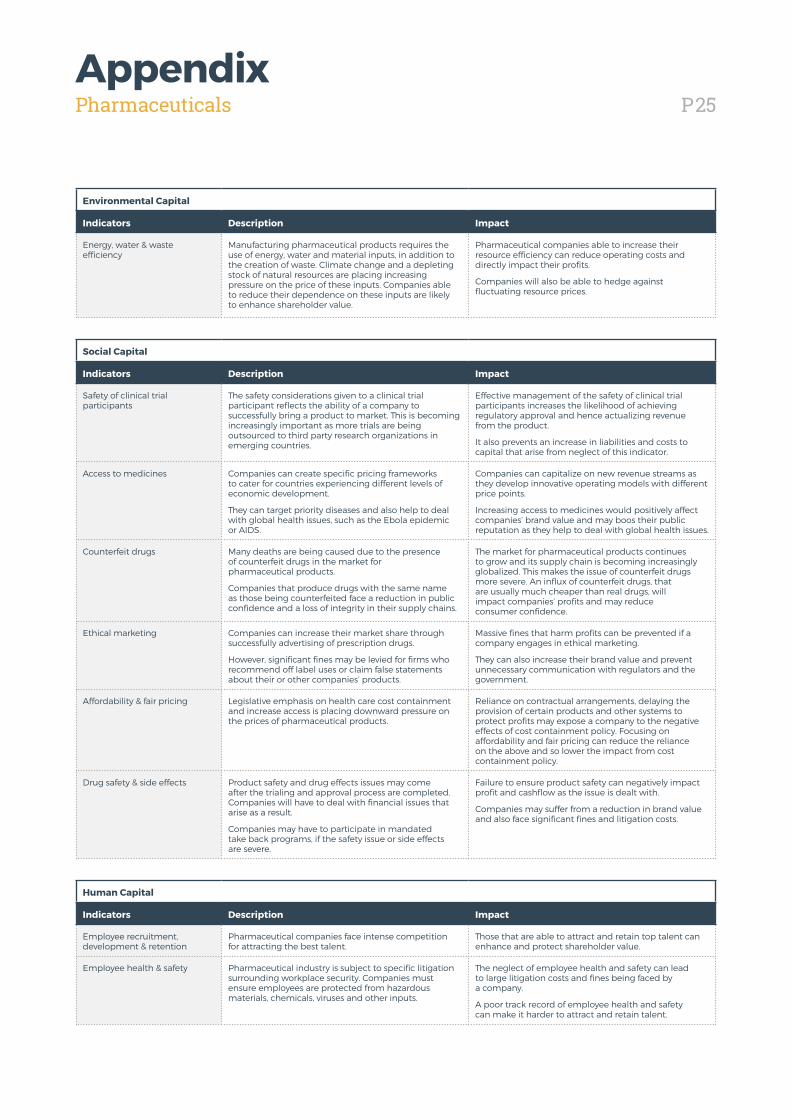
Environmental Capital
Indicators Description Impact
Energy, water & waste efficiency
Manufacturing pharmaceutical products requires the use of energy, water and material inputs, in addition to the creation of waste. Climate change and a depleting stock of natural resources are placing increasing pressure on the price of these inputs. Companies able to reduce their dependence on these inputs are likely to enhance shareholder value.
Pharmaceutical companies able to increase their resource efficiency can reduce operating costs and directly impact their profits.
Companies will also be able to hedge against fluctuating resource prices.
Social Capital
Indicators Description Impact
Safety of clinical trial participants
The safety considerations given to a clinical trial participant reflects the ability of a company to successfully bring a product to market. This is becoming increasingly important as more trials are being outsourced to third party research organizations in emerging countries.
Effective management of the safety of clinical trial participants increases the likelihood of achieving regulatory approval and hence actualizing revenue from the product.
It also prevents an increase in liabilities and costs to capital that arise from neglect of this indicator.
Access to medicines Companies can create specific pricing frameworks to cater for countries experiencing different levels of economic development.
They can target priority diseases and also help to deal with global health issues, such as the Ebola epidemic or AIDS.
Companies can capitalize on new revenue streams as they develop innovative operating models with different price points.
Increasing access to medicines would positively affect companies’ brand value and may boos their public reputation as they help to deal with global health issues.
Counterfeit drugs Many deaths are being caused due to the presence of counterfeit drugs in the market for pharmaceutical products.
Companies that produce drugs with the same name as those being counterfeited face a reduction in public confidence and a loss of integrity in their supply chains.
The market for pharmaceutical products continues to grow and its supply chain is becoming increasingly globalized. This makes the issue of counterfeit drugs more severe. An influx of counterfeit drugs, that are usually much cheaper than real drugs, will impact companies’ profits and may reduce consumer confidence.
Ethical marketing Companies can increase their market share through successfully advertising of prescription drugs.
However, significant fines may be levied for firms who recommend off label uses or claim false statements about their or other companies’ products.
Massive fines that harm profits can be prevented if a company engages in ethical marketing.
They can also increase their brand value and prevent unnecessary communication with regulators and the government.
Affordability & fair pricing Legislative emphasis on health care cost containment and increase access is placing downward pressure on the prices of pharmaceutical products.
Reliance on contractual arrangements, delaying the provision of certain products and other systems to protect profits may expose a company to the negative effects of cost containment policy. Focusing on affordability and fair pricing can reduce the reliance on the above and so lower the impact from cost containment policy.
Drug safety & side effects Product safety and drug effects issues may come after the trialing and approval process are completed. Companies will have to deal with financial issues that arise as a result.
Companies may have to participate in mandated take back programs, if the safety issue or side effects are severe.
Failure to ensure product safety can negatively impact profit and cashflow as the issue is dealt with.
Companies may suffer from a reduction in brand value and also face significant fines and litigation costs.
Human Capital
Indicators Description Impact
Employee recruitment, development & retention
Pharmaceutical companies face intense competition for attracting the best talent.
Those that are able to attract and retain top talent can enhance and protect shareholder value.
Employee health & safety Pharmaceutical industry is subject to specific litigation surrounding workplace security. Companies must ensure employees are protected from hazardous materials, chemicals, viruses and other inputs.
The neglect of employee health and safety can lead to large litigation costs and fines being faced by a company.
A poor track record of employee health and safety can make it harder to attract and retain talent.
P26AppendixPharmaceuticals
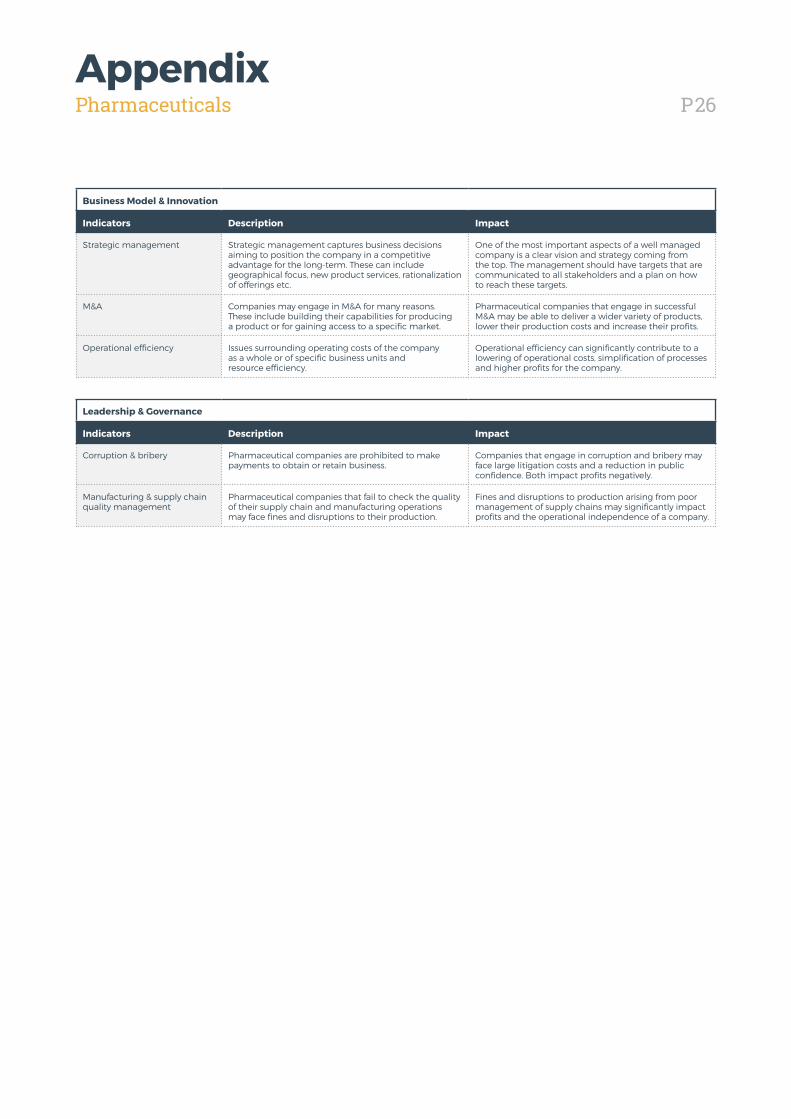
Business Model & Innovation
Indicators Description Impact
Strategic management Strategic management captures business decisions aiming to position the company in a competitive advantage for the long-term. These can include geographical focus, new product services, rationalization of offerings etc.
One of the most important aspects of a well managed company is a clear vision and strategy coming from the top. The management should have targets that are communicated to all stakeholders and a plan on how to reach these targets.
M&A Companies may engage in M&A for many reasons. These include building their capabilities for producing a product or for gaining access to a specific market.
Pharmaceutical companies that engage in successful M&A may be able to deliver a wider variety of products, lower their production costs and increase their profits.
Operational efficiency Issues surrounding operating costs of the company as a whole or of specific business units and resource efficiency.
Operational efficiency can significantly contribute to a lowering of operational costs, simplification of processes and higher profits for the company.
Leadership & Governance
Indicators Description Impact
Corruption & bribery Pharmaceutical companies are prohibited to make payments to obtain or retain business.
Companies that engage in corruption and bribery may face large litigation costs and a reduction in public confidence. Both impact profits negatively.
Manufacturing & supply chain quality management
Pharmaceutical companies that fail to check the quality of their supply chain and manufacturing operations may face fines and disruptions to their production.
Fines and disruptions to production arising from poor management of supply chains may significantly impact profits and the operational independence of a company.
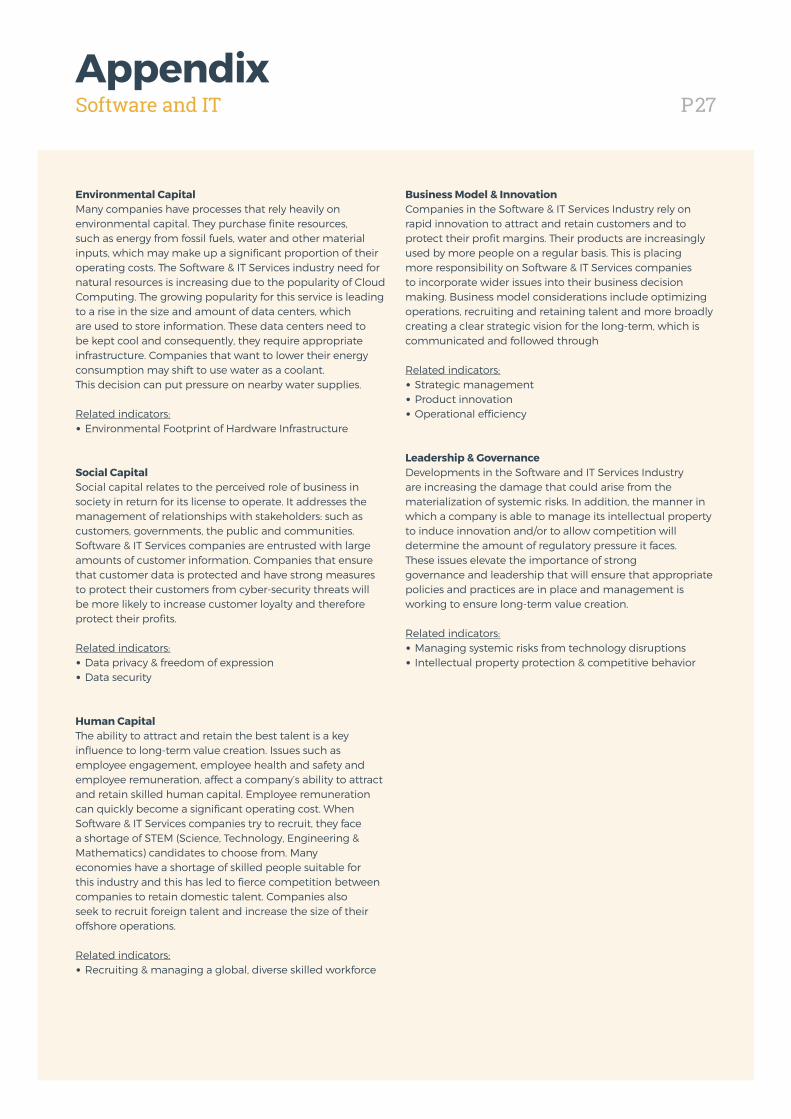
P27AppendixSoftware and IT
Environmental CapitalMany companies have processes that rely heavily on environmental capital. They purchase finite resources, such as energy from fossil fuels, water and other material inputs, which may make up a significant proportion of their operating costs. The Software & IT Services industry need for natural resources is increasing due to the popularity of Cloud Computing. The growing popularity for this service is leading to a rise in the size and amount of data centers, which are used to store information. These data centers need to be kept cool and consequently, they require appropriate infrastructure. Companies that want to lower their energy consumption may shift to use water as a coolant. This decision can put pressure on nearby water supplies.
Related indicators:• Environmental Footprint of Hardware Infrastructure
Social CapitalSocial capital relates to the perceived role of business in society in return for its license to operate. It addresses the management of relationships with stakeholders: such as customers, governments, the public and communities. Software & IT Services companies are entrusted with large amounts of customer information. Companies that ensure that customer data is protected and have strong measures to protect their customers from cyber-security threats will be more likely to increase customer loyalty and therefore protect their profits.
Related indicators:• Data privacy & freedom of expression• Data security
Human CapitalThe ability to attract and retain the best talent is a key influence to long-term value creation. Issues such as employee engagement, employee health and safety and employee remuneration, affect a company’s ability to attract and retain skilled human capital. Employee remuneration can quickly become a significant operating cost. When Software & IT Services companies try to recruit, they face a shortage of STEM (Science, Technology, Engineering & Mathematics) candidates to choose from. Manyeconomies have a shortage of skilled people suitable for this industry and this has led to fierce competition between companies to retain domestic talent. Companies alsoseek to recruit foreign talent and increase the size of their offshore operations.
Related indicators:• Recruiting & managing a global, diverse skilled workforce
Business Model & InnovationCompanies in the Software & IT Services Industry rely on rapid innovation to attract and retain customers and to protect their profit margins. Their products are increasingly used by more people on a regular basis. This is placing more responsibility on Software & IT Services companies to incorporate wider issues into their business decision making. Business model considerations include optimizing operations, recruiting and retaining talent and more broadly creating a clear strategic vision for the long-term, which is communicated and followed through
Related indicators:• Strategic management• Product innovation• Operational efficiency
Leadership & GovernanceDevelopments in the Software and IT Services Industry are increasing the damage that could arise from the materialization of systemic risks. In addition, the manner in which a company is able to manage its intellectual property to induce innovation and/or to allow competition will determine the amount of regulatory pressure it faces. These issues elevate the importance of stronggovernance and leadership that will ensure that appropriate policies and practices are in place and management is working to ensure long-term value creation.
Related indicators:• Managing systemic risks from technology disruptions• Intellectual property protection & competitive behavior
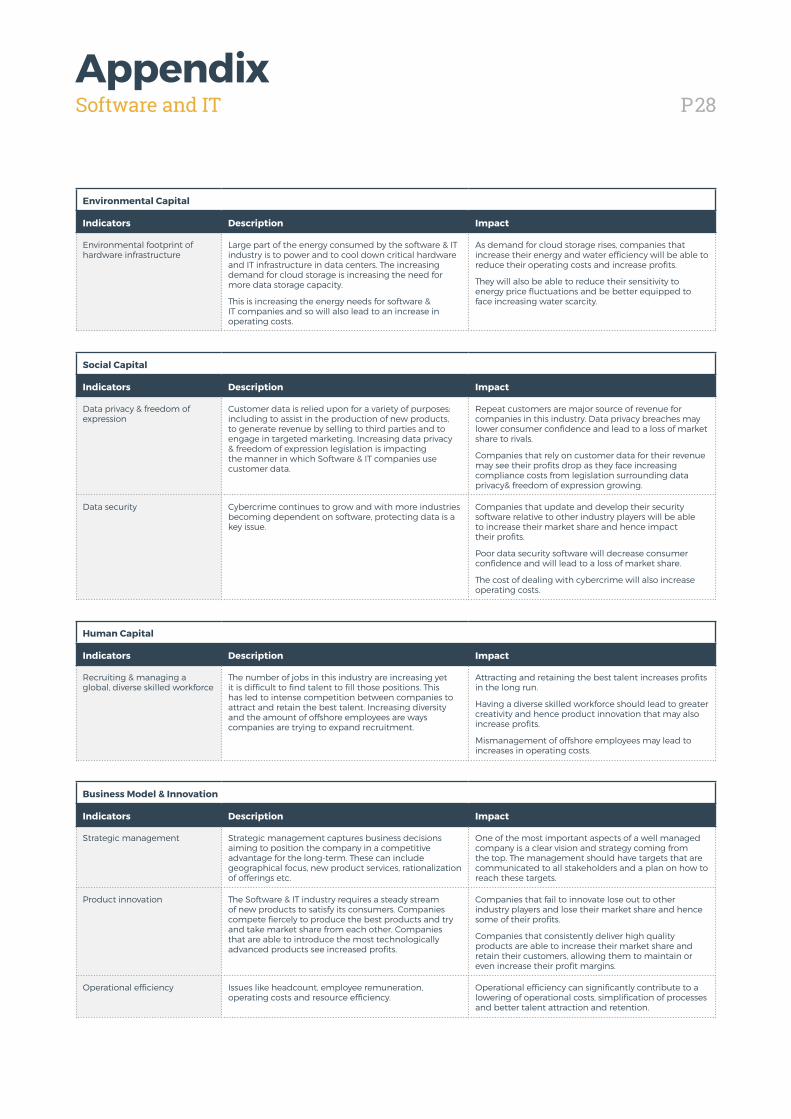
P28AppendixSoftware and IT
Environmental Capital
Indicators Description Impact
Environmental footprint of hardware infrastructure
Large part of the energy consumed by the software & IT industry is to power and to cool down critical hardware and IT infrastructure in data centers. The increasing demand for cloud storage is increasing the need for more data storage capacity.
This is increasing the energy needs for software & IT companies and so will also lead to an increase in operating costs.
As demand for cloud storage rises, companies that increase their energy and water efficiency will be able to reduce their operating costs and increase profits.
They will also be able to reduce their sensitivity to energy price fluctuations and be better equipped to face increasing water scarcity.
Social Capital
Indicators Description Impact
Data privacy & freedom of expression
Customer data is relied upon for a variety of purposes: including to assist in the production of new products, to generate revenue by selling to third parties and to engage in targeted marketing. Increasing data privacy & freedom of expression legislation is impacting the manner in which Software & IT companies use customer data.
Repeat customers are major source of revenue for companies in this industry. Data privacy breaches may lower consumer confidence and lead to a loss of market share to rivals.
Companies that rely on customer data for their revenue may see their profits drop as they face increasing compliance costs from legislation surrounding data privacy& freedom of expression growing.
Data security Cybercrime continues to grow and with more industries becoming dependent on software, protecting data is a key issue.
Companies that update and develop their security software relative to other industry players will be able to increase their market share and hence impact their profits.
Poor data security software will decrease consumer confidence and will lead to a loss of market share.
The cost of dealing with cybercrime will also increase operating costs.
Human Capital
Indicators Description Impact
Recruiting & managing a global, diverse skilled workforce
The number of jobs in this industry are increasing yet it is difficult to find talent to fill those positions. This has led to intense competition between companies to attract and retain the best talent. Increasing diversity and the amount of offshore employees are ways companies are trying to expand recruitment.
Attracting and retaining the best talent increases profits in the long run.
Having a diverse skilled workforce should lead to greater creativity and hence product innovation that may also increase profits.
Mismanagement of offshore employees may lead to increases in operating costs.
Business Model & Innovation
Indicators Description Impact
Strategic management Strategic management captures business decisions aiming to position the company in a competitive advantage for the long-term. These can include geographical focus, new product services, rationalization of offerings etc.
One of the most important aspects of a well managed company is a clear vision and strategy coming from the top. The management should have targets that are communicated to all stakeholders and a plan on how to reach these targets.
Product innovation The Software & IT industry requires a steady stream of new products to satisfy its consumers. Companies compete fiercely to produce the best products and try and take market share from each other. Companies that are able to introduce the most technologically advanced products see increased profits.
Companies that fail to innovate lose out to other industry players and lose their market share and hence some of their profits.
Companies that consistently deliver high quality products are able to increase their market share and retain their customers, allowing them to maintain or even increase their profit margins.
Operational efficiency Issues like headcount, employee remuneration, operating costs and resource efficiency.
Operational efficiency can significantly contribute to a lowering of operational costs, simplification of processes and better talent attraction and retention.
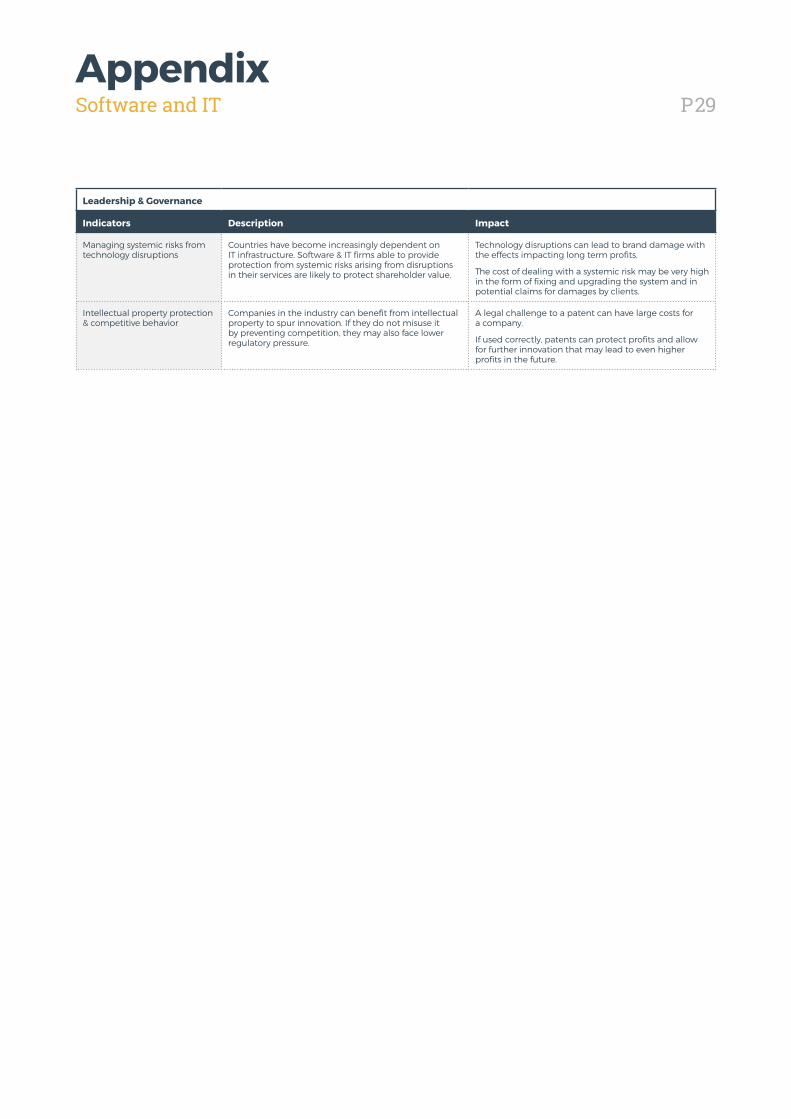
P29AppendixSoftware and IT
Leadership & Governance
Indicators Description Impact
Managing systemic risks from technology disruptions
Countries have become increasingly dependent on IT infrastructure. Software & IT firms able to provide protection from systemic risks arising from disruptions in their services are likely to protect shareholder value.
Technology disruptions can lead to brand damage with the effects impacting long term profits.
The cost of dealing with a systemic risk may be very high in the form of fixing and upgrading the system and in potential claims for damages by clients.
Intellectual property protection & competitive behavior
Companies in the industry can benefit from intellectual property to spur innovation. If they do not misuse it by preventing competition, they may also face lower regulatory pressure.
A legal challenge to a patent can have large costs for a company.
If used correctly, patents can protect profits and allow for further innovation that may lead to even higher profits in the future.
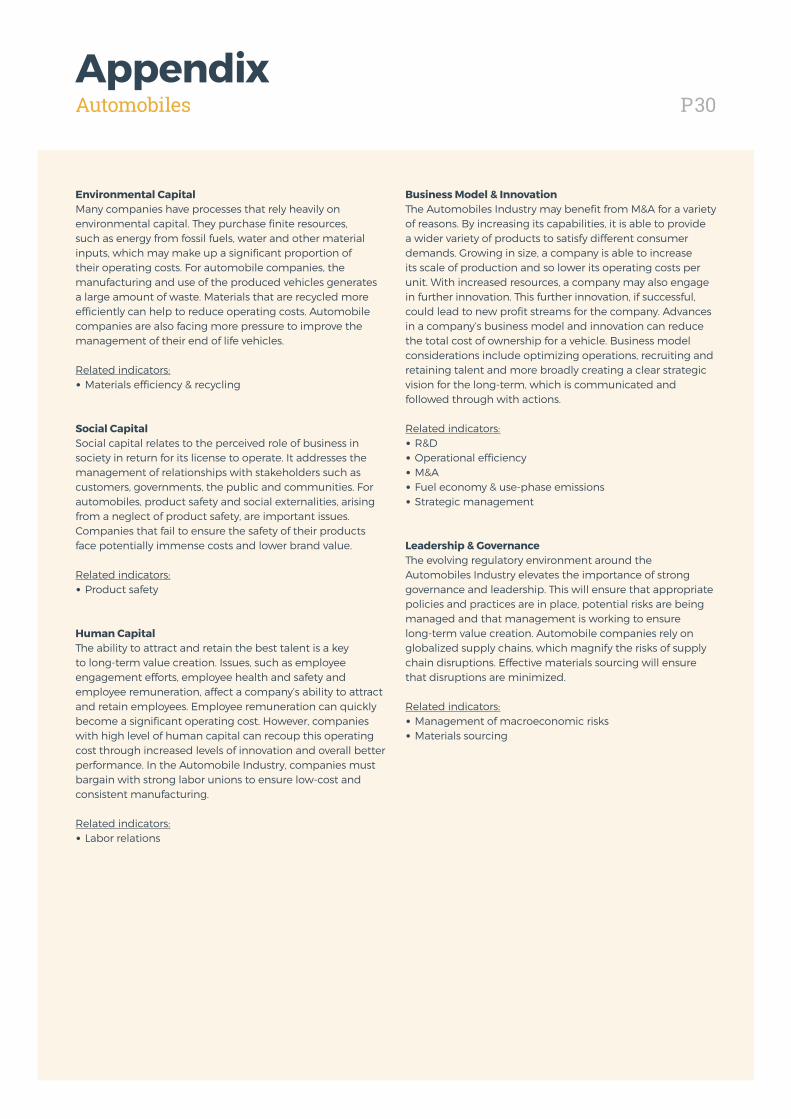
P30AppendixAutomobiles
Environmental CapitalMany companies have processes that rely heavily on environmental capital. They purchase finite resources, such as energy from fossil fuels, water and other material inputs, which may make up a significant proportion of their operating costs. For automobile companies, the manufacturing and use of the produced vehicles generates a large amount of waste. Materials that are recycled more efficiently can help to reduce operating costs. Automobile companies are also facing more pressure to improve the management of their end of life vehicles.
Related indicators:• Materials efficiency & recycling
Social CapitalSocial capital relates to the perceived role of business in society in return for its license to operate. It addresses the management of relationships with stakeholders such as customers, governments, the public and communities. For automobiles, product safety and social externalities, arising from a neglect of product safety, are important issues. Companies that fail to ensure the safety of their products face potentially immense costs and lower brand value.
Related indicators:• Product safety
Human CapitalThe ability to attract and retain the best talent is a key to long-term value creation. Issues, such as employee engagement efforts, employee health and safety and employee remuneration, affect a company’s ability to attract and retain employees. Employee remuneration can quickly become a significant operating cost. However, companies with high level of human capital can recoup this operating cost through increased levels of innovation and overall better performance. In the Automobile Industry, companies must bargain with strong labor unions to ensure low-cost and consistent manufacturing.
Related indicators:• Labor relations
Business Model & InnovationThe Automobiles Industry may benefit from M&A for a variety of reasons. By increasing its capabilities, it is able to provide a wider variety of products to satisfy different consumer demands. Growing in size, a company is able to increase its scale of production and so lower its operating costs per unit. With increased resources, a company may also engage in further innovation. This further innovation, if successful, could lead to new profit streams for the company. Advances in a company’s business model and innovation can reduce the total cost of ownership for a vehicle. Business model considerations include optimizing operations, recruiting and retaining talent and more broadly creating a clear strategic vision for the long-term, which is communicated and followed through with actions.
Related indicators:• R&D• Operational efficiency• M&A• Fuel economy & use-phase emissions• Strategic management
Leadership & GovernanceThe evolving regulatory environment around the Automobiles Industry elevates the importance of strong governance and leadership. This will ensure that appropriate policies and practices are in place, potential risks are being managed and that management is working to ensure long-term value creation. Automobile companies rely on globalized supply chains, which magnify the risks of supply chain disruptions. Effective materials sourcing will ensure that disruptions are minimized.
Related indicators:• Management of macroeconomic risks• Materials sourcing
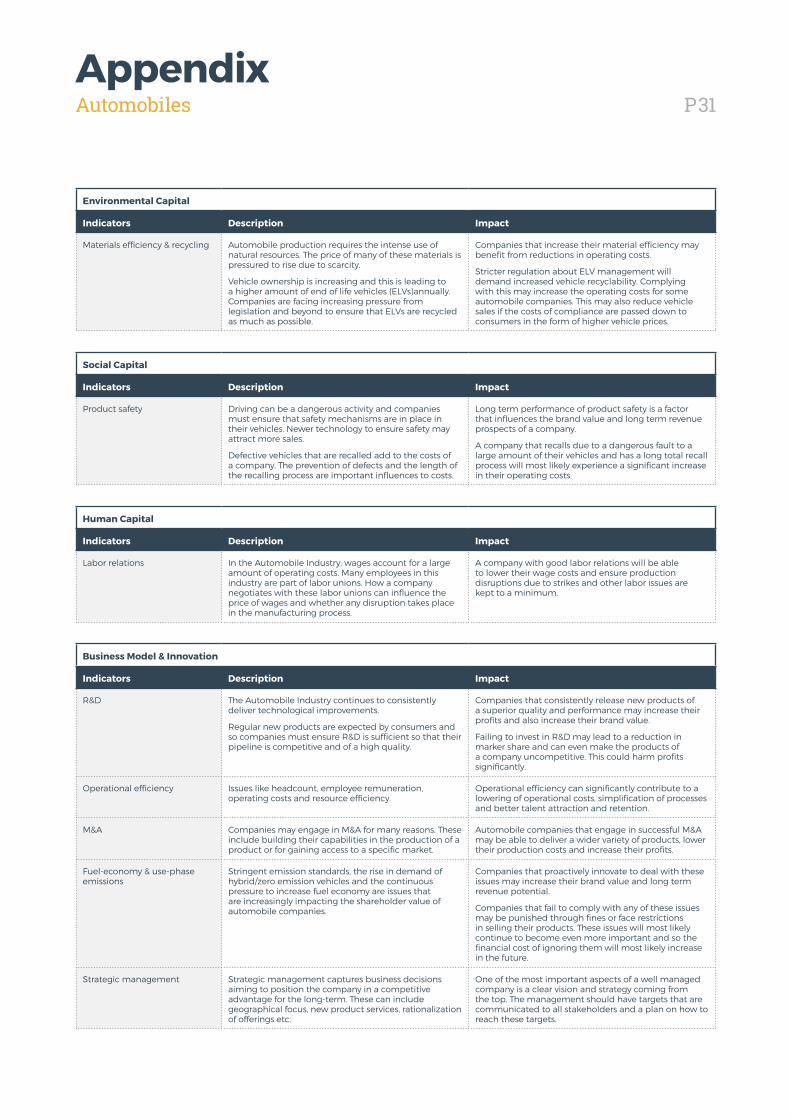
P31AppendixAutomobiles
Environmental Capital
Indicators Description Impact
Materials efficiency & recycling Automobile production requires the intense use of natural resources. The price of many of these materials is pressured to rise due to scarcity.
Vehicle ownership is increasing and this is leading to a higher amount of end of life vehicles (ELVs)annually. Companies are facing increasing pressure from legislation and beyond to ensure that ELVs are recycled as much as possible.
Companies that increase their material efficiency may benefit from reductions in operating costs.
Stricter regulation about ELV management will demand increased vehicle recyclability. Complying with this may increase the operating costs for some automobile companies. This may also reduce vehicle sales if the costs of compliance are passed down to consumers in the form of higher vehicle prices.
Social Capital
Indicators Description Impact
Product safety Driving can be a dangerous activity and companies must ensure that safety mechanisms are in place in their vehicles. Newer technology to ensure safety may attract more sales.
Defective vehicles that are recalled add to the costs of a company. The prevention of defects and the length of the recalling process are important influences to costs.
Long term performance of product safety is a factor that influences the brand value and long term revenue prospects of a company.
A company that recalls due to a dangerous fault to a large amount of their vehicles and has a long total recall process will most likely experience a significant increase in their operating costs.
Human Capital
Indicators Description Impact
Labor relations In the Automobile Industry, wages account for a large amount of operating costs. Many employees in this industry are part of labor unions. How a company negotiates with these labor unions can influence the price of wages and whether any disruption takes place in the manufacturing process.
A company with good labor relations will be able to lower their wage costs and ensure production disruptions due to strikes and other labor issues are kept to a minimum.
Business Model & Innovation
Indicators Description Impact
R&D The Automobile Industry continues to consistently deliver technological improvements.
Regular new products are expected by consumers and so companies must ensure R&D is sufficient so that their pipeline is competitive and of a high quality.
Companies that consistently release new products of a superior quality and performance may increase their profits and also increase their brand value.
Failing to invest in R&D may lead to a reduction in marker share and can even make the products of a company uncompetitive. This could harm profits significantly.
Operational efficiency Issues like headcount, employee remuneration, operating costs and resource efficiency.
Operational efficiency can significantly contribute to a lowering of operational costs, simplification of processes and better talent attraction and retention.
M&A Companies may engage in M&A for many reasons. These include building their capabilities in the production of a product or for gaining access to a specific market.
Automobile companies that engage in successful M&A may be able to deliver a wider variety of products, lower their production costs and increase their profits.
Fuel-economy & use-phase emissions
Stringent emission standards, the rise in demand of hybrid/zero emission vehicles and the continuous pressure to increase fuel economy are issues that are increasingly impacting the shareholder value of automobile companies.
Companies that proactively innovate to deal with these issues may increase their brand value and long term revenue potential.
Companies that fail to comply with any of these issues may be punished through fines or face restrictions in selling their products. These issues will most likely continue to become even more important and so the financial cost of ignoring them will most likely increase in the future.
Strategic management Strategic management captures business decisions aiming to position the company in a competitive advantage for the long-term. These can include geographical focus, new product services, rationalization of offerings etc.
One of the most important aspects of a well managed company is a clear vision and strategy coming from the top. The management should have targets that are communicated to all stakeholders and a plan on how to reach these targets.
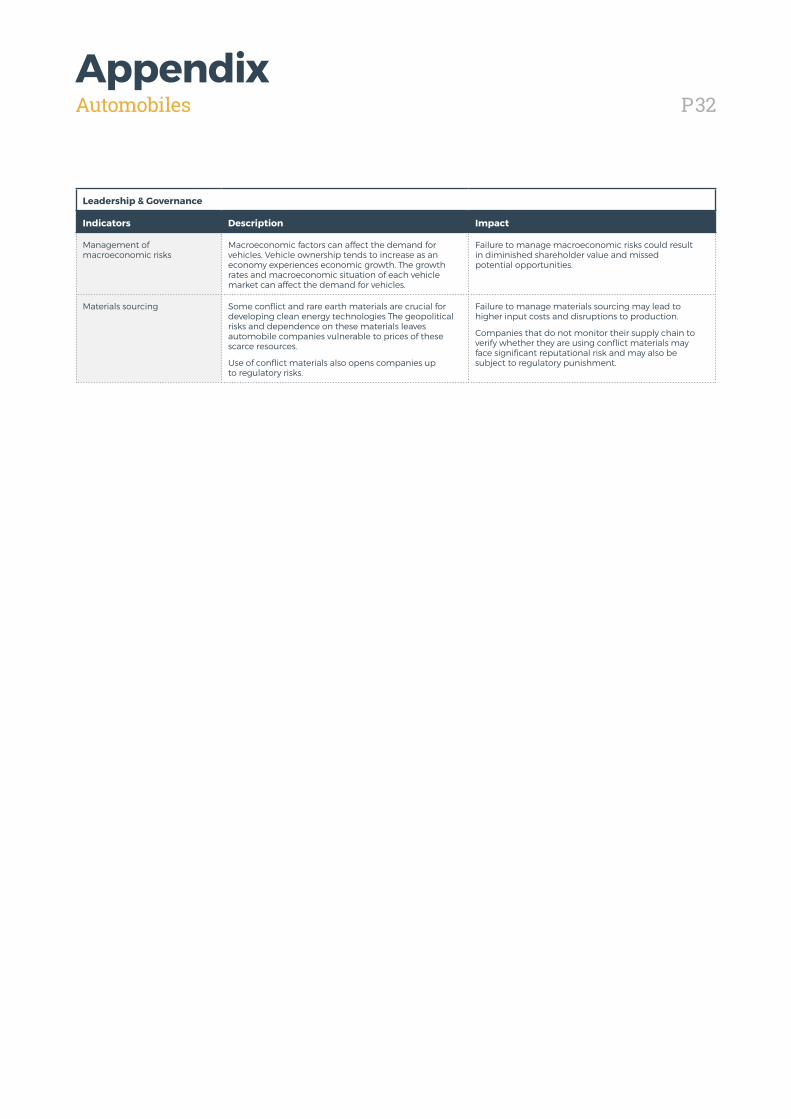
P32AppendixAutomobiles
Leadership & Governance
Indicators Description Impact
Management of macroeconomic risks
Macroeconomic factors can affect the demand for vehicles. Vehicle ownership tends to increase as an economy experiences economic growth. The growth rates and macroeconomic situation of each vehicle market can affect the demand for vehicles.
Failure to manage macroeconomic risks could result in diminished shareholder value and missed potential opportunities.
Materials sourcing Some conflict and rare earth materials are crucial for developing clean energy technologies The geopolitical risks and dependence on these materials leaves automobile companies vulnerable to prices of these scarce resources.
Use of conflict materials also opens companies up to regulatory risks.
Failure to manage materials sourcing may lead to higher input costs and disruptions to production.
Companies that do not monitor their supply chain to verify whether they are using conflict materials may face significant reputational risk and may also be subject to regulatory punishment.