Implementation of the Bitumen Performance Grading System ... Bitumen Conference.pdf ·...
65
Implementation of the Bitumen Performance Grading System in Estonia Pouya Teymourpour Hussain U. Bahia Tallinn, Estonia Feb 19, 2015 University of Wisconsin-Madison
Transcript of Implementation of the Bitumen Performance Grading System ... Bitumen Conference.pdf ·...

Implementation of the Bitumen
Performance Grading System in Estonia
Pouya TeymourpourHussain U. Bahia Tallinn, Estonia
Feb 19, 2015University of Wisconsin-Madison
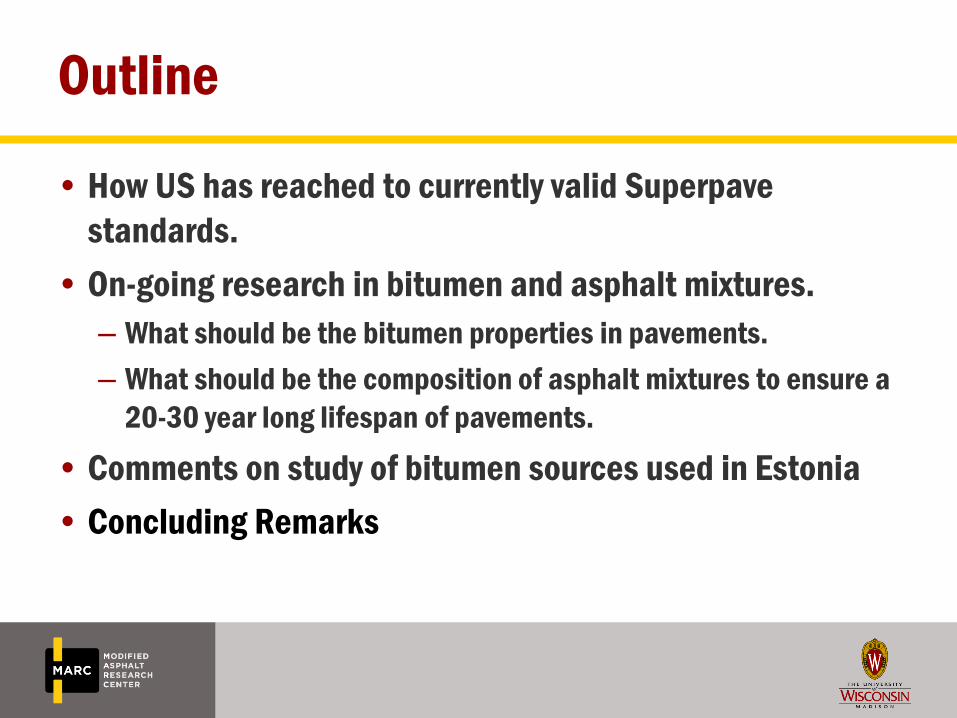
Outline
• How US has reached to currently valid Superpave
standards.
• On-going research in bitumen and asphalt mixtures.
– What should be the bitumen properties in pavements.
– What should be the composition of asphalt mixtures to ensure a
20-30 year long lifespan of pavements.
• Comments on study of bitumen sources used in Estonia
• Concluding Remarks
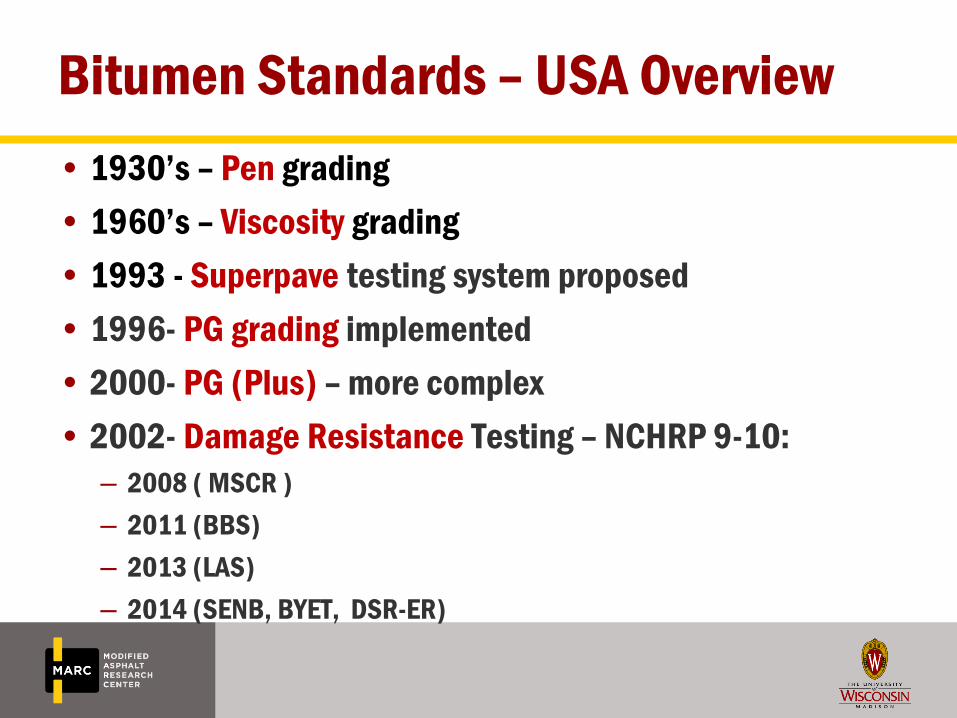
Bitumen Standards – USA Overview
• 1930’s – Pen grading
• 1960’s – Viscosity grading
• 1993 - Superpave testing system proposed
• 1996- PG grading implemented
• 2000- PG (Plus) – more complex
• 2002- Damage Resistance Testing – NCHRP 9-10:
– 2008 ( MSCR )
– 2011 (BBS)
– 2013 (LAS)
– 2014 (SENB, BYET, DSR-ER)
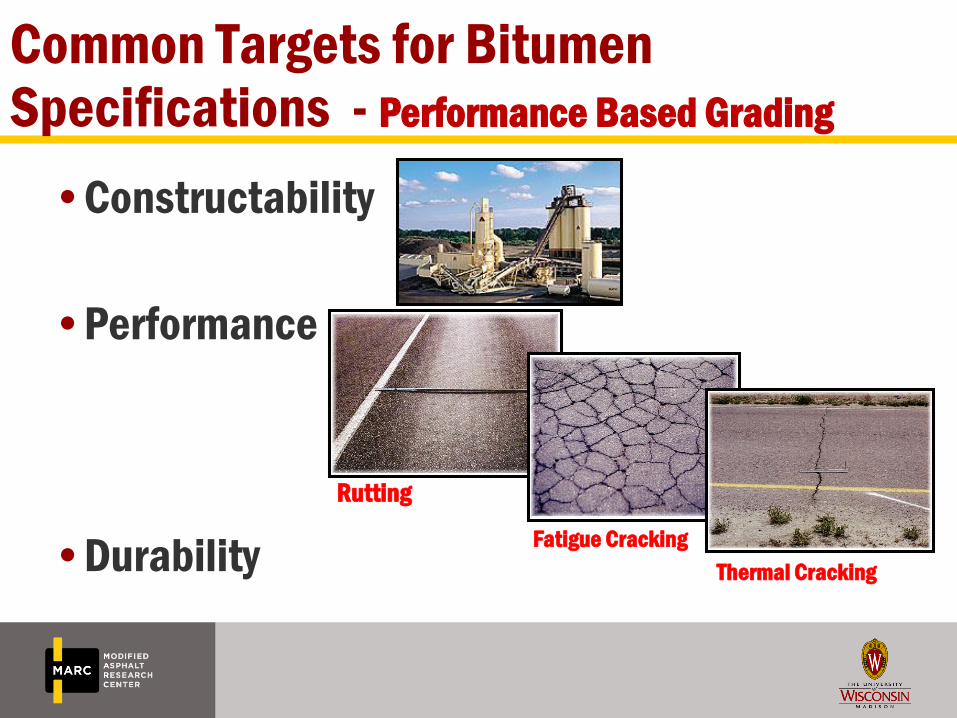
Common Targets for Bitumen Specifications - Performance Based Grading
•Constructability
•Performance
•Durability
Rutting
Fatigue Cracking
Thermal Cracking
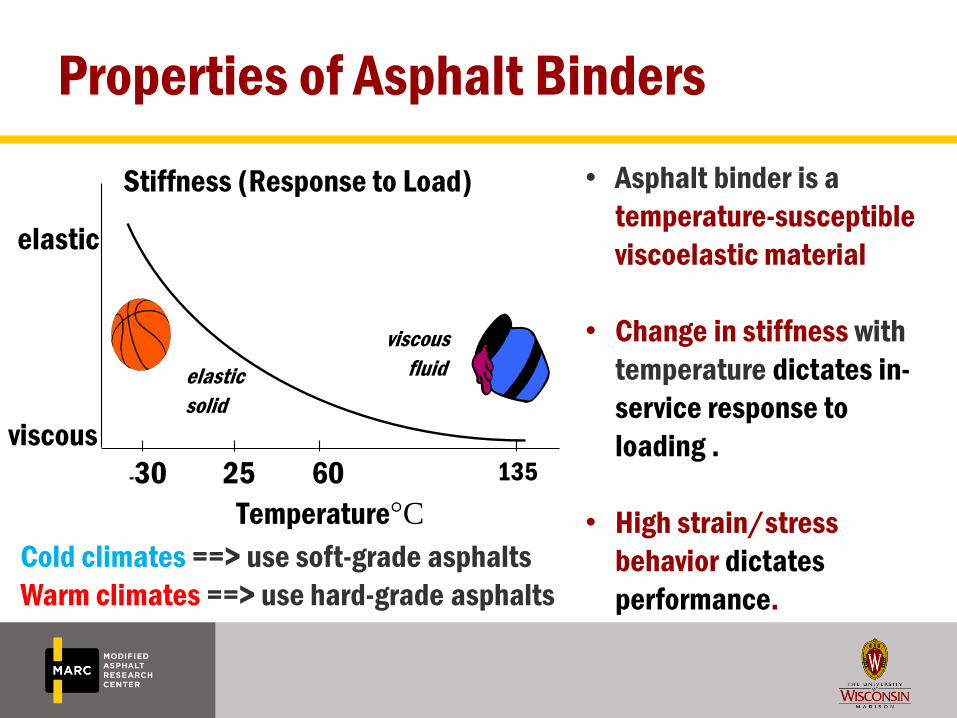
Properties of Asphalt Binders
Temperature°C
Stiffness (Response to Load)
-30 25 60 135
elastic
viscous
elastic
solid
viscous
fluid
Cold climates ==> use soft-grade asphalts
Warm climates ==> use hard-grade asphalts
• Asphalt binder is a
temperature-susceptible
viscoelastic material
• Change in stiffness with
temperature dictates in-
service response to
loading .
• High strain/stress
behavior dictates
performance.
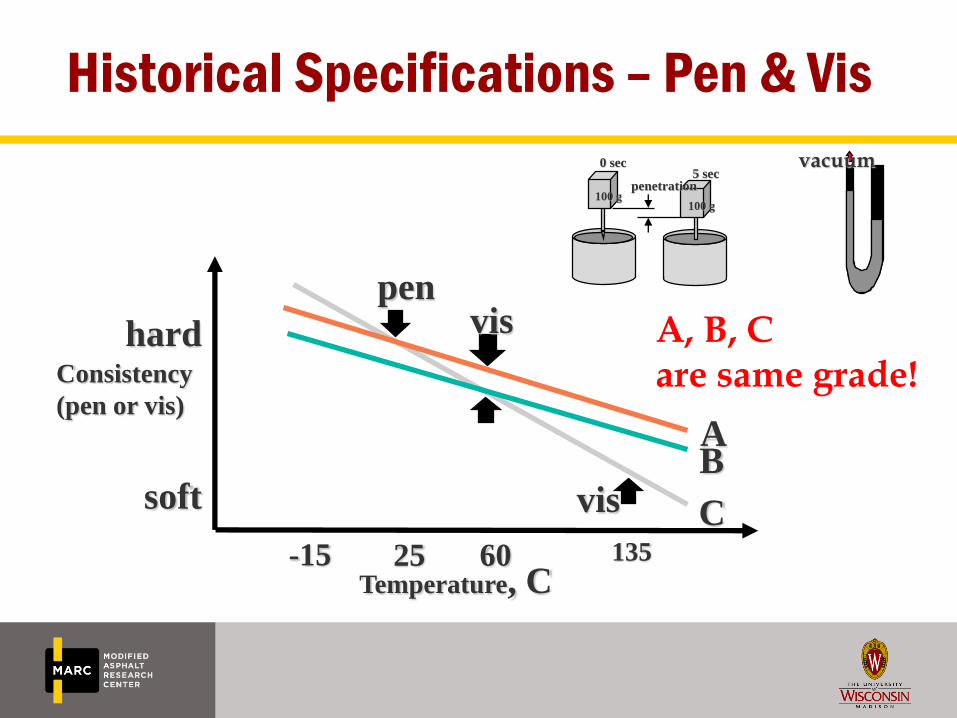
Consistency
(pen or vis)
25 60 135-15
hard
soft
penvis
vis
AB
C
Temperature, C
A, B, C are same grade!
Historical Specifications – Pen & Vis
100 g100 g
penetration
0 sec5 sec
vacuum
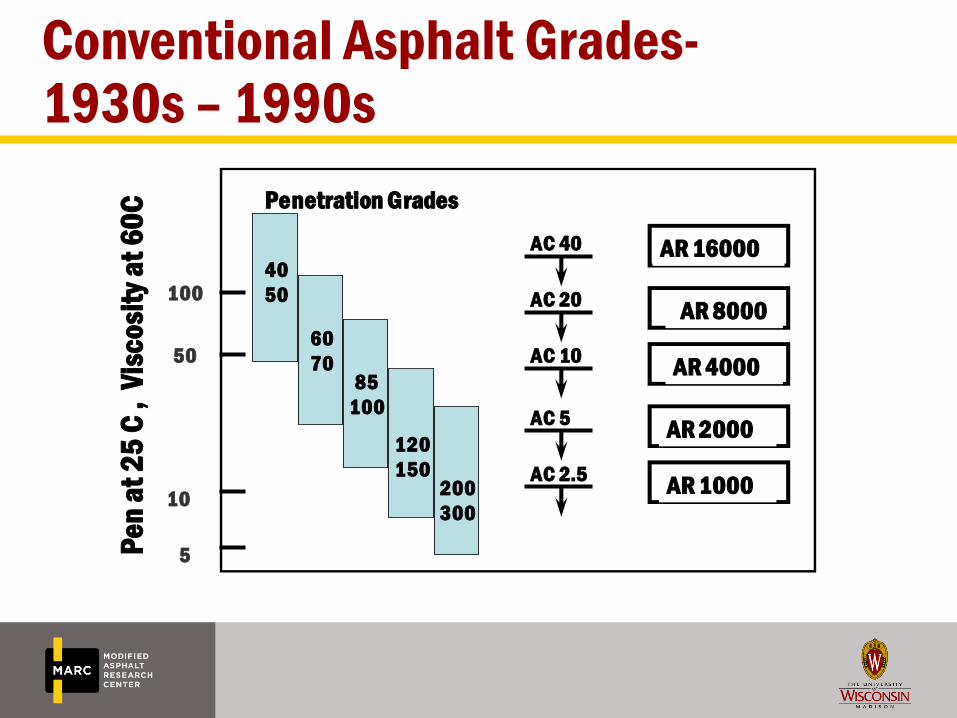
Conventional Asphalt Grades-1930s – 1990s
Pe
n a
t 2
5 C
, V
isc
osi
ty a
t 6
0C
40
50
60
7085
100
120
150200
300
Penetration Grades
AC 40
AC 20
AC 10
AC 5
AC 2.5
100
50
10
5
AR 16000
AR 8000
AR 4000
AR 2000
AR 1000
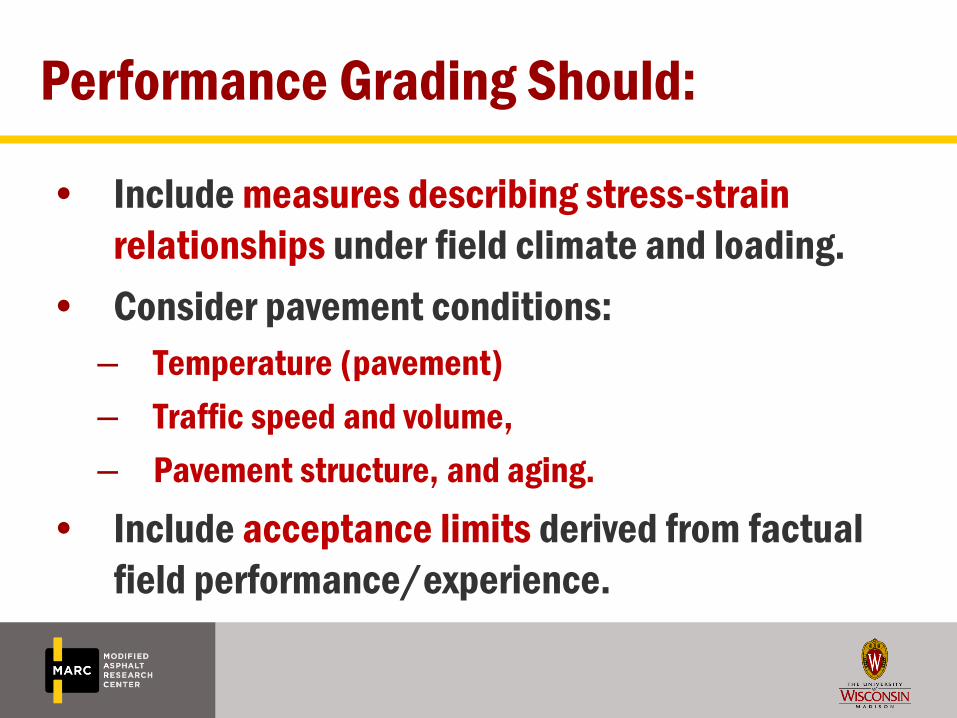
Performance Grading Should:
• Include measures describing stress-strain
relationships under field climate and loading.
• Consider pavement conditions:
– Temperature (pavement)
– Traffic speed and volume,
– Pavement structure, and aging.
• Include acceptance limits derived from factual
field performance/experience.
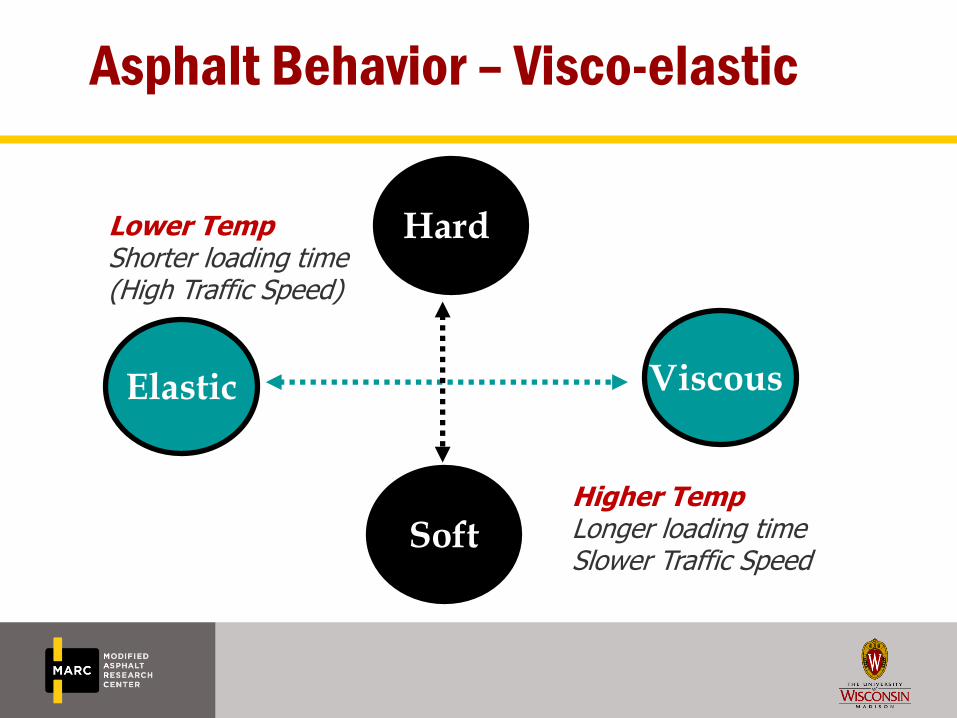
Asphalt Behavior – Visco-elastic
Hard
Soft
Elastic Viscous
Lower TempShorter loading time(High Traffic Speed)
Higher TempLonger loading timeSlower Traffic Speed
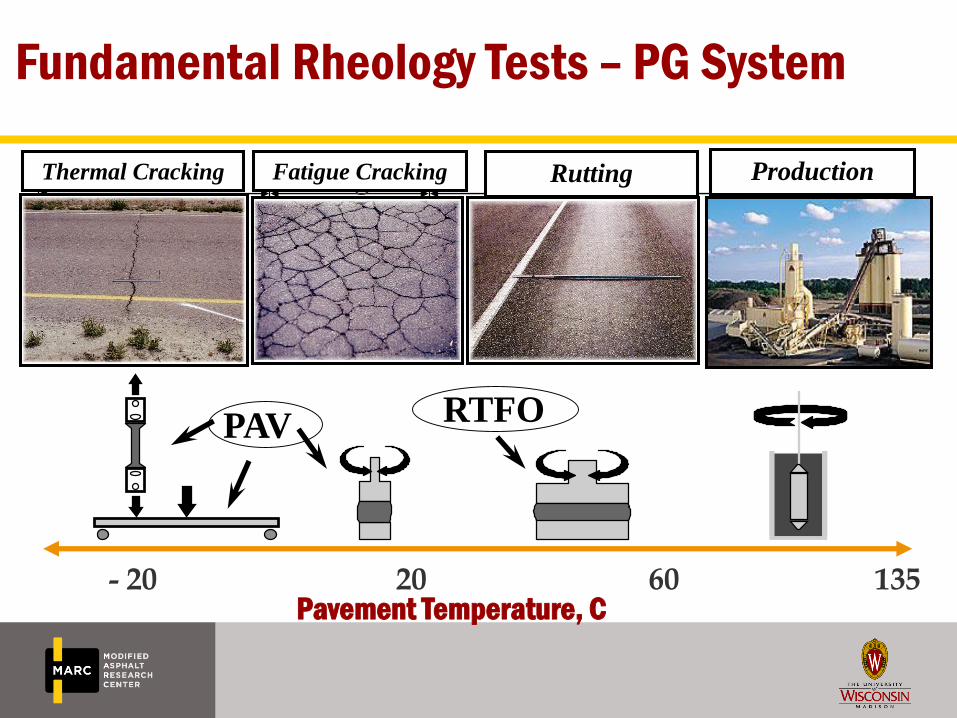
Thermal
Cracking
Fatigue
Cracking
Permanent
Deformation
(mixing &
compact)
Pavement Temperature, C
RTFO
- 20 20 60 135
PAV
RuttingFatigue CrackingThermal Cracking Production
Fundamental Rheology Tests – PG System
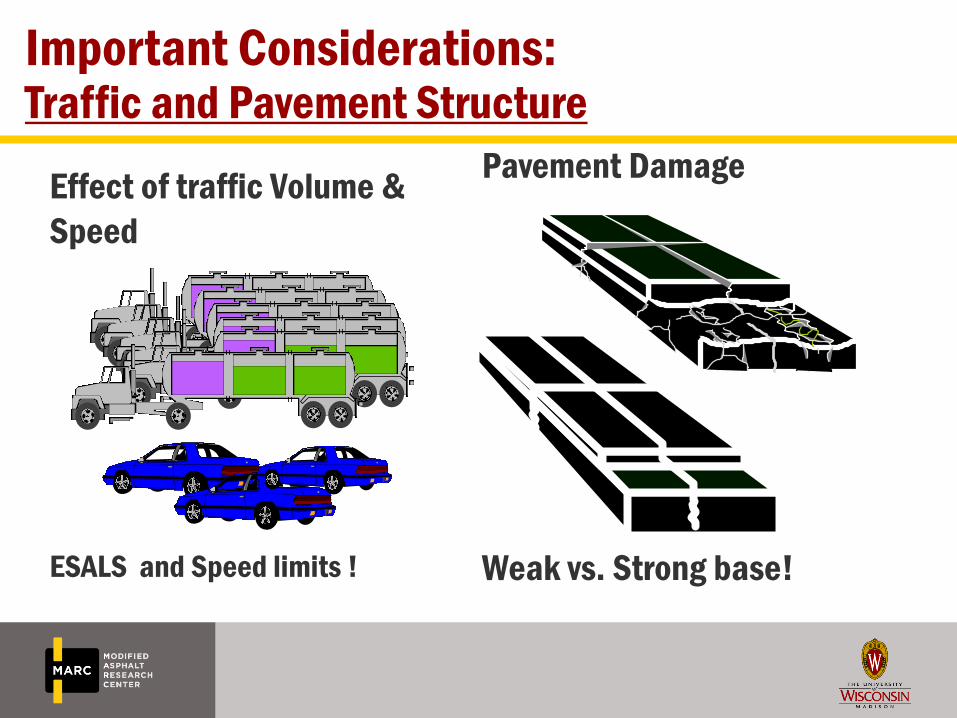
Important Considerations:Traffic and Pavement Structure
Effect of traffic Volume &
Speed
ESALS and Speed limits !
Pavement Damage
Weak vs. Strong base!
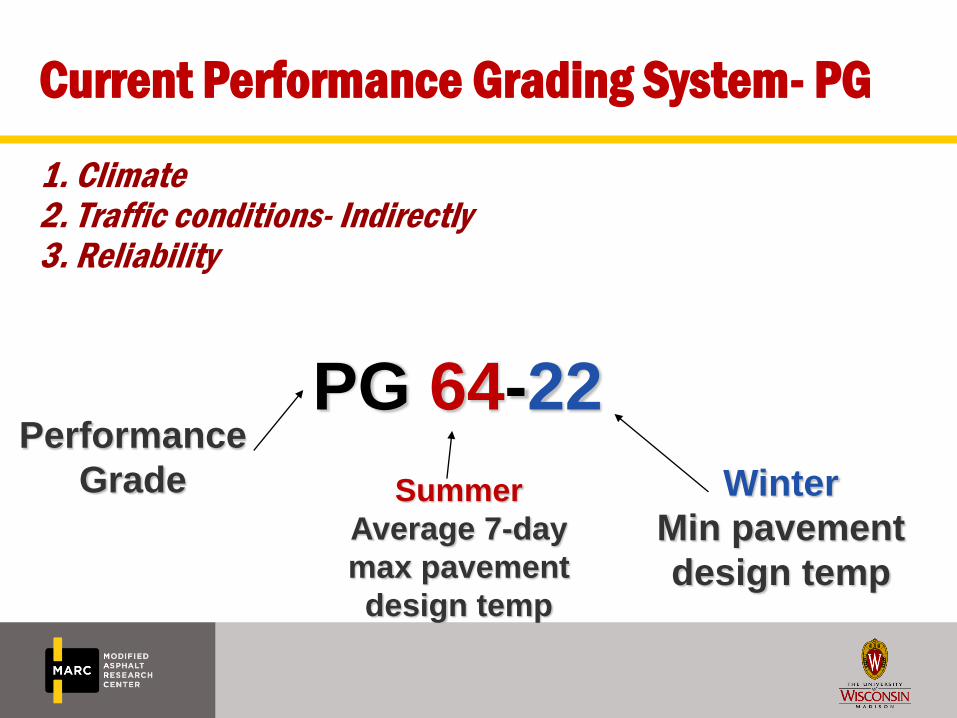
Current Performance Grading System- PG
1. Climate2. Traffic conditions- Indirectly3. Reliability
PG 64-22Performance
Grade Summer
Average 7-day
max pavement
design temp
Winter
Min pavement
design temp
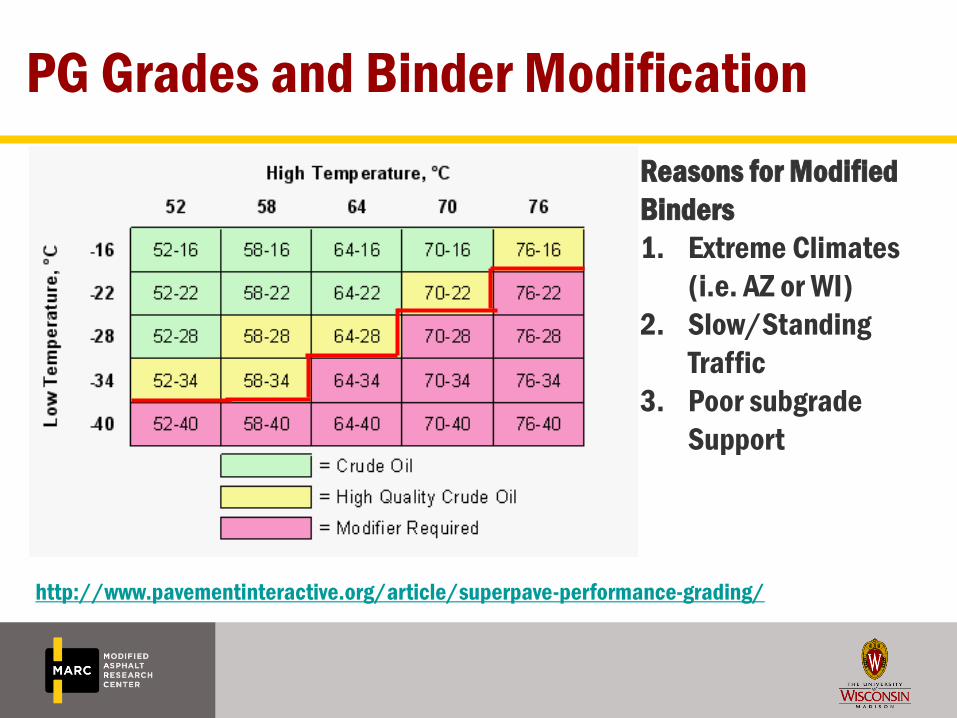
PG Grades and Binder Modification
Reasons for Modified
Binders
1. Extreme Climates
(i.e. AZ or WI)
2. Slow/Standing
Traffic
3. Poor subgrade
Support
http://www.pavementinteractive.org/article/superpave-performance-grading/
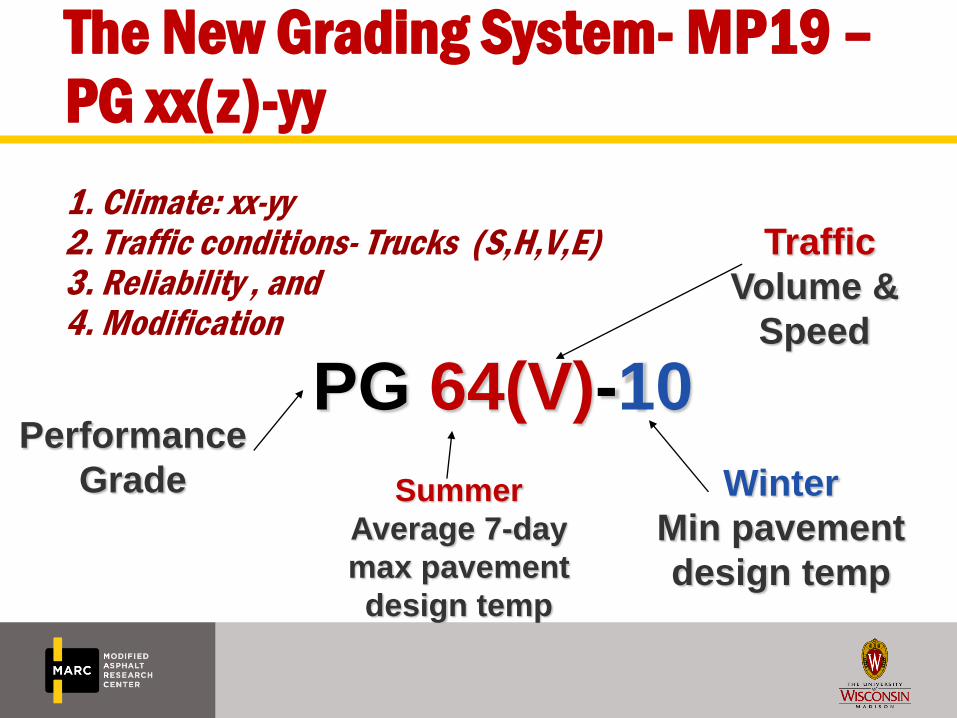
The New Grading System- MP19 –PG xx(z)-yy
1. Climate: xx-yy2. Traffic conditions- Trucks (S,H,V,E)3. Reliability , and4. Modification
PG 64(V)-10Performance
Grade Summer
Average 7-day
max pavement
design temp
Winter
Min pavement
design temp
Traffic
Volume &
Speed
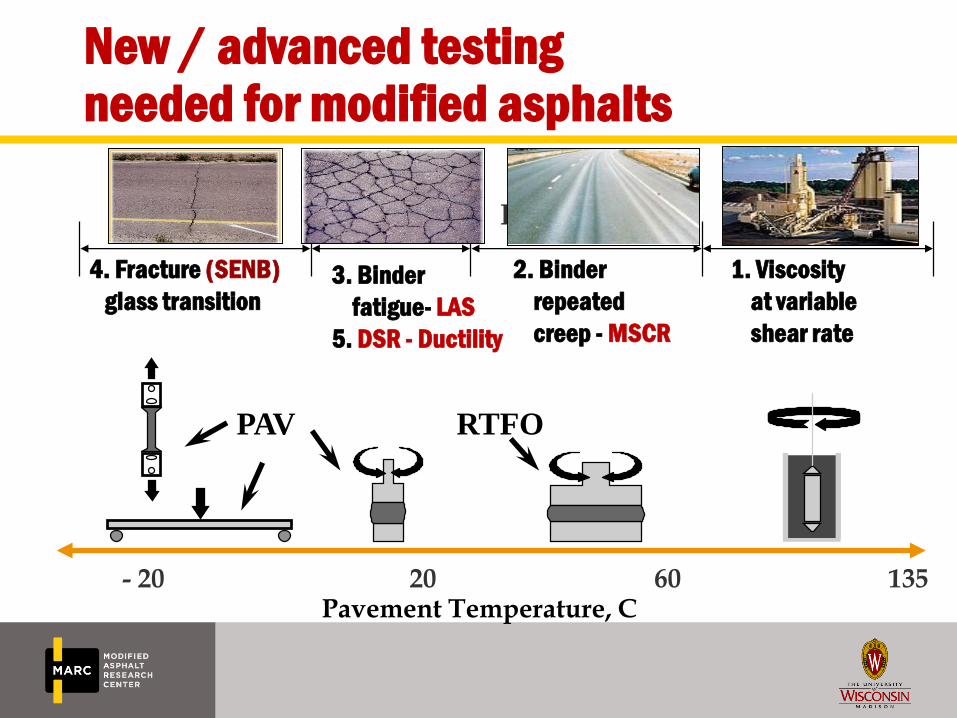
New / advanced testing needed for modified asphalts
Thermal
Cracking
Fatigue
Cracking
Permanent
Deformation
(mixing &
compaction)
Pavement Temperature, C- 20 20 60 135
RTFOPAV
1. Viscosity
at variable
shear rate
4. Fracture (SENB)
glass transition3. Binder
fatigue- LAS
5. DSR - Ductility
2. Binder
repeated
creep - MSCR
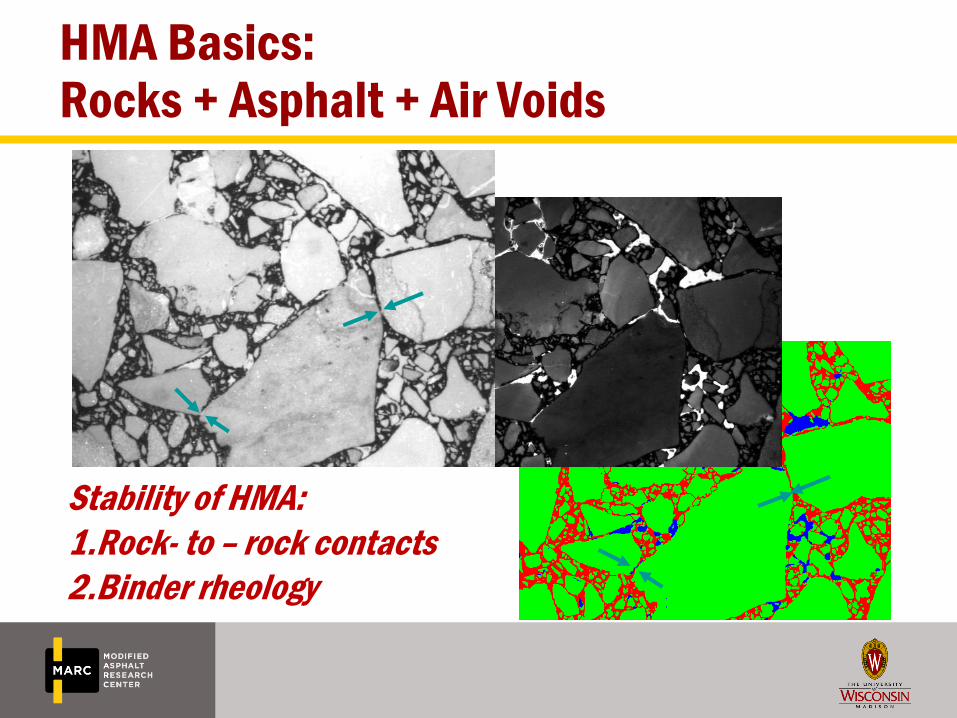
HMA Basics: Rocks + Asphalt + Air Voids
Stability of HMA:
1.Rock- to – rock contacts
2.Binder rheology
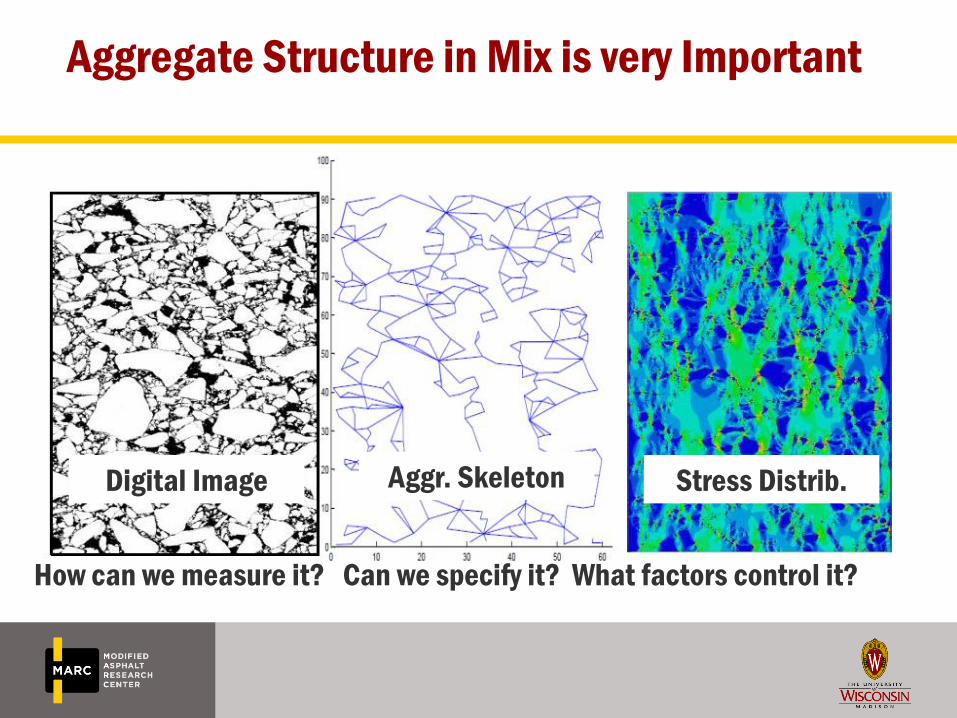
Aggregate Structure in Mix is very Important
Digital Image Aggr. Skeleton Stress Distrib.
How can we measure it? Can we specify it? What factors control it?
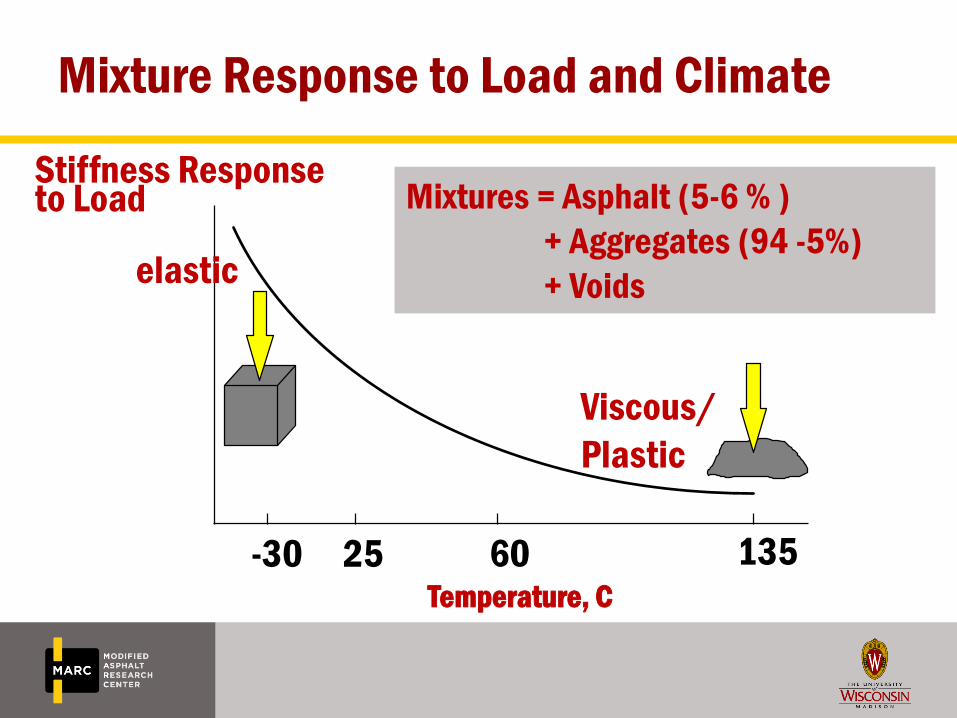
Temperature, C
Stiffness Responseto Load
-30 25 60 135
elastic
Viscous/
Plastic
Mixtures = Asphalt (5-6 % )
+ Aggregates (94 -5%)
+ Voids
Mixture Response to Load and Climate
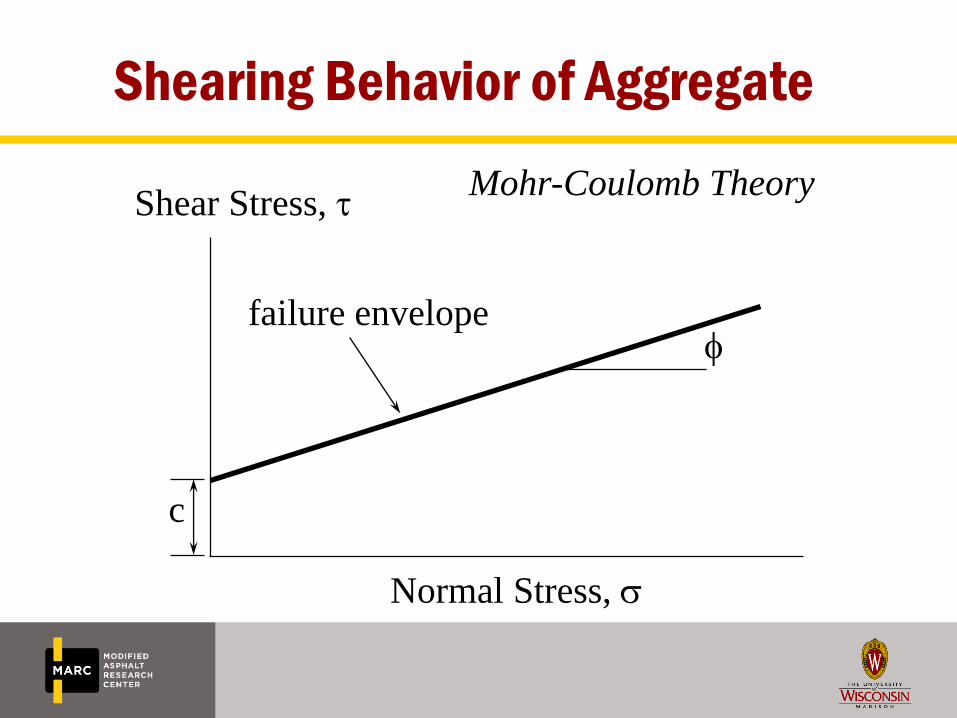
Shearing Behavior of Aggregate
Shear Stress, t
Normal Stress, s
f
c
failure envelope
Mohr-Coulomb Theory
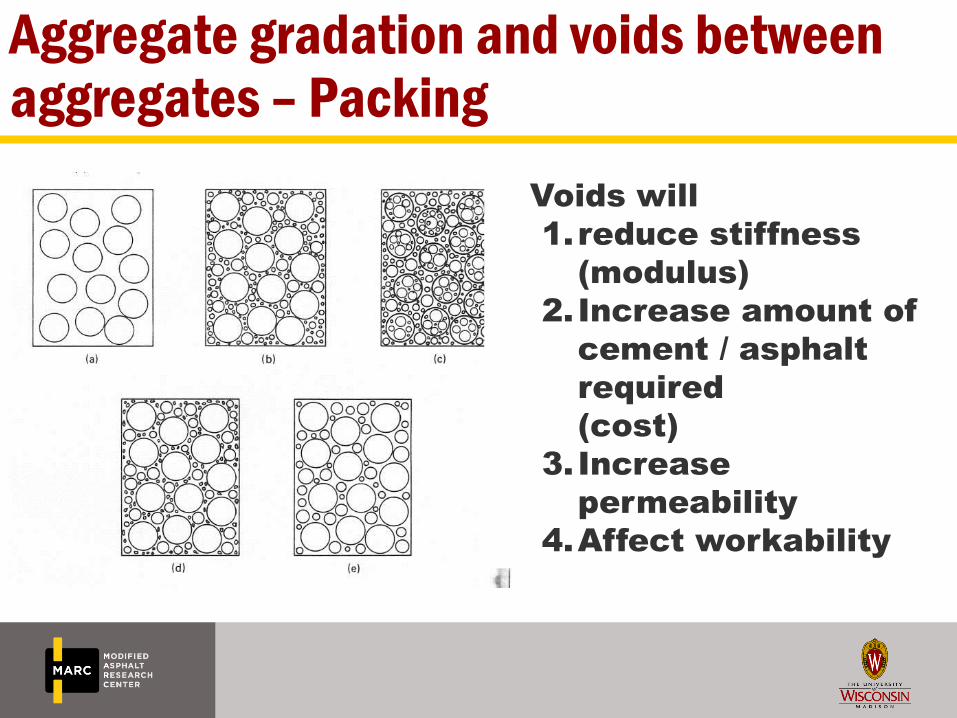
Aggregate gradation and voids between aggregates – Packing
Voids will
1.reduce stiffness
(modulus)
2. Increase amount of
cement / asphalt
required
(cost)
3. Increase
permeability
4.Affect workability
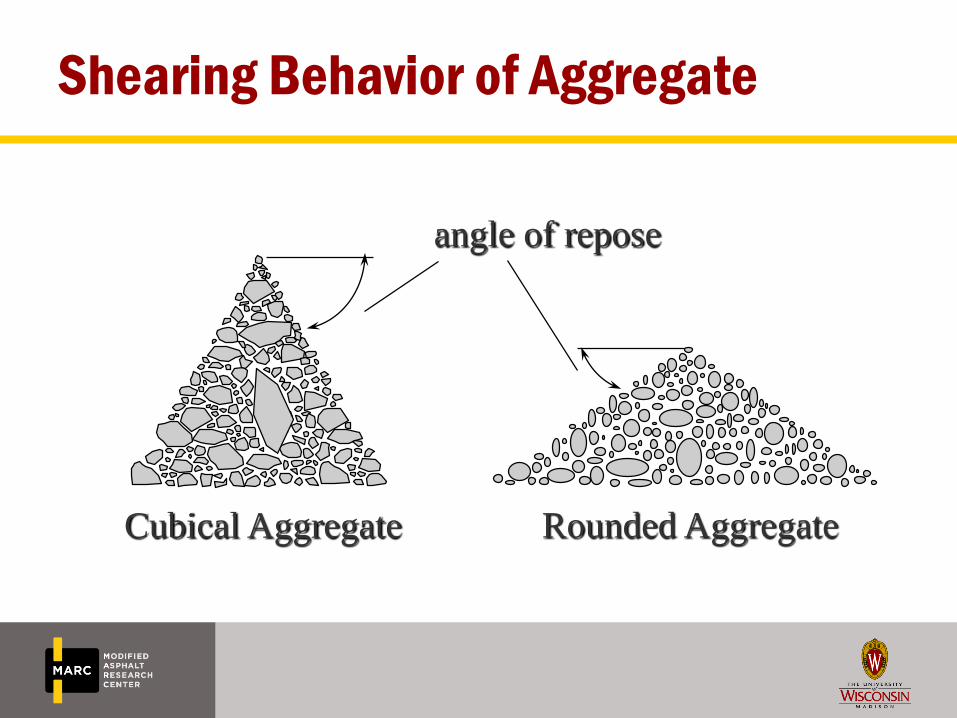
Cubical Aggregate Rounded Aggregate
angle of repose
Shearing Behavior of Aggregate
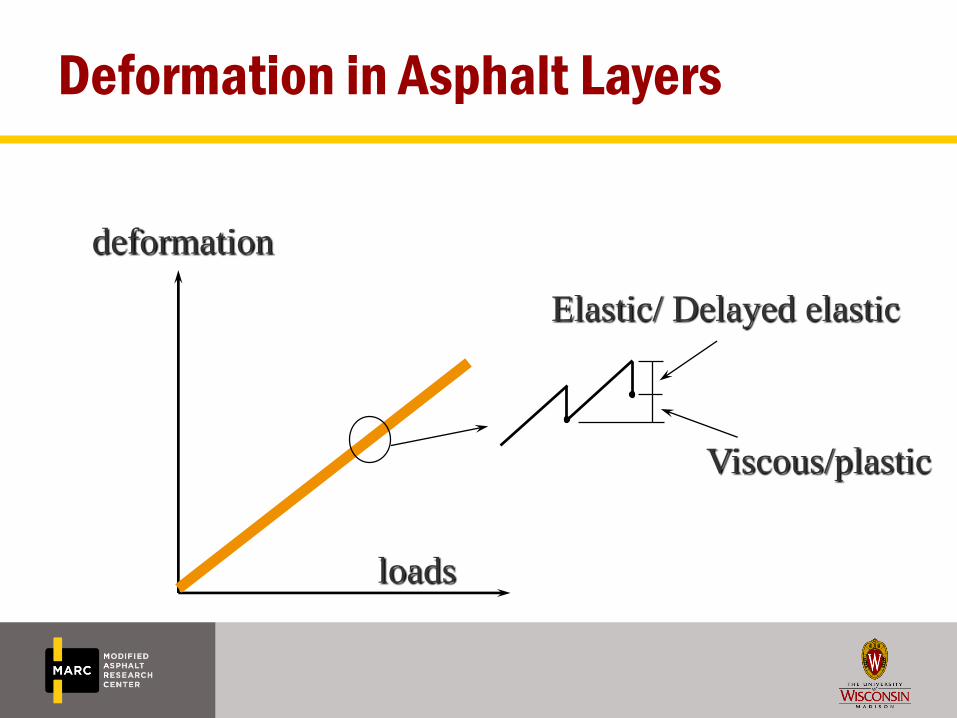
Deformation in Asphalt Layers
deformation
loads
Elastic/ Delayed elastic
Viscous/plastic
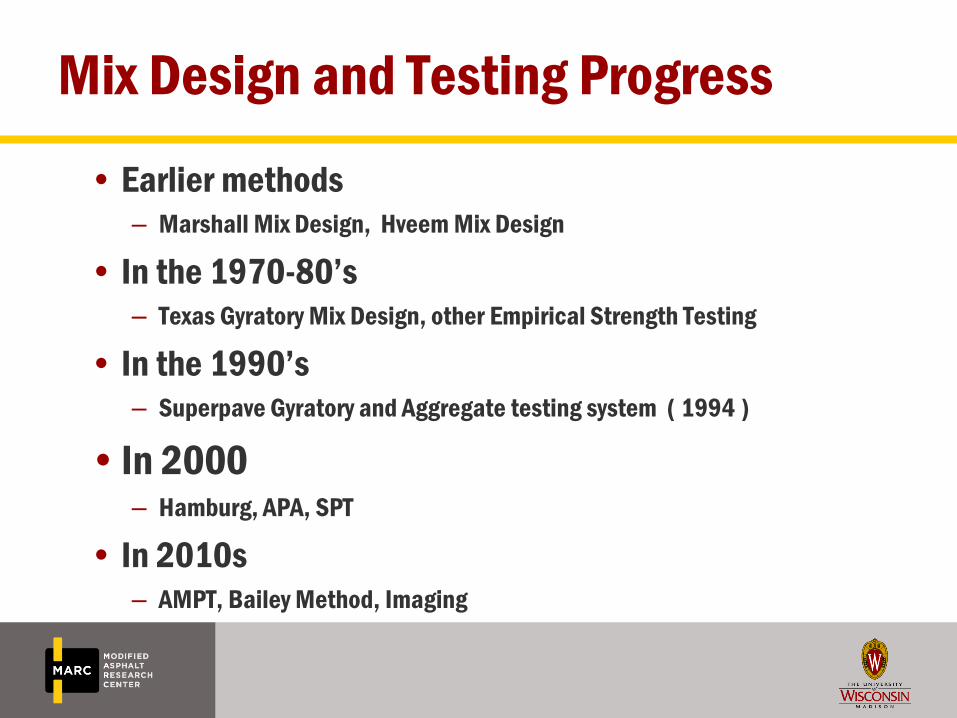
Mix Design and Testing Progress
• Earlier methods – Marshall Mix Design, Hveem Mix Design
• In the 1970-80’s – Texas Gyratory Mix Design, other Empirical Strength Testing
• In the 1990’s – Superpave Gyratory and Aggregate testing system ( 1994 )
• In 2000– Hamburg, APA, SPT
• In 2010s – AMPT, Bailey Method, Imaging
Pavement Temperature, C
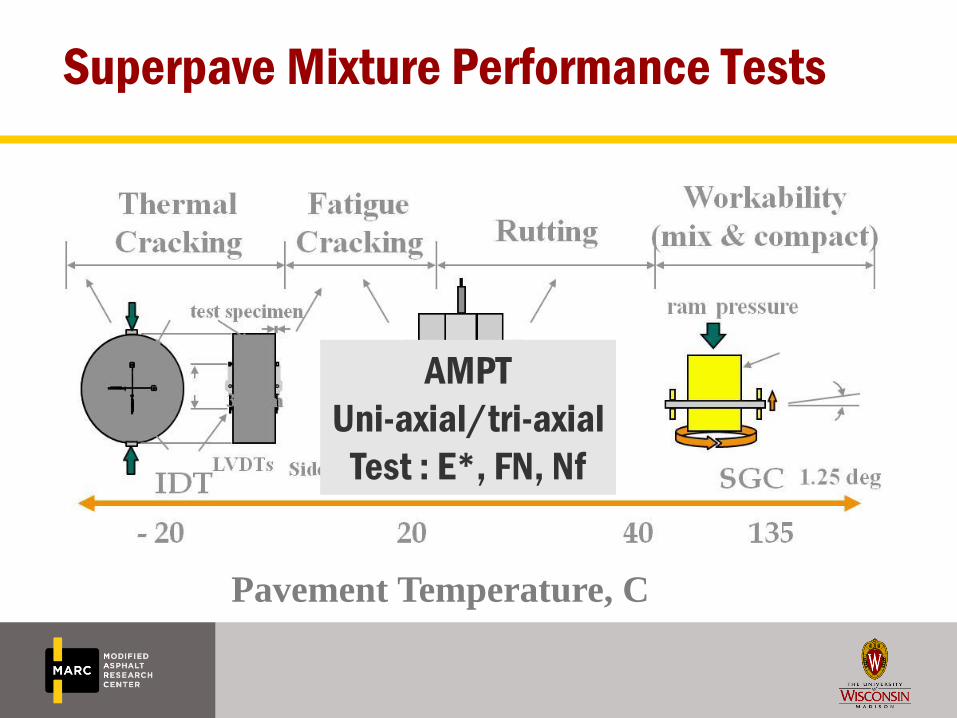
Superpave Mixture Performance Tests
AMPT
Uni-axial/tri-axial
Test : E*, FN, Nf
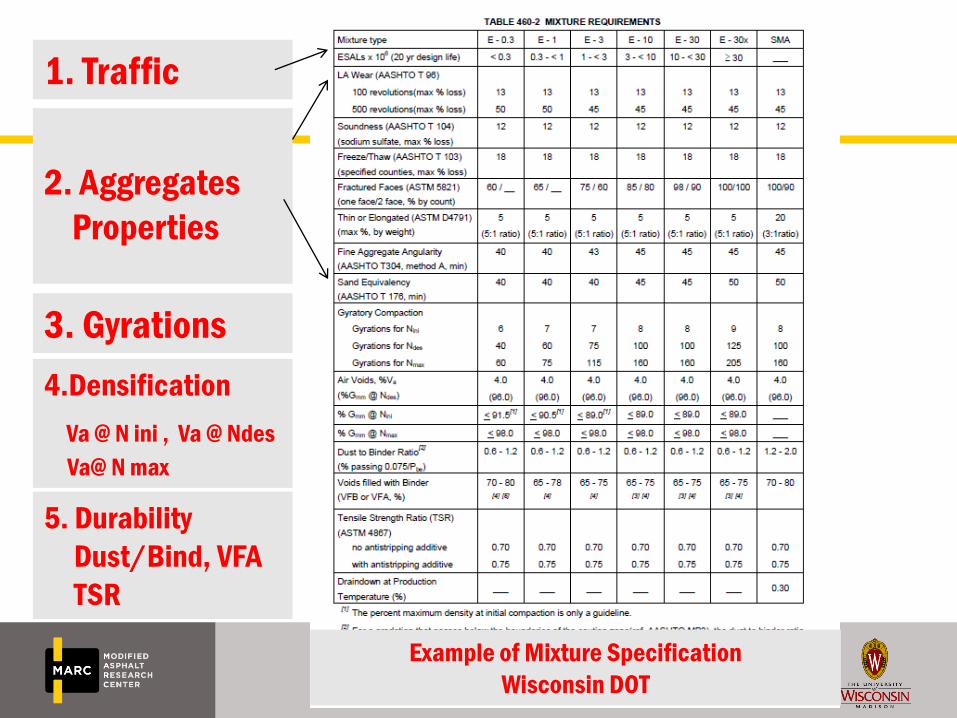
2. Aggregates
Properties
1. Traffic
3. Gyrations
4.Densification
Va @ N ini , Va @ Ndes
Va@ N max
5. Durability
Dust/Bind, VFA
TSR
Example of Mixture Specification
Wisconsin DOT

MARC studies: We Measure aggregate structure iPas1 … iPas2 … (Image Processing and Analysis Software)
• iPas: A tool to identify
aggregate structure.
• Give statistics about
– Packing
– Connectivity
– Orientation
– Spatial segregation Contact Length
Contact Zone
Stress Path
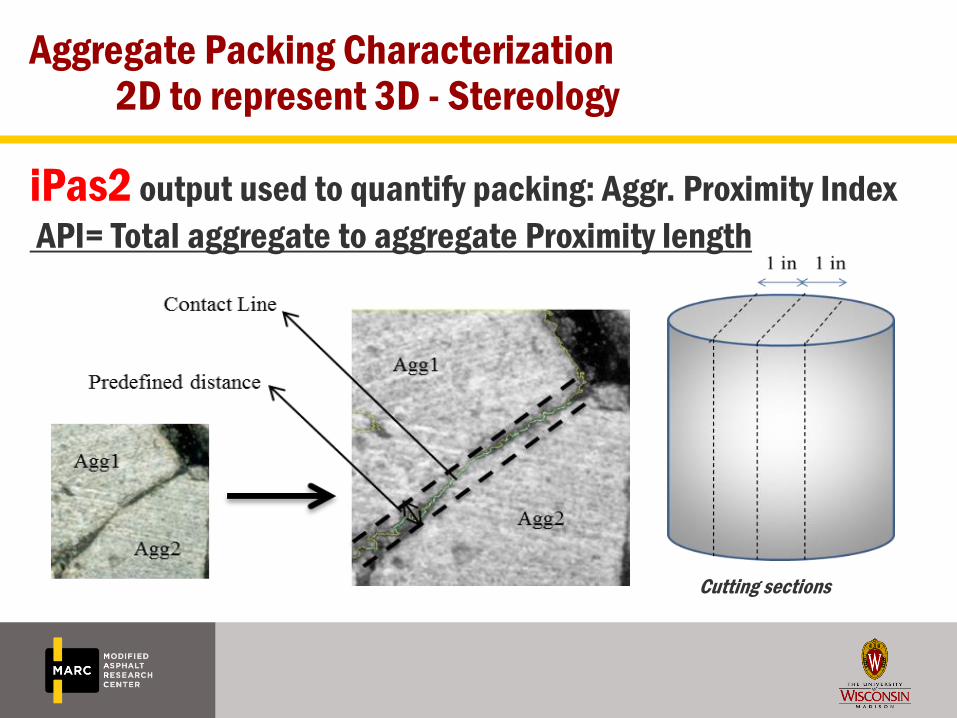
Aggregate Packing Characterization2D to represent 3D - Stereology
iPas2 output used to quantify packing: Aggr. Proximity Index
API= Total aggregate to aggregate Proximity length
Cutting sections
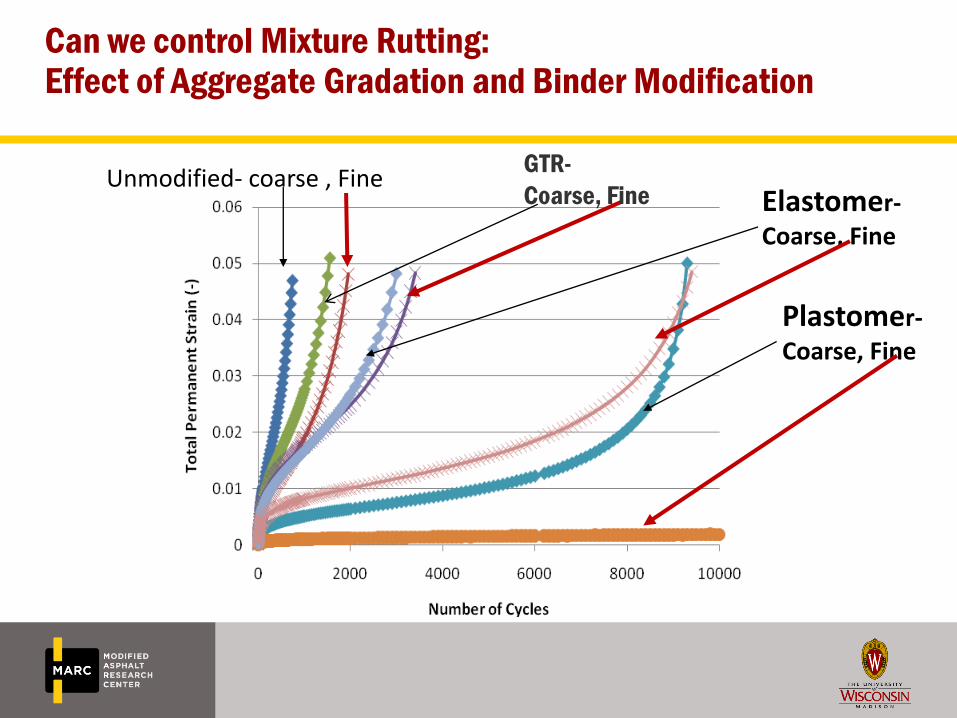
Can we control Mixture Rutting: Effect of Aggregate Gradation and Binder Modification
Elastomer-
Coarse, Fine
Plastomer-
Coarse, Fine
Unmodified- coarse , FineGTR-
Coarse, Fine
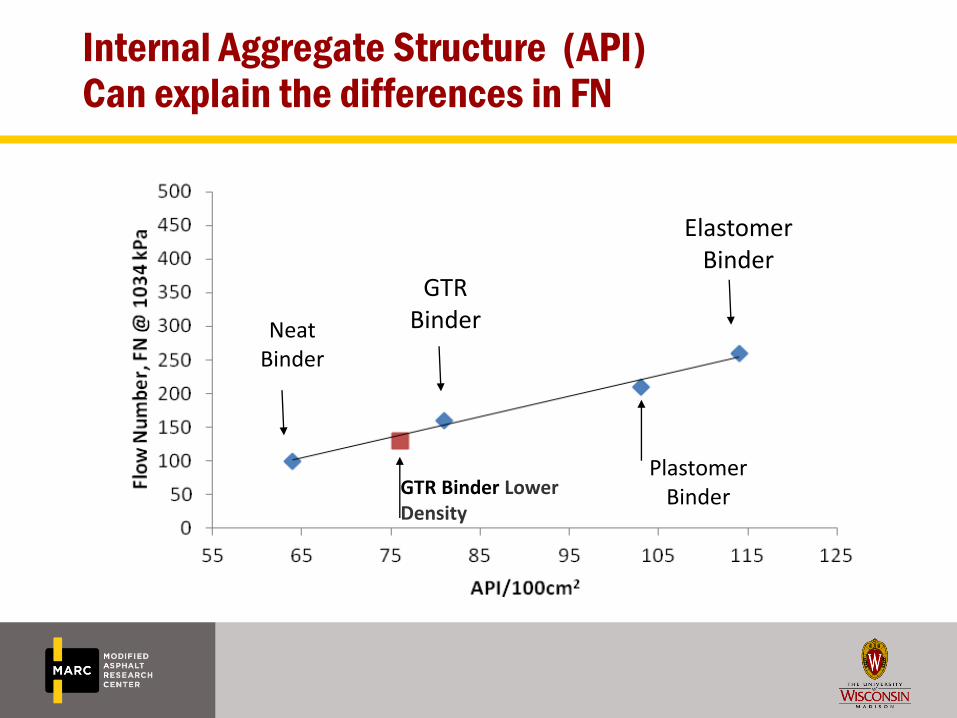
Internal Aggregate Structure (API) Can explain the differences in FN
Neat Binder
Elastomer Binder
GTR Binder
GTR Binder Lower Density
PlastomerBinder
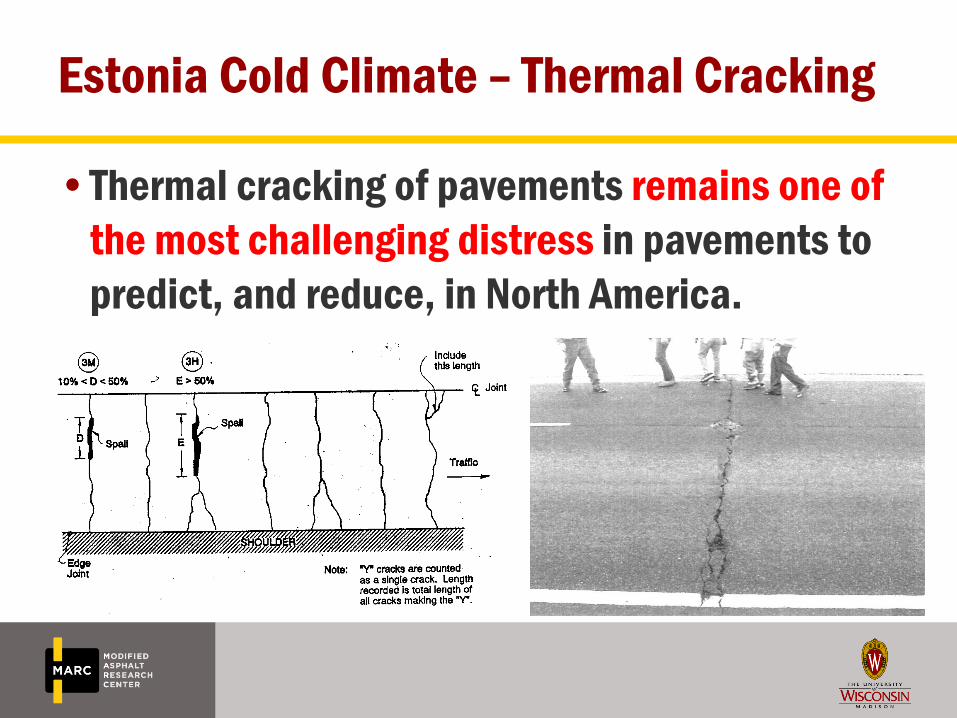
Estonia Cold Climate – Thermal Cracking
•Thermal cracking of pavements remains one of
the most challenging distress in pavements to
predict, and reduce, in North America.
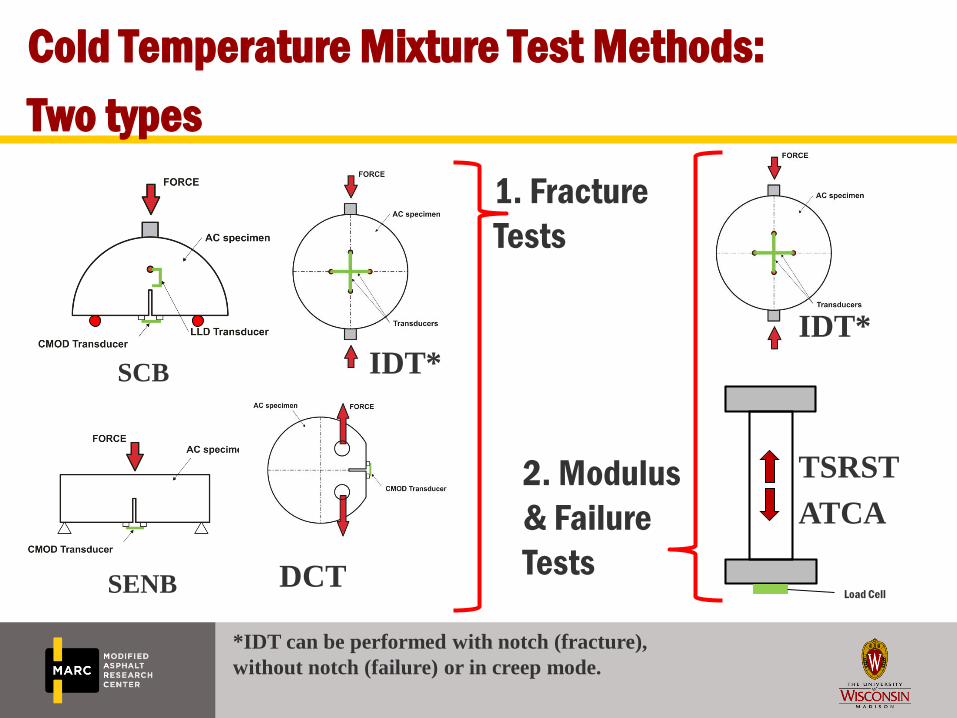
Cold Temperature Mixture Test Methods:
Two types
SCB
IDT*
SENB DCT
1. Fracture
Tests
2. Modulus
& Failure
TestsLoad Cell
TSRST
ATCA
*IDT can be performed with notch (fracture),
without notch (failure) or in creep mode.
IDT*
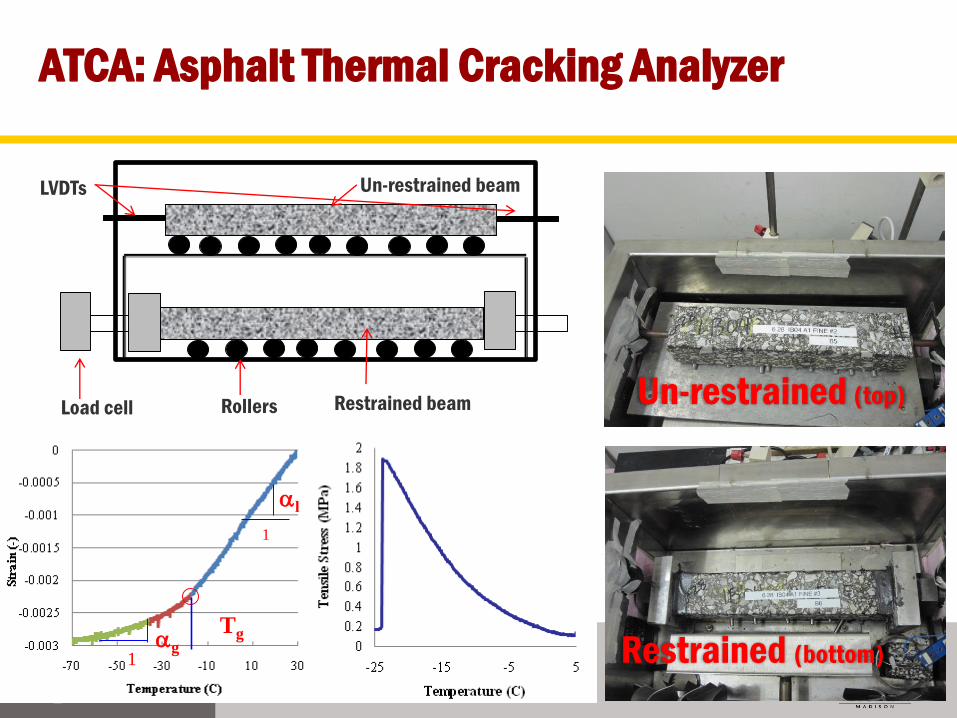
ATCA: Asphalt Thermal Cracking Analyzer
Load cell Rollers Restrained beam
Un-restrained beamLVDTs
Un-restrained (top)
Restrained (bottom)1g
1
l
Tg
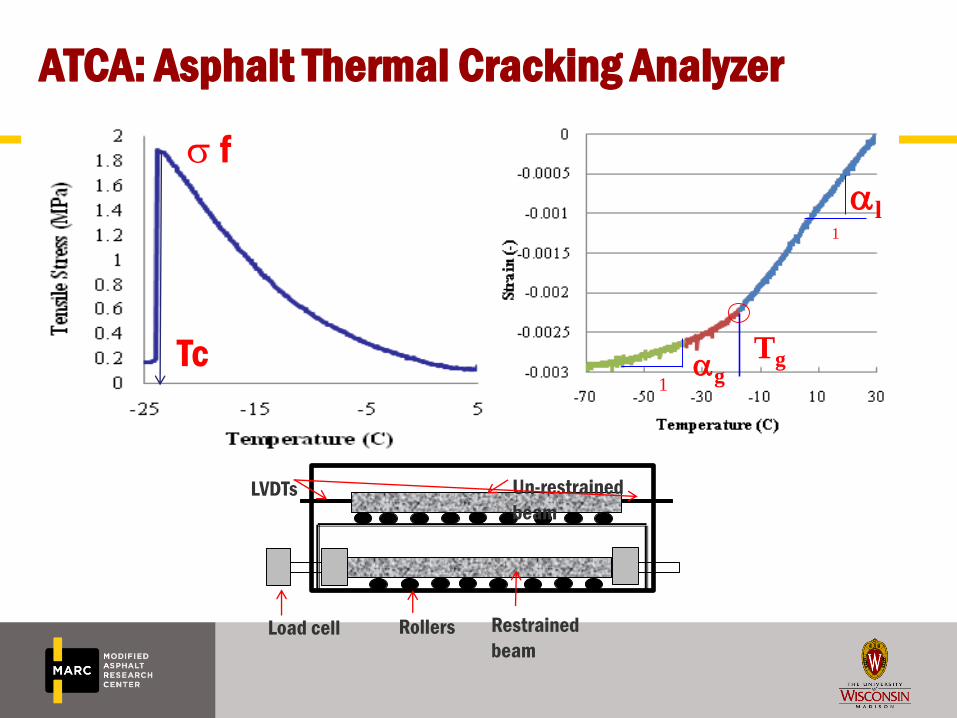
ATCA: Asphalt Thermal Cracking Analyzer
Load cell Rollers Restrained
beam
Un-restrained
beam
LVDTs
1g
1
l
Tg
s f
Tc
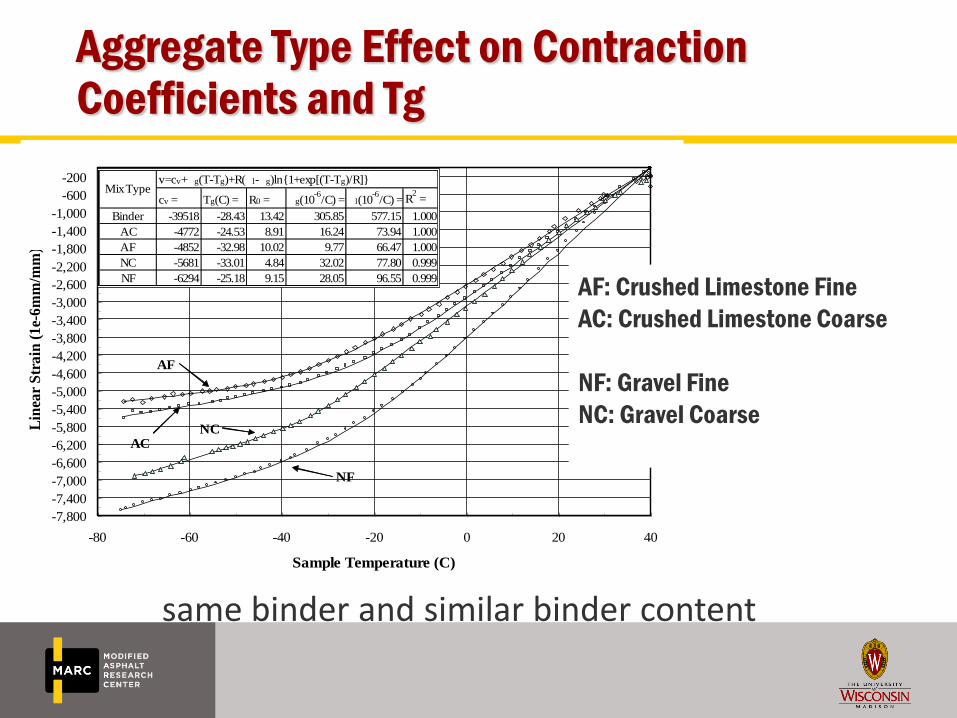
Aggregate Type Effect on Contraction Coefficients and Tg
-7,800
-7,400
-7,000
-6,600
-6,200
-5,800
-5,400
-5,000
-4,600
-4,200
-3,800
-3,400
-3,000
-2,600
-2,200
-1,800
-1,400
-1,000
-600
-200
-80 -60 -40 -20 0 20 40
Sample Temperature (C)
Lin
ear
Str
ain
(1
e-6
mm
/mm
)
cv = Tg(C) = R0 = g(10-6
/C) = l(10-6
/C) = R2 =
Binder -39518 -28.43 13.42 305.85 577.15 1.000
AC -4772 -24.53 8.91 16.24 73.94 1.000
AF -4852 -32.98 10.02 9.77 66.47 1.000
NC -5681 -33.01 4.84 32.02 77.80 0.999
NF -6294 -25.18 9.15 28.05 96.55 0.999
Mix Typev=cv+ g(T-Tg)+R( l- g)ln{1+exp[(T-Tg)/R]}
AF
ACNC
NF
same binder and similar binder content
AF: Crushed Limestone Fine
AC: Crushed Limestone Coarse
NF: Gravel Fine
NC: Gravel Coarse
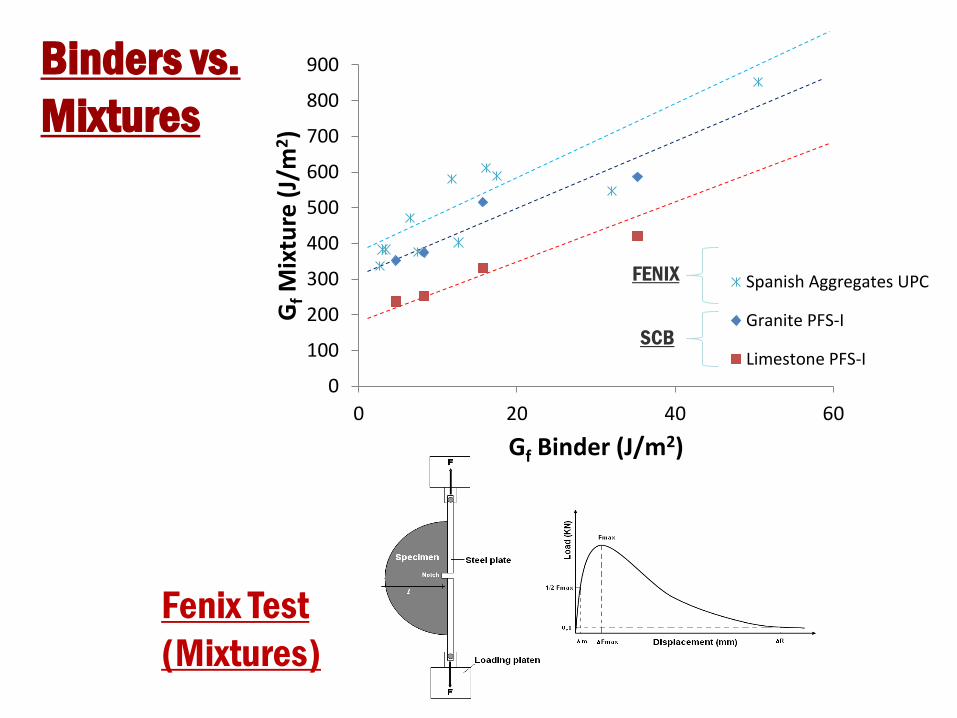
Fenix Test
(Mixtures)
FENIX
SCB
Binders vs.
Mixtures
0
100
200
300
400
500
600
700
800
900
0 20 40 60
GfM
ixtu
re (
J/m
2)
Gf Binder (J/m2)
Spanish Aggregates UPC
Granite PFS-I
Limestone PFS-I
0
100
200
300
400
500
600
700
0 10 20 30 40 50
GfM
ixtu
re,
J/m
2
Gf Binder, J/m2
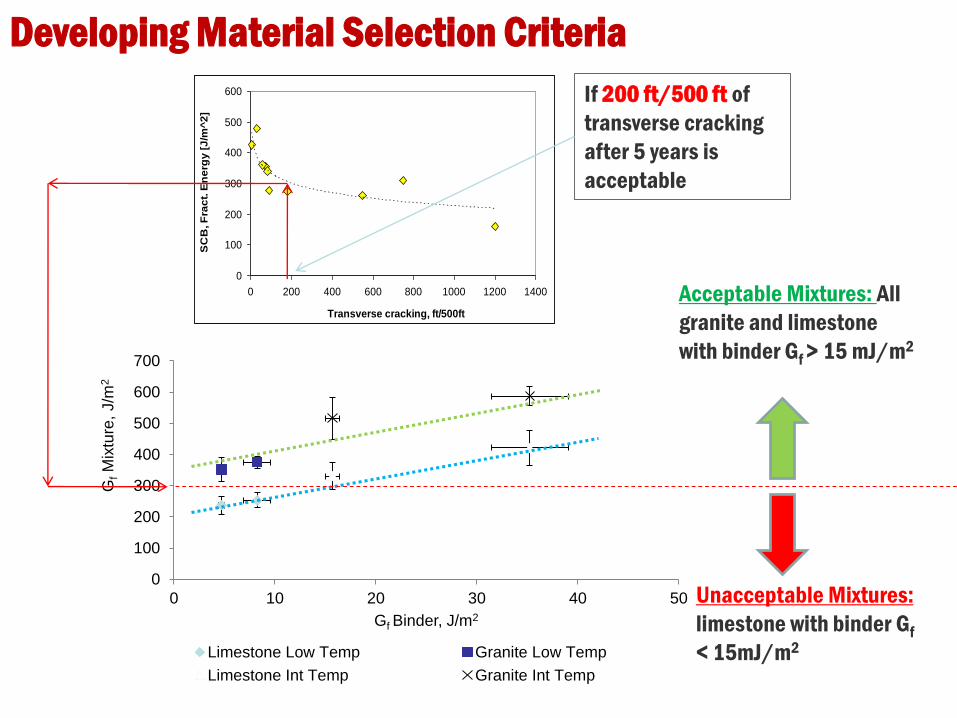
Limestone Low Temp Granite Low Temp
Limestone Int Temp Granite Int Temp
0
100
200
300
400
500
600
0 200 400 600 800 1000 1200 1400
Transverse cracking, ft/500ft
SC
B, F
rac
t. E
ne
rgy
[J
/m^
2]
Acceptable Mixtures: All
granite and limestone
with binder Gf > 15 mJ/m2
If 200 ft/500 ft of
transverse cracking
after 5 years is
acceptable
Unacceptable Mixtures:
limestone with binder Gf
< 15mJ/m2
Developing Material Selection Criteria
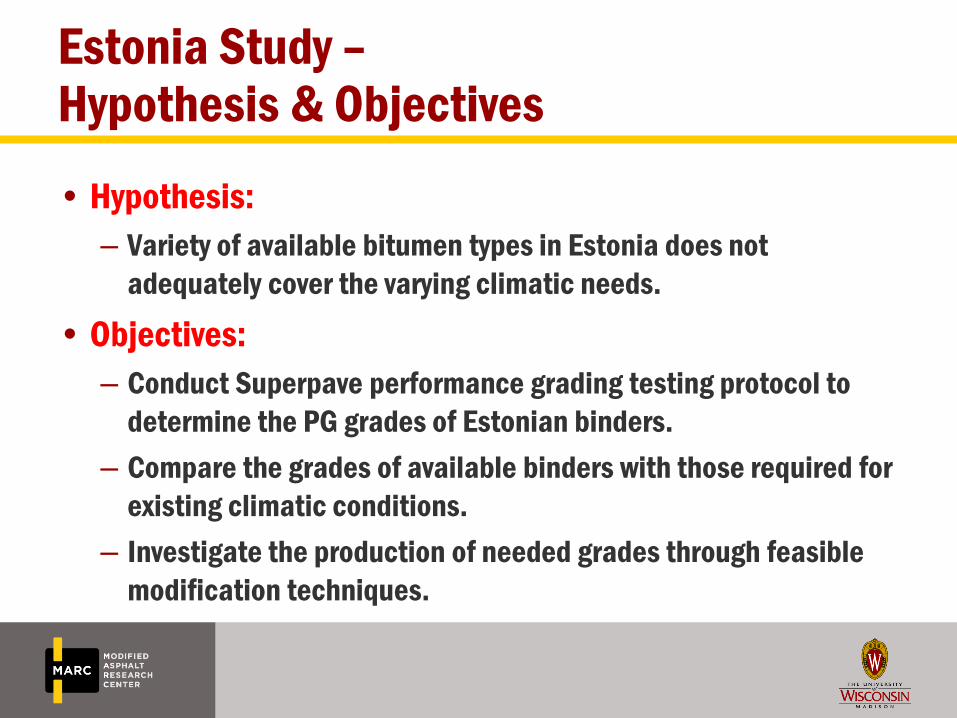
Estonia Study –Hypothesis & Objectives
• Hypothesis:
– Variety of available bitumen types in Estonia does not
adequately cover the varying climatic needs.
• Objectives:
– Conduct Superpave performance grading testing protocol to
determine the PG grades of Estonian binders.
– Compare the grades of available binders with those required for
existing climatic conditions.
– Investigate the production of needed grades through feasible
modification techniques.
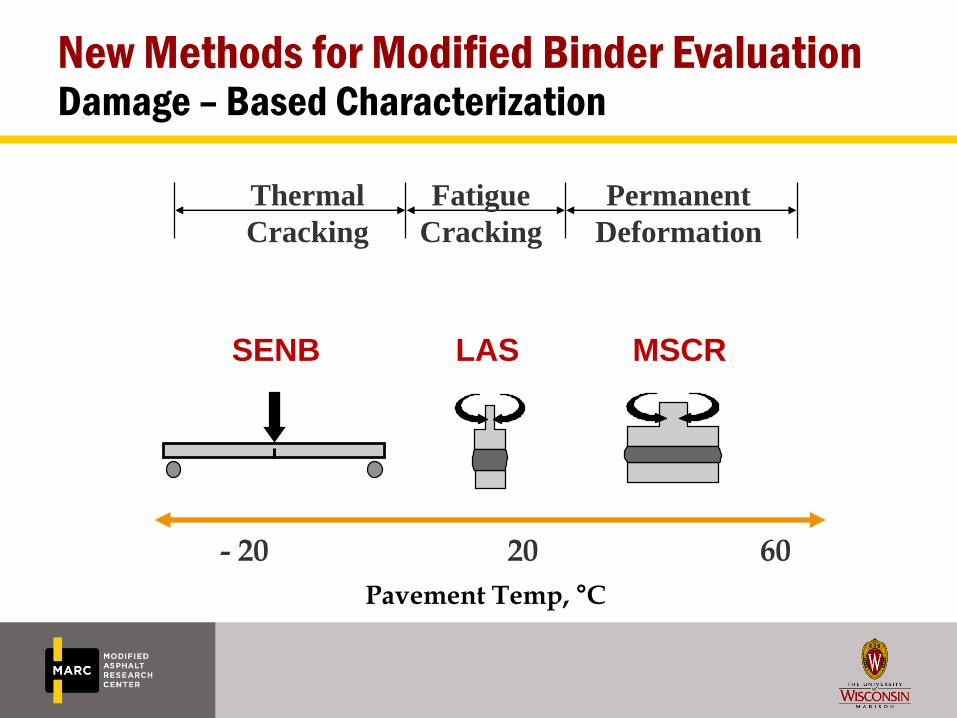
New Methods for Modified Binder EvaluationDamage – Based Characterization
- 20 20 60
Thermal
Cracking
Fatigue
Cracking
Permanent
Deformation
LASSENB MSCR
Pavement Temp, °C

Required PG Grades
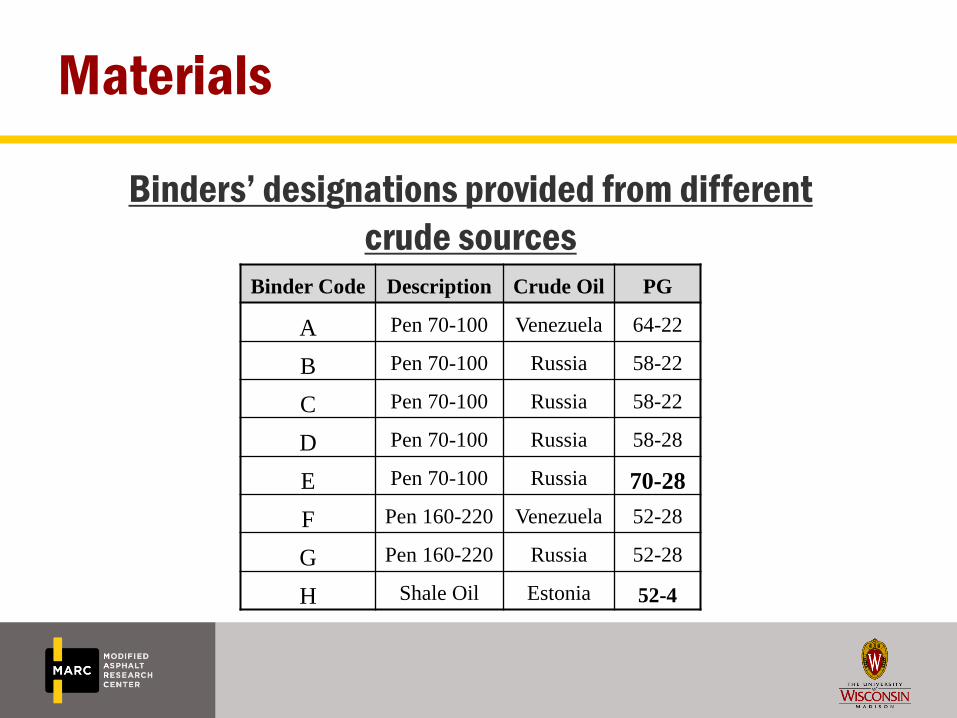
Materials
Binders’ designations provided from different
crude sourcesBinder Code Description Crude Oil PG
A Pen 70-100 Venezuela 64-22
B Pen 70-100 Russia 58-22
C Pen 70-100 Russia 58-22
D Pen 70-100 Russia 58-28
E Pen 70-100 Russia 70-28
F Pen 160-220 Venezuela 52-28
G Pen 160-220 Russia 52-28
H Shale Oil Estonia 52-4
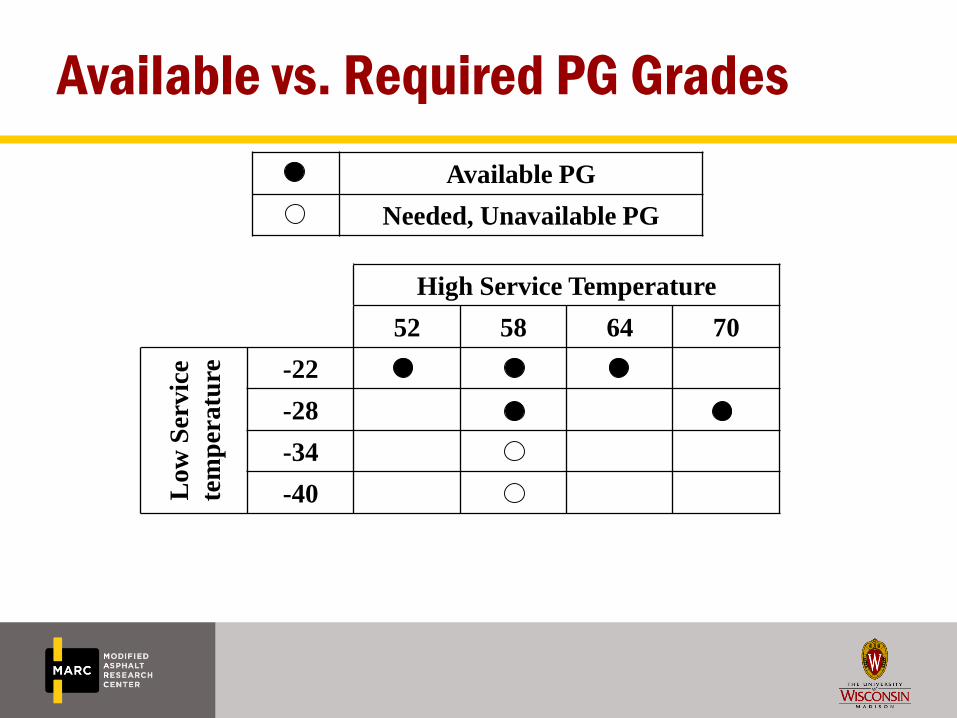
Available vs. Required PG Grades
High Service Temperature
52 58 64 70
Lo
w S
erv
ice
tem
per
atu
re -22
-28
-34
-40
Available PG
Needed, Unavailable PG
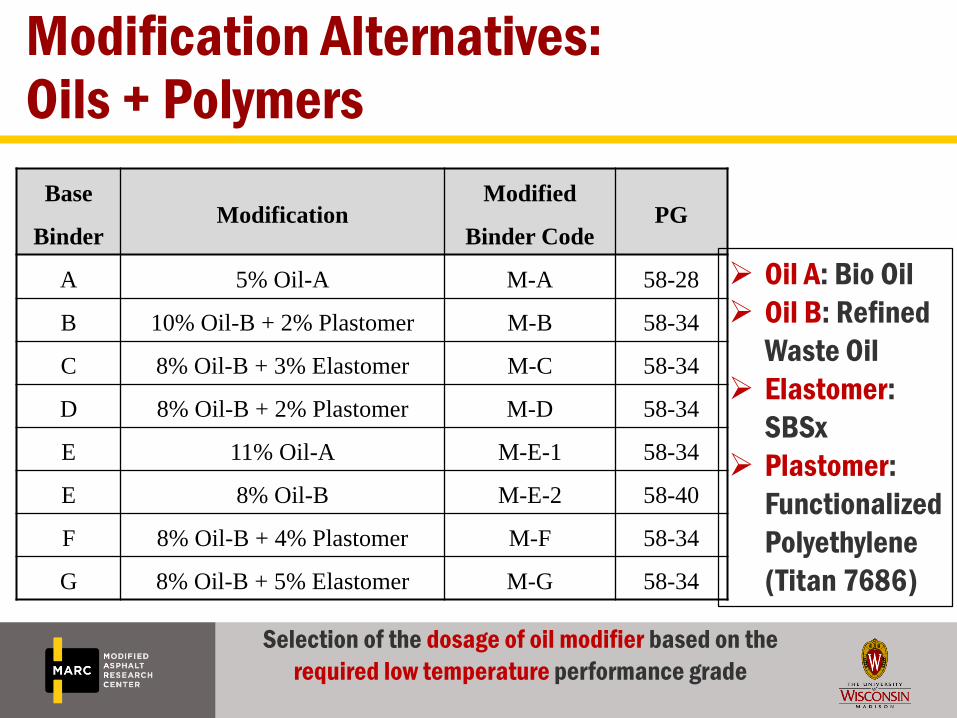
Modification Alternatives:Oils + Polymers
Base
BinderModification
Modified
Binder CodePG
A 5% Oil-A M-A 58-28
B 10% Oil-B + 2% Plastomer M-B 58-34
C 8% Oil-B + 3% Elastomer M-C 58-34
D 8% Oil-B + 2% Plastomer M-D 58-34
E 11% Oil-A M-E-1 58-34
E 8% Oil-B M-E-2 58-40
F 8% Oil-B + 4% Plastomer M-F 58-34
G 8% Oil-B + 5% Elastomer M-G 58-34
Selection of the dosage of oil modifier based on the
required low temperature performance grade
Oil A: Bio Oil
Oil B: Refined
Waste Oil
Elastomer:
SBSx
Plastomer:
Functionalized
Polyethylene
(Titan 7686)
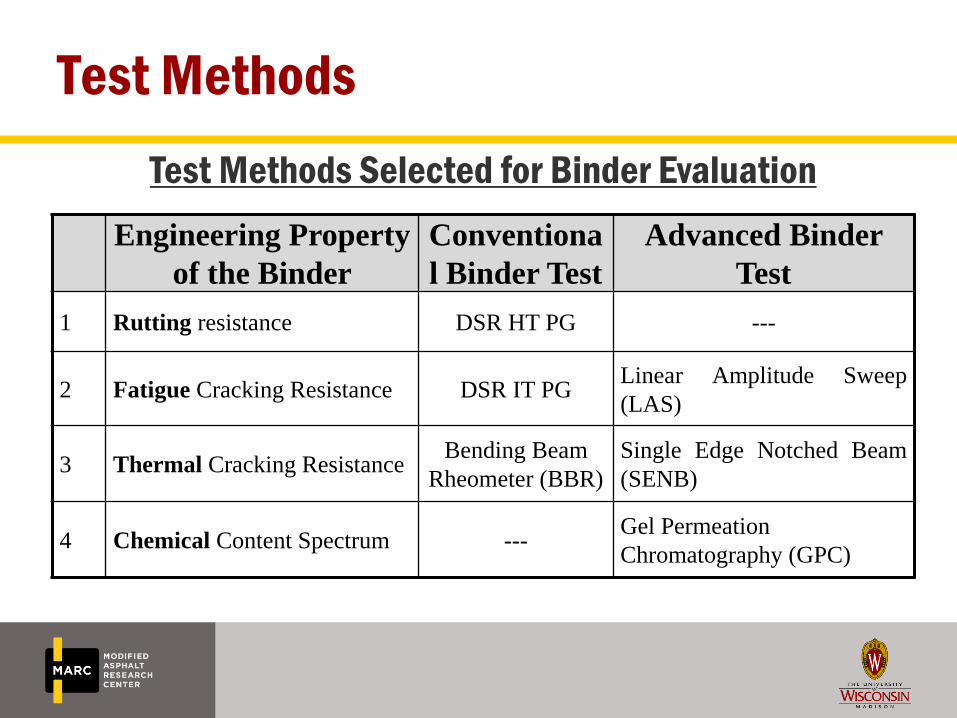
Test Methods
Test Methods Selected for Binder Evaluation
Engineering Property
of the Binder
Conventiona
l Binder Test
Advanced Binder
Test
1 Rutting resistance DSR HT PG ---
2 Fatigue Cracking Resistance DSR IT PGLinear Amplitude Sweep
(LAS)
3 Thermal Cracking Resistance Bending Beam
Rheometer (BBR)
Single Edge Notched Beam
(SENB)
4 Chemical Content Spectrum ---Gel Permeation
Chromatography (GPC)
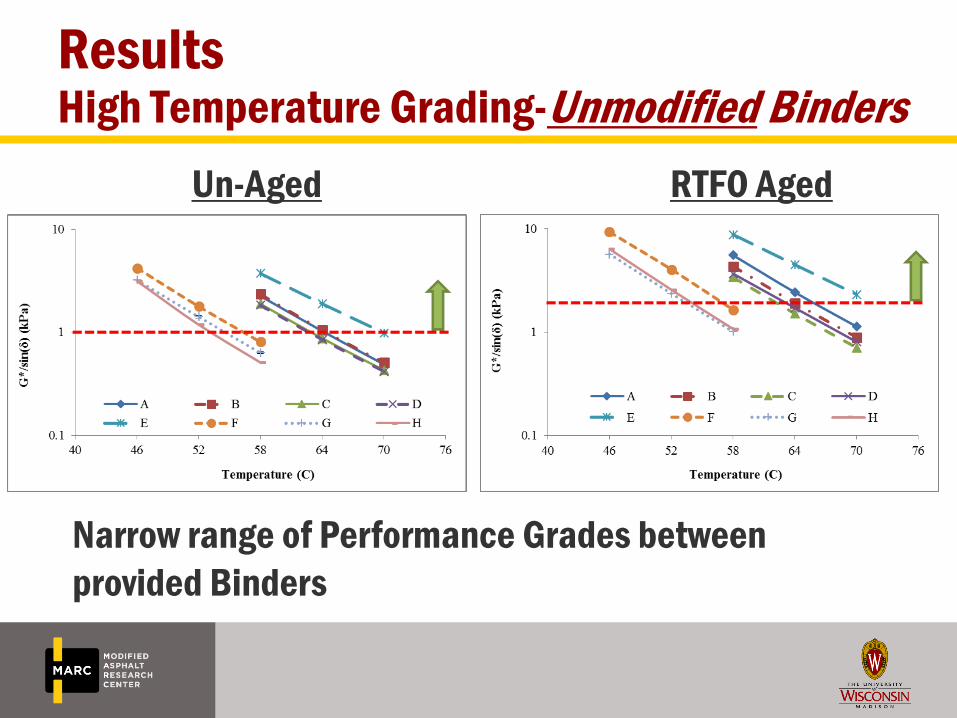
ResultsHigh Temperature Grading-Unmodified Binders
Un-Aged RTFO Aged
Narrow range of Performance Grades between
provided Binders
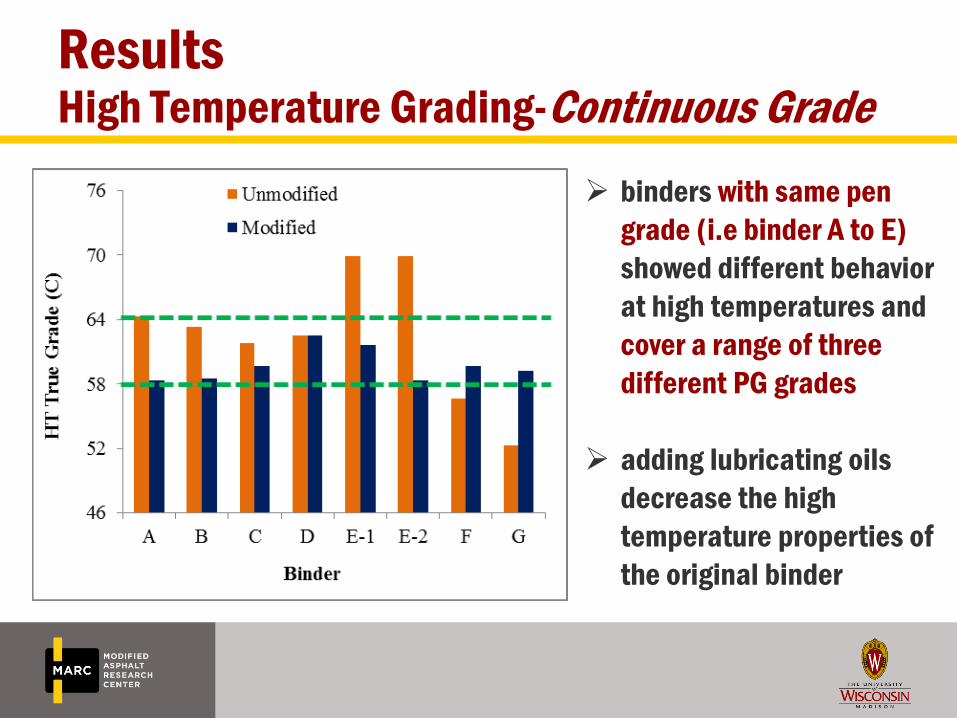
ResultsHigh Temperature Grading-Continuous Grade
binders with same pen
grade (i.e binder A to E)
showed different behavior
at high temperatures and
cover a range of three
different PG grades
adding lubricating oils
decrease the high
temperature properties of
the original binder
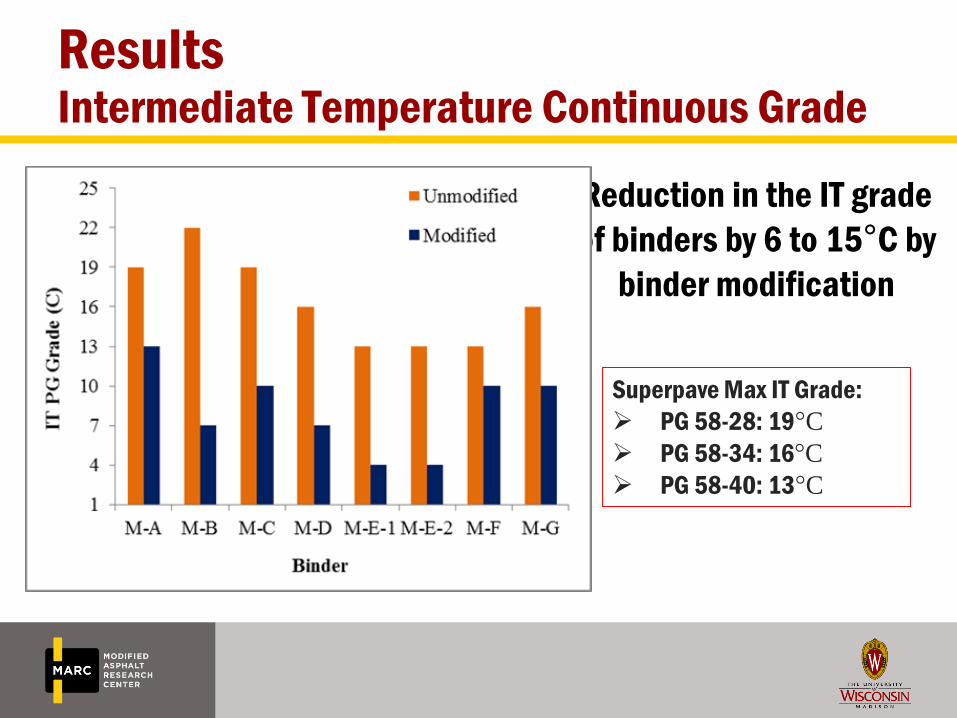
ResultsIntermediate Temperature Continuous Grade
Reduction in the IT grade
of binders by 6 to 15°C by
binder modification
Superpave Max IT Grade:
PG 58-28: 19°C
PG 58-34: 16°C
PG 58-40: 13°C
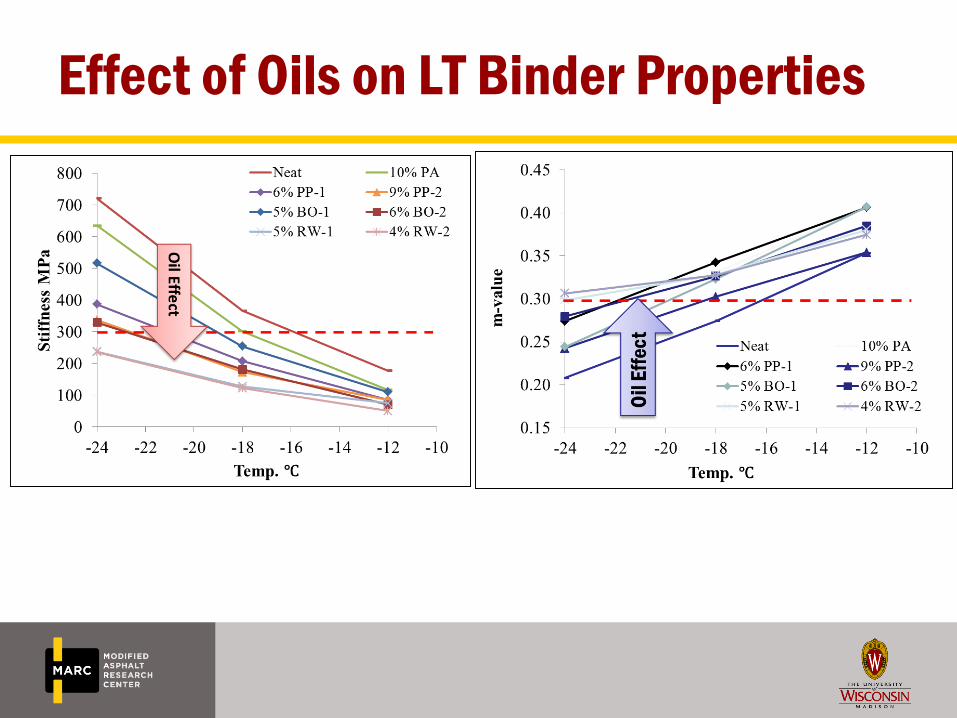
Effect of Oils on LT Binder Properties
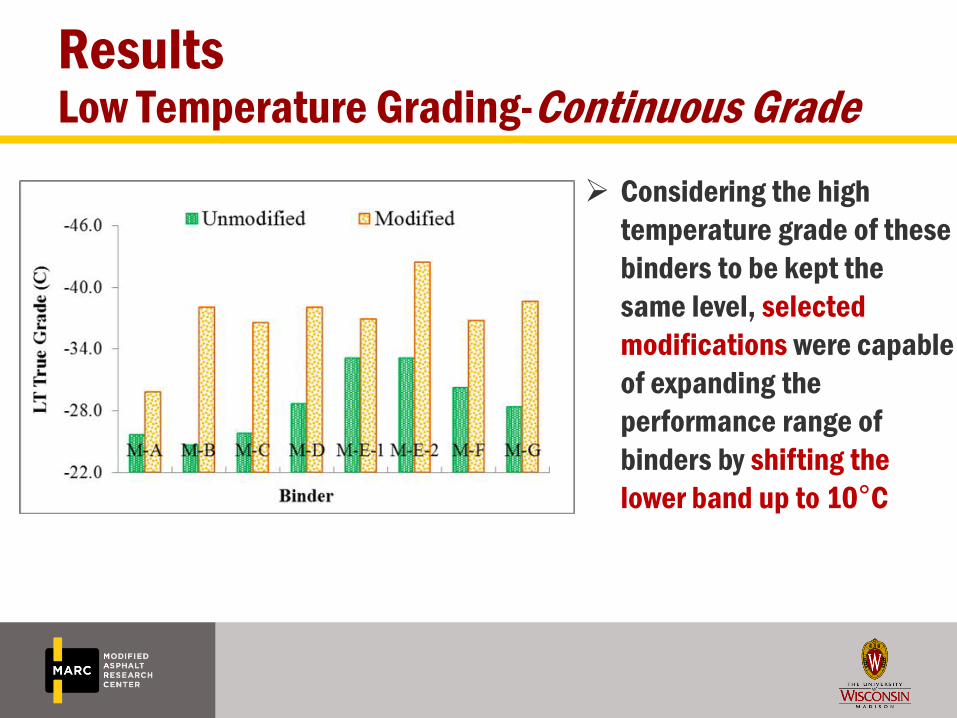
ResultsLow Temperature Grading-Continuous Grade
Considering the high
temperature grade of these
binders to be kept the
same level, selected
modifications were capable
of expanding the
performance range of
binders by shifting the
lower band up to 10°C
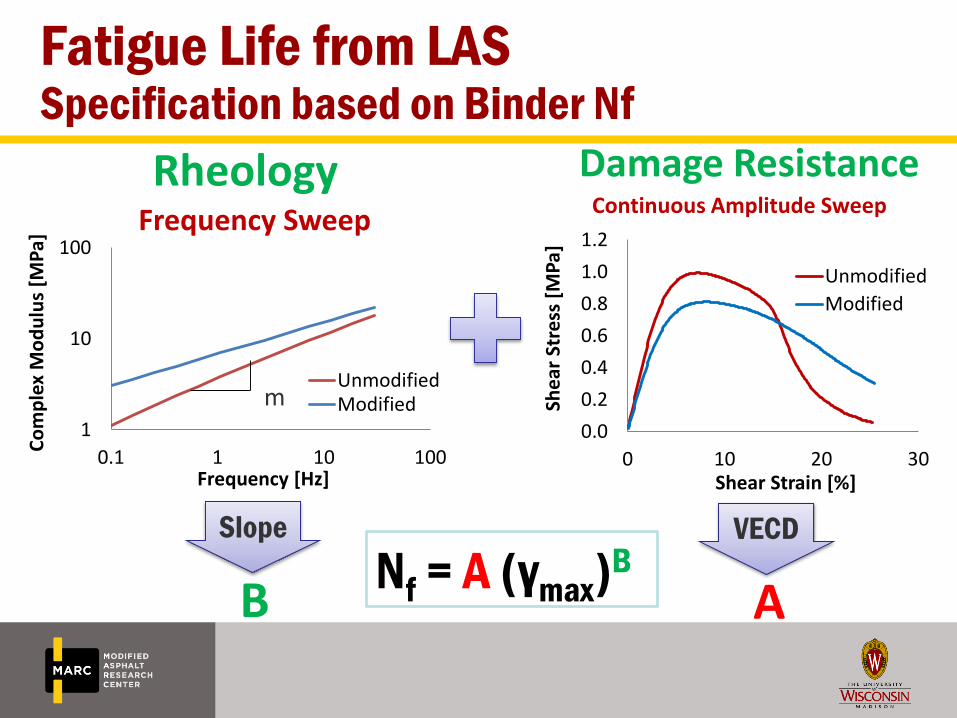
Fatigue Life from LASSpecification based on Binder Nf
1
10
100
0.1 1 10 100
Co
mp
lex
Mo
du
lus
[MP
a]
Frequency [Hz]
Frequency Sweep
UnmodifiedModifiedm
Slope
B
VECD
ANf = A (γmax)
B
Rheology Damage Resistance
0.0
0.2
0.4
0.6
0.8
1.0
1.2
0 10 20 30
She
ar S
tre
ss [
MP
a]
Shear Strain [%]
Continuous Amplitude Sweep
Unmodified
Modified
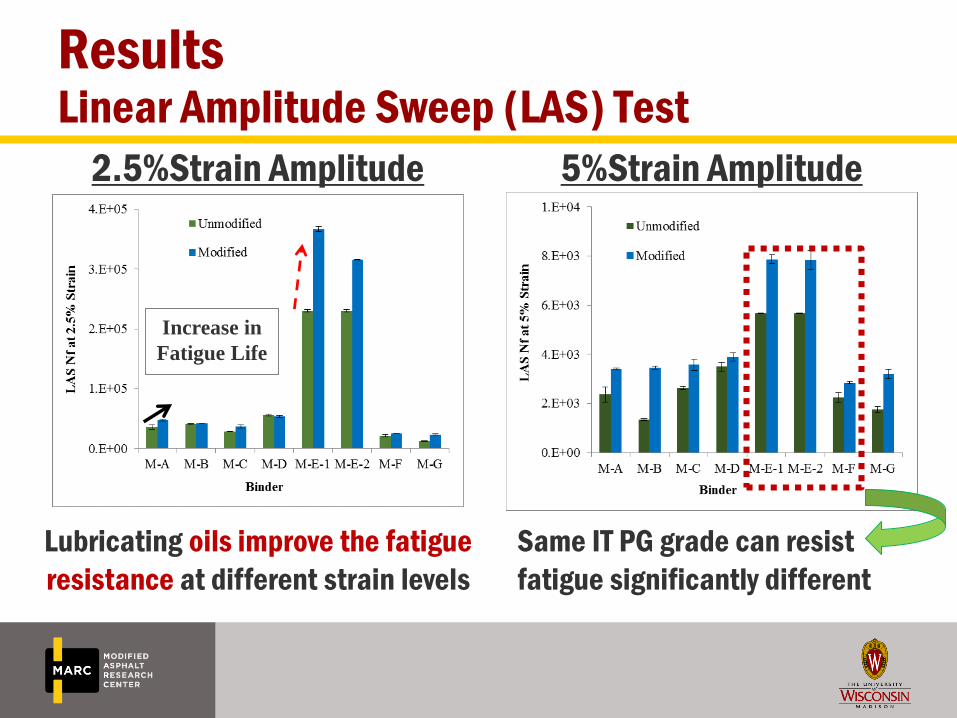
ResultsLinear Amplitude Sweep (LAS) Test
2.5%Strain Amplitude
Same IT PG grade can resist
fatigue significantly different
5%Strain Amplitude
Increase in
Fatigue Life
Lubricating oils improve the fatigue
resistance at different strain levels
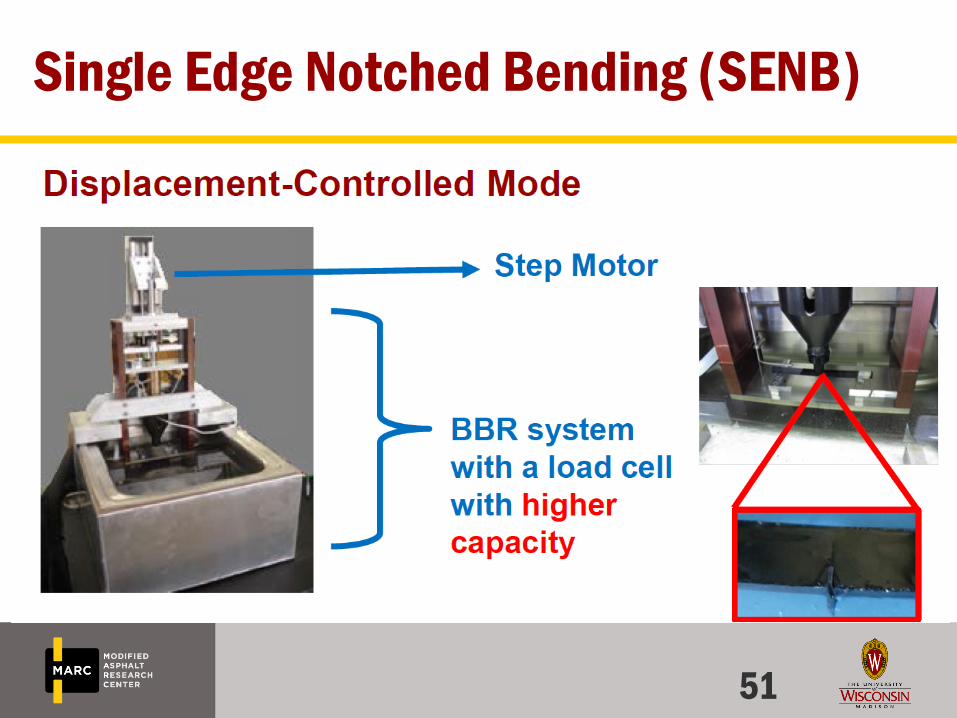
Single Edge Notched Bending (SENB)
51
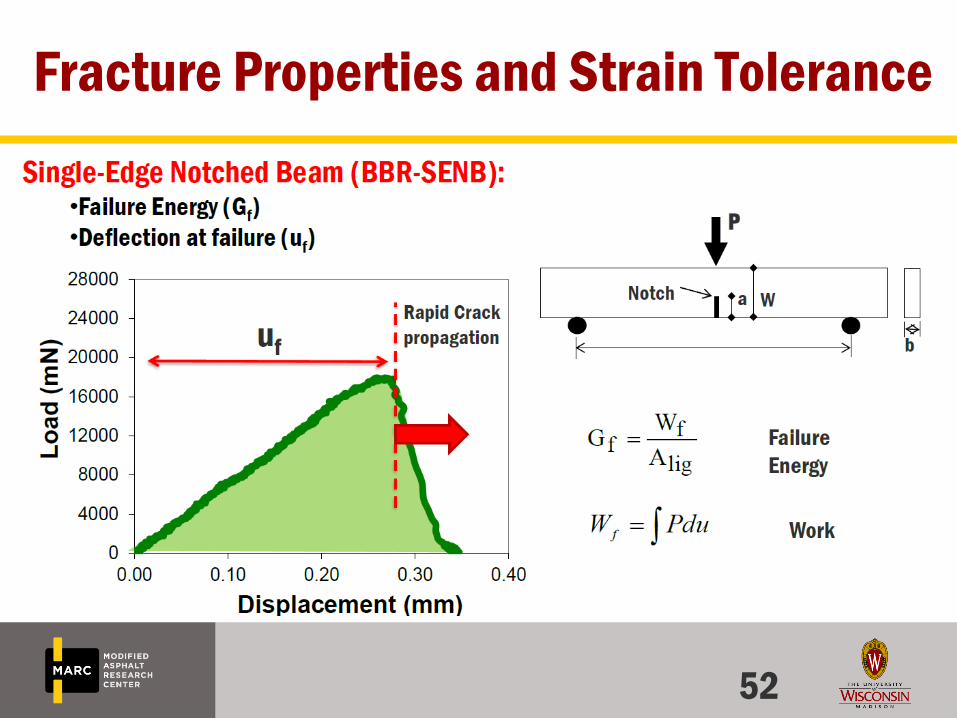
Fracture Properties and Strain Tolerance
52
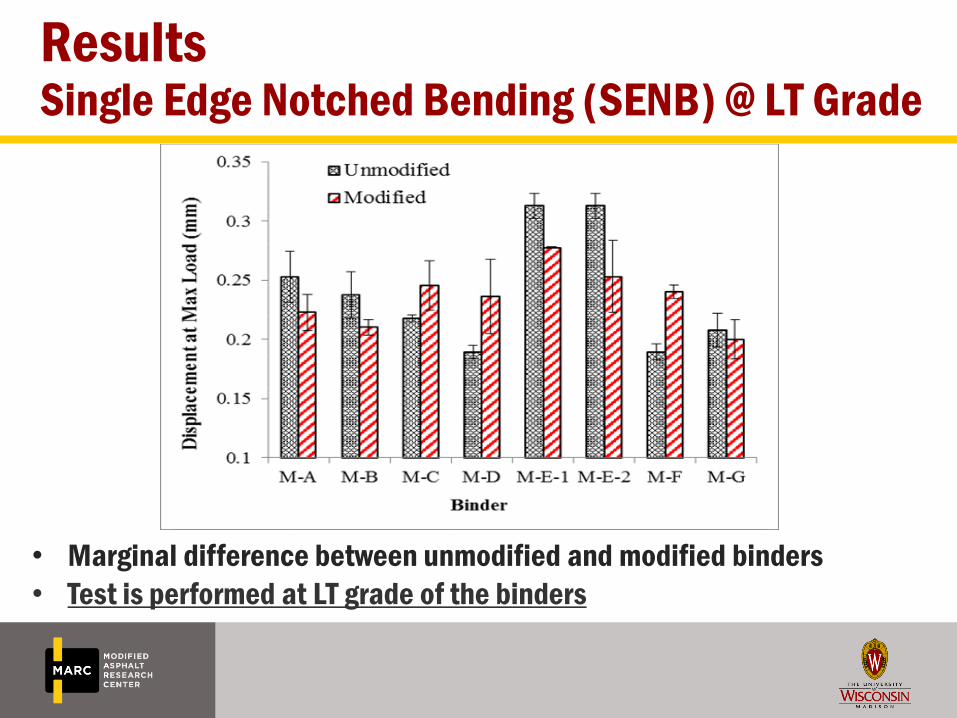
• Marginal difference between unmodified and modified binders
• Test is performed at LT grade of the binders
ResultsSingle Edge Notched Bending (SENB) @ LT Grade
Concluding Remarks-Binder Study
• Estonia will need to use Oil modification to improve
performance of pavements
• Oils could result in lower rutting resistance; need polymers
to offset this effect
• Fatigue resistance varies significantly based on oils
• Impact of oils and polymers vary based on oil type and the
crude source of binder

Concluding Results – General
• Roads are built with mixtures, not Binders!
• Thermal Cracking & rutting are affected by:
– aggregate structure and binder properties.
• Suggestion for Mixture studies:
– Internal structure and resistance to rutting
Ipas and FN
– Coefficient of thermal contraction- ACTA
– Fracture properties
– Moisture damage – Wet Hamburg

Thank You!
www.uwmarc.org
Questions?
Hussain Bahia
Pouya Teymourpour
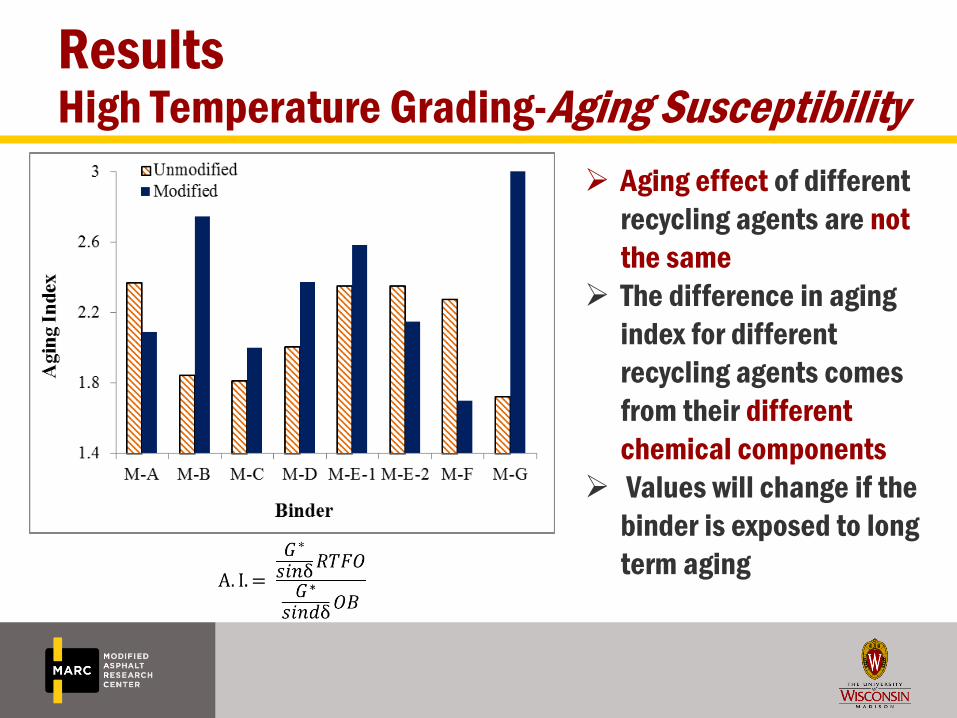
ResultsHigh Temperature Grading-Aging Susceptibility
Aging effect of different
recycling agents are not
the same
The difference in aging
index for different
recycling agents comes
from their different
chemical components
Values will change if the
binder is exposed to long
term aging
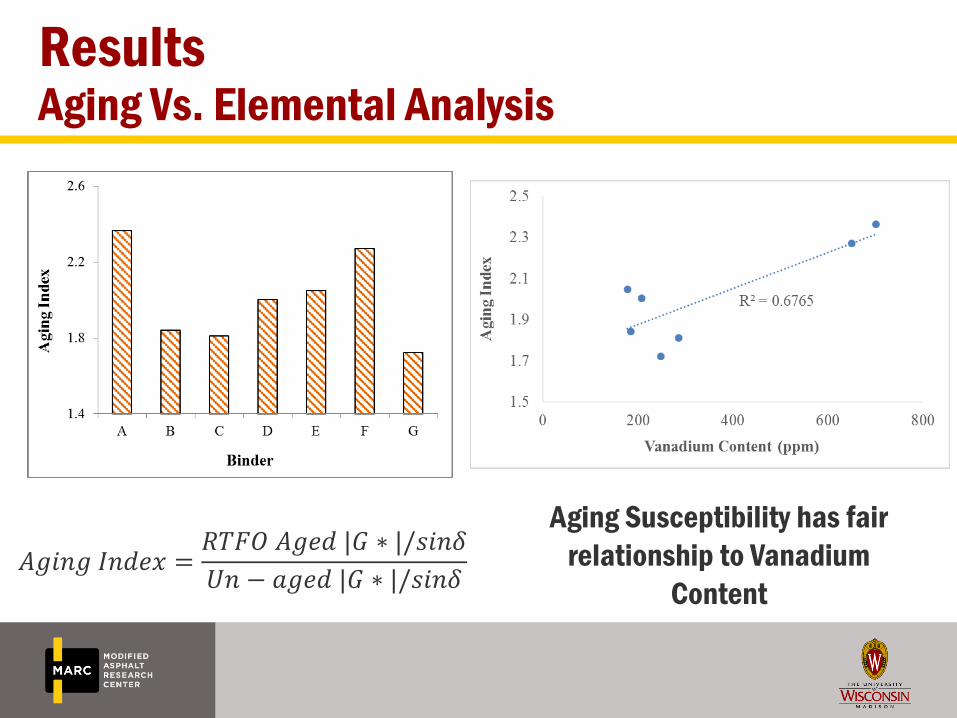
𝐴𝑔𝑖𝑛𝑔 𝐼𝑛𝑑𝑒𝑥 =𝑅𝑇𝐹𝑂 𝐴𝑔𝑒𝑑 |𝐺 ∗ |/𝑠𝑖𝑛𝛿
𝑈𝑛 − 𝑎𝑔𝑒𝑑 |𝐺 ∗ |/𝑠𝑖𝑛𝛿
Aging Susceptibility has fair
relationship to Vanadium
Content
ResultsAging Vs. Elemental Analysis
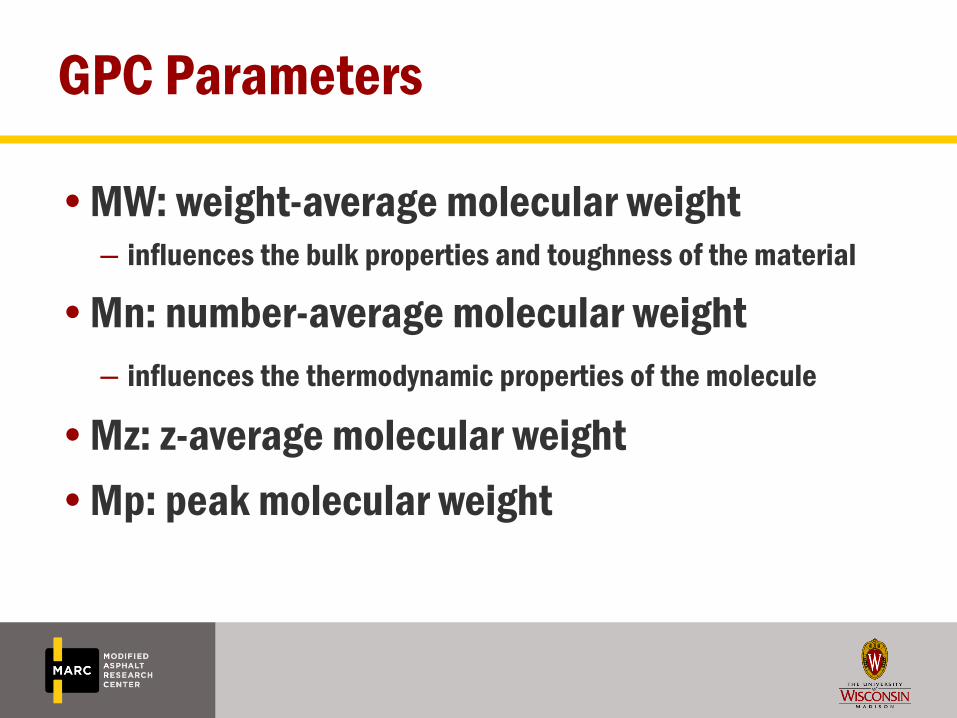
GPC Parameters
•MW: weight-average molecular weight– influences the bulk properties and toughness of the material
•Mn: number-average molecular weight
– influences the thermodynamic properties of the molecule
•Mz: z-average molecular weight
•Mp: peak molecular weight
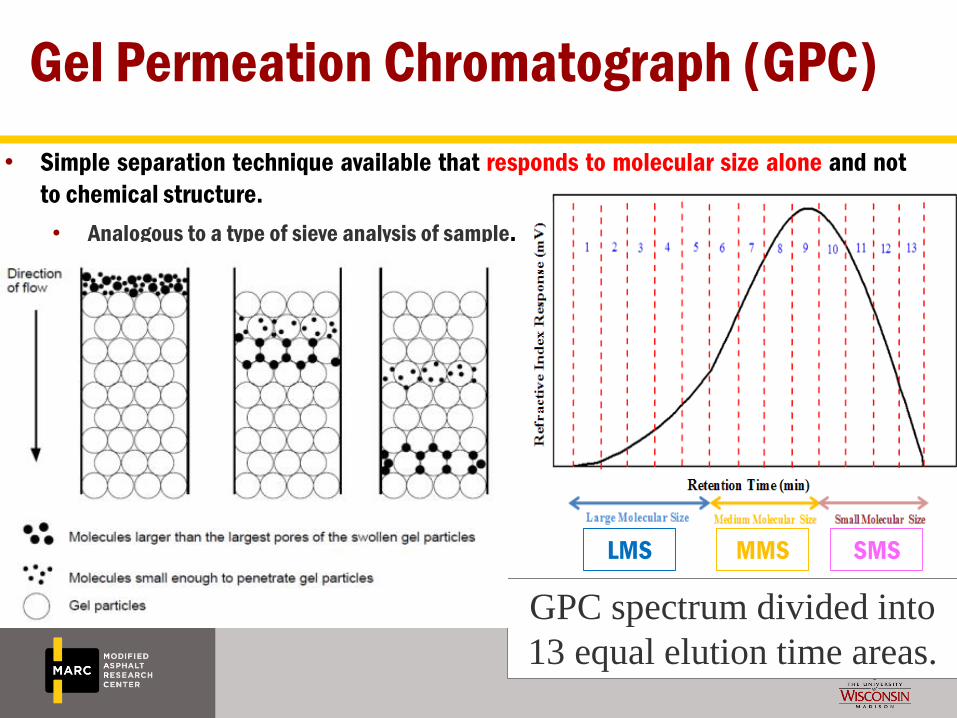
GPC spectrum divided into
13 equal elution time areas.
Gel Permeation Chromatograph (GPC)
• Simple separation technique available that responds to molecular size alone and not
to chemical structure.
• Analogous to a type of sieve analysis of sample.
LMS MMS SMS
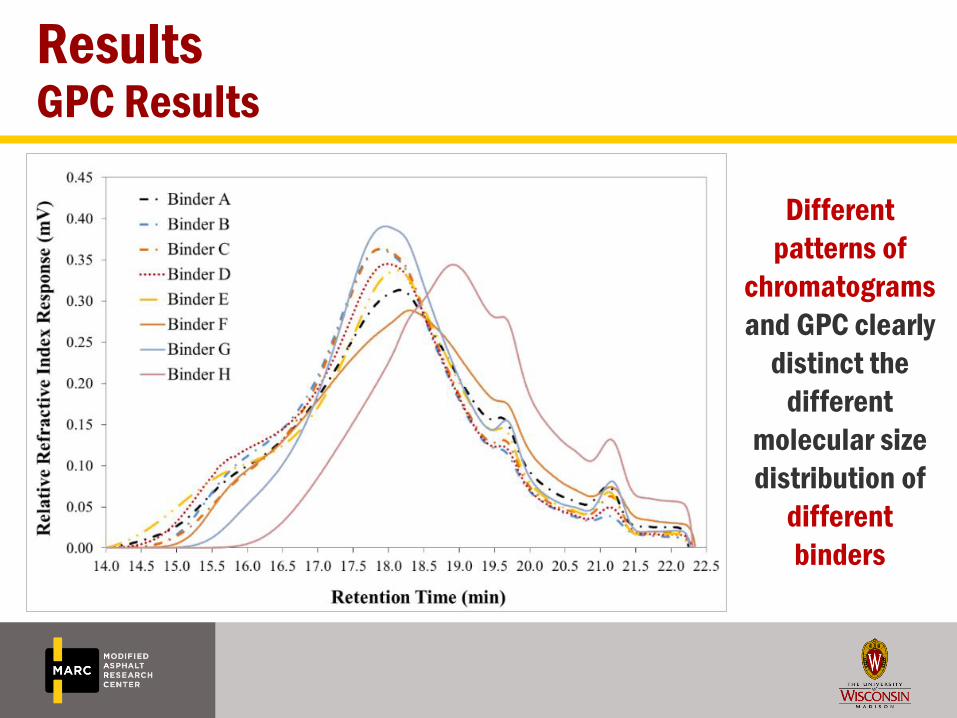
ResultsGPC Results
Different
patterns of
chromatograms
and GPC clearly
distinct the
different
molecular size
distribution of
different
binders
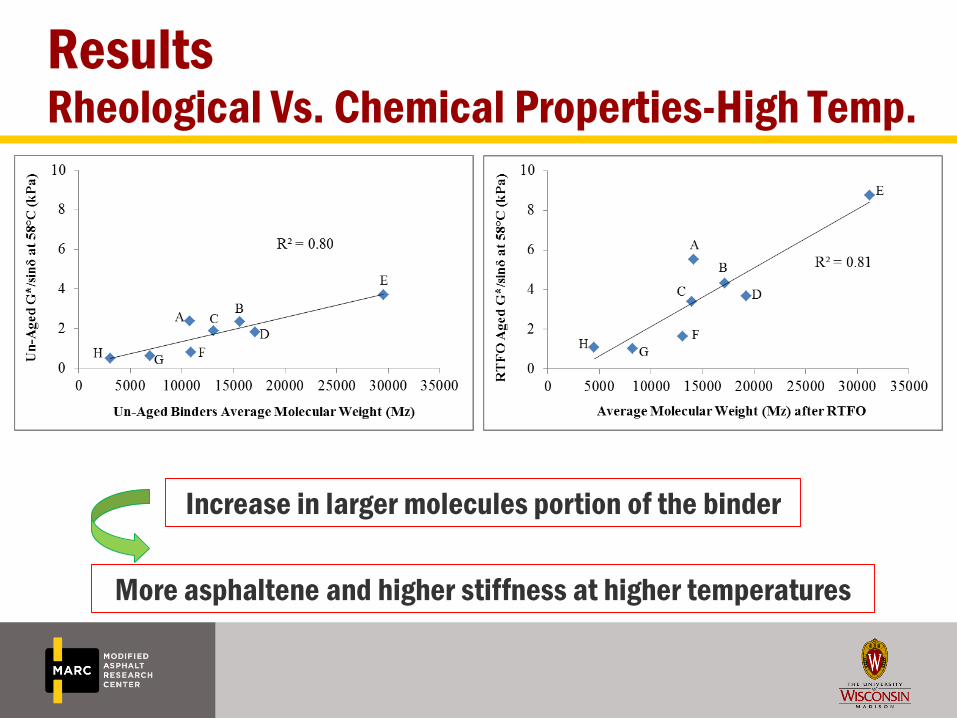
ResultsRheological Vs. Chemical Properties-High Temp.
Increase in larger molecules portion of the binder
More asphaltene and higher stiffness at higher temperatures
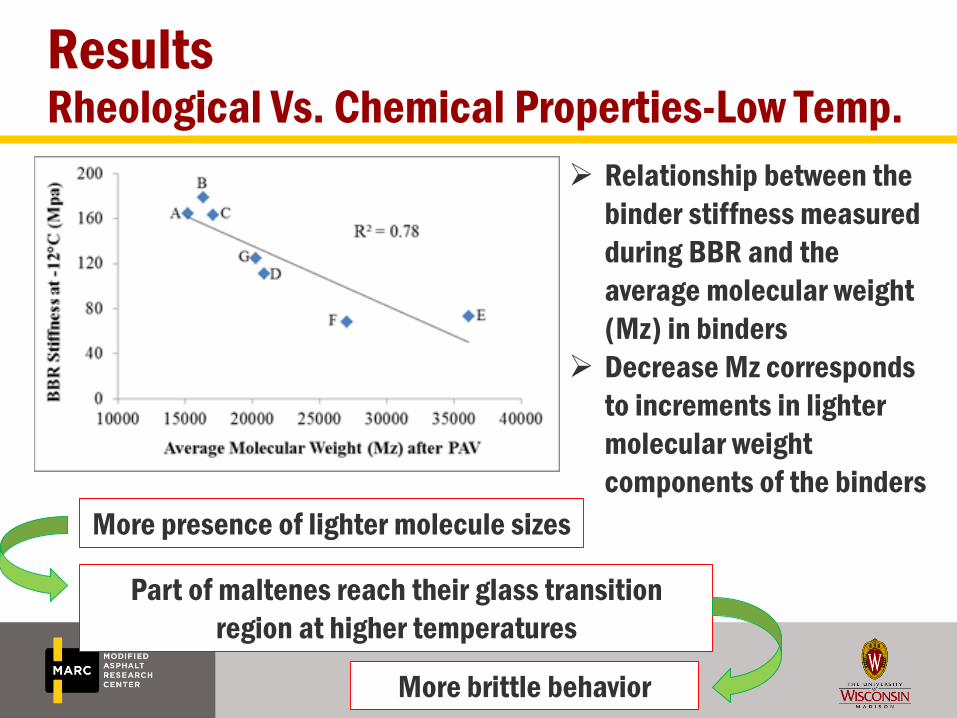
ResultsRheological Vs. Chemical Properties-Low Temp.
Relationship between the
binder stiffness measured
during BBR and the
average molecular weight
(Mz) in binders
Decrease Mz corresponds
to increments in lighter
molecular weight
components of the binders
More presence of lighter molecule sizes
Part of maltenes reach their glass transition
region at higher temperatures
More brittle behavior
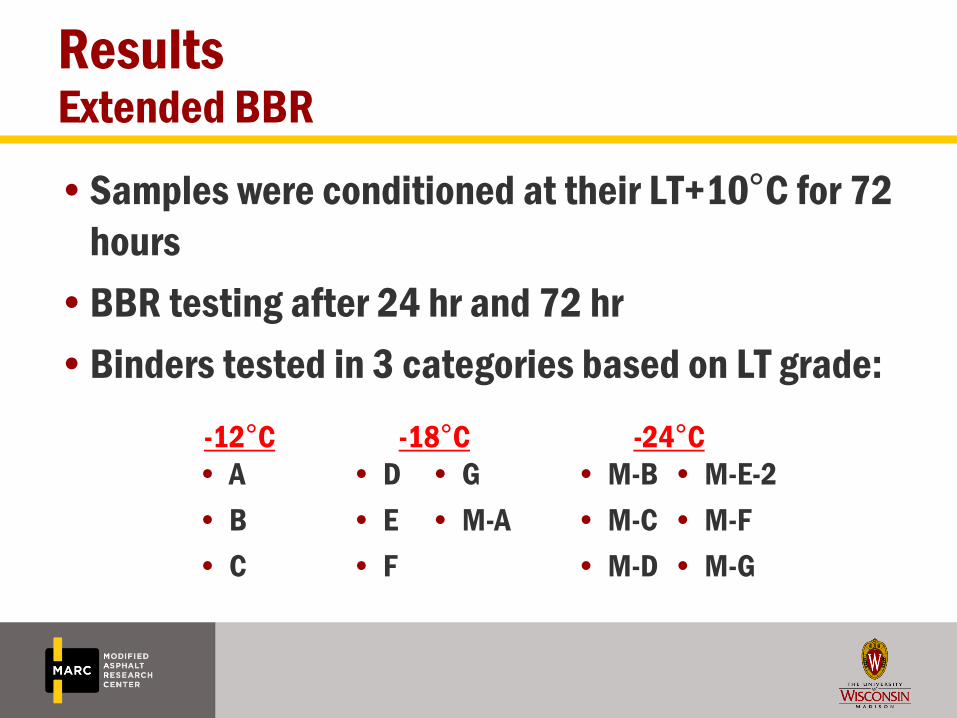
•Samples were conditioned at their LT+10°C for 72
hours
•BBR testing after 24 hr and 72 hr
•Binders tested in 3 categories based on LT grade:
• A
• B
• C
• D
• E
• F
• M-B
• M-C
• M-D
-12°C -18°C -24°C
• M-E-2
• M-F
• M-G
• G
• M-A
ResultsExtended BBR
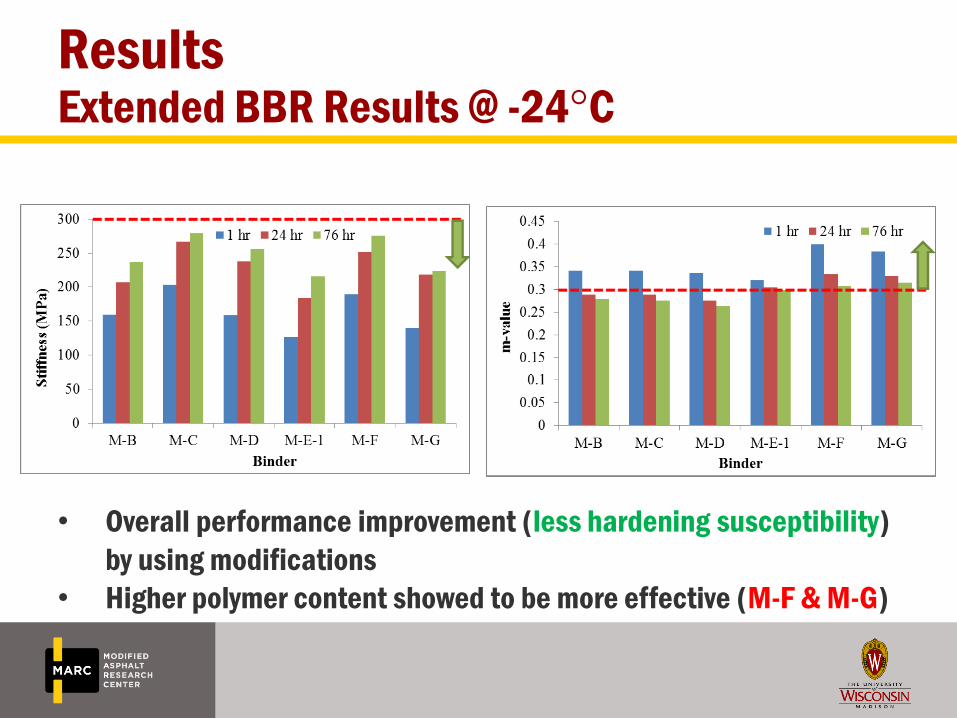
• Overall performance improvement (less hardening susceptibility)
by using modifications
• Higher polymer content showed to be more effective (M-F & M-G)
ResultsExtended BBR Results @ -24°C