IMPLEMENTATION OF PLANNED MAINTENANCE … of Planned Maintenance Using TPM Methodology For A...
18
http://www.iaeme.com/IJMET/index.asp 253 [email protected] International Journal of Mechanical Engineering and Technology (IJMET) Volume 7, Issue 6, November–December 2016, pp.253–270, Article ID: IJMET_07_06_026 Available online at http://www.iaeme.com/ijmet/issues.asp?JType=IJMET&VType=7&IType=6 ISSN Print: 0976-6340 and ISSN Online: 0976-6359 © IAEME Publication IMPLEMENTATION OF PLANNED MAINTENANCE USING TPM METHODOLOGY FOR A BI-CYCLE MANUFACTURING INDUSTRY Manoj Kumar Kar Hyderabad Institute of Technology and Management, Hyderabad, Telangana, India ABSTRACT Total Productive Maintenance (TPM) is a proven methodology in manufacturing industries in all sectors - process, and discrete. Objective of TPM is to ensure zero breakdowns and improve overall equipment effectiveness (OEE). The method followed under TPM is called Planned Maintenance (PM) system to achieve maximum availability of equipments minimize cost of maintenance .Equipments deteriorate due to prolonged negligence, lack of understanding of equipments functioning, lack of skill of repairing and no knowledge about the wear and tear of parts so that the same need to be replaced before these fail. The main aim of this work is to implement Planned Maintenance using TPM methodology for a Bicycle Tyre manufacturing company. This will improve and sustain equipment availability and reduce cost of manufacturing through reduction of unwanted and unwarranted break-down due to lack of systematic approach. To achieve these goals, Planned Maintenance system is to be implemented. The strategy adopted to develop a sustainable and cost effective maintenance system by Ranking of equipments based on quality, yield, working status, maintainability, period interval failure, delay factor/cost and safety through collection of past data of failures of equipments. Equipments ranked-A are considered for Planned Maintenance system. Such ranked-equipments are studied in detail and with reference to past failure data a preventive maintenance plan is developed. The objective is to test out this maintenance plan and measure Mean Time Between Failures (MTBF), Mean Time To Repair (MTTR), Availability, Cost of maintenance and effectiveness of the maintenance plan. Key words: Bi-Cycle, TPM Methodology, Manufacturing Industry, Cite this Article: Manoj Kumar Kar, Implementation of Planned Maintenance Using TPM Methodology For A Bi-Cycle Manufacturing Industry. International Journal of Mechanical Engineering and Technology, 7(6), 2016, pp. 253–270. http://www.iaeme.com/ijmet/issues.asp?JType=IJMET&VType=7&IType=6
Transcript of IMPLEMENTATION OF PLANNED MAINTENANCE … of Planned Maintenance Using TPM Methodology For A...
http://www.iaeme.com/IJMET/index.asp 253 [email protected]
International Journal of Mechanical Engineering and Technology (IJMET) Volume 7, Issue 6, November–December 2016, pp.253–270, Article ID: IJMET_07_06_026 Available online at http://www.iaeme.com/ijmet/issues.asp?JType=IJMET&VType=7&IType=6 ISSN Print: 0976-6340 and ISSN Online: 0976-6359 © IAEME Publication
IMPLEMENTATION OF PLANNED MAINTENANCE
USING TPM METHODOLOGY FOR A BI-CYCLE
MANUFACTURING INDUSTRY
Manoj Kumar Kar
Hyderabad Institute of Technology and Management, Hyderabad, Telangana, India
ABSTRACT
Total Productive Maintenance (TPM) is a proven methodology in manufacturing industries in
all sectors - process, and discrete. Objective of TPM is to ensure zero breakdowns and improve
overall equipment effectiveness (OEE). The method followed under TPM is called Planned
Maintenance (PM) system to achieve maximum availability of equipments minimize cost of
maintenance .Equipments deteriorate due to prolonged negligence, lack of understanding of
equipments functioning, lack of skill of repairing and no knowledge about the wear and tear of
parts so that the same need to be replaced before these fail.
The main aim of this work is to implement Planned Maintenance using TPM methodology for a
Bicycle Tyre manufacturing company. This will improve and sustain equipment availability and
reduce cost of manufacturing through reduction of unwanted and unwarranted break-down due to
lack of systematic approach. To achieve these goals, Planned Maintenance system is to be
implemented. The strategy adopted to develop a sustainable and cost effective maintenance system
by Ranking of equipments based on quality, yield, working status, maintainability, period interval
failure, delay factor/cost and safety through collection of past data of failures of equipments.
Equipments ranked-A are considered for Planned Maintenance system. Such ranked-equipments
are studied in detail and with reference to past failure data a preventive maintenance plan is
developed. The objective is to test out this maintenance plan and measure Mean Time Between
Failures (MTBF), Mean Time To Repair (MTTR), Availability, Cost of maintenance and
effectiveness of the maintenance plan.
Key words: Bi-Cycle, TPM Methodology, Manufacturing Industry,
Cite this Article: Manoj Kumar Kar, Implementation of Planned Maintenance Using TPM Methodology For A Bi-Cycle Manufacturing Industry. International Journal of Mechanical
Engineering and Technology, 7(6), 2016, pp. 253–270. http://www.iaeme.com/ijmet/issues.asp?JType=IJMET&VType=7&IType=6

Manoj Kumar Kar
http://www.iaeme.com/IJMET/index.asp 254 [email protected]
1. INTRODUCTION
Rubber Industry is one of the basic core sectors of manufacturing and most of the companies are with old generation set-up. Equipments developed were less sophisticated. As the industries are old hence skill level of the personnel on equipment maintenance is low.
The performance of the company over last 3 years to understand the importance of Planned Maintenance, Cost of Maintenance is hovering around 12-14% of total Manufacturing cost. Industry standard is below 10%. Hence an opportunity to improve company's profitability, even if there is a reduction of 2%.
2. LITERATURE REVIEW
TPM was born in 1971 and many Japanese companies started practising it. The first PM award was given to Nippon Denso Ltd in the year 1971.For more than 20 years since the inception of TPM, only Japanese companies were practising TPM. However some overseas companies found the importance of TPM to their organisations and started following it. Indian companies initiated TPM since 1991, but the real burst came in 1998 when Japan Institute of Plant Management (JIPM) and Confederation of Indian Industry became partners for the promotion of TPM in India. Tokutara Suzuki [1] In his work, TPM is spreading spreading rapidly because its activities are highly attractive. The major reasons of attraction as per Suzuki are the following: Total employee involvement in the literal sense, Zero orientation,. Terry Wireman [2] In his work, good and sound maintenance practices are essential for effective TPM. The preventive maintenance programme is designed to eliminate all un-planned equipment failures, Evaluate the PM program, Less than 20% reactive work performed. R.H.Clifton [3] In his work, Planned Maintenance is not a specific type of maintenance but the application of maintenance tackled in a scientific manner. It is the comprehensive planning of the maintenance function. L.A.Doty [4] In his work, considering the importance of maintenance, it is imperative to optimize it -to minimize repair time and cost. Melesse Workneh Wakjira, Ajit Pal Singh [5]: In their work, TPM has been widely known in manufacturing environment. This proactive maintenance strategy contributed to manufacturing performance improvements are highlighted by various researchers Liu Yong and Zhu
Jiajia [6]: In their work, effective and efficient maintenance not only helps to keep equipment/facility in good condition but also extends its life and improves availability and capacity. Chandan Chowdhuri [7] In his work, plant and machinery can be maintained in various ways. In unprecedented system failure, mainly in large, complex systems, it is common to carry out preventive maintenance at predetermined intervals. N.Narayan [8]: In his work, the effectiveness of maintenance function in relation to how it serves and is served by other functions is considered in an integrative management. Kinjiro Nakano [9]:
In his work, it is useful for maintenance personnel to utilize TPM activity as an opportunity to perform Keikaku Hozen's step-up activity on their model line in order to establish a Keikaku Hozen system. It is essential for maintenance personnel to appreciate the necessity of Keikaku Hozen. Like Jishu Hozen, Keikaku Hozen starts with tagging and removal of tags to ensure compliance. L.S Srinath [10]: In his work, the increasing complexity of present day equipment has brought into focus two aspects Maintainability and Availability, both are closely related to reliability. If the reliability of a system is high, then obviously the breakdowns will be less frequent and the availability factor will be high. Hence Availability is closely related with Reliability and Maintainability. A.K.Gupta [11]: In his work, maintainability is characteristics of design and installation which is expressed as the probability that an item will be restored to specified conditions within a given period of time when maintenance action is performed in accordance with prescribed procedures and resources. Mikell.P.Groover [12]: In his work, availability is a common measure of reliability for equipment. It is especially appropriate for automated production equipment. Availability is defined by two other reliability terms, mean time between failures (MTBF) and mean time to repair (MTTR). M.Maran, G.Manikandan,
K.Thiagrajan [13] In their work, it is necessary to establish appropriate matrices for measurement

Implementation of Planned Maintenance Using
http://www.iaeme.com/IJMET
purposes. S.N.Waghmare, D.N.Raut
design, from concept through development. Quality and reliability of products and processes are critical to the performance of the final products.
3. TOTAL PRODUCTIVE
Methodology to implement Planned Maintenance step by step under TPM is as followsStep-1: Evaluation of Equipment failure/breakdown status and understand situationStep-2: Reverse deterioration and correct weaknessStep-3: Build an information Management systemStep-4: Build a Periodic Maintenance systemStep-5: Build a Predictive Maintenance systemStep- 6: Evaluate the Planned Maintenance systemThe details of the Steps are as follows:Step-1: Evaluation of Equipment failure/breakdown Collection of data on all the failures /breakdowns, which caused production loss and the equipments to be taken for PMTable-3.1).Based on the Ranking Maintenance system.
Step-2: Reverse deterioration and correct weaknessIn respect of restoring deterioration/Autonomous maintenance implementation. The roles of Operations team are:
• Cleaning, Inspection, Lubrication, Re
• Keep operating condition through correct operation handling
• Restoration of forced deterioration. Mainlysymptoms.
• Operation skill including inspection
On the other hand roles of Maintenance personnel • Jishu Hozen activities to be technically supported
• Ensuring restoration of deterioration through check sheet
Maintenance Using TPM Methodology For A Bi-Cycle Manufacturing Industry
IJMET/index.asp 255
, D.N.Raut et al [14]: In their work present, FMEAdesign, from concept through development. Quality and reliability of products and
are critical to the performance of the final products.
MAINTENANCE METHODOLOGY
Methodology to implement Planned Maintenance step by step under TPM is as follows: Evaluation of Equipment failure/breakdown status and understand situation
deterioration and correct weakness ion Management system
a Periodic Maintenance system a Predictive Maintenance system
the Planned Maintenance system The details of the Steps are as follows:
Evaluation of Equipment failure/breakdown status and understand situationfailures /breakdowns, which caused production loss and
the equipments to be taken for PM, is activities using criteria for evaluation of Based on the Ranking - A, B, C Equipment’s Ranked - A are considered for Planned
Table 3.1 Equipment ranking criteria
Reverse deterioration and correct weakness: deterioration the participation of Operations is available through Jishu Hozen
/Autonomous maintenance implementation.
Cleaning, Inspection, Lubrication, Re-tightening to bring back the basic condition of the
operating condition through correct operation handling
deterioration. Mainly by an inspection for deteriorating parts and discovering irregular
Operation skill including inspection techniques, set up and adjustment of equipments to be improved.
On the other hand roles of Maintenance personnel are as follows: Hozen activities to be technically supported
restoration of deterioration through check sheet
Cycle Manufacturing Industry
FMEA is an essential function in design, from concept through development. Quality and reliability of products and manufacturing
METHODOLOGY
Methodology to implement Planned Maintenance step by step under TPM is as follows: : Evaluation of Equipment failure/breakdown status and understand situation
status and understand situation: failures /breakdowns, which caused production loss and analyse. Decide what
r evaluation of Equipment’s Rank (refer A are considered for Planned
the participation of Operations is available through Jishu Hozen
tightening to bring back the basic condition of the equipment,
for deteriorating parts and discovering irregular
up and adjustment of equipments to be improved.

Manoj Kumar Kar
http://www.iaeme.com/IJMET/index.asp 256 [email protected]
• Weak points of Design and defects to be found out using WHY-WHY analysis.
• Skill of maintenance to improve
Step-3: Build an information Management system: To start with, prepare equipment ledger. Obtain equipment data like specifications, capacity, manufacturer’s recommendation, equipment history from installation, break-down maintenance report etc. Step-4: Build a Periodic Maintenance system This is Time based maintenance of Equipment. From the Equipment database, machine manufacturer's recommendation, past experience, life span of parts and operators information, arrive at Planned Maintenance calendar. Step-5: Build a Predictive Maintenance system: Introduce Equipment Diagnostic Technology, Train Maintenance personnel in handling Diagnostic Instruments/Devices. Diagnostic Technology like Temperature, Vibration analysis, oil Analysis, Liquid penetration method, Electric resistance method etc. Select area and implement Equipment Diagnostic system .Evaluate Time based Maintenance parts into Condition Based Maintenance (CBM) and consolidate the plan. Step- 6: Evaluate the Planned Maintenance system: By following step 1 to step-5, improvement in Reliability and Maintainability of Equipments can be achieved. Compare the current results on Breakdown rate, MTTR, MTBF, Maintenance cost etc. with target .After comparison, revisit the total system and strengthen the weak point. Finally, consolidate the Planned Maintenance. The main focus on building a Planned Maintenance system is on the following:
• MTBF -Mean time between failures
• MTTR -Mean time to repair
• Cost of Maintenance
• Availability of Equipment
MTBF will show the vulnerability of Equipment in terms of its failure occurrence and also the reasons for its failures.
MTTR will show the capability of people doing repairing, availability of the spares and also criticality of repairing techniques.
Cost of Maintenance is a fall out of both MTBF and MTTR. Due to under stocking of spares, MTTR increases and also due to compromise on planned maintenance MTBF increases.
4. PROBLEM DEFINITION
The aim of the project is to study the most critical equipment controlling the productivity, quality, cost and availability causing a significant part of manufacturing cost in a Bicycle Tyre manufacturing industry. Application of TPM methodology to reduce Maintenance cost, Improve critical equipment availability and improve Quality and Yield.
The project work is to design a Planned Maintenance system through TPM methodology and the following are the objectives:
• To rank the equipments into A,B,C class based on criticality of quality,yield,maintainability,working status,delay factor, cast, safety.
• Availability of the Class –A equipment (Banbury ) above 98%
• MTBF (Mean Time Between Failure) and MTTR (Mean Time To Repair) improvement
• Skill improvement of Maintenance and Operation personnel through intensive and detail knowledge improvement on Equipments and Maintenence techniques to reflect on MTTR(Mean time to Repair).Correlation between MTTR and Availability =1.0

Implementation of Planned Maintenance Using
http://www.iaeme.com/IJMET
• Establish optimum Preventive Maintenance planrepairing and Availibility to be less or equal to
• Initiate Condition Based Maintenance failures.
• Reduce cost of maintenanceoptimum stock of spares.
5. RESEARCH METHODOLOGY
Planned Maintenance set-up being established by following the systematic six step TPM methodology as per JIPM (Japanese Institute of Plant Maintenance)5.1).
Fig
Based on the Process flow chart, allRanking being analysed against all the per Table-5.1.
Maintenance Using TPM Methodology For A Bi-Cycle Manufacturing Industry
IJMET/index.asp 257
Establish optimum Preventive Maintenance plan to improve equipment availability .to be less or equal to Rs.6000 per % availability
Initiate Condition Based Maintenance /CMMS (Computerised Maintenance Mangement System) to forecast
to 10 % of manufacturing cost through optimum Maintenance and keeping
RESEARCH METHODOLOGY
up being established by following the systematic six step TPM methodology as (Japanese Institute of Plant Maintenance) and being depicted in the following
Figure 5.1 Flow chart of Research Methodology
chart, all the Manufacturing Equipments are listed and the Criterion of Ranking being analysed against all the parameters. Data collected for all equipments and
Cycle Manufacturing Industry
to improve equipment availability . Ratio of Cost of
/CMMS (Computerised Maintenance Mangement System) to forecast
through optimum Maintenance and keeping
up being established by following the systematic six step TPM methodology as and being depicted in the following flow-chart (Figure-
the Manufacturing Equipments are listed and the Criterion of collected for all equipments and are tabulated as
Manoj Kumar Kar
http://www.iaeme.com/IJMET/index.asp 258 [email protected]
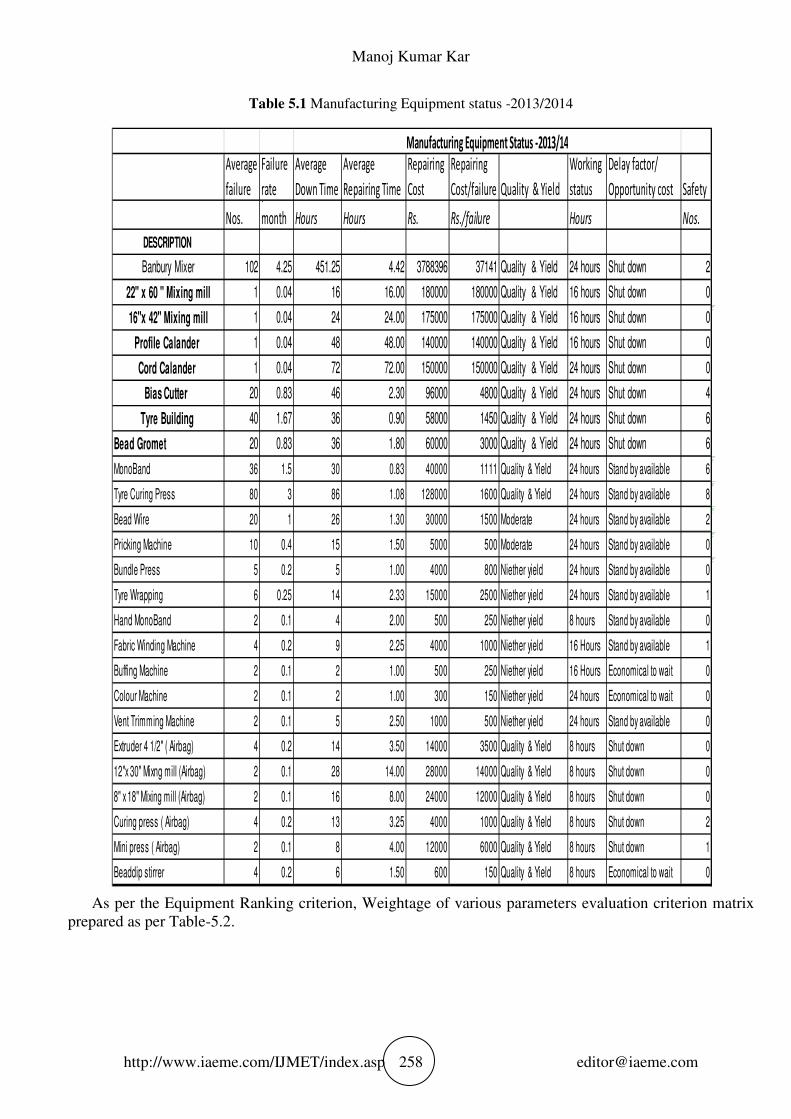
Table 5.1 Manufacturing Equipment status -2013/2014
As per the Equipment Ranking criterion, Weightage of various parameters evaluation criterion matrix prepared as per Table-5.2.
Average
failure
Failure
rate
Average
Down Time
Average
Repairing Time
Repairing
Cost
Repairing
Cost/failure Quality & Yield
Working
status
Delay factor/
Opportunity cost Safety
Nos.
per
month Hours Hours Rs. Rs./failure Hours Nos.
DESCRIPTION
Banbury Mixer 102 4.25 451.25 4.42 3788396 37141 Quality & Yield 24 hours Shut down 2
22" x 60 " Mixing mill 1 0.04 16 16.00 180000 180000 Quality & Yield 16 hours Shut down 0
16"x 42" Mixing mill 1 0.04 24 24.00 175000 175000 Quality & Yield 16 hours Shut down 0
Profile Calander 1 0.04 48 48.00 140000 140000 Quality & Yield 16 hours Shut down 0
Cord Calander 1 0.04 72 72.00 150000 150000 Quality & Yield 24 hours Shut down 0
Bias Cutter 20 0.83 46 2.30 96000 4800 Quality & Yield 24 hours Shut down 4
Tyre Building 40 1.67 36 0.90 58000 1450 Quality & Yield 24 hours Shut down 6
Bead Gromet 20 0.83 36 1.80 60000 3000 Quality & Yield 24 hours Shut down 6
MonoBand 36 1.5 30 0.83 40000 1111 Quality & Yield 24 hours Stand by available 6
Tyre Curing Press 80 3 86 1.08 128000 1600 Quality & Yield 24 hours Stand by available 8
Bead Wire 20 1 26 1.30 30000 1500 Moderate 24 hours Stand by available 2
Pricking Machine 10 0.4 15 1.50 5000 500 Moderate 24 hours Stand by available 0
Bundle Press 5 0.2 5 1.00 4000 800 Niether yield 24 hours Stand by available 0
Tyre Wrapping 6 0.25 14 2.33 15000 2500 Niether yield 24 hours Stand by available 1
Hand MonoBand 2 0.1 4 2.00 500 250 Niether yield 8 hours Stand by available 0
Fabric Winding Machine 4 0.2 9 2.25 4000 1000 Niether yield 16 Hours Stand by available 1
Buffing Machine 2 0.1 2 1.00 500 250 Niether yield 16 Hours Economical to wait 0
Colour Machine 2 0.1 2 1.00 300 150 Niether yield 24 hours Economical to wait 0
Vent Trimming Machine 2 0.1 5 2.50 1000 500 Niether yield 24 hours Stand by available 0
Extruder 4 1/2" ( Airbag) 4 0.2 14 3.50 14000 3500 Quality & Yield 8 hours Shut down 0
12"x 30" Mixng mill (Airbag) 2 0.1 28 14.00 28000 14000 Quality & Yield 8 hours Shut down 0
8" x 18" Mixing mill (Airbag) 2 0.1 16 8.00 24000 12000 Quality & Yield 8 hours Shut down 0
Curing press ( Airbag) 4 0.2 13 3.25 4000 1000 Quality & Yield 8 hours Shut down 2
Mini press ( Airbag) 2 0.1 8 4.00 12000 6000 Quality & Yield 8 hours Shut down 1
Beaddip stirrer 4 0.2 6 1.50 600 150 Quality & Yield 8 hours Economical to wait 0
Manufacturing Equipment Status -2013/14

Implementation of Planned Maintenance Using TPM Methodology For A Bi-Cycle Manufacturing Industry
http://www.iaeme.com/IJMET/index.asp 259 [email protected]
Table 5.2 Equipment evaluation criterion matrix
Based on the evaluation criterion , the final evaluated equipments along with their weighted percentage on every criterion of Q, P, W, D, S, C, M being tabulated .Equipments are ranked as per the Weighted points and the equipments crossing 80% points are classified as A- class equipments, equipments crossing 60% are classified as B-class equipment and balance are C-class equipments. A-class equipments are those equipments whose non-availability will lead to plant shut down or major quality issue, Cost of repairing is high, Periodicity of failures are high, Time to repair is high, Operates more than 16 hours a day and high number of accidents. Table-5.3 shows the classification of equipments based on Ranking.
Evaluation Criterion Weightage
Serious
Quality/Yield
Quality
variation/moderate
affect yield Neither quality/yield
Q Quality and Yield 30% 100% 80% 0%
Repair time>1.5 Hr Repair time>1.0 Hr Repair time<1.0 Hr
M Mainatainability 20% 100% 60% 30%
Cost >Rs.10000 Cost >Rs. 5000 Cost < Rs.5000
C Repairing Cost/failure 15% 100% 60% 20%
Shut down of Shop Shut down of Equip. Standby/Economical to wait
D Delay factor/Opportunity cost 10% 100% 60% 10%
Every 1 months Every 3 months More than 6 months
P Period of failure interval 10% 100% 80% 20%
16 hours operation 8-16 hours 8 hours
W Working status 10% 100% 60% 20%
> 5 accidents > 2 Accidents < 2 Accidents
S Safety/Accidents 5% 100% 50% 20%
Evaluation Matrix

Manoj Kumar Kar
http://www.iaeme.com/IJMET/index.asp 260 [email protected]
Table 5.3 Ranking of equipments as per weighted points
We noted that total A- Class equipments constitute 24% of all Equipments-Class constitute 28% of all equipments and C-Class equipments constitute 48% of equipments. Figure -5.3 shows the pie-chart of equipment distribution.
Ranking Manufacturing Equipments Q M C D P W S Total
Banbury Mixer 30% 20% 15% 10% 10% 10% 0% 95.0%
22" x 60 " Mixing mill 30% 20% 15% 10% 0% 10% 0% 85.0%
A 16"x 42" Mixing mill 30% 20% 15% 10% 0% 10% 0% 85.0%
Profile Calander 30% 20% 15% 10% 0% 10% 0% 85.0%
Cord Calander 30% 20% 15% 10% 0% 10% 0% 85.0%
Bead Gromet 30% 20% 0% 10% 8% 10% 5% 83.0%
Bias Cutter 30% 20% 3% 10% 0% 10% 4% 77.0%
12"x 30" Mixng mill (Airbag) 30% 20% 15% 6% 0% 0% 0% 71.0%
B 8" x 18" Mixing mill (Airbag) 30% 20% 15% 6% 0% 0% 0% 71.0%
Mini press ( Airbag) 30% 20% 9% 8% 0% 0% 0% 67.0%
Tyre Building 30% 0% 0% 10% 10% 10% 5% 65.0%
Tyre Curing Press 24% 12% 0% 0% 10% 10% 5% 61.0%
Curing press ( Airbag) 30% 20% 3% 6% 0% 0% 1% 60.0%
Extruder 4 1/2" ( Airbag) 30% 20% 3% 6% 0% 0% 0% 59.0%
Bead Wire 24% 12% 0% 0% 10% 10% 1% 57.0%
Vent Trimming Machine 24% 20% 0% 0% 0% 10% 0% 54.0%
C Fabric Winding Machine 24% 20% 0% 0% 2% 6% 0% 52.0%
MonoBand 24% 0% 0% 0% 8% 10% 5% 47.0%
Hand MonoBand 24% 20% 0% 0% 0% 0% 0% 44.0%
Pricking Machine 0% 20% 0% 0% 8% 10% 0% 38.0%
Colour Machine 24% 0% 0% 0% 0% 10% 0% 34.0%
Tyre Wrapping 0% 20% 0% 0% 2% 10% 0% 32.0%
Buffing Machine 24% 0% 0% 0% 0% 6% 0% 30.0%
Beaddip stirrer 0% 20% 0% 0% 0% 0% 0% 20.0%
Bundle Press 0% 0% 0% 0% 2% 10% 0% 12.0%
Ranking of Equipments

Implementation of Planned Maintenance Using
http://www.iaeme.com/IJMET
Figure 5.
On analysing we found among Ahence it is decided to focus our work of implementation of PM plan in Banbury Equipment to test the effectiveness of the TPM methodology.5.2 Data Collection of past failures of Afor last 2 years being collected for analysis of Table-5.4, 5.5, 5.6 provides the data collected on
Table
Banbury-4
January
February
March
April
May
June
July
August
September
October
November
December
Maintenance Using TPM Methodology For A Bi-Cycle Manufacturing Industry
IJMET/index.asp 261
Figure 5.3 Equipment classification distributions
On analysing we found among A-class equipment, Banbury is the top most with 95% weightage and hence it is decided to focus our work of implementation of PM plan in Banbury Equipment to test the effectiveness of the TPM methodology.
Data Collection of past failures of A-class equipment. The details of Break down time of Banbury for last 2 years being collected for analysis of availability, types of failures, and the reasons for failures.
the data collected on Failures, Down time and Breakdown history.
Table 5.4 Failure and Downtime data of Banbury-4
2013 2014 2013
2
0
3
2 2 30
2 1 30
1 5 180
8 3 400
1 2 90
0 2
2 0 120
6 2 1190
3 2 1170
Failures-(Nos.) Downtime- (Minutes)
Cycle Manufacturing Industry
is the top most with 95% weightage and hence it is decided to focus our work of implementation of PM plan in Banbury Equipment to test the
details of Break down time of Banbury -4 types of failures, and the reasons for failures.
time and Breakdown history.
2013 2014
8660
0
195
30 195
30 85
180 230
400 2510
90 105
8670
120 0
1190 120
1170 140
Downtime- (Minutes)
Manoj Kumar Kar
http://www.iaeme.com/IJMET/index.asp 262 [email protected]
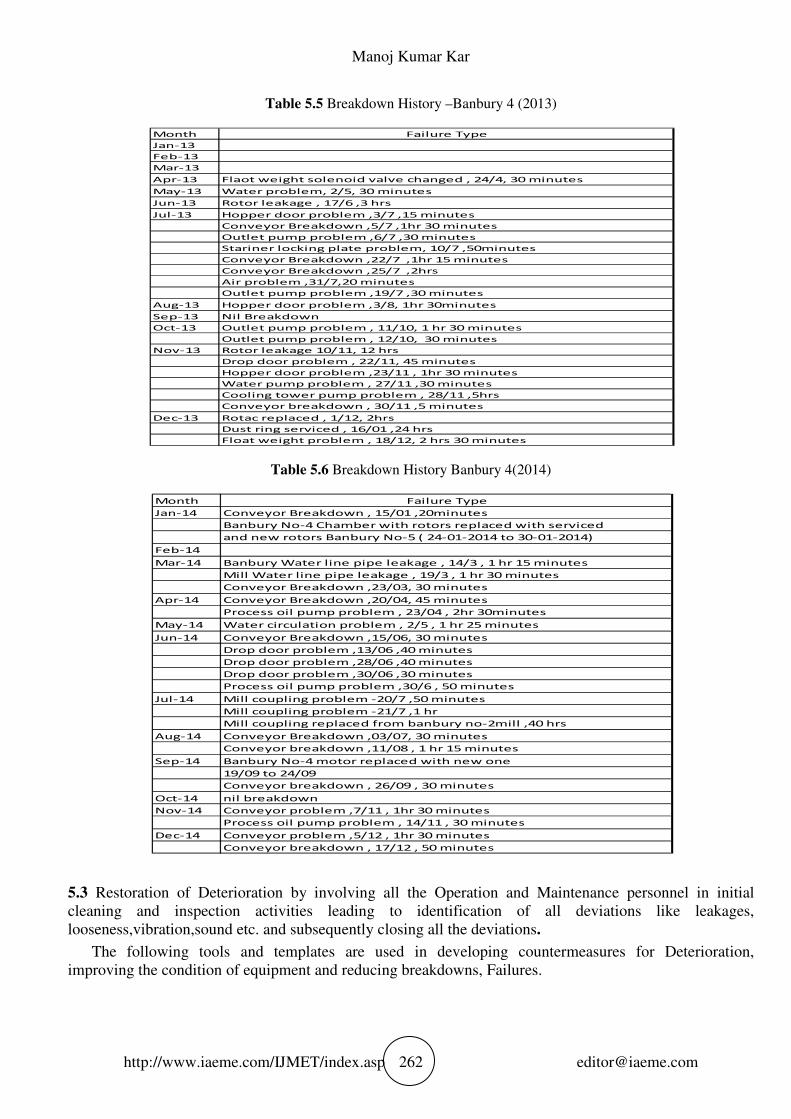
Table 5.5 Breakdown History –Banbury 4 (2013)
Table 5.6 Breakdown History Banbury 4(2014)
5.3 Restoration of Deterioration by involving all the Operation and Maintenance personnel in initial cleaning and inspection activities leading to identification of all deviations like leakages, looseness,vibration,sound etc. and subsequently closing all the deviations.
The following tools and templates are used in developing countermeasures for Deterioration, improving the condition of equipment and reducing breakdowns, Failures.
Month Failure Type
Jan-13
Feb-13
Mar-13
Apr-13 Flaot weight solenoid valve changed , 24/4, 30 minutes
May-13 Water problem, 2/5, 30 minutes
Jun-13 Rotor leakage , 17/6 ,3 hrs
Jul-13 Hopper door problem ,3/7 ,15 minutes
Conveyor Breakdown ,5/7 ,1hr 30 minutes
Outlet pump problem ,6/7 ,30 minutes
Stariner locking plate problem, 10/7 ,50minutes
Conveyor Breakdown ,22/7 ,1hr 15 minutes
Conveyor Breakdown ,25/7 ,2hrs
Air problem ,31/7,20 minutes
Outlet pump problem ,19/7 ,30 minutes
Aug-13 Hopper door problem ,3/8, 1hr 30minutes
Sep-13 Nil Breakdown
Oct-13 Outlet pump problem , 11/10, 1 hr 30 minutes
Outlet pump problem , 12/10, 30 minutes
Nov-13 Rotor leakage 10/11, 12 hrs
Drop door problem , 22/11, 45 minutes
Hopper door problem ,23/11 , 1hr 30 minutes
Water pump problem , 27/11 ,30 minutes
Cooling tower pump problem , 28/11 ,5hrs
Conveyor breakdown , 30/11 ,5 minutes
Dec-13 Rotac replaced , 1/12, 2hrs
Dust ring serviced , 16/01 ,24 hrs
Float weight problem , 18/12, 2 hrs 30 minutes
Month Failure Type
Jan-14 Conveyor Breakdown , 15/01 ,20minutes
Banbury No-4 Chamber with rotors replaced with serviced
and new rotors Banbury No-5 ( 24-01-2014 to 30-01-2014)
Feb-14
Mar-14 Banbury Water line pipe leakage , 14/3 , 1 hr 15 minutes
Mill Water line pipe leakage , 19/3 , 1 hr 30 minutes
Conveyor Breakdown ,23/03, 30 minutes
Apr-14 Conveyor Breakdown ,20/04, 45 minutes
Process oil pump problem , 23/04 , 2hr 30minutes
May-14 Water circulation problem , 2/5 , 1 hr 25 minutes
Jun-14 Conveyor Breakdown ,15/06, 30 minutes
Drop door problem ,13/06 ,40 minutes
Drop door problem ,28/06 ,40 minutes
Drop door problem ,30/06 ,30 minutes
Process oil pump problem ,30/6 , 50 minutes
Jul-14 Mill coupling problem -20/7 ,50 minutes
Mill coupling problem -21/7 ,1 hr
Mill coupling replaced from banbury no-2mill ,40 hrs
Aug-14 Conveyor Breakdown ,03/07, 30 minutes
Conveyor breakdown ,11/08 , 1 hr 15 minutes
Sep-14 Banbury No-4 motor replaced with new one
19/09 to 24/09
Conveyor breakdown , 26/09 , 30 minutes
Oct-14 nil breakdown
Nov-14 Conveyor problem ,7/11 , 1hr 30 minutes
Process oil pump problem , 14/11 , 30 minutes
Dec-14 Conveyor problem ,5/12 , 1hr 30 minutes
Conveyor breakdown , 17/12 , 50 minutes

Implementation of Planned Maintenance Using TPM Methodology For A Bi-Cycle Manufacturing Industry
http://www.iaeme.com/IJMET/index.asp 263 [email protected]
Why-why analysis:
The why-why analysis is used to determine the root cause of a breakdown, as well as that of defects, equipment deterioration and weak points of equipment design. Countermeasures for the causes and source of the failure are to be brainstormed and the most effective solution implemented. Improvements can be made to strengthen the design of equipment, or its reliability and maintainability. The why-why analysis is constructed by maintenance personnel and can include support from the focused improvement team, to determine the root cause of the Problem.
Kaizens for reliability and maintainability:
Improvements in the reliability and maintainability of equipment, increases the uptime of the machine and thereby reduces losses. All floor personnel were encouraged and engaged in solving small problems through Kaizen principle and it helped in restoration of equipment to its basic condition. 5.4 Skill Development of Maintenance personnel by understanding the details of construction of the equipment and its functioning of all components .Massive training programme for Officers and Maintenance technicians being carried out. There are total 72 Operation and Maintenance Technicians .In total each one of them received on-the job as well as off the job training of 16 hours. While, 6 Maintenance Officers received 24 hours of training each. 5.5 Develop Preventive Maintenance Plan based on Manufacturers Table-5.7 shows the Preventive Maintenance plan developed.
Table5.7 Preventive Plan prepared based on Manual and failure data
S.No. Description of Maintenance for Banbury Frequency
1 Internal clearance measurment/monitor 3M
2 Rotor Lift 6M
3 Rotor Axial Float 3M
4 Bearing Radial Clearance checking 3M
5 Y-Clearance checking 6M
6 Float Weight to chamber (throat) clearances 6M
7 Ram Neutral float Checking W
8 Latch reserve Stroke Checking M
9 Connecting Gear Wear Checking 3M
10 Ram Snubbing W
11 Drop Door Snubbing/Decceleration W
12 Long rotor Connecting Gear Key Extension into sleeve Y
13 Teltale Rod Condition W
14 Ramfloat safety Stopper Pin Condition M
15 Body Lube Flow Rate Checking M
16 Dust Lube Flow Rate Checking M
17 Dust Stop Spring Retainer Tensioning to a preset / practice figure M
18 Ram gland Bush Clearance checking 6M
19 Ram Gland Packing (shaft Stuffing) checking/replacement 3M
20 Motor Current Checking 2W
21 Motor Intertia of Motion (time to stop after switched off) M
22 Motor Megger Value Checking M
23 Motor Contactor Checking 2M
24 Banbury, Gearbox & Motor Vibration Analysis 3M
25 Gearbox Oil Analysis 3M
26 Motor Contactor Di-electric Oil Analysis 6M
27 D.door thermocouple check/replacement 2M
28 Hopper shaft seal correction 2M
29 Hopper Door Side seal check/replacement 2M
30 Rotor, Chamber, D.Door Cooling water ∆T Checking M
Tentative PM Jobs for Banbury

Manoj Kumar Kar
http://www.iaeme.com/IJMET/index.asp 264 [email protected]
5.6 Implement the tentative Preventive Plan and followed the calendar as per plan. Collect the new failure data and reasons for breakdown and measured the effectiveness of Preventive maintenance on Availability, MTBF and MTTR. Mean time between failures, Mean time to repair and Availability. The mean time between failures measures the reliability of the equipment, by determining how long a machine runs for, before a breakdown or failure occurs. The longer the period between failures, the longer the machine is running for. This provides higher machine reliability and availability. MTBF = (Average Time run between breakdowns) / Total no. failures.
MTTR = Average time required to service the equipment and put it back in operation /total number of failures.
Availability is defined as, A= (MTBF-MTTR)/MTBF
The following Table - 5.8 depicts the Data on Failures. MTBF, MTTR, Availability being calculated based on the past history and present data after implementation of the revised PM plan along with Training programme for Skill up gradation and people involvement through Kaizen activities.
Table 5.8 Data on Failures, Down Time for 2013/2014/2015/2016
MTBF, MTTR, Availability along with Standard Deviation being calculated and the sample calculation for each being shown in Table-5.9, 5.10.Complete data on MTBF, MTTR, Availability, Standard Deviation for 2013,2014,2015,2016 in Table-5.11.
Table 5.9 Sample calculation of MTBF, MTTR, Availability
Scheduled Time
Hours 2013 2014 2015 2016 2013 2014 2015 2016
572 January 0 2 1 2 0 8660 60 120
572 February 0 0 2 1 0 0 60 240
572 March 0 3 0 3 0 195 0 300
572 April 2 2 0 30 195 0
572 May 2 1 3 30 85 95
572 June 1 5 5 180 230 3235
572 July 8 3 5 400 2510 485
572 August 1 2 8 90 105 430
572 September 0 2 5 0 8670 145
572 October 2 0 4 120 0 190
572 November 6 2 4 1190 120 290
572 December 3 2 8 1170 140 405
Banbury-4
Downtime- (Minutes)Failures-(Nos.)
Banbury-4
MTBF (Scheduled time-Down time)/No. Of failures
MTTR (Down Time)/No. Of failures
Availability (MTBF-MTTR)/MTBF
Sample calculation for MTBF ,January 2015 Scheduled time= 572 hours
Down Time =1 hour
Failures=1 number
MTBF= (572-1)/1 =572 Hours
Sample calculation for MTTR ,January 2015 Down Time=1 hour
Failures=1 number
MTTR =1/1=1 hour
Sample calculation for Availability ,January 2015 Availability=(572-1)/572=0.998

Implementation of Planned Maintenance Using TPM Methodology For A Bi-Cycle Manufacturing Industry
http://www.iaeme.com/IJMET/index.asp 265 [email protected]
Table 5.10 Sample calculation of Standard Deviation
Table 5.11 MTBF, MTTR, Availability data for 2013/2014/2015/2016
Standard Statistical Formula in Excel being used to calculate Correlation between MTTR and Availability and being found -0.99 for 2015 and 0.86 for 2013.
Standard Deviation of MTBF increased from 150 hours in 2014 to 197 hours in 2016, MTTR improved from 27.51 hours in 2014 to 1.58 hours in 2016.
Regression Analysis of the Data-MTTR and Availability being made and the Best-Fit Equation being derived. In order to test the effectiveness of the Best-Fit Equation for Forecasting, Availability data based on Best Fit Equation and Actual calculated Data being compared and found satisfactory. With this Equation, it will be possible to forecast Availability provided the MTTR can be predicted. MTTR is a function of Repairing Skill, Quality of Spares and Condition of Equipment.
The sample calculation of Pearson Co-efficient for Regression Analysis of MTTR and Availability are shown in Table-5.12.
MTBF-13
Y Y-X (Y-X)^2
January 0 -195.22 38111.8
February 0 -195.22 38111.8
March 0 -195.22 38111.8
April 285.75 90.53 8195.2
May 285.75 90.53 8195.2
June 569 373.78 139709.6
July 70.67 -124.56 15514.2
August 570.5 375.28 140833.2
September 0 -195.22 38111.8
October 285 89.78 8060.0
November 92.0 -103.19 10649.2
December 184.2 -11.06 122.2
Mean=X 195.22 483726.1
Z=Sum (Y-X)^2/(N-1) 43975.10
Standard Deviation =Sqrt Z 209.70
Sample calculation of Standard Deviation of MTBF-2013
MTBF-13 MTBF-14 MTBF-15 MTBF-16 MTTR-13 MTTR-14 MTTR-15 MTTR-16 Avl-13 Avl-14 Avl-15 Avl-16
January 0.00 213.8 571.0 285.0 0 72.17 1 1 1 0.66 0.998 0.9965
February 0.00 0.0 285.5 568.0 0 0 0.5 4 1 1.0 0.998 0.9930
March 0.00 189.6 0.0 189.0 0 1.1 0 1.7 1 0.994 1.000 0.9912
April 285.8 284.4 0.0 0.25 1.6 0 0.999 0.994 1.000
May 285.8 570.6 190.1 0.25 1.4 0.53 0.999 0.998 0.997
June 569.0 113.6 103.6 3 0.8 10.78 0.995 0.993 0.896
July 70.7 176.7 112.8 0.83 13.9 1.62 0.988 0.921 0.986
August 570.5 285.1 70.6 1.5 0.9 0.90 0.997 0.997 0.987
September 0.0 213.8 113.9 0 72.3 0.48 1.000 0.66 0.996
October 285.0 0.0 142.2 1 0.0 0.79 0.996 1.000 0.994
November 92.0 285.0 141.8 3.31 1.0 1.21 0.964 0.996 0.991
December 184.2 284.8 70.7 6.5 1.2 0.84 0.965 0.996 0.988
Mean 195.24 218.12 150.18 347.33 1.39 13.86 1.55 2.22 0.99 0.93 0.99 0.99
Standard Deviation 209.70 150.96 153.68 197.04 1.98 27.51 2.94 1.58 0.01 0.13 0.03 0.00
Correlation(R) -MTTR vs Availability -0.86 -1.00 -0.99
MTBF,MTTR,Availability for 2013,2014,2015,2016

http://www.iaeme.com/IJMET
Table 5.12 Sample calculation of Regression Analysis Co
Based on the Regression Analysis, forecasting of Availability against actually calculated Availabilitybeing tested and is as Table-5.13
Table 5.13
The Failure Trends and Availability Trends are as shown in Figures
January
February
March
April
May
June
July
August
September
October
November
December
Total
Mean=X',Y'
Sample(n)
Regression Coefficient (b):
n*sum(XY)-sum(x)*sum(y)
n*sum(x^2)-(sum(x))^2
Regression Coefficient(a):
(sum(Y))*(sum(x^2))-(sum(X))*(sum(XY))
N*(sum(X^2))-(sum(X))^2
Best Fit Line Equation:
Y=bx+a
Sample calculation for Regression Analysis
MTTR=X
Jan-16
Feb-16
Mar-16
Forecast based on Regression best fit equation
Manoj Kumar Kar
IJMET/index.asp 266
Sample calculation of Regression Analysis Co-efficient
Based on the Regression Analysis, forecasting of Availability against actually calculated Availability
Forecast of Availability based on Regression Analysis
The Failure Trends and Availability Trends are as shown in Figures-5.12 and 5.
Figure 5.12 Failures trend
MTTR-15 Avl-15
X Y X^2
1 0.998
0.5 0.998 0.25
0 1.000
0 1.000
0.53 0.997 0.279
10.78 0.896 116.280
1.62 0.986 2.614
0.90 0.987 0.803
0.48 0.996 0.234
0.79 0.994 0.627
1.21 0.991 1.460
0.84 0.988 0.712
18.65 11.83 124.26
1.55 0.99
12
-0.010
-11.110
1143.30
1.001
(sum(Y))*(sum(x^2))-(sum(X))*(sum(XY)) 1144.367
1143.298
0.01*X+1.001
Sample calculation for Regression Analysis
MTTR=X Availability=YActual-Y
1 0.991 0.996
4 0.961 0.993
1.7 0.984 0.991
Forecast based on Regression best fit equation
efficient
Based on the Regression Analysis, forecasting of Availability against actually calculated Availability
Forecast of Availability based on Regression Analysis
and 5.13
X^2 Y^2 XY
1 0 1.00
0.25 0 0.50
0 0 0.00
0 0 0.00
0.279 0 0.53
116.280 0 9.66
2.614 0 1.59
0.803 0 0.88
0.234 0 0.48
0.627 0 0.79
1.460 0 1.20
0.712 0 0.83
124.26 0.00 17.46
Actual-Y
0.996
0.993
0.991
Forecast based on Regression best fit equation

Implementation of Planned Maintenance Using
http://www.iaeme.com/IJMET
Figure
5.7 Initiation of Computerised Maintenance Management System along with Condition based CMMS will provide data integrity,
6. RESULTS AND DISCUSSI
Adopting the Planned Maintenance system by following systematic approach of TPM methodology ensured restoration of basic condition of equipment, Skill sustainable improvements through Kaizens and mind set of following Main aim of the study was to achieve the (1) Improvement of Availability of equipmentthe implementation of TPM methodology,
• Skill/Knowledge up gradation
• Preventive Maintenance programme
• Spare parts Management
The effect of these programmes can be seen in the Supply effectiveness, down time and Availability of the Equipment improv
However the failure rates in the initial stage increased although the MTTR improvement of Skill exists. (2) Improve MTBF and MTTR. MTBF 14 hours to 4 hours. The reason being, major breakdown could be minimised, while small failures are cropping up. These failures can be controlled through Kaizens and also better skill.(3) Cost reduction impact due to prevention of unexpected failures requiring emergency repairincost.The method of calculation of MTBFMTBF = (Scheduled Time-Down Time)/MTTR= (Down Time)/No. of FailuresAvailability = (MTBF-MTTR)/MTBF
Table 6.1 and 6.2 depicts the Failure and computed MTBF, MTTR, Availability, and Cost
Maintenance Using TPM Methodology For A Bi-Cycle Manufacturing Industry
IJMET/index.asp 267
Figure-5.13 Availability trend of Banbury -4
Computerised Maintenance Management System along with Condition based integrity, Preventive Plan monitoring and proper spare planning.
RESULTS AND DISCUSSIONS
Adopting the Planned Maintenance system by following systematic approach of TPM methodology of basic condition of equipment, Skill improvement of Maintenance mechanics,
through Kaizens and mind set of following a Preventive Maintenance plan.to achieve the following:
of Availability of equipment - Banbury-4 Availability increased from 95% to 98%.methodology, three things addressed are:
up gradation
Preventive Maintenance programme
The effect of these programmes can be seen in the results. With improvement of Administrative and time and Availability of the Equipment improved.
However the failure rates in the initial stage increased although the MTTR
. MTBF decreased from 268 hours to 150 hours while MTTR reduced from reason being, major breakdown could be minimised, while small failures are
failures can be controlled through Kaizens and also better skill.3) Cost reduction impact due to prevention of unexpected failures requiring emergency repairin
The method of calculation of MTBF, MTTR, and Availability are as follows:Down Time)/No. of Failures
Failures MTTR)/MTBF depicts the Failure and down time data for last 3 years as well as summary of
, MTTR, Availability, and Cost of Maintenance.
Cycle Manufacturing Industry
Computerised Maintenance Management System along with Condition based Monitoring. Preventive Plan monitoring and proper spare planning.
Adopting the Planned Maintenance system by following systematic approach of TPM methodology of Maintenance mechanics,
a Preventive Maintenance plan.
4 Availability increased from 95% to 98%.Since
improvement of Administrative and
However the failure rates in the initial stage increased although the MTTR improved. Enough scope of
hours while MTTR reduced from reason being, major breakdown could be minimised, while small failures are
failures can be controlled through Kaizens and also better skill. 3) Cost reduction impact due to prevention of unexpected failures requiring emergency repairing at any
are as follows:
data for last 3 years as well as summary of

http://www.iaeme.com/IJMET
Table 6.1
Table 6.2 MTBF, MTTR, Availability and Cost of Maintenance of Banbury
Figure 6.1, 6.2, 6.3.6.4, 6.5 shows the trend of Availability, Cost/Availability, MTTR, MTBF and Cost of Maintenance for Banbury-4.
Figure
Banbury-4
2013
January
February
March
April 2
May 2
June 1
July 8
August 1
September 0
October 2
November 6
December 3
25
Failures-(Nos.)
Scheduled Time Down Time
Hours
A
2013 6864
2014 6864
2015 6864
2016 1716
Manoj Kumar Kar
IJMET/index.asp 268
Table 6.1 Data of down time and Failure for last 3 years
MTBF, MTTR, Availability and Cost of Maintenance of Banbury
shows the trend of Availability, Cost/Availability, MTTR, MTBF and Cost of
Figure 6.1 Availability improvement trend
Figure 6.2 Cost per Availability %
2014 2015 2013
2 1 January
0 2 February
3 0 March
2 0 April 30
1 3 May 30
5 5 June 180
3 5 July 400
2 8 August 90
2 5 September
0 4 October 120
2 4 November 1190
2 8 December 1170
24 45 3210
Failures-(Nos.) Downtime- (Minutes)
Down Time Operating Time Failures MTBF MTTR Availability
Hours Hours Nos. Hours Hours %
B C=A-B D E=(A-B)/D F=B/D G=(E-F)/E
53.5 6810.5 25 272.4 2.14 99.2
348.5 6515.5 24 271.5 14.52 94.65
89.92 6774 45 150.5 1.99 98.67
11 1705 6 284.2 1.83 99.35
Data of down time and Failure for last 3 years
MTBF, MTTR, Availability and Cost of Maintenance of Banbury-4
shows the trend of Availability, Cost/Availability, MTTR, MTBF and Cost of
2014 2015
8660 60
0 60
195 0
195 0
85 95
230 3235
2510 485
105 430
8670 145
0 190
120 290
140 405
20910 5395
Downtime- (Minutes)
Cost Cost/Availability
Rs. Rs./% availability
928528 9360
891387 9412
757679 7676
178276 7174
Implementation of Planned Maintenance Using
http://www.iaeme.com/IJMET
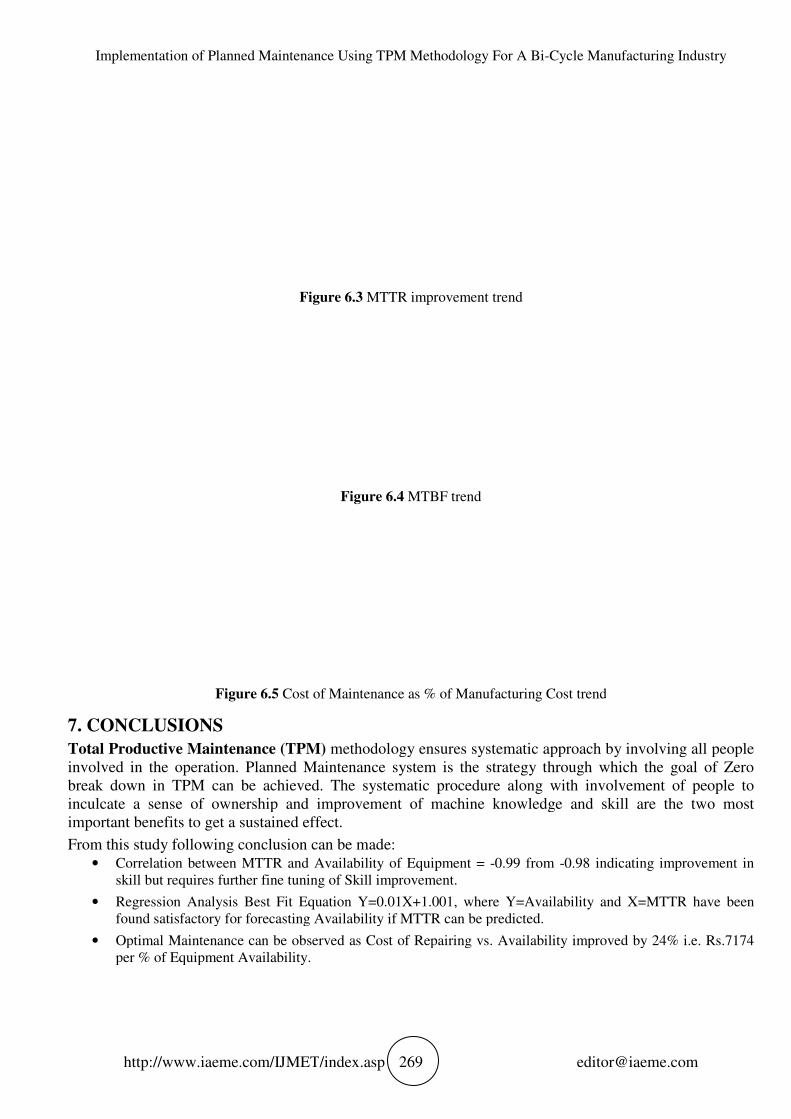
Figure 6.5 Cost of Maintenance as % of Manufacturing
7. CONCLUSIONS
Total Productive Maintenance (TPM)
involved in the operation. Planned Maintenance system break down in TPM can be achieved. The systematic procedure along with involvement of people to inculcate a sense of ownership and improvement of machine knowledge and important benefits to get a sustained effect. From this study following conclusion
• Correlation between MTTR and Availability of Equipment = skill but requires further fine tunin
• Regression Analysis Best Fit Equation Y=0.01X+found satisfactory for forecasting Availability if MTTR can be predicted.
• Optimal Maintenance can be observed as Cost of Repairing per % of Equipment Availability.
Maintenance Using TPM Methodology For A Bi-Cycle Manufacturing Industry
IJMET/index.asp 269
Figure 6.3 MTTR improvement trend
Figure 6.4 MTBF trend
Cost of Maintenance as % of Manufacturing Cost trend
TPM) methodology ensures systematic approach by involving all people Planned Maintenance system is the strategy through which the goal of Zero
break down in TPM can be achieved. The systematic procedure along with involvement of people to inculcate a sense of ownership and improvement of machine knowledge and
to get a sustained effect. conclusion can be made:
Correlation between MTTR and Availability of Equipment = -0.99 from -0.98 indicating improvement in fine tuning of Skill improvement.
Analysis Best Fit Equation Y=0.01X+1.001, where Y=Availability and X=MTTR have been found satisfactory for forecasting Availability if MTTR can be predicted.
Optimal Maintenance can be observed as Cost of Repairing vs. Availability improved by per % of Equipment Availability.
Cycle Manufacturing Industry
Cost trend
methodology ensures systematic approach by involving all people is the strategy through which the goal of Zero
break down in TPM can be achieved. The systematic procedure along with involvement of people to inculcate a sense of ownership and improvement of machine knowledge and skill are the two most
0.98 indicating improvement in
Y=Availability and X=MTTR have been
Availability improved by 24% i.e. Rs.7174

Manoj Kumar Kar
http://www.iaeme.com/IJMET/index.asp 270 [email protected]
7.1. Future scope of work
Further improvement in Cost /Availability can be achieved with full implementation of Condition based Monitoring and Computerised Maintenance Management System. Although ,only one cycle data after implementation of Planned Maintenance available, but all the parameters of Availability, MTBF, MTTR and Cost of Repairing vs. Availability shows improvement. Sustainable improvement can be only achieved through Vibration and Condition Based monitoring.
REFERENCES
[1] Tokutaro Suzuki -TPM Gallops across Globe, 1st Edition 2008; TPM Club of India, CII, Bangalore.
[2] Terry Wireman, Total Productive Maintenance, 2nd edition, Industrial Press Inc, New York
[3] R.H.Clifton, Principles of Planned Maintenance, 1974
[4] L.A.Doty, Reliability for the Technologies, Industrial Press Inc., 1984, New York
[5] Melesse Workneh Wakjira, Ajit Pal Singh, A Dama Science & T technology University; Global Journal of researches in engineering, Industrial engineering, 12 (1) Version 1.0 February 2012
[6] Liu Yong /Zhu Jiajia, School of Innovation, Design and Engineering MÄLARDALENS University, SE-721 23 VÄSTERÅS/ESKILSTUNA, Sweden
[7] Chandan Chowdhury, Growing need for Condition Based Maintenance -paper presented in the XIXth National Convention of IIPE on "Strategies for Plant Management and Engineering in the coming decade.
[8] N.Narayanan, Paper presented at XIX National Convention on Strategies for Plant Management and Engg. In the coming decade, 28/29 January, 1989, Organised by Indian Institute of Plant Engineers, at Bombay.
[9] Kinijiro Nakono, Comprehensive approach to Zero breakdown -Planned Maintenance Keikaku Hozen -Chapter-3,Page-76.JIPM Solutions, Tokyp, Japan
[10] L.S.Srinath, Reliability engineering (4th edition) affiliated East-West Press Private ltd., New Delhi
[11] A.K.Gupta, Reliability, Maintenance and Safety Engineering, University Science Press, New Delhi
[12] Mikell P.Groover, Automation, Production Systems and Computer Integrated Manufacturing, 3rd Edition, Pearson Prentice Hall
[13] M.Maran/G.Manikandan/K.Thiagrajan, Proceedings of the International Multi conference of Engineers and Computer Scientists 2012 Vol. II IMECS 2012,March 14-16,2012,Hong Kong.
[14] Prof. Dr. Pankaj Sharma and Dr.M.P.Singh, Effect of Hand ARM Vibration Exposure In Manufacturing Industry. International Journal of Mechanical Engineering and Technology, 7(3), 2016, pp. 112–118.
[15] U. D. Gulhane, C.A.Nalawade, K.P.Sohani, V.S.Shirodkar, Six Sigma Implementation Model for File Manufacturing Industry. International Journal of Mechanical Engineering and Technology, 7(3), 2016, pp. 112–118.
[16] S.N.Waghmare/D.N.Raut/S.K.Mahajan/S.S.Bhamare, International Journal of Innovative Research in Advanced Engineering (IJIRAE) Volume I Issue 6 (July 2014) Failure Mode Effect Analysis and TPM: A review.