Resurface Crissy Field Promenade and Reconfigure East Beach Parking Area,
Imper Ial beach promenade9 0 0 p a l m a v e n u e , I m p e r I a l b e a c h , c a 9 1 9 3 2
No warranty or representation is made to the accuracy of the foregoing information. Terms of sale or lease and availability are subject to change or withdrawal without notice.
Dan MalcolM(858) 366-8266
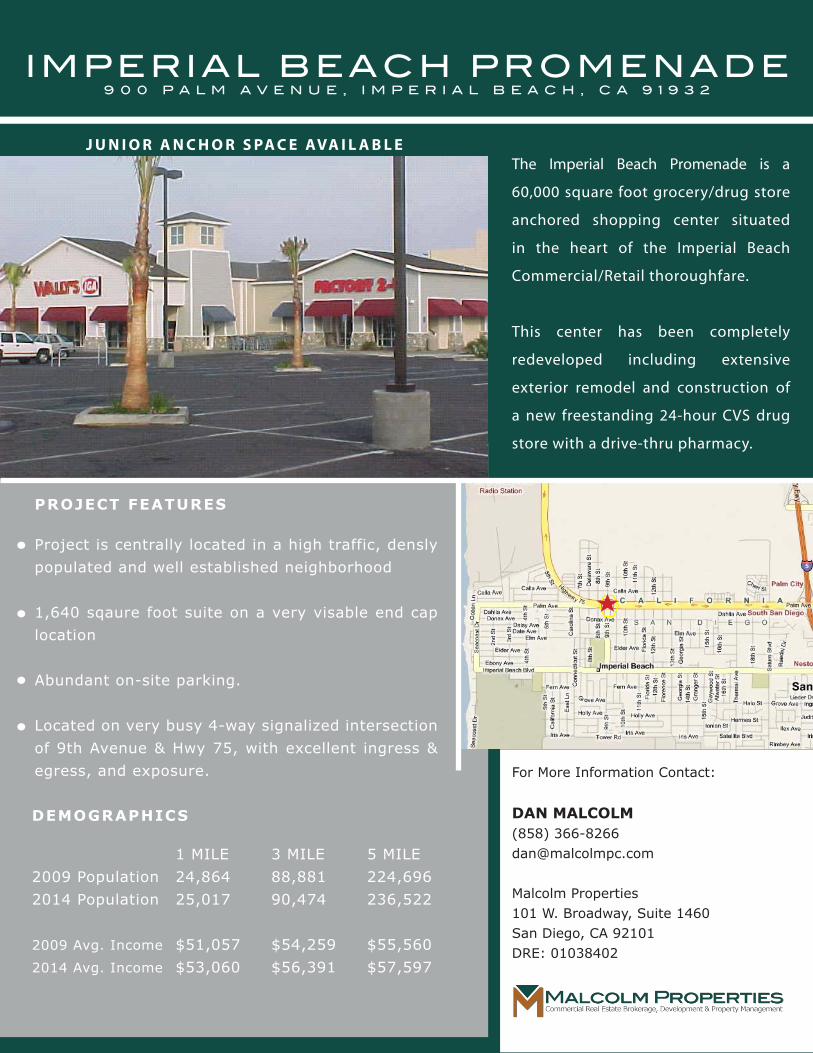
PRoJEcT FEaTURES
Project is centrally located in a high traffic, densly
populated and well established neighborhood
1,640 sqaure foot suite on a very visable end cap
location
Abundant on-site parking.
Located on very busy 4-way signalized intersection
of 9th Avenue & Hwy 75, with excellent ingress &
egress, and exposure.
The Imperial Beach Promenade is a
60,000 square foot grocery/drug store
anchored shopping center situated
in the heart of the Imperial Beach
Commercial/Retail thoroughfare.
This center has been completely
redeveloped including extensive
exterior remodel and construction of
a new freestanding 24-hour CVS drug
store with a drive-thru pharmacy.
DEMoGRaPHIcS
1 MiLe 3 MiLe 5 MiLe
2009 Population 24,864 88,881 224,696
2014 Population 25,017 90,474 236,522
2009 Avg. income $51,057 $54,259 $55,560
2014 Avg. income $53,060 $56,391 $57,597
No warranty or representation is made to the accuracy of the foregoing information. Terms of sale or lease and availability are subject to change or withdrawal without notice.
3262 Holiday Court, Suite 100, La Jolla, California 92037
T: 858-453-9990 F: 858-453-9965 www.lee-associates.com
Contact For Information: Dan Malcolm
Phone: (858)453-9990 Email: [email protected]
FEATURES: 60,000 square foot Grocery/Drug anchored Shopping center situated in the heart of the Imperial Beach Commercial/
Retail thoroughfare. Project is centrally located in a densly populated and well established neighborhood. 1,440 square built out restaurant suite on a very visable end cap location (See site plan on reverse) Shopping center has been completely redeveloped including extensive exterior remodel and construction of a new
freestanding 24-hour CVS drug store with a drive-thru pharmacy. Abundant on-site parking. Located on very busy 4-way signalized intersection with excellent ingress & egress, and exposure.
NWC of Palm Avenue and 9th Street. Imperial Beach, California
TRAFFIC COUNT: (cars per day, SANDAG) Palm Avenue (Route 75): 44,500 9th Street: 10,000
Total: 54,500
DEMOGRAPHICS:Population: Average HH Income:
1 Mile 2 Miles 3 Miles 5 Miles 25,308 47,587 90,129 230,217 $50,901 $45,780 $45,771 $45,649
For Lease Imperial Beach Promenade
1,440 SF Restaurant End Cap Suite
J U N I O R A N C H O R S PA C E AVA I L A B L E
For More information Contact:
Dan MalcolM(858) [email protected]
Malcolm Properties101 W. Broadway, Suite 1460San Diego, CA 92101DRe: 01038402

Imper Ial beach promenade9 0 0 p a l m a v e n u e , I m p e r I a l b e a c h , c a 9 1 9 3 2
No warranty or representation is made to the accuracy of the foregoing information. Terms of sale or lease and availability are subject to change or withdrawal without notice.
Dan MalcolM(858) 366-8266
ImperIal beach promenade9 0 0 p a l m a v e n u e , I m p e r I a l b e a c h , c a 9 1 9 3 2
PA L M AV E N U ESITE
ImperIal beach promenade9 0 0 p a l m a v e n u e , I m p e r I a l b e a c h , c a 9 1 9 3 2
No warranty or representation is made to the accuracy of the foregoing information. Terms of sale or lease and availability are subject to change or withdrawal without notice.
Imper Ial beach promenade9 0 0 p a l m a v e n u e , I m p e r I a l b e a c h , c a 9 1 9 3 2
No warranty or representation is made to the accuracy of the foregoing information. Terms of sale or lease and availability are subject to change or withdrawal without notice.
Dan MalcolM(858) 366-8266
PA
LM
AV
E.
IMP
ER
IAL
BE
AC
H B
LV
D.
S a t u r n B l v d .
1 3 t h S t .
9 t h S t .
Imper Ial beach promenade9 0 0 p a l m a v e n u e , I m p e r I a l b e a c h , c a 9 1 9 3 2
No warranty or representation is made to the accuracy of the foregoing information. Terms of sale or lease and availability are subject to change or withdrawal without notice.
Dan MalcolM(858) 366-8266
ImperIal beach promenade9 0 0 p a l m a v e n u e , I m p e r I a l b e a c h , c a 9 1 9 3 2
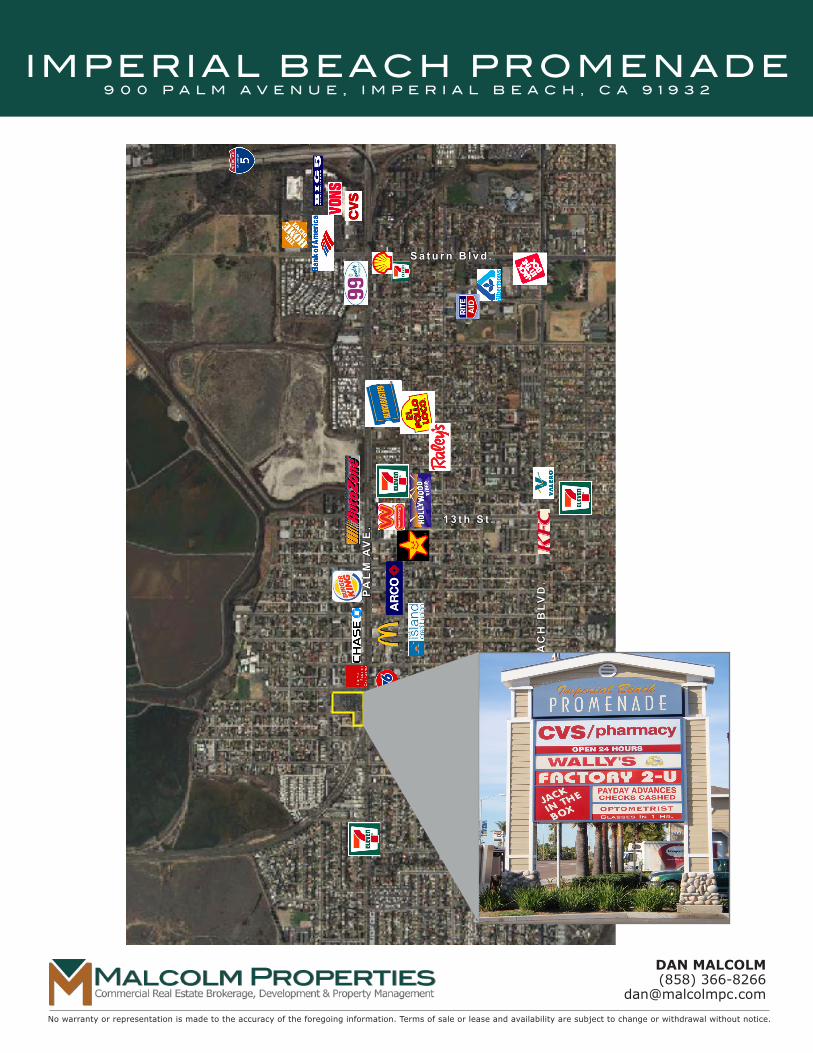
Wally’s IGAGrocery Store
CVSDrug Store
Jack in the Box
Factory 2U
San Ysidro Health Center
San Diego Nutrition
Check Cashing
IB Vision Care
AVAILABLE
1. Factory 2U 12,500 SF Available 2/1/2011
2. San Ysidro Health Center 3,130 SF Available 4/1/2010
3. San Diego Nutrition 1,953 SF Available 4/1/2010
4. Check Cashing 1,500 SF Available 5/15/2010
5. AVAILABLE SUITE 1,640 SF Available Immediately
* Suites 2-4 above are contingious and can be combined all or part.
AVA I L A B I L I T I E S
ImperIal beach promenade9 0 0 p a l m a v e n u e , I m p e r I a l b e a c h , c a 9 1 9 3 2
No warranty or representation is made to the accuracy of the foregoing information. Terms of sale or lease and availability are subject to change or withdrawal without notice.
Imper Ial beach promenade9 0 0 p a l m a v e n u e , I m p e r I a l b e a c h , c a 9 1 9 3 2
No warranty or representation is made to the accuracy of the foregoing information. Terms of sale or lease and availability are subject to change or withdrawal without notice.
Dan MalcolM(858) 366-8266
Market ProfilePrepared by ESRI
©2009 ESRI On-demand reports and maps from Business Analyst Online. Order at www.esri.com/bao or call 800-292-2224 8/26/2009 Page 1 of 8
Site_7 900 Palm Ave 900 Palm Ave 900 Palm AveLatitude: 32.58444 Imperial Beach, CA 9193 Imperial Beach, CA 9193 Imperial Beach, CA 9193Longitude: -117.114 Radius: 1 Miles Radius: 3 Miles Radius: 5 Miles
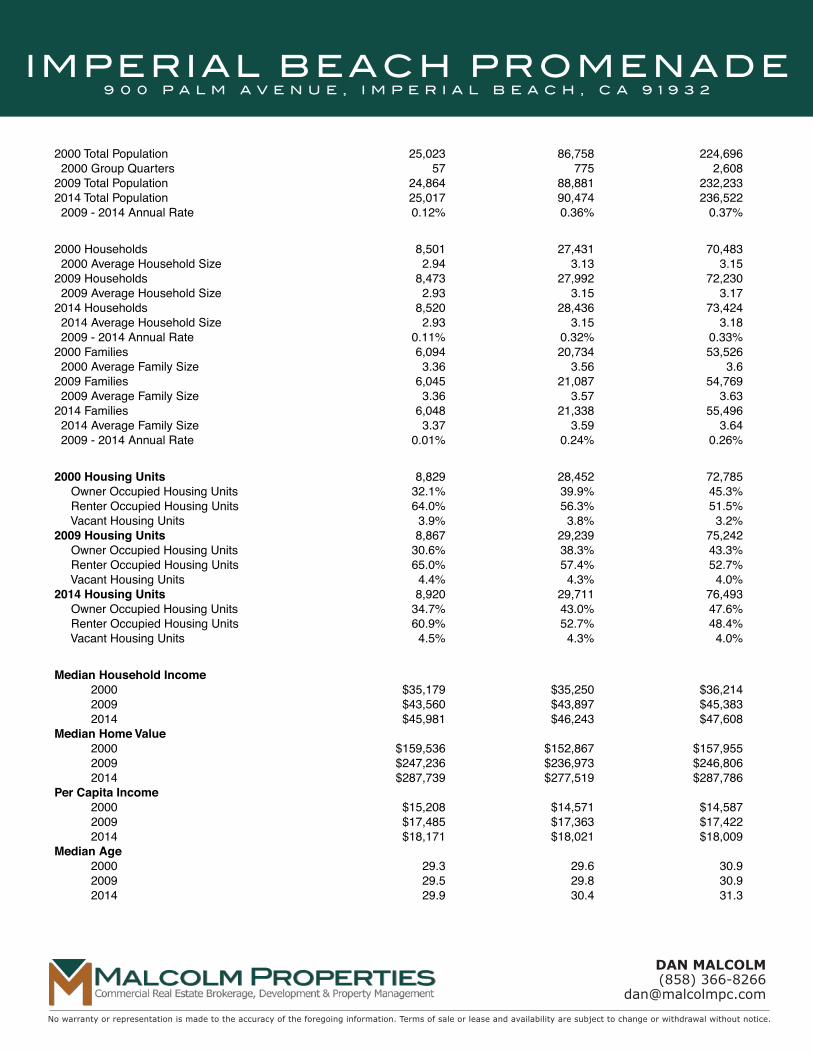
2000 Total Population 25,023 86,758 224,696 2000 Group Quarters 57 775 2,6082009 Total Population 24,864 88,881 232,2332014 Total Population 25,017 90,474 236,522 2009 - 2014 Annual Rate 0.12% 0.36% 0.37%
2000 Households 8,501 27,431 70,483 2000 Average Household Size 2.94 3.13 3.152009 Households 8,473 27,992 72,230 2009 Average Household Size 2.93 3.15 3.172014 Households 8,520 28,436 73,424 2014 Average Household Size 2.93 3.15 3.18 2009 - 2014 Annual Rate 0.11% 0.32% 0.33%2000 Families 6,094 20,734 53,526 2000 Average Family Size 3.36 3.56 3.62009 Families 6,045 21,087 54,769 2009 Average Family Size 3.36 3.57 3.632014 Families 6,048 21,338 55,496 2014 Average Family Size 3.37 3.59 3.64 2009 - 2014 Annual Rate 0.01% 0.24% 0.26%
2000 Housing Units 8,829 28,452 72,785 Owner Occupied Housing Units 32.1% 39.9% 45.3% Renter Occupied Housing Units 64.0% 56.3% 51.5% Vacant Housing Units 3.9% 3.8% 3.2%2009 Housing Units 8,867 29,239 75,242 Owner Occupied Housing Units 30.6% 38.3% 43.3% Renter Occupied Housing Units 65.0% 57.4% 52.7% Vacant Housing Units 4.4% 4.3% 4.0%2014 Housing Units 8,920 29,711 76,493 Owner Occupied Housing Units 34.7% 43.0% 47.6% Renter Occupied Housing Units 60.9% 52.7% 48.4% Vacant Housing Units 4.5% 4.3% 4.0%
Median Household Income 2000 $35,179 $35,250 $36,214 2009 $43,560 $43,897 $45,383 2014 $45,981 $46,243 $47,608 Median Home Value 2000 $159,536 $152,867 $157,955 2009 $247,236 $236,973 $246,806 2014 $287,739 $277,519 $287,786 Per Capita Income 2000 $15,208 $14,571 $14,587 2009 $17,485 $17,363 $17,422 2014 $18,171 $18,021 $18,009 Median Age 2000 29.3 29.6 30.9 2009 29.5 29.8 30.9 2014 29.9 30.4 31.3
Data Note: Household population includes persons not residing in group quarters. Average Household Size is the household population divided by total households. Persons in families include the householder and persons related to the householder by birth, marriage, or adoption. Per Capita Income represents the income received by all persons aged 15 years and over divided by total population. Detail may not sum to totals due to rounding.
Source: U.S. Bureau of the Census, 2000 Census of Population and Housing. ESRI forecasts for 2009 and 2014.
Imper Ial beach promenade9 0 0 p a l m a v e n u e , I m p e r I a l b e a c h , c a 9 1 9 3 2
No warranty or representation is made to the accuracy of the foregoing information. Terms of sale or lease and availability are subject to change or withdrawal without notice.
Dan MalcolM(858) 366-8266
ImperIal beach promenade9 0 0 p a l m a v e n u e , I m p e r I a l b e a c h , c a 9 1 9 3 2
Market ProfilePrepared by ESRI
©2009 ESRI On-demand reports and maps from Business Analyst Online. Order at www.esri.com/bao or call 800-292-2224 8/26/2009 Page 2 of 8
Site_7 900 Palm Ave 900 Palm Ave 900 Palm AveLatitude: 32.58444 Imperial Beach, CA 9193 Imperial Beach, CA 9193 Imperial Beach, CA 9193Longitude: -117.114 Radius: 1 Miles Radius: 3 Miles Radius: 5 Miles
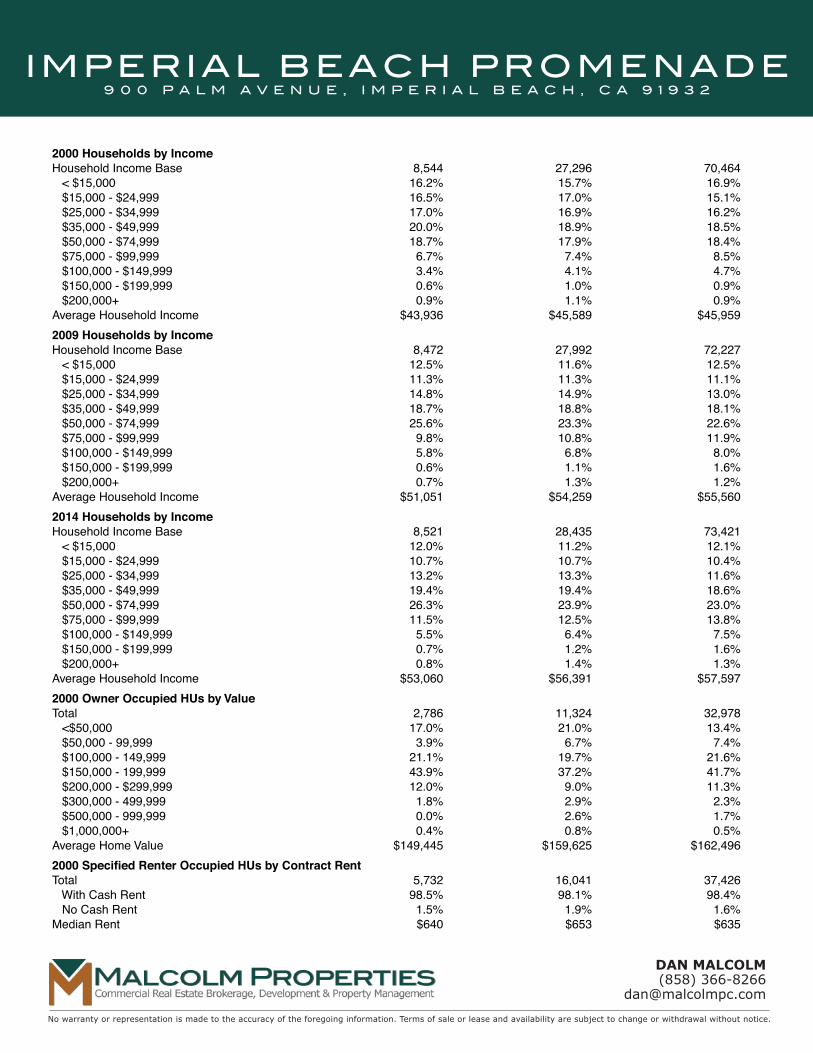
2000 Households by IncomeHousehold Income Base 8,544 27,296 70,464 < $15,000 16.2% 15.7% 16.9% $15,000 - $24,999 16.5% 17.0% 15.1% $25,000 - $34,999 17.0% 16.9% 16.2% $35,000 - $49,999 20.0% 18.9% 18.5% $50,000 - $74,999 18.7% 17.9% 18.4% $75,000 - $99,999 6.7% 7.4% 8.5% $100,000 - $149,999 3.4% 4.1% 4.7% $150,000 - $199,999 0.6% 1.0% 0.9%
$200,000+ 0.9% 1.1% 0.9% Average Household Income $43,936 $45,589 $45,959 2009 Households by Income Household Income Base 8,472 27,992 72,227 < $15,000 12.5% 11.6% 12.5% $15,000 - $24,999 11.3% 11.3% 11.1% $25,000 - $34,999 14.8% 14.9% 13.0% $35,000 - $49,999 18.7% 18.8% 18.1% $50,000 - $74,999 25.6% 23.3% 22.6% $75,000 - $99,999 9.8% 10.8% 11.9% $100,000 - $149,999 5.8% 6.8% 8.0% $150,000 - $199,999 0.6% 1.1% 1.6% $200,000+ 0.7% 1.3% 1.2% Average Household Income $51,051 $54,259 $55,560 2014 Households by Income Household Income Base 8,521 28,435 73,421 < $15,000 12.0% 11.2% 12.1% $15,000 - $24,999 10.7% 10.7% 10.4% $25,000 - $34,999 13.2% 13.3% 11.6% $35,000 - $49,999 19.4% 19.4% 18.6% $50,000 - $74,999 26.3% 23.9% 23.0% $75,000 - $99,999 11.5% 12.5% 13.8% $100,000 - $149,999 5.5% 6.4% 7.5% $150,000 - $199,999 0.7% 1.2% 1.6% $200,000+ 0.8% 1.4% 1.3% Average Household Income $53,060 $56,391 $57,597 2000 Owner Occupied HUs by Value Total 2,786 11,324 32,978 <$50,000 17.0% 21.0% 13.4% $50,000 - 99,999 3.9% 6.7% 7.4% $100,000 - 149,999 21.1% 19.7% 21.6% $150,000 - 199,999 43.9% 37.2% 41.7% $200,000 - $299,999 12.0% 9.0% 11.3% $300,000 - 499,999 1.8% 2.9% 2.3% $500,000 - 999,999 0.0% 2.6% 1.7% $1,000,000+ 0.4% 0.8% 0.5% Average Home Value $149,445 $159,625 $162,496 2000 Specified Renter Occupied HUs by Contract Rent Total 5,732 16,041 37,426 With Cash Rent 98.5% 98.1% 98.4% No Cash Rent 1.5% 1.9% 1.6% Median Rent $640 $653 $635 Average Rent $643 $645 $635
Data Note: Income represents the preceding year, expressed in current dollars. Household income includes wage and salary earnings, interest, dividends, net rents, pensions, SSI and welfare payments, child support and alimony. Specified Renter Occupied Housing Units exclude houses on 10+ acres. Average Rent excludes units paying no cash rent.
Source: U.S. Bureau of the Census, 2000 Census of Population and Housing. ESRI forecasts for 2009 and 2014.
ImperIal beach promenade9 0 0 p a l m a v e n u e , I m p e r I a l b e a c h , c a 9 1 9 3 2
No warranty or representation is made to the accuracy of the foregoing information. Terms of sale or lease and availability are subject to change or withdrawal without notice.
Imper Ial beach promenade9 0 0 p a l m a v e n u e , I m p e r I a l b e a c h , c a 9 1 9 3 2
No warranty or representation is made to the accuracy of the foregoing information. Terms of sale or lease and availability are subject to change or withdrawal without notice.
Dan MalcolM(858) 366-8266
Market ProfilePrepared by ESRI
©2009 ESRI On-demand reports and maps from Business Analyst Online. Order at www.esri.com/bao or call 800-292-2224 8/26/2009 Page 3 of 8
Site_7 900 Palm Ave 900 Palm Ave 900 Palm AveLatitude: 32.58444 Imperial Beach, CA 9193 Imperial Beach, CA 9193 Imperial Beach, CA 9193Longitude: -117.114 Radius: 1 Miles Radius: 3 Miles Radius: 5 Miles
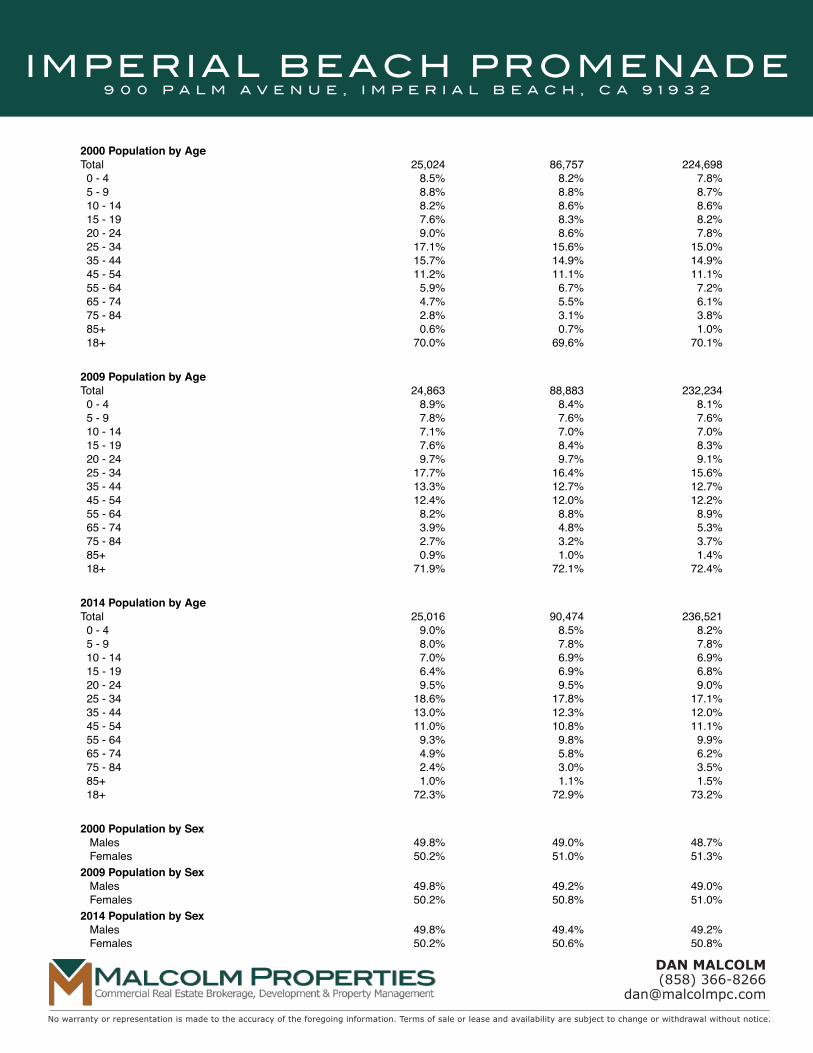
2000 Population by Age Total 25,024 86,757 224,698 0 - 4 8.5% 8.2% 7.8% 5 - 9 8.8% 8.8% 8.7% 10 - 14 8.2% 8.6% 8.6% 15 - 19 7.6% 8.3% 8.2% 20 - 24 9.0% 8.6% 7.8% 25 - 34 17.1% 15.6% 15.0% 35 - 44 15.7% 14.9% 14.9% 45 - 54 11.2% 11.1% 11.1% 55 - 64 5.9% 6.7% 7.2% 65 - 74 4.7% 5.5% 6.1% 75 - 84 2.8% 3.1% 3.8% 85+ 0.6% 0.7% 1.0%
18+ 70.0% 69.6% 70.1% 2009 Population by Age Total 24,863 88,883 232,234 0 - 4 8.9% 8.4% 8.1% 5 - 9 7.8% 7.6% 7.6% 10 - 14 7.1% 7.0% 7.0% 15 - 19 7.6% 8.4% 8.3% 20 - 24 9.7% 9.7% 9.1% 25 - 34 17.7% 16.4% 15.6% 35 - 44 13.3% 12.7% 12.7% 45 - 54 12.4% 12.0% 12.2% 55 - 64 8.2% 8.8% 8.9% 65 - 74 3.9% 4.8% 5.3% 75 - 84 2.7% 3.2% 3.7% 85+ 0.9% 1.0% 1.4% 18+ 71.9% 72.1% 72.4% 2014 Population by Age Total 25,016 90,474 236,521 0 - 4 9.0% 8.5% 8.2% 5 - 9 8.0% 7.8% 7.8% 10 - 14 7.0% 6.9% 6.9% 15 - 19 6.4% 6.9% 6.8% 20 - 24 9.5% 9.5% 9.0% 25 - 34 18.6% 17.8% 17.1% 35 - 44 13.0% 12.3% 12.0% 45 - 54 11.0% 10.8% 11.1% 55 - 64 9.3% 9.8% 9.9% 65 - 74 4.9% 5.8% 6.2% 75 - 84 2.4% 3.0% 3.5% 85+ 1.0% 1.1% 1.5% 18+ 72.3% 72.9% 73.2% 2000 Population by Sex Males 49.8% 49.0% 48.7% Females 50.2% 51.0% 51.3% 2009 Population by Sex Males 49.8% 49.2% 49.0% Females 50.2% 50.8% 51.0% 2014 Population by Sex Males 49.8% 49.4% 49.2% Females 50.2% 50.6% 50.8%
Source: U.S. Bureau of the Census, 2000 Census of Population and Housing. ESRI forecasts for 2009 and 2014.

Imper Ial beach promenade9 0 0 p a l m a v e n u e , I m p e r I a l b e a c h , c a 9 1 9 3 2
No warranty or representation is made to the accuracy of the foregoing information. Terms of sale or lease and availability are subject to change or withdrawal without notice.
Dan MalcolM(858) 366-8266
ImperIal beach promenade9 0 0 p a l m a v e n u e , I m p e r I a l b e a c h , c a 9 1 9 3 2
Market ProfilePrepared by ESRI
©2009 ESRI On-demand reports and maps from Business Analyst Online. Order at www.esri.com/bao or call 800-292-2224 8/26/2009 Page 4 of 8
Site_7 900 Palm Ave 900 Palm Ave 900 Palm AveLatitude: 32.58444 Imperial Beach, CA 9193 Imperial Beach, CA 9193 Imperial Beach, CA 9193Longitude: -117.114 Radius: 1 Miles Radius: 3 Miles Radius: 5 Miles
2000 Population by Race/Ethnicity Total 25,022 86,757 224,696 White Alone 63.7% 53.9% 52.0% Black Alone 4.4% 4.6% 4.4% American Indian Alone 1.0% 0.9% 0.9% Asian or Pacific Islander Alone 6.9% 10.0% 8.8% Some Other Race Alone 17.9% 24.8% 28.2% Two or More Races 6.1% 5.8% 5.8% Hispanic Origin 43.4% 54.5% 58.9% Diversity Index 79.1 84.8 85.6
2009 Population by Race/Ethnicity Total 24,863 88,880 232,234 White Alone 57.5% 49.1% 47.3% Black Alone 4.2% 4.1% 4.0% American Indian Alone 0.9% 0.8% 0.8% Asian or Pacific Islander Alone 7.3% 10.1% 8.6% Some Other Race Alone 22.4% 29.0% 32.7% Two or More Races 7.6% 6.8% 6.6% Hispanic Origin 53.1% 62.4% 66.7% Diversity Index 83.1 86.6 87.1 2014 Population by Race/Ethnicity Total 25,018 90,474 236,522 White Alone 54.6% 47.0% 45.2% Black Alone 4.0% 3.8% 3.8% American Indian Alone 0.9% 0.8% 0.7% Asian or Pacific Islander Alone 7.5% 10.1% 8.6% Some Other Race Alone 24.6% 31.0% 34.8% Two or More Races 8.4% 7.3% 7.0% Hispanic Origin 57.7% 65.9% 70.2% Diversity Index 84.4 87.2 87.6
2000 Population 3+ by School EnrollmentTotal 23,772 82,430 214,251 Enrolled in Nursery/Preschool 1.5% 1.4% 1.5% Enrolled in Kindergarten 1.8% 1.8% 1.7% Enrolled in Grade 1-8 14.8% 15.2% 15.1% Enrolled in Grade 9-12 6.9% 7.9% 7.9% Enrolled in College 6.9% 7.0% 7.2% Enrolled in Grad/Prof School 0.8% 0.7% 0.7% Not Enrolled in School 67.2% 66.0% 65.9%
2009 Population 25+ by Educational Attainment Total 14,673 52,323 139,049 Less than 9th Grade 10.7% 14.0% 14.8% 9th - 12th Grade, No Diploma 13.0% 14.8% 14.7% High School Graduate 28.1% 27.5% 26.6% Some College, No Degree 28.2% 23.2% 22.9% Associate Degree 8.1% 7.1% 7.1% Bachelor's Degree 8.9% 9.5% 9.5% Graduate/Professional Degree 3.1% 3.9% 4.3%
Data Note: Persons of Hispanic Origin may be of any race. The Diversity Index measures the probability that two people from the same area will be from different race/ethnic groups.
Source: U.S. Bureau of the Census, 2000 Census of Population and Housing. ESRI forecasts for 2009 and 2014.
ImperIal beach promenade9 0 0 p a l m a v e n u e , I m p e r I a l b e a c h , c a 9 1 9 3 2
No warranty or representation is made to the accuracy of the foregoing information. Terms of sale or lease and availability are subject to change or withdrawal without notice.
Imper Ial beach promenade9 0 0 p a l m a v e n u e , I m p e r I a l b e a c h , c a 9 1 9 3 2
No warranty or representation is made to the accuracy of the foregoing information. Terms of sale or lease and availability are subject to change or withdrawal without notice.
Dan MalcolM(858) 366-8266
Market ProfilePrepared by ESRI
Site_7 900 Palm Ave 900 Palm Ave 900 Palm AveLatitude: 32.58444 Imperial Beach, CA 9193 Imperial Beach, CA 9193 Imperial Beach, CA 9193Longitude: -117.114 Radius: 1 Miles Radius: 3 Miles Radius: 5 Miles
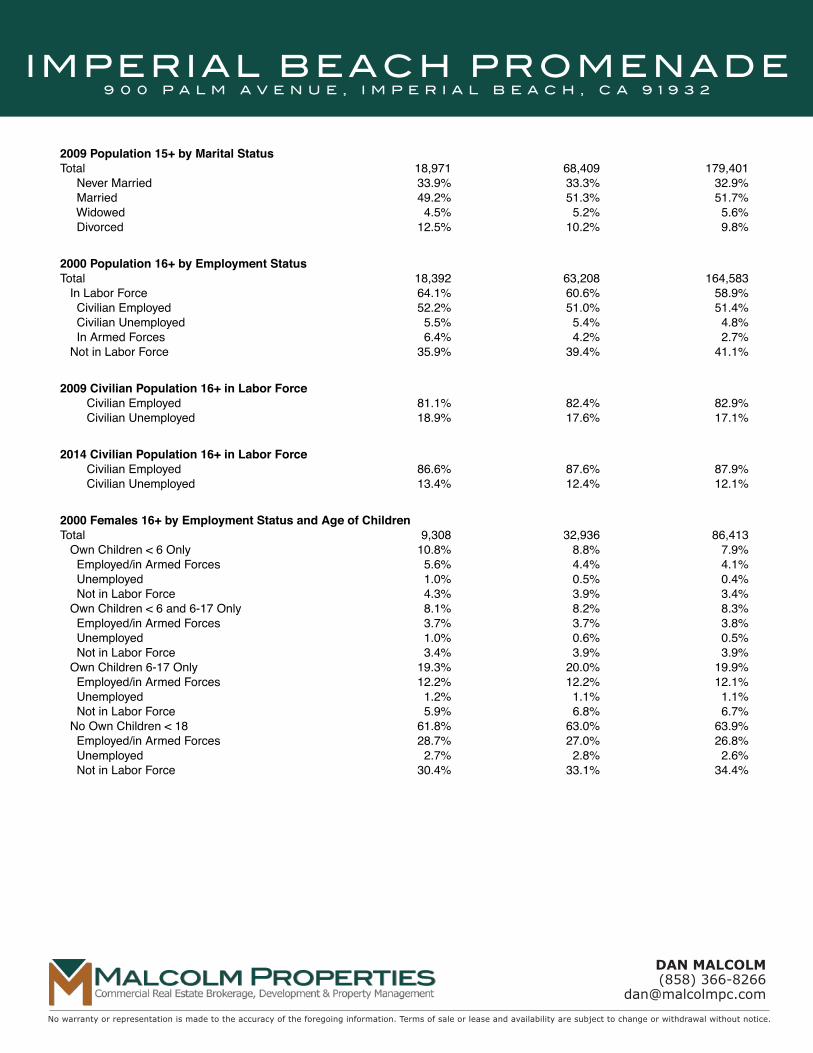
2009 Population 15+ by Marital StatusTotal 18,971 68,409 179,401 Never Married 33.9% 33.3% 32.9% Married 49.2% 51.3% 51.7% Widowed 4.5% 5.2% 5.6% Divorced 12.5% 10.2% 9.8%
2000 Population 16+ by Employment StatusTotal 18,392 63,208 164,583 In Labor Force 64.1% 60.6% 58.9% Civilian Employed 52.2% 51.0% 51.4% Civilian Unemployed 5.5% 5.4% 4.8% In Armed Forces 6.4% 4.2% 2.7% Not in Labor Force 35.9% 39.4% 41.1%
2009 Civilian Population 16+ in Labor Force Civilian Employed 81.1% 82.4% 82.9% Civilian Unemployed 18.9% 17.6% 17.1% 2014 Civilian Population 16+ in Labor Force Civilian Employed 86.6% 87.6% 87.9% Civilian Unemployed 13.4% 12.4% 12.1% 2000 Females 16+ by Employment Status and Age of Children Total 9,308 32,936 86,413 Own Children < 6 Only 10.8% 8.8% 7.9% Employed/in Armed Forces 5.6% 4.4% 4.1% Unemployed 1.0% 0.5% 0.4% Not in Labor Force 4.3% 3.9% 3.4% Own Children < 6 and 6-17 Only 8.1% 8.2% 8.3% Employed/in Armed Forces 3.7% 3.7% 3.8% Unemployed 1.0% 0.6% 0.5% Not in Labor Force 3.4% 3.9% 3.9% Own Children 6-17 Only 19.3% 20.0% 19.9% Employed/in Armed Forces 12.2% 12.2% 12.1% Unemployed 1.2% 1.1% 1.1% Not in Labor Force 5.9% 6.8% 6.7% No Own Children < 18 61.8% 63.0% 63.9% Employed/in Armed Forces 28.7% 27.0% 26.8% Unemployed 2.7% 2.8% 2.6% Not in Labor Force 30.4% 33.1% 34.4%
Source: U.S. Bureau of the Census, 2000 Census of Population and Housing. ESRI forecasts for 2009 and 2014.
©2009 ESRI On-demand reports and maps from Business Analyst Online. Order at www.esri.com/bao or call 800-292-2224 8/26/2009 Page 5 of 8
Imper Ial beach promenade9 0 0 p a l m a v e n u e , I m p e r I a l b e a c h , c a 9 1 9 3 2
No warranty or representation is made to the accuracy of the foregoing information. Terms of sale or lease and availability are subject to change or withdrawal without notice.
Dan MalcolM(858) 366-8266
ImperIal beach promenade9 0 0 p a l m a v e n u e , I m p e r I a l b e a c h , c a 9 1 9 3 2
Market ProfilePrepared by ESRI
Site_7 900 Palm Ave 900 Palm Ave 900 Palm AveLatitude: 32.58444 Imperial Beach, CA 9193 Imperial Beach, CA 9193 Imperial Beach, CA 9193Longitude: -117.114 Radius: 1 Miles Radius: 3 Miles Radius: 5 Miles
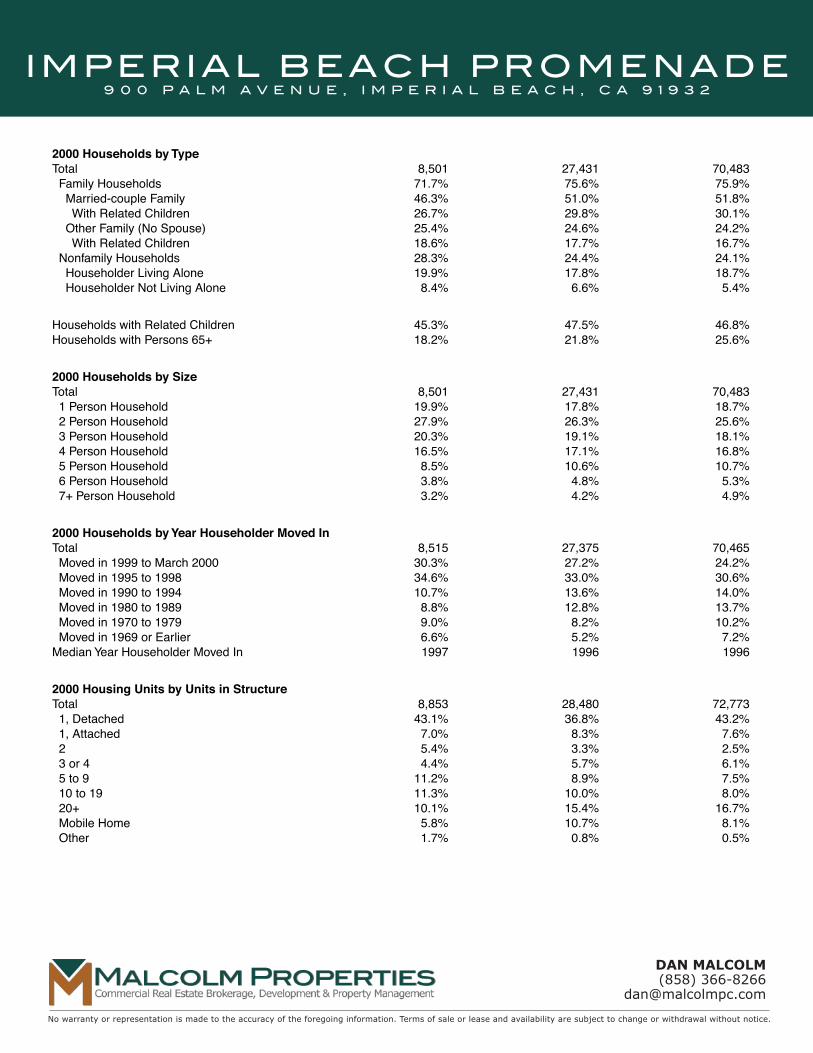
2000 Households by Type Total 8,501 27,431 70,483 Family Households 71.7% 75.6% 75.9% Married-couple Family 46.3% 51.0% 51.8% With Related Children 26.7% 29.8% 30.1% Other Family (No Spouse) 25.4% 24.6% 24.2% With Related Children 18.6% 17.7% 16.7% Nonfamily Households 28.3% 24.4% 24.1% Householder Living Alone 19.9% 17.8% 18.7% Householder Not Living Alone 8.4% 6.6% 5.4%
Households with Related Children 45.3% 47.5% 46.8% Households with Persons 65+ 18.2% 21.8% 25.6% 2000 Households by Size Total 8,501 27,431 70,483 1 Person Household 19.9% 17.8% 18.7% 2 Person Household 27.9% 26.3% 25.6% 3 Person Household 20.3% 19.1% 18.1% 4 Person Household 16.5% 17.1% 16.8% 5 Person Household 8.5% 10.6% 10.7% 6 Person Household 3.8% 4.8% 5.3% 7+ Person Household 3.2% 4.2% 4.9% 2000 Households by Year Householder Moved In Total 8,515 27,375 70,465 Moved in 1999 to March 2000 30.3% 27.2% 24.2% Moved in 1995 to 1998 34.6% 33.0% 30.6% Moved in 1990 to 1994 10.7% 13.6% 14.0% Moved in 1980 to 1989 8.8% 12.8% 13.7% Moved in 1970 to 1979 9.0% 8.2% 10.2% Moved in 1969 or Earlier 6.6% 5.2% 7.2% Median Year Householder Moved In 1997 1996 1996
2000 Housing Units by Units in StructureTotal 8,853 28,480 72,773 1, Detached 43.1% 36.8% 43.2% 1, Attached 7.0% 8.3% 7.6% 2 5.4% 3.3% 2.5% 3 or 4 4.4% 5.7% 6.1% 5 to 9 11.2% 8.9% 7.5% 10 to 19 11.3% 10.0% 8.0% 20+ 10.1% 15.4% 16.7% Mobile Home 5.8% 10.7% 8.1% Other 1.7% 0.8% 0.5%
2000 Housing Units by Year Structure Built Total 8,834 28,419 72,768 1999 to March 2000 0.7% 0.7% 1.0% 1995 to 1998 1.9% 1.5% 1.5% 1990 to 1994 3.9% 5.0% 3.7% 1980 to 1989 15.0% 22.2% 18.4% 1970 to 1979 22.6% 28.6% 29.2% 1969 or Earlier 55.9% 42.0% 46.2% Median Year Structure Built 1967 1973 1971
Source: U.S. Bureau of the Census, 2000 Census of Population and Housing.
©2009 ESRI On-demand reports and maps from Business Analyst Online. Order at www.esri.com/bao or call 800-292-2224 8/26/2009 Page 7 of 8
ImperIal beach promenade9 0 0 p a l m a v e n u e , I m p e r I a l b e a c h , c a 9 1 9 3 2
No warranty or representation is made to the accuracy of the foregoing information. Terms of sale or lease and availability are subject to change or withdrawal without notice.
Imper Ial beach promenade9 0 0 p a l m a v e n u e , I m p e r I a l b e a c h , c a 9 1 9 3 2
No warranty or representation is made to the accuracy of the foregoing information. Terms of sale or lease and availability are subject to change or withdrawal without notice.
Dan MalcolM(858) 366-8266
Market ProfilePrepared by ESRI
Site_7 900 Palm Ave 900 Palm Ave 900 Palm AveLatitude: 32.58444 Imperial Beach, CA 9193 Imperial Beach, CA 9193 Imperial Beach, CA 9193Longitude: -117.114 Radius: 1 Miles Radius: 3 Miles Radius: 5 Miles
Top 3 Tapestry Segments
1. Inner City Tenants Inner City Tenants Urban Villages2. International Marketpl Urban Villages International Marketpl3. Aspiring Young Familie International Marketpl Inner City Tenants
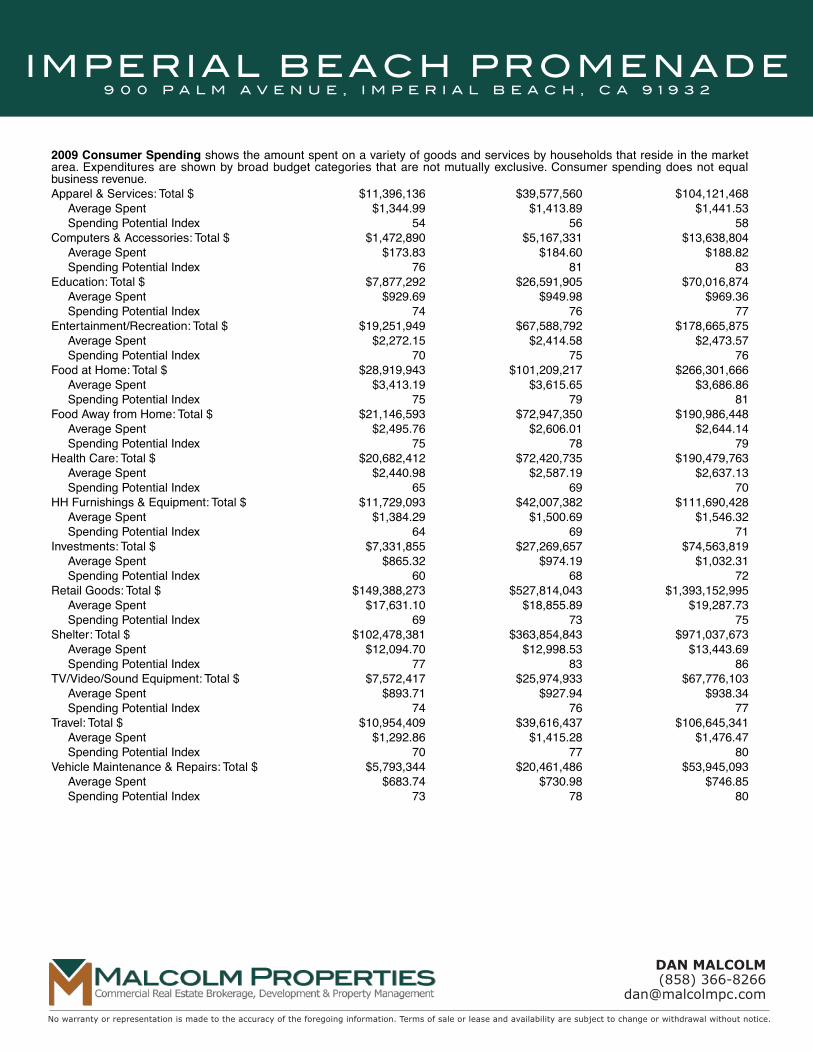
2009 Consumer Spending shows the amount spent on a variety of goods and services by households that reside in the market area. Expenditures are shown by broad budget categories that are not mutually exclusive. Consumer spending does not equal business revenue.Apparel & Services: Total $ $11,396,136 $39,577,560 $104,121,468 Average Spent $1,344.99 $1,413.89 $1,441.53 Spending Potential Index 54 56 58Computers & Accessories: Total $ $1,472,890 $5,167,331 $13,638,804 Average Spent $173.83 $184.60 $188.82 Spending Potential Index 76 81 83Education: Total $ $7,877,292 $26,591,905 $70,016,874 Average Spent $929.69 $949.98 $969.36 Spending Potential Index 74 76 77
Entertainment/Recreation: Total $ $19,251,949 $67,588,792 $178,665,875 Average Spent $2,272.15 $2,414.58 $2,473.57 Spending Potential Index 70 75 76 Food at Home: Total $ $28,919,943 $101,209,217 $266,301,666 Average Spent $3,413.19 $3,615.65 $3,686.86 Spending Potential Index 75 79 81 Food Away from Home: Total $ $21,146,593 $72,947,350 $190,986,448 Average Spent $2,495.76 $2,606.01 $2,644.14 Spending Potential Index 75 78 79 Health Care: Total $ $20,682,412 $72,420,735 $190,479,763 Average Spent $2,440.98 $2,587.19 $2,637.13 Spending Potential Index 65 69 70 HH Furnishings & Equipment: Total $ $11,729,093 $42,007,382 $111,690,428 Average Spent $1,384.29 $1,500.69 $1,546.32 Spending Potential Index 64 69 71 Investments: Total $ $7,331,855 $27,269,657 $74,563,819 Average Spent $865.32 $974.19 $1,032.31 Spending Potential Index 60 68 72 Retail Goods: Total $ $149,388,273 $527,814,043 $1,393,152,995 Average Spent $17,631.10 $18,855.89 $19,287.73 Spending Potential Index 69 73 75 Shelter: Total $ $102,478,381 $363,854,843 $971,037,673 Average Spent $12,094.70 $12,998.53 $13,443.69 Spending Potential Index 77 83 86 TV/Video/Sound Equipment: Total $ $7,572,417 $25,974,933 $67,776,103 Average Spent $893.71 $927.94 $938.34 Spending Potential Index 74 76 77 Travel: Total $ $10,954,409 $39,616,437 $106,645,341 Average Spent $1,292.86 $1,415.28 $1,476.47 Spending Potential Index 70 77 80 Vehicle Maintenance & Repairs: Total $ $5,793,344 $20,461,486 $53,945,093 Average Spent $683.74 $730.98 $746.85 Spending Potential Index 73 78 80
Data Note: The Spending Potential Index represents the amount spent in the area relative to a national average of 100.
Source: Consumer Spending data are derived from the 2005 and 2006 Consumer Expenditure Surveys, Bureau of Labor Statistics. ESRI.
©2009 ESRI On-demand reports and maps from Business Analyst Online. Order at www.esri.com/bao or call 800-292-2224 8/26/2009 Page 8 of 8


![Imperial Beach, CaliforniaF99967EB-BF87-4CB2-B… · 9th and palm purchase agmt v15 10-8-13 purchase and sale agreement [9th and palm] by and between imperial beach redevelopment](https://static.fdocuments.net/doc/165x107/606038eb31ebb54e4f43e208/imperial-beach-california-f99967eb-bf87-4cb2-b-9th-and-palm-purchase-agmt-v15.jpg)