Impaired language function in generalized epilepsy: Inadequate
43
Impaired language function in generalized epilepsy: Inadequate suppression of the default mode network Helena Gauffin, Helene van Ettinger-Veenstra, Anne-Marie Landtblom, Daniel Ulrici, Anita McAllister, Thomas Karlsson and Maria Engström Linköping University Post Print N.B.: When citing this work, cite the original article. Original Publication: Helena Gauffin, Helene van Ettinger-Veenstra, Anne-Marie Landtblom, Daniel Ulrici, Anita McAllister, Thomas Karlsson and Maria Engström, Impaired language function in generalized epilepsy: Inadequate suppression of the default mode network, 2013, Epilepsy & Behavior, (28), 1, 26-35. http://dx.doi.org/10.1016/j.yebeh.2013.04.001 Copyright: Elsevier http://www.elsevier.com/ Postprint available at: Linköping University Electronic Press http://urn.kb.se/resolve?urn=urn:nbn:se:liu:diva-91043
Transcript of Impaired language function in generalized epilepsy: Inadequate

Impaired language function in generalized
epilepsy: Inadequate suppression of the default
mode network
Helena Gauffin, Helene van Ettinger-Veenstra, Anne-Marie Landtblom, Daniel Ulrici, Anita
McAllister, Thomas Karlsson and Maria Engström
Linköping University Post Print
N.B.: When citing this work, cite the original article.
Original Publication:
Helena Gauffin, Helene van Ettinger-Veenstra, Anne-Marie Landtblom, Daniel Ulrici, Anita
McAllister, Thomas Karlsson and Maria Engström, Impaired language function in generalized
epilepsy: Inadequate suppression of the default mode network, 2013, Epilepsy & Behavior,
(28), 1, 26-35.
http://dx.doi.org/10.1016/j.yebeh.2013.04.001
Copyright: Elsevier
http://www.elsevier.com/
Postprint available at: Linköping University Electronic Press
http://urn.kb.se/resolve?urn=urn:nbn:se:liu:diva-91043

1
Impaired language function in generalized epilepsy:
Inadequate suppression of the default mode network
Helena Gauffin∗a,b, Helene van Ettinger-Veenstra∗b,c, Anne-Marie Landtbloma,b,
Daniel Ulricia, Anita McAllisterd, Thomas Karlssonb,e, and Maria Engstromb,c
∗ Both authors contributed equally to the preparation of this article.
a Department of Clinical and Experimental Medicine (IKE), Division of Neu-
rology, Linkoping University, UHL, LiM, Linkoping, Sweden
b Center for Medical Image Science and Visualization (CMIV), Linkoping
University, Linkoping, Sweden
c Department of Medical and Health Sciences (IMH), Division of Radiology,
Linkoping University, Linkoping, Sweden
d Department of Clinical and Experimental Medicine (IKE), Division of Lo-
gopedics, Linkoping University, Sweden
e Department of Behavioral Science and Learning, Division of Disability Re-
search and Linnaeus Centre HEAD, Linkoping University, Linkoping, Sweden
Correspondence
Maria Engstrom, CMIV, Linkoping University/US, 581 85 Linkoping, Swe-
den. e-mail: [email protected]. telephone: +46-101038901.

2
Abstract
We aimed to study the effect of a potential default mode network (DMN)
dysfunction on language performance in epilepsy. Language dysfunction in
focal epilepsy has previously been connected to brain damage in language
associated cortical areas. In this work, we studied generalized epilepsy (GE)
without focal brain damage, to see if the language function was impaired.
We used functional magnetic resonance imaging (fMRI) to investigate if the
DMN was involved. Eleven persons with GE and 28 healthy controls were
examined with fMRI during a sentence reading task. We could demonstrate
impaired language function, reduced suppression of DMN, and, specifically,
an inadequate suppression of activation in the left anterior temporal lobe
and the posterior cingulate cortex, as well as an aberrant activation in the
right hippocampal formation. Our results highlight the presence of language
decline in people with epilepsy of not only focal, but also generalized origin.
Keywords
generalized epilepsy, functional Magnetic Resonance Imaging (fMRI), lan-
guage performance, sentence reading, verbal fluency, default mode network,
hippocampus, temporal lobe, posterior cingulate cortex

3
1 Introduction
Epilepsy is a complex condition that is often associated with cognitive impair-
ment. Our work on young people with epilepsy has shown that self-esteem
and sence of coherence (SOC) decrease over time [1] and that cognitive im-
pairment places a heavy burden on the patient’s daily life [2]. Cognitive
problems are often rated highest on the list of problems associated with
epilepsy [3]. Recurrent seizures, side effects of anti-epileptic drugs, or the
underlying disease can affect vital cognitive domains such as memory, visu-
ospatial functions, and, addressed in the current study, language [4, 5, 6, 7, 8].
Due to the dominant role of the left temporal lobe in language processing,
language function in epilepsy has been most extensively studied in patients
with focal seizures originating in the left temporal lobe, although language
impairment has also been demonstrated in right temporal lobe epilepsy [9].
Generalized epilepsy (GE) comprises a heterogeneous group of epilepsies
of genetic origin with a widespread rather than focal atypical cortical activ-
ity [10, 11]. Previous findings suggest subtle frontal executive impairments
in GE patients having normal IQ [12]. Language decline has been found in
children with GE [13, 14]. However, language function in adults with GE
has not been studied as thoroughly as in individuals with epilepsy of focal
origin.
By means of functional Magnetic Resonance Imaging (fMRI), the func-
tional networks of the brain that are involved in cognitive processing can be
identified. Brain regions that are active during specific cognitive tasks show
increased (i.e. positive) blood oxygen level dependent (BOLD) response dur-
ing task performance compared to baseline. It has been shown that brain
networks that are involved in several aspects of human brain function, also

4
display coherent low frequency BOLD fluctuations during rest [15]. In addi-
tion, it has repeatedly been shown that certain brain networks consistently
show negative BOLD response during performance of various cognitive tasks
as well as during rest [16, 17, 18]. This means that during cognitive pro-
cessing some regions are activated, which is expressed as positive and corre-
lated BOLD responses in fMRI, whereas other regions express negative and
anti-correlated BOLD responses. It is hypothesized that a high degree of
temporal correlation within executive networks facilitates cognitive process-
ing [19] and likewise that the presence of anti-correlated networks are equally
important [20].
Brain regions with negative BOLD response during cognitive processing
are referred to as the default mode network (DMN) or the resting state net-
work [21]. This because DMN regions are functionally connected to each
other during rest when spontaneous fluctuations of the BOLD time course
occur. Commonly, the anterior and posterior cortical midline structures and
bilateral structures in the parietal and temporal cortices, and the hippocam-
pal formation are regarded as DMN regions [18].
A number of studies have found decreased resting state connectivity
within DMN in epilepsy patients with generalized myoclonic, tonic-clonic
and/or absence seizures [22, 23, 24]. McGill and coworkers [22] provided
evidence of abnormal functional integration and segregation of DMN in GE.
They observed decreased temporal correlation within DMN and decreased
anti-correlation between DMN and other networks in the brain during rest. It
has been shown that DMN is involved in loss of consciousness in epilepsy [25,
26]. Thus, findings of decreased DMN connectivity in GE have been inter-
preted to be related to ictal unconsciousness [23, 24]. Luo et al. [24] also

5
posed the additional hypothesis of disrupted language networks in absence
epilepsy based on their findings of decreased functional connectivity between
language regions in the frontoparietal cortex and the temporal cortex during
rest. Although a few studies have found aberrations within DMN in GE dur-
ing resting state fMRI, we are not aware of any study addressing the DMN
in GE during language processing.
In previous studies it has been shown that the more difficult the task, the
greater the negative BOLD response in DMN [27, 28, 29]. Task difficulty can
be modulated parametrically by e.g. changing stimulus presentation rate,
working memory load, or number of presented objects. Language, on the
other hand, is a complex cognitive process [30]. It is therefore not straight-
forward to parametrically vary the level of difficulty during language pro-
cessing. Addressing this issue, manipulations of complexity have been used.
This can be done by varying the structural complexity [31] or the semantic
complexity, for example by using congruent vs. incongruent sentences [32].
Brain responses to incongruent words measured by the N400 event-related
potential (ERP) are commonly interpreted to signify mismatch of what is
expected in a given context [33]. Later interpretations of the N400 peak en-
compasses a broader definition and the prevalent interpretation of the N400
peak is that it denotes ‘contextual integration’ and reflects the capacity to
integrate complex, anomalous information [34]. Thus, congruent sentences
are easier and less complex to process, whereas incongruent sentences are
more difficult and require more complex language processing [32, 34].
In the present study, we investigated language performance with a test
battery for subtle language deficits in adults, and the negative BOLD re-
sponse during a sentence-reading task. The aims were to assess language

6
function in GE, and to identify DMN regions with negative BOLD response
during language processing in people with GE and in healthy controls. A
third aim was to investigate if adding complexity to the language task by
using incongruent sentences would modulate the negative BOLD response.
We hypothesized that adult people with GE would have language deficits
as previously have been shown in children with GE [13, 14]. We also hy-
pothesized that people with GE would have inadequate suppression of DMN
during language processing expressed by abnormal task-related functional
DMN segregation, in line with the recent resting-state findings by McGill et
al. [22]. Finally, we also hypothesized that adding complexity to the sen-
tence reading task would induce a further reduction of the BOLD response
in DMN, according to previous findings in the literature [29].
2 Methods
2.1 Participants
Eleven participants with GE were recruited from the Department of Neurol-
ogy at Linkoping University Hospital or from the outpatient clinic at Motala
General Hospital. Inclusion criteria were people with GE in ages between 18
and 35 years that were fluent in Swedish, without reported language dysfunc-
tion, and that had completed at least the required nineyears of elementary
schooling. The diagnoses were set after examination of anamnesis, semiol-
ogy, MRI, electroencephalogram (EEG), and - when applicable - ictal EEG-
registration. The International League Against Epilepsy revised terminology
of seizures and epilepsies was applied [35]. Exclusion criteria were use of a
vagus nerve stimulator or other electrical or metal implant that could inter-

7
fere with the fMRI investigation, other concomitant medical, neurological, or
psychiatric illnesses, and the use of psychoactive drugs (apart from epilepsy
treatment) that could interfere with performance. Demographic data for all
GE participants are presented in Table 1.
The study population included 11 participants with GE; five were males
and six were females. The mean age of the epilepsy patients was 26.5 years
(range = 20–35 years, std = 5.0). One GE participant was left-handed. The
GE participants had in mean 13.2 years of education (range = 12–16, std
= 1.4). In addition, data from 27 healthy controls are reported; 13 controls
were males and 14 were females. The mean age of the controls was 25.5
years (range = 18–35 years, std = 4.21). One control was left-handed. The
controls had in mean 14.6 years of education = 14.6 (range = 12–20, std =
2.25).
All participants gave both verbal and written informed consent to par-
ticipate in the study according to the Declaration of Helsinki. In a clinical
interview before inclusion we ensured that none of the participants had cog-
nitive deficits or other health issues that prevented them from giving an
informed consent. Approval for the study was obtained from the Regional
Ethical Review Board in Linkoping (2010/157-31 and M152-07 T22-09).
2.2 Procedure
This study was part of a larger project aiming at investigating language and
memory function in epilepsy of different origin and in healthy controls with
varying language abilities. In a separate session before fMRI, all participants
were tested with a neuropsychological test battery, including the language
assessment tasks also used in the present study. During the fMRI session,

8
the participants were investigated with a sentence reading task.
2.3 Cognitive Language Tasks
Word fluency and higher language abilities were assessed using two tests
(FAS and BeSS) taken from the Test of Language Competence translated into
Swedish [36]. FAS is a version of the verbal fluency Controlled Oral Word
Association Test (COWAT) and uses the phonemic cues F, A, and S [37].
The participants were asked to generate as many words as possible within one
minute, excluding proper names and places. The BeSS test (“Bedomning av
Subtila Sprakstorningar” - Assessment of Subtle Language Deficits) consists
of seven sub-tasks developed to provide an in-depth assessment of patients
with milder but still significant language problems. This language assessment
battery was used since people with epilepsy typically perform at normal or
near-normal levels on traditional aphasia examinations, which aim at patients
with more pronounced deficits. BeSS includes the following subtests: REP
= sentence repetition, CON = sentence construction, INF = inference (text
understanding), COM = understanding complex embedded sentences, GAR
= understanding garden-path sentences, MET = understanding metaphors,
and VOC = vocabulary. Each subtest of 10 questions can result in a
maximum of 30 points and a total of 210 points for the entire test.
2.4 fMRI data acquisition
The functional images were obtained using a gradient echo planar imaging
sequence, sensitive to the blood oxygen level dependent (BOLD) response.
Repetition time (TR) = 3 s, time to echo (TE) = 40 ms, flip angle (FA) = 90◦,

9
voxel size = 3×3×3 mm3, slice gap = 0.5 mm, 35 slices, field of view (FOV)
= 228×204×122 mm3. The slices were aligned between the floor of the sella
turcica and the posterior angle of the fourth ventricle. The MR-scanner was
a Philips Achieva 1.5T. In addition, an anatomical 3D T1-weighted image
of each participants whole brain was acquired to use in the normalization
process: TR = 25 ms, TE = 4.6 ms, FA = 30◦, voxel size = 1×1×1 mm3,
175 slices, FOV = 240×240×175 mm3.
2.5 fMRI paradigm
The fMRI examination consisted of a block designed sentence reading task,
which was visually presented to the participants through high-resolution
video goggles (Resonance Technology Inc., Northridge, CA, USA). During
fMRI the participants read sets of semantically congruent and incongruent
sentences, of which the latter was regarded as a more complex task. An ex-
ample of a congruent sentence is: The reindeer has very large antlers (“Renen
har mycket stora horn”), and an example of an incongruent sentence is: We
took a shower in the taxi (“Vi tog en dusch i taxin”). After reading each
sentence, the participants were asked to indicate by button presses on a re-
sponse box (LUMItouch, Photon Control Inc., Burnaby, BC, Canada) if the
sentence described an event or action indoors or outdoors, aiming to check
if the participants had read all sentences. During the baseline task, the par-
ticipants were presented alternating %-signs and arrows, together resembling
the visual appearance of a sentence, and they were asked to indicate the di-
rection of the arrows (left or right). Reaction times were used as performance
measures for this task.
Each task block (congruent respectively incongruent sentence reading as

10
well as the baseline task) lasted 12 seconds and contained four trials, which
were presented sequentially. The task blocks were presented in randomized
order and repeated 10 times. The total time for the fMRI examination was
approximately 6.5 minutes. Superlab Pro 4 (Cedrus Corp., San Pedro, CA,
USA) software was used for task presentation and recording of behavioral
responses.
2.6 Image analysis
Preprocessing and analysis of fMRI data were performed using SPM8 (www.
fil.ion.ucl.ac.uk/spm/software/spm8). In the preprocessing stage, the fMRI
images were realigned to the first image to correct for movement during
scanning, co-registered to the participants structural MRI, normalized to
a 2×2×2 mm3 Montreal Neurological Institute (MNI) template using the
parameters obtained from a segmentation of the structural MRI, and finally
smoothed with an 8 mm full width half maximum (FWHM) Gaussian kernel.
All participants’ images were analyzed for positive and negative BOLD re-
sponse during reading the congruent and incongruent sentences. The covari-
ates representing sentence reading were contrasted against baseline: sentence
reading>baseline and sentence reading<baseline, respectively. The contrast
images for each participant were entered into the second level analyses. Pos-
itive and negative BOLD responses to sentence reading were analyzed with
a one-sample t-test of random effects for each group, GE and controls, sepa-
rately. Differences in BOLD responses between people with GE and healthy
controls were analyzed with two-sample t-tests.
Negative BOLD responses were estimated in Regions of Interest (ROIs)
representing the default mode network (DMN). All ROIs were constructed us-

11
ing the Automated Anatomical Labeling atlas in the WFU PickAtlas tool [38]
with guidance from [18]. The ROIs were bilateral regions in the medial pre-
frontal and anterior cingulate cortices, posterior cingulate cortex and pre-
cuneus, inferior parietal lobe, lateral temporal lobe (middle and superior
temporal gyrus), and the hippocampal formation (hippocampus proper and
parahippocampal gyrus). Since both positive and negative BOLD responses
were observed in the temporal lobe, but in different regions, adapted DMN-
related ROIs in the temporal lobe were used in the statistical comparison be-
tween individuals with GE and controls. Image masks in the temporal lobe
were created from from clusters with negative BOLD response in healthy
controls during reading of congruent sentences When creating the temporal
lobe ROIs we used a significance threshold of p=0.01 and a spatial threshold
of 10 voxels. The resulting temporal lobe ROIs were located in the anterior
superior temporal gyrus and the posterior middle temporal gyrus in both
hemispheres. Adapted ROIs in the temporal lobe were created using the
MarsBar toolbox [39].
Statistical significance in the ROIs was calculated from unthresholded
images (t=1). Results were reported as significant if the peak p-value was
less than 0.05, corrected for multiple comparisons using the Family Wise
Error (FWE) method.
2.7 Statistical analysis
Statistical analysis including t-tests of the behavioral results on FAS and re-
action times and a multivariate analysis of variance of the BeSS subtests were
performed using the SPSS statistics software, version 20.0. (IBM, Armonk,
NY, USA)
12
3 Results
3.1 Behavioral results
People with GE performed worse than healthy controls according to the
assessment of subtle language deficits (BeSS), see Table 2 for the statistical
results. GE participants performed significantly worse than controls in all
BeSS subtests except in the INF subtest, which measures inference or text
understanding. The Levene’s test indicated unequal variance between groups
in INF. When correcting for the non equal variance, the difference between
GE participants and controls did not reach significance. As can be seen in
Table 2, some participants in both the GE group and the controls achieved
maximum points (= 30) in some BeSS subtests, however, the range between
minimum and maximum points was quite wide in all tests. The difference in
performance on the standard vocabulary task (FAS) was not significant.
People with GE had longer reaction times during reading of both con-
gruent and incongruent sentences, as well as during the baseline task. When
comparing performance between the two conditions of the sentence reading
task, it was found that the healthy controls had longer reaction times dur-
ing the incongruent task, p <0.048, indicating that this task might be more
difficult to perform. There was no evidence of difference in reaction time be-
tween the congruent and the incongruent tasks for people with GE, p=0.350,
indicating that they might have perceived both tasks to be equally difficult.
However, given the rather large standard deviation and the small number of
participants in the GE group, the power of the test was limited.
13
3.2 Positive BOLD response
Reading both congruent and incongruent sentences elicited task-positive BOLD
response in a mainly left-lateralized fronto-temporal network in all partici-
pants, although right lateralized activation was also observed in the frontal
cortex (Figs. 1A, 1C). In addition, positive BOLD responses were observed
in the anterior cingulate cortex, continuing to the supplementary motor area,
and in the occipital cortex. Images of task-positive brain activation during
the incongruent condition can be found in supplementary Figure S1. As
seen in Figure 1A and 1C, healthy controls and people with GE had similar
activation patterns. Note that for the visualization of the results different
significance thresholds were used for controls and GE. A previous study,
showed no statistical differences in task-positive BOLD response between
healthy participants and people with GE [40].
3.3 Negative BOLD response in healthy controls
In healthy controls, negative BOLD response to the congruent condition of
the sentence reading task was found in large parts of the DMN (Fig. 1B, S1).
In Table 3, the p-values and Z statistics for the voxels with most negative
BOLD in each ROI are shown together with the MNI co-ordinates for those
voxels. For the incongruent condition, negative BOLD was observed in all
bilateral DMN ROIs; however in the right parahippocampal gyrus the result
showed only a trend. Inspecting the results in Table 3, it appears that the
incongruent condition resulted in more negative BOLD responses compared
to the congruent condition. A statistical analysis of the difference between
the two conditions of the task revealed that lower BOLD responses, i.e. more

14
negative BOLD, were found during the incongruent condition in the anterior
cingulate cortex, p=0.017 (left hemisphere), p=0.025 (right hemisphere); and
the medial frontal cortex, p=0.012 (left hemisphere), p=0.023 (right hemi-
sphere). The voxels that showed significant difference between the two con-
ditions were located close to the midline and close the border between the
anterior cingulate and medial frontal cortex ROIs, MNI co-ordinates = [-2,
54, -2]; [2, 52, 14]; [-2, 54, -4]; [2; 54, -4]. This area is commonly denoted as
the pregenual part of the anterior cingulate cortex. Comparing the locations
of those significantly different voxels, it was found that they were located
within the areas of negative BOLD during the incongruent condition, but
mostly inferior to the negative BOLD cluster during the congruent condi-
tion. This means that the more complex task induced a further reduction
of the BOLD response in adjacent regions. Note that negative BOLD in the
anterior cingulate/medial frontal cortex formed one connected cluster (Figs.
1B, S1B). There were no ROIs that showed more negative BOLD during the
congruent condition as compared to the incongruent condition.
3.4 Negative BOLD response in generalized epilepsy
Viewing the images in Figure 1D, people with GE had seemingly insufficient
suppression of DMN as compared to healthy controls. A statistical ROI
analysis confirmed this result. In Table 4, the p-values and Z statistics for
the voxels with most negative BOLD in each ROI are shown together with the
MNI co-ordinates for those voxels. During reading of congruent sentences,
people with GE had statistically significant negative BOLD response only in
the bilateral anterior cingulate cortex and the left inferior parietal cortex.
During the incongruent version of the task, GE participants showed neg-

15
ative BOLD in the bilateral anterior and posterior cingulate cortex, bilat-
eral medial frontal cortex, the right superior and middle temporal cortex
(Table 4). A statistical comparison between conditions revealed that GE
participants had significantly lower BOLD responses during the incongruent
condition compared to the congruent condition in the right hippocampus,
p=0.031, MNI co-ordinates = [28 -38 -2]; and the left superior temporal cor-
tex, p=0.008, MNI co-ordinates = [-54 -16 2]. However, when inspecting the
locations of those significantly different voxels it was found that they were
not located within areas of negative BOLD, but rather in between areas
displaying positive and negative BOLD, respectively.
As shown in Table 5, significant differences in negative BOLD between
people with GE and healthy controls during the congruent version of the
task were found in the left anterior temporal cortex (Fig. 2) and in the right
posterior cingulate cortex (Fig. 3). There were also tendencies to different
activation in the left posterior cingulate cortex (Fig. 3). For the congruent
condition, GE participants had also significantly increased BOLD response in
the right parahippocampal gyrus, and marginally significant increased BOLD
response in the right hippocampus proper as compared to the controls (Fig.
4). Inspection of these results revealed that GE participants had positive
BOLD response in the right-sided parahippocampal gyrus whereas the con-
trols lacked task-related BOLD response, neither positive nor negative, in
this region. There were no significant differences between GE and controls
for the incongruent condition.

16
4 Discussion
In this study we investigated language ability and the negative BOLD re-
sponse in DMN during language processing in adults with GE and healthy
controls. Although abnormal function in DMN in people with GE has been
pointed out by previous investigators, to our knowledge, this is the first time
that DMN has been investigated in individuals with GE during language
processing. As hypothesized, we found impaired language function in peo-
ple with GE as well as inadequate suppression of the DMN during sentence
reading.
4.1 Language dysfunction in generalized epilepsy
Language function in people with epilepsy is presently not focused in the
clinical setting, probably because these patients seldom display any obvious
speech problems, like in aphasia. It is well known that cognitive problems in
epilepsy exist, as a consequence of the brain damage that caused the epileptic
disorder, or as a side effect of anti-epileptic pharmaco-therapy. Language as
a specific cognitive function is, however, seldom examined in the clinic. In
research, language in epilepsy of focal origin, especially regarding the cor-
responding temporal and frontal cerebral areas, has frequently been investi-
gated. In contrast, language function in persons with GE has hardly been
focused at all. Our study shows that language difficulties clearly are present
in generalized epilepsy. Interestingly, the examinations performed using the
standard verbal fluency task (FAS) did not reveal any obvious pathology,
but the instrument BeSS, determined to identify subtle language disturbance,
turned out to be sensitive and displayed a great difference regarding language

17
performance in persons with GE compared with healthy controls. Language
deficits in GE apparently involve several aspects of semantic language pro-
cessing, since GE participants performed worse than controls in all BeSS
subtests; however, the test for inference was not significant after a correction
for nonequal variance.
These results showing language dysfunction in GE should be taken into
consideration when dealing with persons with epilepsy, as adequately ad-
dressing language problems would help to minimize negative consequences of
the impairment. Academic underachievement adds to the burden of epilepsy
and the consequences of difficulties in reading and writing can have a big
impact on both education and future employment possibilities. Among chil-
dren with idiopatic epilepsy underachievement in school have been seen in
61% [41]. Learning disabilities have been mostly studied among children with
epilepsy but the greatest consequences affect the adult. Young adults with
epilepsy express that they believe their whole life would have been much bet-
ter and easier if they could have achieved better results in school [2]. They
feel they can not use their whole potential.
4.2 Inadequate negative BOLD response
It is well established that the human brain is organized into correlated and
anti-correlated functional networks in the absence of external tasks [20, 42].
Cognitive processing is facilitated if the neuronal fluctuations within execu-
tive networks are correlated in time [19]. However, it is not only the presence
of correlated, task-positive brain networks that governs performance. In-
creasing evidence supports the hypothesis that anti-correlated networks are
as important for human brain function as correlated networks [20, 43, 44].

18
Research on working memory performance indicates that that DMN regions
with decreased BOLD response is not simply disengaged during the task [45].
Rather, these DMN regions promote cognitive performance. Thus, for every
cognitive task there is a balance between activated and deactivated neural
networks, and if suppression is inhibited, a disturbance of cognitive functions
may arise [46].
In the present study, we found less suppression in DMN in GE partici-
pants, when investigating the negative BOLD response during sentence pro-
cessing. By inspection of Figure 1, we tentatively suggest that GE partici-
pants had a global deficiency to suppress DMN. Thus, a possible explanation
of the result is that there is a reduced functional segregation of DMN in GE,
as proposed by McGill et al. [22]. This reasoning is supported by the observed
significant difference between GE participants and controls in the posterior
cingulate cortex, as this region is suggested to be a central node in DMN
with strong interactions to other nodes of the network [47]. In the present
study, we also found significant differences in negative BOLD between GE
participants and controls in the left anterior temporal cortex. This finding
could have a direct implication for the language dysfunction in GE.
In accordance with previous work on the relation between cognitive ca-
pacity and the negative BOLD response in DMN, for example studies on
normal aging [43, 44], we suggest that insufficient suppression of DMN is
related to the language impairment that was observed in GE participants in
the present study.

19
4.3 Hippocampal activation
According to the literature, the hippocampal formation is part of DMN [18].
In our study, the hippocampus proper and parahippocampal gyrus exhib-
ited negative BOLD response during sentence reading in healthy partici-
pants. When comparing the BOLD response between the two groups, we
found a difference between healthy controls and GE participants in the right
parahippocampal gyrus during the congruent condition of the sentence read-
ing task. A closer look into the images of positive and negative BOLD
response revealed that GE participants had a positive BOLD response in
the right parahippocampal gyrus and not an anticipated negative response
in this region. Moreover, the healthy controls did not show negative BOLD
response in this particular subregion of the parahippocampal gyrus, which
is clearly visualized in Figure 4. Thus, the difference between people with
GE and controls could not be interpreted as a difference in negative BOLD
response, but rather as an additional activation in right-sided hippocampal
areas for people with GE during performance of the sentence reading task.
Although the hippocampus and the parahippocampal cortex are parts of the
DMN, these areas have distinct functional properties. The hippocampus and
the parahippocampal cortex has been thought to be exclusively involved in
episodic memory, however, recent neuroimaging research has shown the im-
portance of these regions in semantic processing [48, 49]. The role of the
hippocampal formation in semantic tasks is also supported by the findings
of reduced language production capacity in patients with hippocampal dam-
age [50].

20
4.4 Task-complexity modulations
A third aim of the present study was to investigate if task complexity would
modulate the negative BOLD response in the DMN. We approached this aim
by designing the sentence reading task with two conditions: reading of con-
gruent and incongruent sentences, respectively. We anticipated that reading
of incongruent sentences would be more cognitive demanding, which also
was supported by the longer reaction times for the incongruent condition in
healthy participants. We also hypothesized that the more demanding version
of the task would induce a further reduction of the BOLD response, accord-
ing to previous findings in the literature [29]. Indeed, the healthy controls,
reduced their BOLD response in the pregenual anterior cingulate cortex and
adjacent regions in the medial frontal cortex during the incongruent condition
of the sentence reading task. These results indicate that modulation of the
BOLD response in the anterior cingulate/medial frontal cortex is especially
important when switching between different task demands. This conclusion
is supported by the common interpretation that the anterior cingulate cor-
tex has a pivotal role in decision-making, task-switching, and integration of
cognitive and emotional stimuli [51, 52, 53].
Brain responses to added complexity in sentence reading in GE partici-
pants were somewhat harder to interpret. Results indicate that GE partic-
ipants did not further reduce the BOLD response in task-negative areas as
was observed in the controls. The differences of the BOLD responses between
the congruent and incongruent condition of the task were instead located in
between task-positive and task-negative areas of the brain. This result could
possibly be another expression of the reduced segregation between executive
networks and DMN in GE [22]

21
4.5 Seizure-mediated structural changes
In the current study we observed abnormal function in DMN in people with
GE. Is this abnormal function related to the pathophysiology of GE or sec-
ondary to GE? In other words: was the DMN dysfunction present already at
onset of GE or did it evolve during the disease course? In GE, white and grey
matter abnormalities have been demonstrated in several studies [54, 55, 56],
which might be related to impaired neural pathways or to impaired func-
tioning of affected regions due to structural changes. Impaired white matter
connectivity has also been suggested as an explanation for cognitive decline
in patients with focal onset seizures [57]. One possible explanation for
these findings is that structural changes in epilepsy are secondary to re-
peated seizures [58]. Liu and colleagues [59] recently showed white matter
changes in juvenile myoclonic epilepsy but not in generalized epilepsy with
generalized tonic clonic seizures only. In contrary to previous findings they
found no correlation between white matter changes and the number of expe-
rienced seizures, and stated that these two entities may be associated with
distinctly different anatomic substrates.
4.6 Limitations and future directions
Although this study is limited by the small number of GE participants, the
results are nevertheless in keeping with the current literature on the function
of DMN in general, and also in keeping with previously reported studies on
resting-state dysfunction of DMN in people with GE. More in depth testing of
language functioning in people with GE is, however, needed to properly map
their language deficits and thus enable more specific studies visualizing the

22
related neural correlates. Future studies on episodic and semantic memory in
GE might also contribute to further knowledge regarding cognitive problems
in people with GE.
4.7 Conclusion
In people with GE, the functional language network showed an imbalance of
brain activation in the form of inadequate suppression of activation in the
DMN during a sentence reading task. These results might explain our find-
ings of impaired language performance exhibited in GE participants. Lan-
guage difficulties clearly are present both in epilepsy with focal seizures and
in GE. These results should be taken into consideration when dealing with
persons with GE in order to adequately assess and address language problems
and thereby minimize negative consequences of the impairment.
Acknowledgement
Linkoping University and the County Council of Ostergotland are acknowl-
edged for financial support. We thank Ingmari Ruuth Knutsson for organiz-
ing logistics and booking of patients.

23
References
[1] Gauffin H, Landtblom A, Raty L. Self-esteem and sense of coherence in
young people with uncomplicated epilepsy: a 5-year follow-up. Epilepsy
Behav. 2010;17:520–524.
[2] Gauffin H, Flensner G, Landtblom AM. Living with epilepsy accompa-
nied by cognitive difficulties: young adults’ experiences. Epilepsy Behav.
2011;22:750–758.
[3] Fisher RS, Vickrey BG, Gibson P, Hermann B, Penovich P, Scherer A,
et al. The impact of epilepsy from the patient’s perspective II: views
about therapy and health care. Epilepsy Res. 2000;41:53–61.
[4] Meador KJ. Cognitive outcomes and predictive factors in epilepsy. Neu-
rology. 2002;58:S21–S26.
[5] Dikmen S, Matthews CG. Effect of major motor seizure frequency upon
cognitive-intellectual functions in adults. Epilepsia. 1977;18:21–29.
[6] Kwan P, Brodie MJ. Neuropsychological effects of epilepsy and
antiepileptic drugs. Lancet. 2001;357:216–222.
[7] Oyegbile TO, Dow C, Jones J, Bell B, Rutecki P, Sheth R, et al. The
nature and course of neuropsychological morbidity in chronic temporal
lobe epilepsy. Neurology. 2004;62:1736–1742.
[8] Vlooswijk MC, Jansen JF, Reijs RP, de Krom MC, Kooi ME, Ma-
joie HJ, et al. Cognitive fMRI and neuropsychological assessment in
patients with secondarily generalized seizures. Clin Neurol Neurosur.
2012;110:441–450.

24
[9] Karunanayaka P, Kim KK, Holland SK, Szaflarski JP. The effects of
left or right hemispheric epilepsy on language networks investigated
with semantic decision fMRI task and independent component analy-
sis. Epilepsy Behav. 2011;20:623–632.
[10] Beghi M, Beghi E, Cornaggia CM, Gobbi G. Idiopathic generalized
epilepsies of adolescence. Epilepsia. 2006;47:107–110.
[11] Marini C, King MA, Archer JS, Newton MR, Berkovic SF. Idiopathic
generalised epilepsy of adult onset: clinical syndromes and genetics. J
Neurol Neurosurg Psychiatry. 2003;74:192–196.
[12] Devinsky O, Gershengorn J, Brown E, Perrine K, Vazquez B, Luciano
D. Frontal functions in juvenile myoclonic epilepsy. Neuropsychiatry
Neuropsychol Behav Neurol. 1997;10:243–246.
[13] Caplan R, Siddarth P, Vona P, Stahl L, Bailey C, Gurbani S, et al.
Language in pediatric epilepsy. Epilepsia. 2009;50:2397–2407.
[14] Chaix Y, Laguitton V, Lauwers-Cances V, Daquin G, Cances C, De-
monet JF, et al. Reading abilities and cognitive functions of children
with epilepsy: influence of epileptic syndrome. Brain Dev. 2006;28:122–
130.
[15] Damoiseaux JS, Rombouts SARB, Barkhof F, Scheltens P, Stam CJ,
Smith SM, et al. Consistent resting-state networks across healthy sub-
jects. PNAS. 2006;103:13848–13853.
[16] Shulman GL, Fiez JA, Corbetta M, Buckner RL, Miezin FM, Raichle
ME, et al. Common blood flow changes across visual tasks .2. Decreases
in cerebral cortex. J Cogn Neurosci. 1997;9:648–663.

25
[17] Greicius MD, Krasnow B, Reiss AL, Menon V. Functional connectivity
in the resting brain: A network analysis of the default mode hypothesis.
PNAS. 2003;100:253–258.
[18] Buckner RL, Anderws-Hanna JR, Schacter DL. The brain’s default
network: anatomy, function, and relevance to disease. Ann NY Acad
Sci. 2008;1124:1–38.
[19] Buzsaki G, Draguhn A. Neuronal oscillations in cortical networks. Sci-
ence. 2004;304:1926–1929.
[20] Fox MD, Snyder AZ, Vincent JL, Corbetta M, Van Essen DC, Raichle
ME. The human brain is intrinsically organized into dynamic, anticor-
related functional networks. PNAS. 2005;102:9673–9678.
[21] Raichle ME, MacLeod AM, Snyder AZ, Powers WJ, Gusnard DA, Shul-
man GL. A default mode of brain function. PNAS. 2001;98:676–682.
[22] McGill ML, Devinsky O, Kelly C, Milham M, Castellanos FX, Quinn
BT, et al. Default mode network abnormalities in idiopathic generalized
epilepsy. Epilepsy Behav. 2012;23:353–359.
[23] Song M, Du H, Wu N, Hou B, Wu G, Wang J, et al. Impaired resting-
state functional integrations within default mode network of generalized
tonic-clonic seizures epilepsy. Plos One. 2011;6:1–6.
[24] Lou C, Li Q, Lai Y, Y X, Qin W Y Liao, Li S, et al. Altered functional
connectivity in default mode network in absence epilepsy: a resting state
fMRIstudy. Hum Brain Map. 2011;32:438–449.

26
[25] Blumenfeld H, Taylor J. Why do seizures cause loss of consciousness?
Neuroscientist. 2003;9:301–310.
[26] Cavanna AE, Monaco F. Brain mechanisms of altered conscious states
during epileptic seizures. Nat Rev Neurol. 2009;5:267–276.
[27] Pyka M, Beckmann CF, Schoning S, Hauke S, Heider D, Kugel H, et al.
Impact of working memory load on fMRI resting state pattern in sub-
sequent resting phases. Plos One. 2009;4:e7198.
[28] Gould RL, Brown RG, Owen AM, Bullmore ET, Howard RJ. Task-
induced deactivations during successful paired associates learning: An
effect of age but not Alzheimer’s disease. NeuroImage. 2006;31:818–831.
[29] McKiernan KA, D’Angelo BR, Kaufman JN, Binder JR. Interrupting
the ”stream of consciousness”: an fMRI investigation. NeuroImage.
2006;29:1185–1191.
[30] Prat CS, Just MA. Exploring the neural dynamics underpinning individ-
ual differences in sentence comprehension. Cereb Cortex. 2011;21:1747–
1760.
[31] Just MA, Carpenter PA, Keller TA, Eddy WF, Thulborn KR. Brain ac-
tivation modulated by sentence comprehension. Science. 1996;274:114–
116.
[32] Friederici AD, Ruschemeyer SA, Hahne A, Fiebach CJ. The role of
left inferior frontal and superior temporal cortex in sentence compre-
hension: localizing syntactic and semantic processes. Cerebral Cortex.
2003;13:170–177.

27
[33] Kutas M, Hillyard SA. Reading senseless sentences: Brain potentials
reflect semantic incongruity. Science. 1980;207:203–205.
[34] Kutas M, Federmeier KD. Electrophysiology reveals semantic memory
use in language comprehension. Trends Cogn Sci. 2000;4:463–470.
[35] Berg AT, Berkovic SF, Brodie MJ, Buchhalter J, Cross JH, van
Emde Boas W, et al. Revised terminology and concepts for organi-
zation of seizures and epilepsies: report of the ILAE Commission on
Classification and Terminology. Epilepsia. 2010;51:676–685.
[36] Laakso K, Brunnegard K, Hartelius L, Ahlsen E. Assessing high-level
language in individual with multiple sclerosis: a pilot study. Clin Lin-
guist Phon. 2000;14:329–349.
[37] Lezak MD. Neuropsychological assessment. Oxford: Oxford University
Press; 1995.
[38] Maldjian JA, Laurienti PJ, Kraft RA, Burdette JH. An automated
method for neuroanatomic and cytoarchitectonic atlas-based interroga-
tion of fMRI data sets. NeuroImage. 2003;19:1233–1239.
[39] Brett M, Anton JL, Valabregue R, Poline JB. Region of interest analysis
using an SPM toolbox. In: Organization for Human Brain Mapping
(OHBM); 2002. Sendai, Japan.
[40] Gauffin H. Epilepsy in young adulthood: medical, psychosocial and
functional aspects. Linkoping University; 2012. PhD Thesis.
[41] Sturniolo MG, Galletti F. Idiopathic epilepsy and school-achievement.
Arch Dis C. 1994;70:424–428.

28
[42] Fransson P. Spontaneous low-frequency BOLD signal fluctuations: an
fMRI investigation of the resting-state default mode of brain function
hypothesis. Hum Brain Map. 2005;26:15–29.
[43] Mevel K, Landeau B, Fouquet M, La Joie R, Villain N, Mezenge F, et al.
Age effect on the default mode network, inner thoughts, and cognitive
abilities. Neurobiol aging. 2013;34:1292–1301.
[44] Damoiseaux JS, Beckman CF, Sanz Arigita EJ, Barkhof F, Scheltens
P, Stam CJ, et al. Reduced resting-state brain activity in the “default
network” in normal aging. Cerebral Cortex. 2008;18:1856–1864.
[45] Hampson M, Driesen NR, Skudlarski P, C GJ, Constable RT. Brain
connectivity related to working memory performance. J Neurosci.
2006;26:13338–13343.
[46] Kelly AM, Uddin LQ, Biswal BB, Castellanos FX, Milham MP. Compe-
tition between functional brain networks mediates behavioral variability.
NeuroImage. 2008;39:527–537.
[47] Fransson P, Marrelec G. The precuneus/posterior cingulate cortex plays
a pivotal role in the default mode network: evidence from a partial
correlation network analysis. NeuroImage. 2008;42:1178–1184.
[48] Sheldon S, Moscovitch M. The nature and time-course of medial tem-
poral lobe contributions to semantic retrieval: An fMRI study on verbal
fluency. Hippocampus. 2012;22:1451–1466.
[49] Greenberg DL, Keane MM, Ryan L, Verfaellie M. Impaired category
fluency in medial temporal lobe amnesia: The role of episodic memory.
J Neurosci. 2009;29:10900–10908.

29
[50] MacKay DG, Burke DM, Stewart R. H.M.’s language production
deficits: Implications for relations among memory, semantic binding,
and the hippocampal system. J Mem Lang. 1998;38:28–69.
[51] Amemori KI, Graybiel AM. Localized microstimulation of primate pre-
genual cingulate cortex induces negative decision-making. Nature Neu-
rosci. 2012;15:776–785.
[52] Menon V, Uddin LQ. Saliency, switching, attention and control: a
network model of insula function. Brain Struct Func. 2010;214:655–667.
[53] Vogt BA. Pain and emotion interactions in subregions of the cingulate
gyrus. Nat Rev Neurosci. 2005;6:533–544.
[54] Bernhardt BC, Rozen DA, Worsley KJ, Evans AC, Bernasconi N,
Bernasconi A. Thalamo-cortical network pathology in idiopathic gen-
eralized epilepsy: insights from MRI-based morphometric correlation
analysis. NeuroImage. 2009;46:373–381.
[55] Ciumas C, Savic I. Structural changes in patients with primary gener-
alized tonic and clonic seizures. Neurology. 2006;67:683–686.
[56] Doelken MT, Mennecke A, Stadlbauer A, Kecskemeti L, Kasper BS,
Struffert T, et al. Multi-voxel magnetic resonance spectroscopy at 3 T
in patients with idiopathic generalised epilepsy. Seizure. 2010;19:485–
492.
[57] Vaessen MJ, Jansen JF, Vlooswijk MC, Hofman PA, Majoie HJ,
Aldenkamp AP, et al. White matter network abnormalities are as-
sociated with cognitive decline in chronic epilepsy. Cereb Cortex.
2012;22:2139–2147.

30
[58] Deppe M, Kellinghaus C, Duning T, Moddel G, Mohammadi S, Deppe
K, et al. Nerve fiber impairment of anterior thalamocortical circuitry in
juvenile myoclonic epilepsy. Neurology. 2008;71:1981–1985.
[59] Liu M, Concha L, Beaulieu C, Gross DW. Distinct white matter
abnormalities in different generalized epilepsy syndromes. Epilepsia.
2011;52:2267–2275.

31
5 Figure legends
Figure 1
Congruent sentences: Positive and negative Blood Oxygen Level Depen-
dent (BOLD) response in healthy controls (A, B) and in people with gen-
eralized epilepsy (C, D). For the visualization, images of the controls were
thresholded at p=0.001, uncorrected, and images of epilepsy patients were
thresholded at p=0.01 to compensate for the smaller group size. L = left
hemisphere.
Figure 2
A) Negative BOLD response in the left anterior superior temporal cortex in
healthy controls. The image is thresholded at p=0.001. B) Significant dif-
ference in negative BOLD response between people with generalized epilepsy
and healthy controls in the anterior superior temporal gyrus. The image is
masked within the region of interest and thresholded at p=0.01, for visual-
ization purpose. L = left hemisphere, R = right hemisphere.
Figure 3
A) Negative BOLD response in the posterior cingulate cortex in healthy
controls. The image is thresholded at p=0.001. B) Significant difference
in negative BOLD response between people with generalized epilepsy and
healthy controls in the posterior cingulate cortex. The image is masked
within the region of interest and thresholded at p=0.01, for visualization
purpose. L = left hemisphere, R = right hemisphere.
32
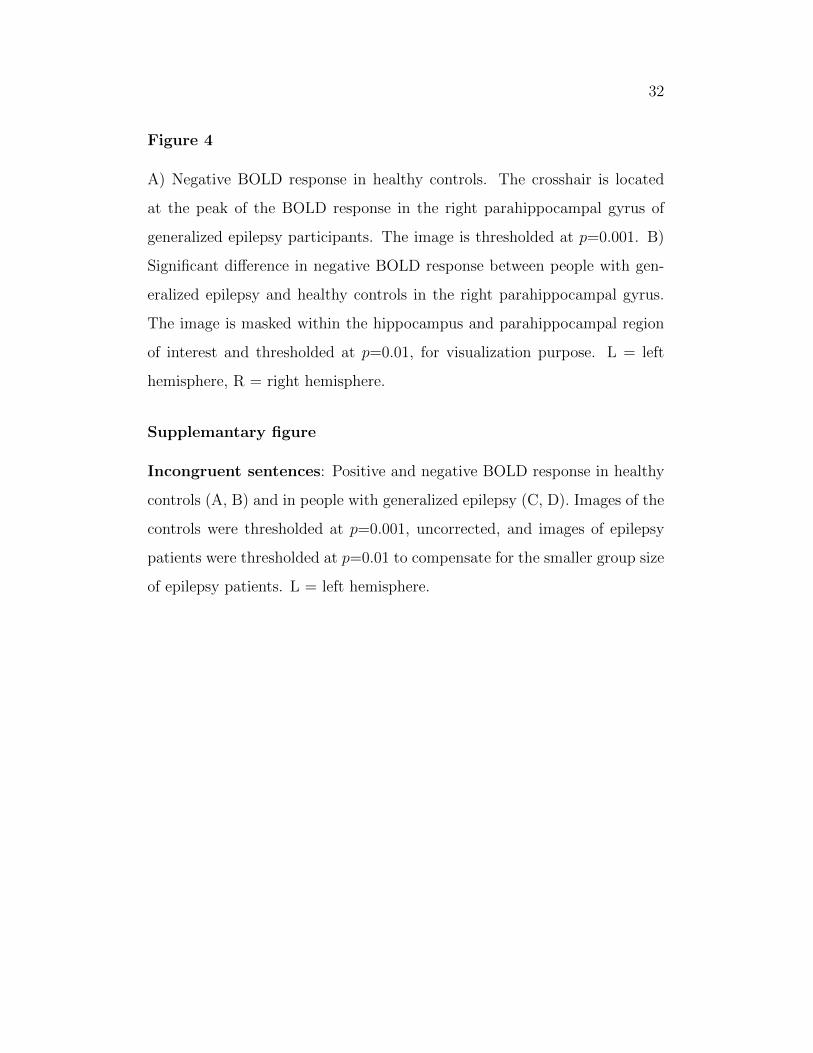
Figure 4
A) Negative BOLD response in healthy controls. The crosshair is located
at the peak of the BOLD response in the right parahippocampal gyrus of
generalized epilepsy participants. The image is thresholded at p=0.001. B)
Significant difference in negative BOLD response between people with gen-
eralized epilepsy and healthy controls in the right parahippocampal gyrus.
The image is masked within the hippocampus and parahippocampal region
of interest and thresholded at p=0.01, for visualization purpose. L = left
hemisphere, R = right hemisphere.
Supplemantary figure
Incongruent sentences: Positive and negative BOLD response in healthy
controls (A, B) and in people with generalized epilepsy (C, D). Images of the
controls were thresholded at p=0.001, uncorrected, and images of epilepsy
patients were thresholded at p=0.01 to compensate for the smaller group size
of epilepsy patients. L = left hemisphere.

1
Figur 1: Congruent sentences: Positive and negative Blood Oxygen Level
Dependent (BOLD) response in healthy controls (A, B) and in people with
generalized epilepsy (C, D). For the visualization, images of the controls were
thresholded at p=0.001, uncorrected, and images of epilepsy patients were
thresholded at p=0.01 to compensate for the smaller group size. L = left
hemisphere.

2
Figur 2: A) Negative BOLD response in the left anterior superior temporal
cortex in healthy controls. The image is thresholded at p=0.001. B) Signifi-
cant difference in negative BOLD response between people with generalized
epilepsy and healthy controls in the anterior superior temporal gyrus. The
image is masked within the region of interest and thresholded at p=0.01, for
visualization purpose. L = left hemisphere, R = right hemisphere.

3
Figur 3: A) Negative BOLD response in the posterior cingulate cortex in he-
althy controls. The image is thresholded at p=0.001. B) Significant difference
in negative BOLD response between people with generalized epilepsy and he-
althy controls in the posterior cingulate cortex. The image is masked within
the region of interest and thresholded at p=0.01, for visualization purpose. L
= left hemisphere, R = right hemisphere.

4
A. B.
L
R
Figur 4: A) Negative BOLD response in healthy controls. The crosshair is
located at the peak of the BOLD response in the right parahippocampal gyrus
of generalized epilepsy participants. The image is thresholded at p=0.001. B)
Significant difference in negative BOLD response between people with gene-
ralized epilepsy and healthy controls in the right parahippocampal gyrus. The
image is masked within the hippocampus and parahippocampal region of inte-
rest and thresholded at p=0.01, for visualization purpose. L = left hemisphere,
R = right hemisphere.
5
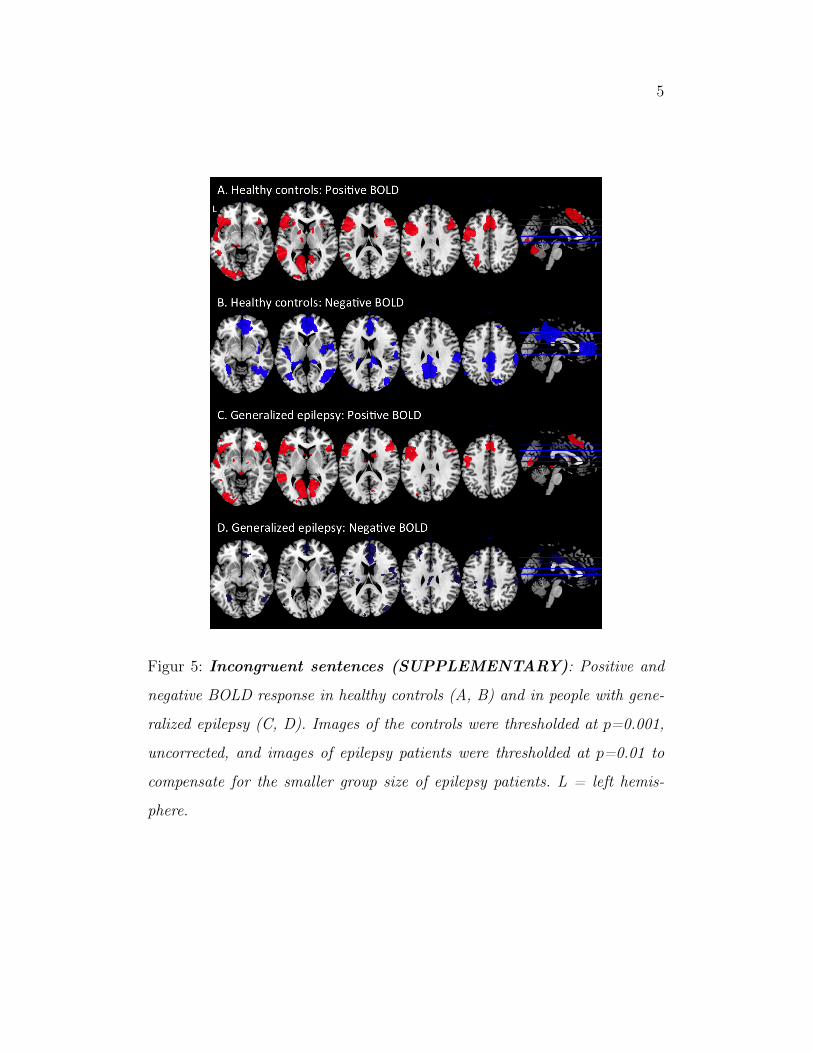
Figur 5: Incongruent sentences (SUPPLEMENTARY): Positive and
negative BOLD response in healthy controls (A, B) and in people with gene-
ralized epilepsy (C, D). Images of the controls were thresholded at p=0.001,
uncorrected, and images of epilepsy patients were thresholded at p=0.01 to
compensate for the smaller group size of epilepsy patients. L = left hemis-
phere.

1
Tables
Tab
ell1
:The
tableshow
sclinical
inform
ationon
patients
withgeneralized
epi-
lepsy.
F=
female,
M=
male;
y=
years,
Edu
c.=
education.
SFP
=length
of
seizurefree
period,where
1is
less
than
onemon
th,2is
less
than
ayear,an
d3
ismorethan
oneyear
ago.
AED
=Anti-Epileptic
Drugs.SeizureFrequencyis
approxim
ated.
Sex
Age
Educ.
Onset
Classification
Etiolog
ySeizu
reSFP
AED
a
(y)
(y)
(y)
(Frequen
cy)
F20
126
Ton
ic-clonicseizures
only
Unk
nown
Con
vulsivean
nually
1LT
G,LEV
F27
1417
Ton
ic-clonicseizures
only
Unk
nown
Con
vulsiveweekly
1LT
G,LEV
M22
1215
Ton
ic-clonicseizures
only
Unk
nown
Con
vulsivean
nually
3VAL,LT
G
M32
1518
Ton
ic-clonicseizures
only
Unk
nown
Noseizures
3VAL,LT
G
M32
1422
Ton
ic-clonicseizures
only
Unk
nown
Con
vulsivean
nually
2VAL,LEV
M27
1219
Ton
ic-clonicseizures
only
Unk
nown
Noseizure
3VAL
M29
169
Ton
ic-clonicseizureon
lyUnk
nown
Noseizure
3CBZ,VAL
F22
120
Feb
rile
seizures
plus
Gen
etic
Noseizures
3CLO,ACE
F35
1215
Juvenile
myo
clon
icep
ilep
syGen
etic
Con
vulsivemon
thly
1LT
G,TOP,LAC
Somemyo
clon
iesan
dab
senc
es
F23
1317
Juvenile
myo
clon
icep
ilep
syGen
etic
Noseizure
3LEV
F22
1317
Juvenile
absenc
eep
ilep
syUnk
nown
Con
vulsivean
nually
2LT
G,LEV
aLT
G=
Lam
otri
gine
,LE
V=
Lev
etir
acet
am,VA
L=
Val
proa
te,C
BZ
=C
arba
maz
epin
e,
CLO
=C
lona
zepa
m,A
CE
=A
ceta
zola
mid
e,T
OP
=Top
iram
ate,
LA
C=
Lac
osam
ide.

2
Tabell 2: Results from the verbal fluency (FAS) and the assessment of subtle
language deficits (BeSS) tasks, and reaction times (RT) during the baseline,
congruent, and incongruent conditions in fMRI. The table shows mean values,
standard deviation (sd), range (minimum–maximum value), and p-value for the
statistical comparison between generalized epilepsy participants and controls.
GENERALIZED EPILEPSY HEALTHY CONTROLS
Task Mean sd Range Mean sd Range p
FAS 34.7 12.7 11–57 43.3 11.5 22–62 0.052
BeSS (total)a 122.6 35.6 66–181 163.1 20.4 117–193 0.004
- REP 14.9 4.9 4–21 21.0 3.6 12–28 <0.001
- CON 20.4 5.0 12–26 25.4 4.1 14–30 0.002
- INF 20.5 6.9 9–30 24.9 3.5 19–30 0.011/0.062b
- COM 21.9 5.5 12–30 25.9 3.9 16–30 0.016
- GAR 18.5 7.3 3–30 26.8 4.5 15–30 <0.001
- MET 14.4 7.9 1–25 20.6 5.0 10–30 0.005
- VOC 11.9 7.7 4–28 18.5 6.6 3–26 0.011
RT Baseline 869 190.5 735–1400 694 81.5 550–825 <0.001
RT Congruent 2154 333.8 1529–2633 1848 264.1 1207–2444 0.005
RT Incongruent 2286 309.2 1690–2674 1989 249.2 1370–2569 0.004
aBeSS includes the following subtests: REP = sentence repetition, CON = sentence con-
struction, INF = inference (text understanding), COM= understanding complex embedded
sentences, GAR = understanding garden-path sentences, MET = understanding metaphors,
and VOC = vocabulary.bLevene’s test indicated unequal variance. Assuming non equal variances resulted in the
higher p = 0.062

3
Tabell 3: Negative BOLD response in healthy controls during sentence reading.
The p-value refers to the family wise error corrected p-value of the voxel with
minimum negative BOLD in the respective predefined region of interest. Signi-
ficant p-values (p <0.05) are marked in bold and trends (p <0.1) are marked
in italics. Z is the statistic value, and x, y and z are the Montreal Neurological
Institute co-ordinates of the voxel with minimum BOLD.
CONGRUENT SENTENCES
Region of Interest Hemisphere p-value Z x y z
Anterior Cingulate Left <0.001 8.5 2 42 12
Anterior Cingulate Right <0.001 8.9 6 44 12
Posterior Cingulate Left 0.001 5.2 -4 -40 26
Posterior Cingulate Right 0.002 4.9 2 -42 26
Precuneus Left 0.002 5.9 0 -48 50
Precuneus Right <0.001 8.4 18 -76 48
Medial Frontal Left <0.001 6.5 -6 50 -4
Medial Frontal Right <0.001 8.0 8 50 -2
Inferior Parietal Left 0.207 3.4 -58 56 36
Inferior Parietal Right 0.002 5.4 52 -32 50
Middle Temporal Left 0.044 4.5 -40 -68 8
Middle Temporal Right <0.001 8.8 54 -60 -2
Superior Temporal Left 0.009 5.0 -52 -6 2
Superior Temporal Right 0.021 4.7 52 -44 18
Hippocampus Left 0.239 3.0 -26 -40 6
Hippocampus Right 0.015 4.4 16 -36 6
Parahippocampal Left 0.015 4.4 -32 -46 -6
Parahippocampal Right 0.056 3.8 26 -44 -6
INCONGRUENT SENTENCES
Region of Interest Hemisphere p-value Z x y z
Anterior Cingulate Left <0.001 10.4 -2 46 0
Anterior Cingulate Right <0.001 9.1 2 44 0
Posterior Cingulate Left <0.001 5.7 -6 -44 30
Posterior Cingulate Right 0.001 5.1 2 -46 30
Precuneus Left <0.001 6.4 0 -48 48
Precuneus Right <0.001 7.4 14 -62 62
Medial Frontal Left <0.001 8.6 0 46 -6
Medial Frontal Right <0.001 9.4 2 48 -2
Inferior Parietal Left 0.012 4.8 -50 -60 46
Inferior Parietal Right 0.004 5.1 58 -36 46
Middle Temporal Left 0.014 5.1 -42 -66 6
Middle Temporal Right 0.010 5.2 56 -60 -2
Superior Temporal Left 0.003 5.5 -50 -8 2
Superior Temporal Right 0.006 5.2 54 0 2
Hippocampus Left 0.001 5.5 -26 -40 6
Hippocampus Right 0.002 5.4 18 -34 8
Parahippocampal Left <0.001 8.7 -32 -46 -4
Parahippocampal Right 0.079 3.7 30 -44 -6

4
Tabell 4: Negative BOLD response in patients with generalized epilepsy during
sentence reading. The p-value refers to the family wise error corrected p-value
of the voxel with minimum negative BOLD in the respective predefined region of
interest. Significant p-values (p <0.05) are marked in bold and trends (p <0.1)
are marked in italics. Z is the statistic value, and x, y and z are the Montreal
Neurological Institute co-ordinates of the voxel with minimum BOLD.
CONGRUENT SENTENCES
Region of Interest Hemisphere p-value Z x y z
Anterior Cingulate Left 0.018 6.5 2 34 12
Anterior Cingulate Right 0.021 6.3 4 34 12
Posterior Cingulate Left 0.732 1.6 0 -42 22
Posterior Cingulate Right 0.744 1.5 2 -42 22
Precuneus Left 0.290 4.4 0 -54 66
Precuneus Right 0.181 4.9 2 -56 66
Medial Frontal Left 0.553 2.2 -2 30 -12
Medial Frontal Right 0.606 2.2 0 30 -12
Inferior Parietal Left 0.014 7.4 -48 -28 36
Inferior Parietal Right 0.669 2.1 42 -40 44
Middle Temporal Left 0.687 3.5 -52 -58 -4
Middle Temporal Right 0.650 3.5 48 4 -32
Superior Temporal Left 0.270 4.1 -64 -28 22
Superior Temporal Right 0.851 2.6 62 -54 20
Hippocampus Left 0.972 0.7 -30 -18 -22
Hippocampus Right 0.975 0.9 12 -34 8
Parahippocampal Left 0.970 0.8 -30 -18 -24
Parahippocampal Right 0.950 1.4 30 8 -30
INCONGRUENT SENTENCES
Region of Interest Hemisphere p-value Z x y z
Anterior Cingulate Left 0.002 9.2 2 34 14
Anterior Cingulate Right 0.003 8.8 4 24 18
Posterior Cingulate Left 0.027 5.1 -6 -40 22
Posterior Cingulate Right 0.042 4.5 2 -42 24
Precuneus Left 0.261 4.5 0 -56 34
Precuneus Right 0.284 4.4 8 -62 66
Medial Frontal Left <0.001 8.6 0 46 -6
Medial Frontal Right <0.001 9.4 2 48 -2
Inferior Parietal Left 0.259 4.2 -58 -36 50
Inferior Parietal Right 0.314 3.5 46 -34 46
Middle Temporal Left 0.557 3.8 -52 -74 8
Middle Temporal Right 0.006 9.1 48 -66 2
Superior Temporal Left 0.055 5.8 -46 -2 0
Superior Temporal Right 0.008 8.4 52 0 -2
Hippocampus Left 0.956 1.0 -22 -40 0
Hippocampus Right 0.798 2.0 30 -10 -20
Parahippocampal Left 0.776 2.1 -20 -28 -24
Parahippocampal Right 0.725 2.4 22 -40 -4

5
Tabell 5: Difference in negative BOLD response between patients with generalized
epilepsy (GE) and healthy controls during sentence reading. The p-value refers to
the family wise error corrected p-value of the difference between GE and controls
in the respective predefined region of interest. Significant p-values (p <0.05) are
marked in bold and trends (p <0.1) are marked in italics. Z is the statistic value,
and x, y and z are the Montreal Neurological Institute co-ordinates of the voxel
with minimum BOLD.
CONGRUENT CONDITION: GENERALIZED EPILEPSY > CONTROLS
Region of Interest Hemisphere p-value Z x y z
Anterior Cingulate Left 0.316 2.9 0 26 -4
Anterior Cingulate Right 0.342 2.7 2 40 -2
Posterior Cingulate Left 0.073 3.2 -10 -42 28
Posterior Cingulate Right 0.043 3.3 10 -40 26
Precuneus Left 0.273 3.3 2 -68 30
Precuneus Right 0.238 3.3 14 -62 28
Medial Frontal Left 0.186 2.8 -10 48 -6
Medial Frontal Right 0.257 2.7 16 52 -6
Inferior Parietal Left 0.971 1.4 -50 -56 36
Inferior Parietal Right 0.700 2.0 44 -52 40
Anterior Temporal Left 0.015 3.7 -52 -8 0
Anterior Temporal Right 0.274 2.7 62 -10 4
Posterior Temporal Left 0.153 2.3 -40 -68 8
Posterior Temporal Right 0.614 2.2 52 -68 10
Hippocampus Left 0.502 2.3 -32 -40 -2
Hippocampus Right 0.061 3.6 28 -28 -12
Parahippocampal Left 0.345 2.6 -32 -42 -4
Parahippocampal Right 0.049 3.7 24 -26 -20
INCONGRUENT CONDITION: GENERALIZED EPILEPSY > CONTROLS
Region of Interest Hemisphere p-value Z x y z
Anterior Cingulate Left 0.084 3.5 -2 48 0
Anterior Cingulate Right 0.335 2.7 2 40 -2
Posterior Cingulate Left 0.330 2.3 -6 -44 30
Posterior Cingulate Right 0.178 2.6 14 -40 12
Precuneus Left 0.745 2.5 -14 -56 28
Precuneus Right 0.818 2.3 26 -46 6
Medial Frontal Left 0.126 3.0 -4 50 -4
Medial Frontal Right 0.174 2.9 12 44 -14
Inferior Parietal Left 0.978 1.3 -46 -28 48
Inferior Parietal Right 0.941 1.1 50 -54 50
Anterior Temporal Left 0.940 0.6 -40 -20 -2
Anterior Temporal Right 0.880 1.4 50 -4 -2
Posterior Temporal Left 0.797 0.2 -48 -70 6
Posterior Temporal Right 0.929 1.2 50 -78 8
Hippocampus Left 0.078 3.4 -36 -12 -18
Hippocampus Right 0.099 3.3 18 -34 6
Parahippocampal Left 0.153 3.1 -32 -46 -4
Parahippocampal Right 0.431 2.6 26 -26 -18