Impaired Carbohydrate Digestion and Transport …...Impaired Carbohydrate Digestion and Transport...
21
Impaired Carbohydrate Digestion and Transport and Mucosal Dysbiosis in the Intestines of Children with Autism and Gastrointestinal Disturbances Brent L. Williams 1 , Mady Hornig 1 , Timothy Buie 2 , Margaret L. Bauman 3 , Myunghee Cho Paik 4 , Ivan Wick 1 , Ashlee Bennett 1 , Omar Jabado 1 , David L. Hirschberg 1 , W. Ian Lipkin 1 * 1 Center for Infection and Immunity, Columbia University, New York, New York, United States of America, 2 Division of Pediatric Gastroenterology and Nutrition, Massachusetts General Hospital, Boston, Massachusetts, United States of America, 3 Department of Neurology, Harvard Medical School and Departments of Neurology and Pediatrics and Learning and Developmental Disabilities Evaluation and Rehabilitation Services (LADDERS), Massachusetts General Hospital, Boston, Massachusetts, United States of America, 4 Department of Biostatistics, Columbia University, Mailman School of Public Health, New York, New York, United States of America Abstract Gastrointestinal disturbances are commonly reported in children with autism, complicate clinical management, and may contribute to behavioral impairment. Reports of deficiencies in disaccharidase enzymatic activity and of beneficial responses to probiotic and dietary therapies led us to survey gene expression and the mucoepithelial microbiota in intestinal biopsies from children with autism and gastrointestinal disease and children with gastrointestinal disease alone. Ileal transcripts encoding disaccharidases and hexose transporters were deficient in children with autism, indicating impairment of the primary pathway for carbohydrate digestion and transport in enterocytes. Deficient expression of these enzymes and transporters was associated with expression of the intestinal transcription factor, CDX2. Metagenomic analysis of intestinal bacteria revealed compositional dysbiosis manifest as decreases in Bacteroidetes, increases in the ratio of Firmicutes to Bacteroidetes, and increases in Betaproteobacteria. Expression levels of disaccharidases and transporters were associated with the abundance of affected bacterial phylotypes. These results indicate a relationship between human intestinal gene expression and bacterial community structure and may provide insights into the pathophysiology of gastrointestinal disturbances in children with autism. Citation: Williams BL, Hornig M, Buie T, Bauman ML, Cho Paik M, et al. (2011) Impaired Carbohydrate Digestion and Transport and Mucosal Dysbiosis in the Intestines of Children with Autism and Gastrointestinal Disturbances. PLoS ONE 6(9): e24585. doi:10.1371/journal.pone.0024585 Editor: Steven Jacobson, National Institutes of Health, United States of America Received May 16, 2011; Accepted August 14, 2011; Published September 1 , 2011 Copyright: ß 2011 Williams et al. This is an open-access article distributed under the terms of the Creative Commons Attribution License, which permits unrestricted use, distribution, and reproduction in any medium, provided the original author and source are credited. Funding: This work was supported by National Institutes of Health (NS047537), Google.org, Department of Defense, and Cure Autism Now (CAN). The funders had no role in study design, data collection and analysis, decision to publish, or preparation of the manuscript. Competing Interests: The authors have declared that no competing interests exist. * E-mail: [email protected] Introduction Autism spectrum disorders (ASD) are defined by impairments in verbal and non-verbal communication, social interactions, and repetitive and stereotyped behaviors. In addition to these core deficits, previous reports indicate that the prevalence of gastroin- testinal (GI) symptoms ranges widely in individuals with ASD, from 9 to 91% in different study populations [1]. Macroscopic and histological observations in ASD include findings of ileo-colonic lymphoid nodular hyperplasia, enterocolitis, gastritis, and esoph- agitis [2,3,4,5,6,7]. Associated changes in intestinal inflammatory parameters include higher densities of lymphocyte populations, aberrant cytokine profiles, and deposition of immunoglobulin (IgG) and complement C1q on the basolateral enterocyte membrane [5,8,9,10,11,12]. Reported functional disturbances include in- creased intestinal permeability [13], deficient enzymatic activity of disaccharidases [7], increased secretin-induced pancreatico-biliary secretion [7], and abnormal fecal Clostridia taxa [14,15,16]. Some children placed on exclusion diets or treated with the antibiotic vancomycin are reported to improve in cognitive and social function [17,18]. Furthermore, a recent study found a strong correlation between GI symptoms and autism severity [19]. The intestinal mucoepithelial layer must maximize nutritional uptake of dietary components while maintaining a barrier to toxins and infectious agents. Although some aspects of these functions are host-encoded, others are acquired through symbiotic relationships with microbial flora. Dietary carbohydrates enter the intestine as monosaccharides (glucose, fructose, and galactose), disaccharides (lactose, sucrose, and maltose), or complex polysaccharides. Fol- lowing digestion with salivary and pancreatic amylases, carbohy- drates are further digested by disaccharidases expressed by absorptive enterocytes in the brush border of the small intestine and transported as monosaccharides across the intestinal epitheli- um. Although humans lack the glycoside hydrolases and polysac- charide lyases necessary for cleavage of glycosidic linkages present in plant cell wall polysaccharides, oligosaccharides, storage polysac- charides, and resistant starches, intestinal bacteria encoding these enzymes expand our capacity to extract energy from dietary polysaccharides [20,21]. As an end product of polysaccharide fermentation, bacteria produce short-chain fatty acids (butyrate, acetate, and propionate) that serve as energy substrates for colonocytes, modulate colonic pH, regulate colonic cell proliferation and differentiation, and contribute to hepatic gluconeogenesis and cholesterol synthesis [22,23]. Intestinal microbes also mediate PLoS ONE | www.plosone.org 1 September 2011 | Volume 6 | Issue 9 | e24585 6
Transcript of Impaired Carbohydrate Digestion and Transport …...Impaired Carbohydrate Digestion and Transport...

Impaired Carbohydrate Digestion and Transport andMucosal Dysbiosis in the Intestines of Children withAutism and Gastrointestinal DisturbancesBrent L. Williams1, Mady Hornig1, Timothy Buie2, Margaret L. Bauman3, Myunghee Cho Paik4, Ivan
Wick1, Ashlee Bennett1, Omar Jabado1, David L. Hirschberg1, W. Ian Lipkin1*
1 Center for Infection and Immunity, Columbia University, New York, New York, United States of America, 2 Division of Pediatric Gastroenterology and Nutrition,
Massachusetts General Hospital, Boston, Massachusetts, United States of America, 3 Department of Neurology, Harvard Medical School and Departments of Neurology
and Pediatrics and Learning and Developmental Disabilities Evaluation and Rehabilitation Services (LADDERS), Massachusetts General Hospital, Boston, Massachusetts,
United States of America, 4 Department of Biostatistics, Columbia University, Mailman School of Public Health, New York, New York, United States of America
Abstract
Gastrointestinal disturbances are commonly reported in children with autism, complicate clinical management, and maycontribute to behavioral impairment. Reports of deficiencies in disaccharidase enzymatic activity and of beneficial responsesto probiotic and dietary therapies led us to survey gene expression and the mucoepithelial microbiota in intestinal biopsiesfrom children with autism and gastrointestinal disease and children with gastrointestinal disease alone. Ileal transcriptsencoding disaccharidases and hexose transporters were deficient in children with autism, indicating impairment of theprimary pathway for carbohydrate digestion and transport in enterocytes. Deficient expression of these enzymes andtransporters was associated with expression of the intestinal transcription factor, CDX2. Metagenomic analysis of intestinalbacteria revealed compositional dysbiosis manifest as decreases in Bacteroidetes, increases in the ratio of Firmicutes toBacteroidetes, and increases in Betaproteobacteria. Expression levels of disaccharidases and transporters were associatedwith the abundance of affected bacterial phylotypes. These results indicate a relationship between human intestinal geneexpression and bacterial community structure and may provide insights into the pathophysiology of gastrointestinaldisturbances in children with autism.
Citation: Williams BL, Hornig M, Buie T, Bauman ML, Cho Paik M, et al. (2011) Impaired Carbohydrate Digestion and Transport and Mucosal Dysbiosis in theIntestines of Children with Autism and Gastrointestinal Disturbances. PLoS ONE 6(9): e24585. doi:10.1371/journal.pone.0024585
Editor: Steven Jacobson, National Institutes of Health, United States of America
Received May 16, 2011; Accepted August 14, 2011; Published September 1 , 2011
Copyright: � 2011 Williams et al. This is an open-access article distributed under the terms of the Creative Commons Attribution License, which permitsunrestricted use, distribution, and reproduction in any medium, provided the original author and source are credited.
Funding: This work was supported by National Institutes of Health (NS047537), Google.org, Department of Defense, and Cure Autism Now (CAN). The fundershad no role in study design, data collection and analysis, decision to publish, or preparation of the manuscript.
Competing Interests: The authors have declared that no competing interests exist.
* E-mail: [email protected]
Introduction
Autism spectrum disorders (ASD) are defined by impairments in
verbal and non-verbal communication, social interactions, and
repetitive and stereotyped behaviors. In addition to these core
deficits, previous reports indicate that the prevalence of gastroin-
testinal (GI) symptoms ranges widely in individuals with ASD,
from 9 to 91% in different study populations [1]. Macroscopic and
histological observations in ASD include findings of ileo-colonic
lymphoid nodular hyperplasia, enterocolitis, gastritis, and esoph-
agitis [2,3,4,5,6,7]. Associated changes in intestinal inflammatory
parameters include higher densities of lymphocyte populations,
aberrant cytokine profiles, and deposition of immunoglobulin (IgG)
and complement C1q on the basolateral enterocyte membrane
[5,8,9,10,11,12]. Reported functional disturbances include in-
creased intestinal permeability [13], deficient enzymatic activity of
disaccharidases [7], increased secretin-induced pancreatico-biliary
secretion [7], and abnormal fecal Clostridia taxa [14,15,16]. Some
children placed on exclusion diets or treated with the antibiotic
vancomycin are reported to improve in cognitive and social function
[17,18]. Furthermore, a recent study found a strong correlation
between GI symptoms and autism severity [19].
The intestinal mucoepithelial layer must maximize nutritional
uptake of dietary components while maintaining a barrier to toxins
and infectious agents. Although some aspects of these functions are
host-encoded, others are acquired through symbiotic relationships
with microbial flora. Dietary carbohydrates enter the intestine as
monosaccharides (glucose, fructose, and galactose), disaccharides
(lactose, sucrose, and maltose), or complex polysaccharides. Fol-
lowing digestion with salivary and pancreatic amylases, carbohy-
drates are further digested by disaccharidases expressed by
absorptive enterocytes in the brush border of the small intestine
and transported as monosaccharides across the intestinal epitheli-
um. Although humans lack the glycoside hydrolases and polysac-
charide lyases necessary for cleavage of glycosidic linkages present in
plant cell wall polysaccharides, oligosaccharides, storage polysac-
charides, and resistant starches, intestinal bacteria encoding these
enzymes expand our capacity to extract energy from dietary
polysaccharides [20,21]. As an end product of polysaccharide
fermentation, bacteria produce short-chain fatty acids (butyrate,
acetate, and propionate) that serve as energy substrates for
colonocytes, modulate colonic pH, regulate colonic cell proliferation
and differentiation, and contribute to hepatic gluconeogenesis and
cholesterol synthesis [22,23]. Intestinal microbes also mediate
PLoS ONE | www.plosone.org 1 September 2011 | Volume 6 | Issue 9 | e24585
6

postnatal development of the gut mucoepithelial layer, provide
resistance to potential pathogens, regulate development of intraep-
ithelial lymphocytes and Peyer’s patches, influence cytokine
production and serum immunoglobulin levels, promote systemic
lymphoid organogenesis, and influence brain development and
behavior [24,25,26].
Although bacteria have been examined in fecal material from
children with autism, no study to date has reported analyses of
microbiota adherent to the intestinal mucoepithelium. Further-
more, there are no reports wherein intestinal gene expression in
children with autism has been correlated with alterations in
intestinal microbiota. GI dysfunction is commonly reported in
children with autism; however, it remains unclear how or whether
GI dysfunction in children with autism differs from GI dysfunction
found in typically developing children. Here we investigate
expression of human genes involved in carbohydrate digestion
and transport along with bacterial community composition in
intestinal biopsies from children with autistic disorder and GI
disease (AUT-GI) compared to children with GI disease alone
(Control-GI). Results from gene expression assays and metagenomic
analysis of over half a million bacterial 16S rRNA gene sequences
revealed decreased mRNA expression for human disaccharidases
and hexose transporters and compositional dysbiosis in children in
the AUT-GI group compared to those in the Control-GI group.
These results highlight the complex relationship between human
intestinal gene expression and bacterial community structure and
provide insights into the molecular mechanisms underlying the
pathophysiology of gastrointestinal disturbances in children with
autism.
Results
Patient CharacteristicsAll AUT-GI and Control-GI children evaluated were
male (Table 1). Mean onset age for autism in AUT-GI was
13.4+/25.4 months. Median age at biopsy was similar for AUT-
GI and Control-GI children [median age in years (interquartile
range, IQR), AUT-GI, 4.5 (1.3); and Control-GI, 4.0 (1.1)].
Median number of medications used and the IQR for number of
medications used per subject were identical in AUT-GI and
Control-GI children. Food allergies (FA) were commonly reported
in both AUT-GI (67%) and Control-GI (71%) subjects. The
majority of children with FA had reported milk-related allergy
(90% for AUT-GI and 100% for Control-GI) and/or wheat-
related allergy (80% for AUT-GI and 80% for Control-GI).
Beneficial effects of dietary intervention on GI disturbances were
reported for all AUT-GI and Control-GI subjects with FA.
Comorbid conditions were reported in 67% of AUT-GI children
and 100% of Control-GI children. The most commonly reported
comorbid conditions were atopic manifestations (asthma, atopic
dermatitis, and allergic rhinitis). Atopic manifestations were more
common in Control-GI children (100%) than AUT-GI children
(53%) (Table 1). The frequency of individual atopic manifesta-
tions was higher in Control-GI children. The largest difference in
frequency was for asthma, which was only reported in 20% of
AUT-GI children compared to 71% of Control-GI children
(Table 1). Established intestinal disorders were only reported in a
few subjects: two AUT-GI subjects (13%: 1 with IBD, 1 with
Celiac disease) and one Control-GI subject (14%: IBD). For
detailed information related to medication use, food allergy, and
comorbid conditions in individual AUT-GI and Control-GI
children see Table S1. The prevalence of specific GI symptoms
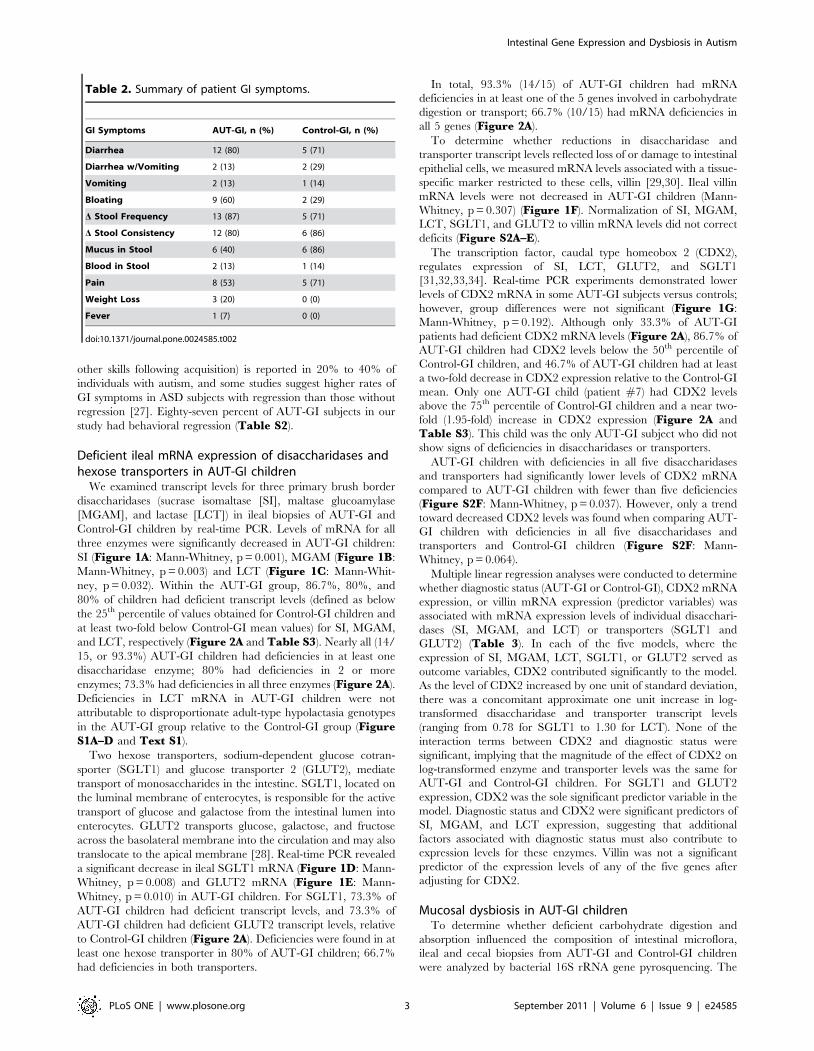
was similar in AUT-GI and Control-GI children (Table 2). The
most frequently reported GI symptoms in both groups were
diarrhea (AUT-GI, 80%; Control-GI, 71%) and changes in stool
frequency (AUT-GI, 87%; Control-GI, 71%) and consistency
(AUT-GI, 80%; Control-GI, 86%). Mucus in stool was more
frequent in Control-GI (86%) compared to AUT-GI (40%)
children; bloating was more frequent in AUT-GI (60%) compared
to Control-GI (29%) children. Regression (loss of language and/or
Table 1. Summary of patient characteristics.
Subject Characteristic Subcategory AUT-GI (n = 15) Control-GI (n = 7)
Autism onset age in months, mean ± SD AUT-GI subjects 13.465.4 -
Gender All subjects All male All male
Ethnicity, n (%) Caucasian 14 (93) 6 (86)
Hispanic 1 (7) 0 (0)
African-American 0 (0) 1 (14)
Age at biopsy in years, median (IQR) [range] All subjects 4.5 (1.3) [3.5–5.9] 4.0 (1.1) [3.9–5.5]
Medications-number per subjecta, median (IQR) [range] All subjects 5 (7) [1–21] 5 (7) [0–8]
Food allergies, n (% of subjects) All subjects 10 (67) 5 (71)
Milk-related allergyb, n (% of subjects with food allergy) Subjects reporting any food allergy 9 (90) 5 (100)
Wheat-related allergyc, n (% of subjects with food allergy) Subjects reporting any food allergy 8 (80) 4 (80)
Diet improvement of GI problems, n (% of subjects with food allergy) Subjects reporting any food allergy 10 (100) 5 (100)
Current comorbid conditions-number per subject, median (IQR) [range] All subjects 1 (1.75) [0–5] 2 (2.75) [1–6]
Comorbid atopic disease manifestationsd, n (% of subjects) All subjects 8 (53) 7 (100)
Asthma, n (% of subjects) All subjects 3 (20) 5 (71)
Atopic dermatitis, n (% of subjects) All subjects 4 (27) 4 (57)
Allergic rhinitis, n (% of subjects) All subjects 4 (27) 3 (43)
a– Number of prescription drugs and alternative agents taken regularly, per subject.b– Allergy to milk, casein, lactose, or dairy.c– Allergy to wheat or gluten.d– Asthma, Allergic rhinitis, or Atopic dermatitis.doi:10.1371/journal.pone.0024585.t001
Intestinal Gene Expression and Dysbiosis in Autism
PLoS ONE | www.plosone.org 2 September 2011 | Volume 6 | Issue 9 | e24585
other skills following acquisition) is reported in 20% to 40% of
individuals with autism, and some studies suggest higher rates of
GI symptoms in ASD subjects with regression than those without
regression [27]. Eighty-seven percent of AUT-GI subjects in our
study had behavioral regression (Table S2).
Deficient ileal mRNA expression of disaccharidases andhexose transporters in AUT-GI children
We examined transcript levels for three primary brush border
disaccharidases (sucrase isomaltase [SI], maltase glucoamylase
[MGAM], and lactase [LCT]) in ileal biopsies of AUT-GI and
Control-GI children by real-time PCR. Levels of mRNA for all
three enzymes were significantly decreased in AUT-GI children:
SI (Figure 1A: Mann-Whitney, p = 0.001), MGAM (Figure 1B:
Mann-Whitney, p = 0.003) and LCT (Figure 1C: Mann-Whit-
ney, p = 0.032). Within the AUT-GI group, 86.7%, 80%, and
80% of children had deficient transcript levels (defined as below
the 25th percentile of values obtained for Control-GI children and
at least two-fold below Control-GI mean values) for SI, MGAM,
and LCT, respectively (Figure 2A and Table S3). Nearly all (14/
15, or 93.3%) AUT-GI children had deficiencies in at least one
disaccharidase enzyme; 80% had deficiencies in 2 or more
enzymes; 73.3% had deficiencies in all three enzymes (Figure 2A).
Deficiencies in LCT mRNA in AUT-GI children were not
attributable to disproportionate adult-type hypolactasia genotypes
in the AUT-GI group relative to the Control-GI group (FigureS1A–D and Text S1).
Two hexose transporters, sodium-dependent glucose cotran-
sporter (SGLT1) and glucose transporter 2 (GLUT2), mediate
transport of monosaccharides in the intestine. SGLT1, located on
the luminal membrane of enterocytes, is responsible for the active
transport of glucose and galactose from the intestinal lumen into
enterocytes. GLUT2 transports glucose, galactose, and fructose
across the basolateral membrane into the circulation and may also
translocate to the apical membrane [28]. Real-time PCR revealed
a significant decrease in ileal SGLT1 mRNA (Figure 1D: Mann-
Whitney, p = 0.008) and GLUT2 mRNA (Figure 1E: Mann-
Whitney, p = 0.010) in AUT-GI children. For SGLT1, 73.3% of
AUT-GI children had deficient transcript levels, and 73.3% of
AUT-GI children had deficient GLUT2 transcript levels, relative
to Control-GI children (Figure 2A). Deficiencies were found in at
least one hexose transporter in 80% of AUT-GI children; 66.7%
had deficiencies in both transporters.
In total, 93.3% (14/15) of AUT-GI children had mRNA
deficiencies in at least one of the 5 genes involved in carbohydrate
digestion or transport; 66.7% (10/15) had mRNA deficiencies in
all 5 genes (Figure 2A).
To determine whether reductions in disaccharidase and
transporter transcript levels reflected loss of or damage to intestinal
epithelial cells, we measured mRNA levels associated with a tissue-
specific marker restricted to these cells, villin [29,30]. Ileal villin
mRNA levels were not decreased in AUT-GI children (Mann-
Whitney, p = 0.307) (Figure 1F). Normalization of SI, MGAM,
LCT, SGLT1, and GLUT2 to villin mRNA levels did not correct
deficits (Figure S2A–E).
The transcription factor, caudal type homeobox 2 (CDX2),
regulates expression of SI, LCT, GLUT2, and SGLT1
[31,32,33,34]. Real-time PCR experiments demonstrated lower
levels of CDX2 mRNA in some AUT-GI subjects versus controls;
however, group differences were not significant (Figure 1G:
Mann-Whitney, p = 0.192). Although only 33.3% of AUT-GI
patients had deficient CDX2 mRNA levels (Figure 2A), 86.7% of
AUT-GI children had CDX2 levels below the 50th percentile of
Control-GI children, and 46.7% of AUT-GI children had at least
a two-fold decrease in CDX2 expression relative to the Control-GI
mean. Only one AUT-GI child (patient #7) had CDX2 levels
above the 75th percentile of Control-GI children and a near two-
fold (1.95-fold) increase in CDX2 expression (Figure 2A and
Table S3). This child was the only AUT-GI subject who did not
show signs of deficiencies in disaccharidases or transporters.
AUT-GI children with deficiencies in all five disaccharidases
and transporters had significantly lower levels of CDX2 mRNA
compared to AUT-GI children with fewer than five deficiencies
(Figure S2F: Mann-Whitney, p = 0.037). However, only a trend
toward decreased CDX2 levels was found when comparing AUT-
GI children with deficiencies in all five disaccharidases and
transporters and Control-GI children (Figure S2F: Mann-
Whitney, p = 0.064).
Multiple linear regression analyses were conducted to determine
whether diagnostic status (AUT-GI or Control-GI), CDX2 mRNA
expression, or villin mRNA expression (predictor variables) was
associated with mRNA expression levels of individual disacchari-
dases (SI, MGAM, and LCT) or transporters (SGLT1 and
GLUT2) (Table 3). In each of the five models, where the
expression of SI, MGAM, LCT, SGLT1, or GLUT2 served as
outcome variables, CDX2 contributed significantly to the model.
As the level of CDX2 increased by one unit of standard deviation,
there was a concomitant approximate one unit increase in log-
transformed disaccharidase and transporter transcript levels
(ranging from 0.78 for SGLT1 to 1.30 for LCT). None of the
interaction terms between CDX2 and diagnostic status were
significant, implying that the magnitude of the effect of CDX2 on
log-transformed enzyme and transporter levels was the same for
AUT-GI and Control-GI children. For SGLT1 and GLUT2
expression, CDX2 was the sole significant predictor variable in the
model. Diagnostic status and CDX2 were significant predictors of
SI, MGAM, and LCT expression, suggesting that additional
factors associated with diagnostic status must also contribute to
expression levels for these enzymes. Villin was not a significant
predictor of the expression levels of any of the five genes after
adjusting for CDX2.
Mucosal dysbiosis in AUT-GI childrenTo determine whether deficient carbohydrate digestion and
absorption influenced the composition of intestinal microflora,
ileal and cecal biopsies from AUT-GI and Control-GI children
were analyzed by bacterial 16S rRNA gene pyrosquencing. The
Table 2. Summary of patient GI symptoms.
GI Symptoms AUT-GI, n (%) Control-GI, n (%)
Diarrhea 12 (80) 5 (71)
Diarrhea w/Vomiting 2 (13) 2 (29)
Vomiting 2 (13) 1 (14)
Bloating 9 (60) 2 (29)
D Stool Frequency 13 (87) 5 (71)
D Stool Consistency 12 (80) 6 (86)
Mucus in Stool 6 (40) 6 (86)
Blood in Stool 2 (13) 1 (14)
Pain 8 (53) 5 (71)
Weight Loss 3 (20) 0 (0)
Fever 1 (7) 0 (0)
doi:10.1371/journal.pone.0024585.t002
Intestinal Gene Expression and Dysbiosis in Autism
PLoS ONE | www.plosone.org 3 September 2011 | Volume 6 | Issue 9 | e24585

use of biopsies rather than fecal material allowed us to assess the
mucoepithelia-associated microbiota, as these likely establish more
intimate interactions with the human intestinal epithelium and
immune cells [35]. A total of 525,519 bacterial sequences were
subjected to OTU (Operational Taxonomic Unit; defined at 97%
identity) analysis and classified with RDP (Ribosomal Database
Project). Rarefaction analysis of OTUs did not suggest a loss or
gain of overall diversity based on Shannon Diversity estimates in
AUT-GI compared to Control-GI children (See Figure S3A–Dand Text S1).
Classification of pyrosequencing reads revealed that Bacteroi-
detes and Firmicutes were the most prevalent taxa in ileal and
cecal tissues of AUT-GI and Control-GI children, followed by
Proteobacteria (Figure 3A, B). Other phyla identified at lower
levels included Verrucomicrobia, Actinobacteria, Fusobacteria,
Lentisphaerae, and TM7, as well as ‘‘unclassified bacteria’’
(sequences that could not be assigned at the phylum-level)
(Figure 3A, B). The abundance of Bacteroidetes was lower in
AUT-GI ileal (Figure 3C: Mann-Whitney, p = 0.012) and cecal
biopsies (Figure 3D: Mann-Whitney, p = 0.008), as compared
with the abundance of Bacteroidetes in Control-GI biopsies. Real-
time PCR using Bacteroidete-specific primers confirmed decreases
in Bacteroidetes in AUT-GI ilea (Figure 3E: Mann-Whitney,
p = 0.003; Table S4: 50% average reduction in Bacteroidete 16S
rDNA copies; range, 24.36% to 76.28% decrease) and ceca
(Figure 3F: Mann-Whitney, p = 0.022; Table S4: 29% average
reduction in 13 of 15 patients with reduced Bacteroidetes; range,
7.22% to 56.54% decrease), with levels below the 25th percentile of
Control-GI children in 100% of AUT-GI ilea and 86.7% of AUT-
GI ceca (Figure 2B). OTU analysis of Bacteroidete sequences
suggested that deficiencies in Bacteroidete sequences in AUT-GI
subjects were attributable to cumulative losses of 12 predominant
phylotypes of Bacteroidetes, rather than loss of any one specific
phylotype (Figure S4A–E and Text S1).
Analysis of pyrosequencing reads revealed a significant increase
in Firmicute/Bacteroidete ratios in AUT-GI ilea (Figure 4A:
Mann-Whitney, p = 0.026) and ceca (Figure 4B: Mann-Whitney,
p = 0.032). An increase was also observed at the order level for
Clostridiales/Bacteroidales ratios in ilea (Figure S5A: Mann-
Whitney, p = 0.012) and ceca (Figure S5B: Mann-Whitney,
p = 0.032). Real-time PCR using Firmicute- and Bacteroidete-
specific primers confirmed increases in Firmicute/Bacteroidete
ratios in AUT-GI ilea (Figure 4C: Mann-Whitney, p = 0.0006)
and ceca (Figure 4D: Mann-Whitney, p = 0.022). Based on real-
Figure 1. Quantitative real-time PCR analysis of disaccharidases, hexose transporters, villin and CDX2 transcripts. Box-and-whiskerplots displaying (A) SI (Mann-Whitney; p = 0.001), (B) MGAM (Mann-Whitney; p = 0.003), (C) LCT (Mann-Whitney; p = 0.032), (D) SGLT1 (Mann-Whitney;p = 0.008), (E) GLUT2 (Mann-Whitney; p = 0.010), (F) Villin (Mann-Whitney; p = 0.307), and (G) CDX2 (Mann-Whitney; p = 0.192) mRNA expressionnormalized to GAPDH mRNA in ileal biopsies from AUT-GI (AUT) and Control-GI (Control) patients. *, p,0.05; **, p,0.01; n.s., not significant.doi:10.1371/journal.pone.0024585.g001
Intestinal Gene Expression and Dysbiosis in Autism
PLoS ONE | www.plosone.org 4 September 2011 | Volume 6 | Issue 9 | e24585

Intestinal Gene Expression and Dysbiosis in Autism
PLoS ONE | www.plosone.org 5 September 2011 | Volume 6 | Issue 9 | e24585

time PCR results, Firmicute/Bacteroidete ratios were above the
75th percentile of Control-GI values in 100% of AUT-GI ilea and
60% of AUT-GI ceca (Figure 2C).
The cumulative level of Firmicutes and Proteobacteria was
significantly higher in the AUT-GI group in both ileal (Figure 4E:
Mann-Whitney, p = 0.015) and cecal (Figure 4F: Mann-Whitney,
p = 0.007) biopsies; however, neither Firmicute nor Proteobacteria
levels showed significant differences on their own (Figure S5C–Fand Figure 5A, B). These results suggest that the observed
decrease in Bacteroidetes in AUT-GI children is accompanied by
an increase in Firmicutes (Ileal biopsies- patients #1, 3, 4, 6, 7, 9,
10, 13, and 14; Cecal biopsies- patients #1, 3, 4, 7, 9, 10, and 13),
or Proteobacteria (Ileal biopsies- patients #2, 8, 11 and 15; Cecal
biopsies- patients #2, 5, 8, 11, 13, and 15), or both (Cecal biopsies-
patient #13) (Figure 2B and Figure S6A, B).
Within the Firmicute phyla, order-level analysis of pyrose-
quencing reads indicated trends toward increases in Clostridiales
in AUT-GI ilea (Figure S5G: Mann-Whitney, p = 0.072) and
ceca (Figure S5H: Mann-Whitney, p = 0.098). Family-level
analysis revealed that increased Clostridiales levels in AUT-GI
patient samples were largely attributable to increases in Lachnospir-
aceae and Ruminococcaceae (Figure 4G–J). Cumulative levels of
Lachnospiraceae and Ruminococcaceae above the 75th percentile of the
corresponding levels in Control-GI samples were found in 60% of
AUT-GI ileal and 53.3% of AUT-GI cecal samples (Figure 2B).
Genus-level analysis indicated that members of the genus
Faecalibacterium within the family Ruminococcaceae contributed to
the overall trend toward increased Clostridia levels (Figure S7A,B). Within Lachnospiraceae, members of the genus Lachnopsiraceae
Incertae Sedis, Unclassified Lachnospiraceae, and, to a lesser extent,
Bryantella (cecum only), contributed to the overall trend toward
increased Clostridia (Figure S7A, B).
Within the Proteobacteria phyla, class-level abundance of
Betaproteobacteria tended to be higher in the ilea of AUT-GI
patients (Figure 5C: Mann-Whitney, p = 0.072); significantly
higher abundance of Betaproteobacteria were found in AUT-GI
ceca (Figure 5D: Mann-Whitney, p = 0.038). Levels of Betapro-
teobacteria were above the 75th percentile of Control-GI children
in 53.3% of AUT-GI ilea and 66.7% of AUT-GI ceca
(Figure 2B). Family-level analysis revealed that members of the
families Alcaligenaceae (patients #1, 3, 5, 7, 10, 11, and 12) and
Incertae Sedis 5 (patient #2 only) contributed to the increases in
Betaproteobacteria in ilea (Figure 5E) and ceca (Figure 5F).
Alcaligenaceae sequences were detected in 46.7% of AUT-GI
children and none of the Control-GI children. Elevated levels of
Proteobacteria in AUT-GI ilea and ceca reflected increased
Alpha- (families Methylobacteriaceae and Unclassified Rhizobiales) and
Betaproteobacteria (family Incertae Sedis 5) for patient #2 and
increased Gammaproteobacteria (family Enterobacteriaceae) for
patients #8 and #15 (Figure 5E, F). Levels of Alpha-, Delta-,
Gamma-, and Epsilonproteobacteria were not significantly
different between AUT-GI and Control-GI samples (data not
shown).
The use of probiotics, proton-pump inhibitors, or antibiotics has
been shown to impact the intestinal microbiome [36,37,38].
Analysis of the potential effects of these agents in this cohort
revealed only one potential confounding effect: a correlation
between the ratio of Firmicutes to Bacteroidetes in the cecum
obtained by real-time PCR in AUT-GI children who had taken
probiotics (Table S5A and Text S1). No effect of proton-pump
Figure 2. Patient summary tables for gene expression and bacterial assays. (A–C) Increases or decreases in AUT-GI children in both geneexpression (A) and bacterial parameters (B and C) were determined for each individual based on the levels of each parameter in the Control-GIgroup. (A) The gene expression levels in the AUT-GI children that exceeded the 75th percentile of Control-GI values and were at least 2-fold increasedrelative to the Control-GI mean (red arrow) or below the 25th percentile of Control-GI values and at least 2-fold decreased relative to the Control-GImean (green arrow) were scored as an increase or decrease, respectively. Values above the 90th or below the 10th percentiles of Control-GI childrenare indicated by double arrows. (B and C) Bacterial parameters in AUT-GI children that exceeded the 75th percentile of Control-GI values (red arrows)or were below the 25th percentile of Control-GI values (green arrows) were scored as an increase or decrease, respectively. Values above the 90th orbelow the 10th percentiles of Control-GI children are indicated by double arrows. Results are shown for data obtained by real-time PCR (RT), whereperformed, and pyrosequencing (454). (n.c. = no change relative to defined cut-off values for Control-GI children).doi:10.1371/journal.pone.0024585.g002
Table 3. Multiple linear regression analysis examining CDX2 and villin as predictors of disaccharidase and transporter mRNAexpression among AUT-GI and Control-GI children.
Predictor Variables: Coefficient Estimate
Outcome Variable F3,18 (p-value) Adjusted R2 Diagnostic Status CDX2STDev VillinSTDev
SI 10.35 (0.0003)*** 0.57 21.83* 0.93* 20.19
MGAM 8.78 (0.0008)*** 0.53 22.10* 1.15* 20.20
LCT 10.87 (0.0003)*** 0.59 22.25* 1.30* 0.65
SGLT1 6.88 (0.0030)** 0.46 21.36{ 0.78* 0.12
GLUT2 6.06 (0.0050)** 0.42 21.90{ 1.06* 0.03
STDev– Change in log-transformed outcome variable levels per unit standard deviation increase in predictor variable.*, p,0.05;**, p,0.01;***, p,0.001;{, p,0.1 (trend).doi:10.1371/journal.pone.0024585.t003
Intestinal Gene Expression and Dysbiosis in Autism
PLoS ONE | www.plosone.org 6 September 2011 | Volume 6 | Issue 9 | e24585

inhibitors was observed for any of the significant variables assessed
in this study (Table S5B and Text S1). Only one patient, a
control (Control-GI patient #16), had taken an antibiotic
(amoxicillin) in the three months prior to biopsy (See TableS5C and Text S1).
Disaccharidase and transporter mRNA levels aspredictors of bacterial abundance
Multiple linear regression analyses were conducted to determine
whether diagnostic status (AUT-GI or Control-GI) and mRNA
expression of disaccharidases (SI, MGAM, and LCT) and
Figure 3. Composition of intestinal microflora in AUT-GI children. (A–B) Phylum-level comparison of the average relative abundance ofbacterial taxa in ileal (A) and cecal (B) biopsies. (C–D) Bacteroidete abundance, obtained from pyrosequencing for ileal (C; Mann-Whitney, p = 0.012)and cecal (D; Mann-Whitney, p = 0.008) biopsies. (E–F) Bacteroidete-specific quantitative real-time PCR analysis of ileal (E; Mann-Whitney, p = 0.003)and cecal (F; Mann-Whitney, p = 0.022) biopsies; copy number values are normalized relative to total bacteria copy numbers. *, p,0.05; **, p,0.01.doi:10.1371/journal.pone.0024585.g003
Intestinal Gene Expression and Dysbiosis in Autism
PLoS ONE | www.plosone.org 7 September 2011 | Volume 6 | Issue 9 | e24585

transporters (SGLT1 and GLUT2) (predictor variables) were
associated with bacterial levels as outcome variables (Table 4).
For Bacteroidetes, SGLT1 (ileum and cecum) and SI (cecum only)
were significant predictors. In both the ileum and cecum,
Bacteroidete levels increased as SGLT1 transcript levels increased.
In the cecum, Bacteroidete levels significantly decreased as the
levels of SI increased (a similar marginal effect was observed in
ileum). Bacteroidete levels were lower among AUT-GI children
compared to Control-GI children even after adjusting for the
expression of all disaccharidases and transporters.
Firmicute levels significantly decreased as SI levels increased in
cecum. Cecal Firmicute levels were increased as the levels of
MGAM and GLUT2 increased. The levels of Firmicutes in the
cecum were higher in AUT-GI compared to Control-GI children
after adjusting for the expression of disaccharidases and trans-
porters. Significant interaction was found between diagnostic
status and MGAM and GLUT2 levels in the Firmicute models.
Whereas higher levels of MGAM and GLUT2 were associated
with higher levels of Firmicutes among Control-GI children, the
effects of MGAM and GLUT2 on Firmicutes were not present in
AUT-GI children.
Disaccharidases and transporter levels were not significant
predictors of the ratios of Firmicutes to Bacteroidetes in ileum or
cecum. However, the interaction terms with GLUT2 in the ileum
and SI in the cecum were significant.
Proteobacteria abundance significantly increased as the levels of
SI increased, but decreased as MGAM increased for both ileum
and cecum. However, the interaction terms with MGAM in both
ileum and cecum were significant, implying that the magnitude of
decline is significantly smaller among AUT-GI children. Betapro-
teobacteria abundance was positively associated with SI and
inversely associated with MGAM only in cecum; none of the
interactions were significant. In addition, Proteobacteria and
Betaproteobacteria abundance were not significantly different
Figure 4. Firmicute/Bacteroidete ratios, Clostridia family abundance, and cumulative levels of Firmicutes and Proteobacteria. (A–B)Firmicute/Bacteroidete ratio from pyrosequencing reads obtained from ileal (A; Mann-Whitney, p = 0.026) and cecal (B; Mann-Whitney, p = 0.032)biopsies. (C–D) Firmicute/Bacteroidete ratios obtained by real-time PCR for ilea (C; Mann-Whitney, p = 0.0006) and ceca (D; Mann-Whitney, p = 0.022).(E–F) Cumulative abundance of Firmicutes and Proteobacteria from ileal (E; Mann-Whitney, p = 0.015) and cecal (F; Mann-Whitney, p = 0.007)biopsies. (G–H) Cumulative levels of members of the families Lachnospiraceae and Ruminococcaceae in ileal (G; Mann-Whitney; p = 0.062) and cecal(H; Mann-Whitney; p = 0.098) biopsies. (I–J) Family-level abundance distributions of the class Clostridia in ileum (I) and cecum (J): bottom rowdisplays cumulative levels of all family members by patient; gray cells indicate where no sequences were observed for a given taxa. *, p,0.05;**, p,0.01; ***, p,0.001; {, p,0.1 (trend).doi:10.1371/journal.pone.0024585.g004
Intestinal Gene Expression and Dysbiosis in Autism
PLoS ONE | www.plosone.org 8 September 2011 | Volume 6 | Issue 9 | e24585

between AUT-GI and Control-GI children after adjusting for the
expression of all disaccharidases and transporters. Overall, these
results suggest that expression levels of disaccharidases and
transporters are associated with the abundance of Bacteroidetes,
Firmicutes, and Betaproteobacteria in the mucoepithelium.
The levels of Betaproteobacteria in the ileum and cecum were
higher in AUT-GI children with deficiencies in all 5 disacchari-
dases and transporters versus AUT-GI children with fewer than 5
disaccharidase and transporter deficiencies (Figure S8A, B).
Levels of CDX2 were lower in AUT-GI children with levels of
Betaproteobacteria above the 75th percentile of Control-GI
children compared to AUT-GI children with levels of Betapro-
teobacteria below the 75th percentile of Control-GI children
(Figure S8C, D). These results suggest a potential link between
increased levels of Betaproteobacteria, reduced levels of CDX2
expression, and overall deficiencies in disaccharidases and
transporters.
Timing of GI disturbances relative to onset of autism isassociated with changes in Clostridiales members
In this cohort, the onset of GI symptoms was reported to occur
before or at the same time as the development of autism in 67% of
AUT-GI children. As a sub-analysis, we sought to determine
whether the timing of GI onset relative to autism onset was
associated with gene expression and bacterial variables.
Patients were stratified based on whether the first episode of GI
symptoms occurred before or at the same time (within the same
month) as the onset of autism (AUT-GI-Before or Same group) or
Figure 5. Abundance of Proteobacteria in AUT-GI and Control-GI children. (A–B) Phyla-level abundance of Proteobacteria members in ileal(A; Mann-Whitney, p = 0.549) and cecal (B; Mann-Whitney, p = 0.072) biopsies obtained by pyrosequencing. (C–D) Class-level abundance ofBetaproteobacteria members in ileal (C; Mann-Whitney, p = 0.072) and cecal (D; Mann-Whitney, p = 0.038) biopsies. (E–F) Family-level abundancedistributions of bacteria within the classes Alpha-, Beta-, and Gammaproteobacteria in ileal (E) and cecal (F) biopsies: bottom row of each heatmapdisplays the cumulative levels of family members in each class of Proteobacteria by patient; gray cells indicate where no sequences were identifiedfor a given taxa. *, p,0.05; {, p,0.1 (trend); n.s., not significant.doi:10.1371/journal.pone.0024585.g005
Intestinal Gene Expression and Dysbiosis in Autism
PLoS ONE | www.plosone.org 9 September 2011 | Volume 6 | Issue 9 | e24585

Ta
ble
4.
Mu
ltip
lelin
ear
reg
ress
ion
anal
ysis
exa
min
ing
dis
acch
arid
ase
san
dtr
ansp
ort
ers
asp
red
icto
rso
fb
acte
rial
leve
lsam
on
gA
UT
-GI
and
Co
ntr
ol-
GI
child
ren
.
Ma
inE
ffe
cts:
Co
eff
icie
nt
Est
ima
te
Ou
tco
me
Va
ria
ble
F-s
tati
stic
(p-v
alu
e)
Ad
just
ed
R2
Dia
gn
ost
icS
tatu
sS
IST
De
vM
GA
MS
TD
ev
LC
TS
TD
ev
SG
LT
1S
TD
ev
GL
UT
2S
TD
ev
Inte
ract
ion
Te
rms
wit
hS
tatu
s(C
oe
ffic
ien
tST
De
v)
Ba
cte
roid
ete
s,Il
eu
m-R
T5
.52
a(0
.00
3)*
*0
.56
20
.86
***
20
.54{
0.0
52
0.0
20
.35
*0
.05
no
ne
Ba
cte
roid
ete
s,C
ecu
m-R
T2
.61
a(0
.06
2){
0.3
12
0.3
6*
20
.60
*0
.27
20
.08
0.2
9*
0.0
8n
on
e
Fir
mic
ute
s,Il
eu
m-R
T2
.50
b(0
.06
8){
0.3
30
.40
20
.57{
0.4
42
0.0
10
.10
0.1
0M
GA
M(2
0.5
2)*
Fir
mic
ute
s,C
ecu
m-R
T6
.98
c(0
.00
1)*
*0
.69
1.2
9**
*2
0.9
9**
0.8
6**
0.1
8{
0.0
60
.40
*M
GA
M(2
0.5
0)*
,G
LUT
2(2
0.4
6)*
Fir
m./
Ba
c.,
Ile
um
-RT
3.4
3b
(0.0
24
)*0
.45
1.4
3**
20
.19
0.1
90
.04
20
.27
0.4
8{
GLU
T2
(20
.61
)*
Fir
m./
Ba
c.,
Ce
cum
-RT
5.1
3b
(0.0
05
)**
0.5
81
.47
***
0.2
70
.21
0.1
92
0.2
22
0.0
2SI
(20
.93
)**
Pro
teo
ba
cte
ria
,Il
eu
m-4
54
2.4
7b
(0.0
71
){0
.33
21
.05
2.7
6**
22
.31
*0
.01
20
.79{
20
.59{
MG
AM
(1.2
1){
Pro
teo
ba
cte
ria
,C
ecu
m-4
54
5.4
1b
(0.0
04
)**
0.5
92
1.2
13
.34
***
23
.56
***
20
.03
20
.68{
20
.38
MG
AM
(1.5
9)*
*
Be
taP
rote
ob
act
eri
a,
Ile
um
-45
41
.14
a(0
.38
5)
0.0
42
0.1
40
.61
20
.87
0.0
52
0.2
62
0.1
6n
on
e
Be
taP
rote
ob
act
eri
a,
Ce
cum
-45
45
.64
a(0
.00
3)*
*0
.57
20
.16
1.4
3*
22
.07
**0
.27
20
.44
0.0
8n
on
e
a-
on
6an
d1
5d
eg
ree
so
ffr
ee
do
m.
b-
on
7an
d1
4d
eg
ree
so
ffr
ee
do
m.
c-
on
8an
d1
3d
eg
ree
so
ffr
ee
do
m.
ST
De
v-
Ch
ang
ein
log
-tra
nsf
orm
ed
ou
tco
me
vari
able
leve
lsp
er
un
itst
and
ard
de
viat
ion
incr
eas
ein
pre
dic
tor
vari
able
(mai
ne
ffe
ctva
riab
les
or
inte
ract
ion
term
s).
*,p
,0
.05
;**
,p
,0
.01
;**
*,p
,0
.00
1;
{,p
,0
.1(t
ren
d).
do
i:10
.13
71
/jo
urn
al.p
on
e.0
02
45
85
.t0
04
Intestinal Gene Expression and Dysbiosis in Autism
PLoS ONE | www.plosone.org 10 September 2011 | Volume 6 | Issue 9 | e24585

whether the first episode of GI symptoms occurred after the onset
of autism (AUT-GI-After group). The timing of GI onset was not
associated with levels of disaccharidase, hexose transporter or
CDX2 transcripts, Bacteroidetes, Proteobacteria or Betaproteo-
bacteria (data not shown). However, a significant effect was
observed for the levels of Clostridiales and cumulative levels of
Lachnospiraceae and Ruminococcaceae in both the ileum and cecum
(Figure 6A–D). Whereas only a trend toward increased
Clostridiales and cumulative levels of Lachnospiraceae and Rumino-
coccaceae were observed when comparing all AUT-GI and Control-
GI children (Figure S5G, H and Figure 4G, H), stratification
based on timing of GI onset revealed a significant increase in these
variables in both the ileum and cecum of the AUT-GI-Before or
Same group relative to all Control-GI children (Figure 6A:
Clostridiales-ileum, Mann-Whitney, p = 0.015; Figure 6B: Clos-
tridiales-cecum, Mann-Whitney, p = 0.019; Figure 6C: La-
ch.+Rum.-ileum, Mann-Whitney, p = 0.015; Figure 6D: La-
ch.+Rum.-cecum, Mann-Whitney, p = 0.011). Furthermore, the
levels of Clostridiales and cumulative levels of Lachnospiraceae and
Ruminococcaceae were significantly higher in the AUT-GI-Before or
Same group relative to the AUT-GI-After group (Figure 6A:
Clostridiales-ileum, Mann-Whitney, p = 0.028; Figure 6B: Clos-
tridiales-cecum, Mann-Whitney, p = 0.037; Figure 6C: La-
ch.+Rum.-ileum, Mann-Whitney, p = 0.028; Figure 6D: La-
ch.+Rum.-cecum, Mann-Whitney, p = 0.020); the AUT-GI-After
group was not significantly different from the Control-GI group.
As expected, the AUT-GI-After group had a significantly older
age at first onset of GI symptoms [median age in months,
(interquartile range, IQR) = 36, (22.5)] compared to the AUT-GI-
Before or Same group [median age in months, (interquartile
range, IQR) = 1, (12)] (Figure 6E: Mann-Whitney, p = 0.007),
and was also higher than the Control-GI group [median age in
months, (interquartile range, IQR) = 1, (14)] (Figure 6E: Mann-
Whitney, p = 0.027). The age at first GI onset was not significantly
different between the AUT-GI-Before or Same group and the
Control-GI group (Figure 6E: Mann-Whitney, p = 0.757). Thus,
the increased levels of Clostridiales in the AUT-GI-Before or
Same group as compared to the Control-GI group were not
influenced by differences in age of onset of GI symptoms between
these two groups. These results suggest that the timing of onset of
GI symptoms relative to onset of autism or the age at first GI onset
may be associated with increases in Clostridiales.
Associations between gene expression, bacterialabundance, and food allergies and other comorbidatopic manifestations
A National Survey of Children’s Health, performed under the
auspices of the Centers for Disease Control, reported that parents
of autistic children reported more allergy symptoms than control
children, and food allergies were the most prevalent complaint
[39]. Parental reports of food allergies (FA) in our cohort were
reported with similar frequency in AUT-GI (67%) and Control-GI
(71%) children. Milk-related (MA) and wheat-related (WA)
allergies were the most commonly reported allergies in both
groups (Table 1 and Table S1). To determine whether FA was
associated with gene expression or bacterial levels, patients in the
AUT-GI group and Control-GI group were stratified based on
reports of any FA (Table 5), MA (Table 6), or WA (Table 7).
Stratification by any FA revealed a significant effect for levels of
GLUT2, ileal and cecal Firmicutes, ileal and cecal ratios of
Firmicutes to Bacteroidetes, and cecal Betaproteobacteria
(Table 5). No effect was observed for the levels of Bacteroidetes,
which were significantly reduced in AUT-GI children independent
of FA status.
Stratification by MA status revealed even more significant
effects (Table 6). Significant effects were observed for MGAM,
GLUT2, and CDX2 expression, as well as ileal and cecal ratios of
Firmicutes to Bacteroidetes, and ileal and cecal Beta-proteobac-
teria. Additional trends were observed for SI expression and ileal
and cecal Firmicutes. No effect was observed for the levels of
Bacteroidetes, which were significantly reduced in AUT-GI
children independent of MA status.
Stratification by WA status was associated with a significant
effect only for cecal levels of Firmicutes, though this effect was
highly significant [AUT(+WA) vs. AUT(2WA): Mann-Whitney,
p-value = 0.008], and the cecal ratio of Firmicutes to Bacteroidetes
(Table 7).
These results suggest that changes in the expression of some
disaccharidases and transporters and CDX2, as well as changes in
the abundance of some bacterial phylotypes, are significantly
associated with reported FA, especially MA. Whereas the levels of
Firmicutes, the ratio of Firmicutes to Bacteroidetes, and levels of
Betaproteobacteria were increased in AUT-GI children with FA,
the levels of Bacteroidetes were not significantly different. This
suggests that the levels of Bacteroidetes were significantly
decreased in AUT-GI children, independent of FA status.
Atopic disease manifestations (AD: asthma, allergic rhinitis, or
atopic dermatitis) were the most commonly reported comorbid
conditions in both AUT-GI and Control-GI children. The
frequency of AD tended to be higher in the Control-GI group
(100%) than in the AUT-GI group (53%) (Table 1: Fisher’s Exact
Test, 2-sided p = 0.051). In the combined group (all AUT-GI and
Control-GI patients), 86.7% of children with reported FA had at
least one reported AD; only 28.6% of children without reported
FA had one or more AD (Fisher’s Exact Test, 2-sided p = 0.014).
As AD was associated with reported FA, we sought to determine
whether AD manifestation was also associated with changes in
disaccharidases and transporters or bacterial parameters. Stratifi-
cation of subjects by AD status revealed that cecal Firmicutes and
the cecal ratio of Firmicutes to Bacteroidetes were higher in AUT-
GI children with AD compared to Control-GI children with AD
[Table 8: AUT(+AD) vs. Control(+AD); Firmicutes CEC(RT),
Mann-Whitney, p = 0.015; Firm./Bacteroid. Ratio CEC(RT),
Mann-Whitney, p = 0.002] and AUT-GI children without AD
[Table 8: AUT(2AD) vs. AUT(+AD); Firmicutes CEC(RT),
Mann-Whitney, p = 0.049; Firm./Bacteroid. Ratio CEC(RT),
Mann-Whitney, p = 0.049].
Discussion
Although the major deficits in ASD are social and cognitive,
many affected individuals with ASD also have substantial GI
morbidity. Major findings in this study that may shed light on GI
morbidity in ASD include the observations that: (1) levels of
transcripts for disaccharidases and hexose transporters are reduced
in AUT-GI children; (2) AUT-GI children have microbial
dysbiosis in the mucoepithelium; and (3) dysbiosis is associated
with deficiencies in host disacharidase and hexose transporter
mRNA expression. Based on these findings, we propose a model
whereby deficiencies in disaccharidases and hexose transporters
alter the milieu of carbohydrates in the distal small intestine (ileum)
and proximal large intestine (cecum), resulting in the supply of
additional growth substrates for bacteria. These changes manifest
in significant and specific compositional changes in the microbiota
of AUT-GI children (see Figure 7A–C).
A previous report on GI disturbances in ASD found low
activities of at least one disaccharidase or glucoamylase in
duodenum in 58% of children [7]. In our study, 93.3% of AUT-GI
Intestinal Gene Expression and Dysbiosis in Autism
PLoS ONE | www.plosone.org 11 September 2011 | Volume 6 | Issue 9 | e24585

Figure 6. Levels of Clostridiales members in AUT-GI patients stratified by timing of GI onset. (A–B) Abundance of Clostridiales from ileal(A) and cecal (B) biopsies from AUT-GI and Control-GI patients (n = 7), with AUT-GI stratified by whether the onset of GI symptoms occurred after(n = 5) the onset of autism symptoms (GI-After) or before and at the same time (n = 10) as autism symptoms (GI-Before/Same). [A: AUT (GI-After) vs.AUT (GI-Before/Same), Mann-Whitney, p = 0.028; AUT (GI-Before/Same) vs. Control-GI, Mann-Whitney, p = 0.015; AUT (GI-After) vs. Control-GI, Mann-Whitney, p = 0.935] [B: AUT (GI-After) vs. AUT (GI-Before/Same), Mann-Whitney, p = 0.037; AUT (GI-Before/Same) vs. Control-GI, Mann-Whitney,p = 0.019; AUT (GI-After) vs. Control-GI, Mann-Whitney, p = 0.935]. (C–D) Cumulative abundance of Lachnospiraceae and Ruminococcaceae from ileal(C) and cecal (D) biopsies from AUT-GI and Control-GI patients (n = 7), with AUT-GI stratified by whether the onset of GI symptoms occurred after(n = 5) the onset of autism symptoms or before and at the same time (n = 10) as autism symptoms [C: AUT (GI-After) vs. AUT (GI-Before/Same), Mann-Whitney, p = 0.028; AUT (GI-Before/Same) vs. Control-GI, Mann-Whitney, p = 0.015; AUT (GI-After) vs. Control-GI, Mann-Whitney, p = 0.808] [D: AUT(GI-After) vs. AUT (GI-Before/Same), Mann-Whitney, p = 0.020; AUT (GI-Before/Same) vs. Control-GI, Mann-Whitney, p = 0.011; AUT (GI-After) vs.Control-GI, Mann-Whitney, p = 0.685]. (E) Age at GI onset (in months) for AUT-GI and Control-GI patients, with AUT-GI stratified by whether GI onsetoccurred after (n = 5) the onset of autism symptoms or before and at the same time (n = 10) as autism symptoms [E: AUT (GI-After) vs. AUT (GI-Before/Same), Mann-Whitney, tied p = 0.007; AUT (GI-Before/Same) vs. Control-GI, Mann-Whitney, tied p = 0.757; AUT (GI-After) vs. Control-GI, Mann-Whitney,tied p = 0.027]. *, p,0.05; **, p,0.01; n.s., not significant.doi:10.1371/journal.pone.0024585.g006
Intestinal Gene Expression and Dysbiosis in Autism
PLoS ONE | www.plosone.org 12 September 2011 | Volume 6 | Issue 9 | e24585

children had decreased mRNA levels for at least one of the three
disaccharidases (SI, MGAM, or LCT). In addition, we found
decreased levels of mRNA for two important hexose transporters,
SGLT1 and GLUT2. Congenital defects in these enzymes and
transporters are extremely rare [40,41], and even the common
variant for adult-type hypolactasia was not responsible for reduced
LCT expression in AUT-GI children in this cohort. Therefore, it is
unlikely that the combined deficiency of disaccharidases (maldiges-
tion) and transporters (malabsorption) are indicative of a primary
malabsorption resulting from multiple congenital or acquired
Table 5. Association of any food allergy (FA) with host gene expression and bacterial phylotypes in AUT-GI children.
Food Allergies (FA)
VariableAUT(+FA) vs. Control(+FA)a,p-valueMW, [effect in AUT(+FA)]
AUT(2FA) vs. AUT(+FA)b, p-valueMW,[effect in AUT(+FA)]
GLUT2 0.014*, [decreased] 0.037*, [decreased]
Bacteroidetes IL(RT) 0.002**, [decreased] 0.806, [no change]
Bacteroidetes CEC(RT) 0.005**, [decreased] 0.713, [no change]
Bacteroidetes IL(454) 0.037*, [decreased] 0.221, [no change]
Bacteroidetes CEC(454) 0.050*, [decreased] 0.713, [no change]
Firmicutes IL(RT) 0.221, [no change] 0.037*, [increased]
Firmicutes CEC(RT) 0.037*, [increased] 0.010*, [increased]
Firm./Bacteroid. Ratio IL(RT) 0.003**, [increased] 0.037*, [increased]
Firm./Bacteroid. Ratio CEC(RT) 0.005**, [increased] 0.020*, [increased]
Beta-proteobacteria IL(454) 0.050{, [increased] 0.066{, [increased]
Beta-proteobacteria CEC(454) 0.028*, [increased] 0.037*, [increased]
a-AUT(+FA), n = 10; Control(+FA), n = 5.b-AUT(2FA), n = 5; AUT(+FA), n = 10.MW- Mann-Whitney test.*, p,0.05;**, p,0.01;{, p,0.1 (trend).doi:10.1371/journal.pone.0024585.t005
Table 6. Association of milk allergy (MA) with host gene expression and bacterial phylotypes in AUT-GI children.
Milk Allergies (MA)
VariableAUT(+MA) vs. Control(+MA)a,p-valueMW, [effect in AUT(+MA)]
AUT(2MA) vs. AUT(+MA)b, p-valueMW,[effect in AUT(+MA)]
SI 0.006**, [decreased] 0.099{, [decreased]
MGAM 0.006**, [decreased] 0.045*, [decreased]
GLUT2 0.009**, [decreased] 0.013*, [decreased]
CDX2 0.072{, [decreased] 0.034*, [decreased]
Bacteroidetes IL(RT) 0.003**, [decreased] 0.480, [no change]
Bacteroidetes CEC(RT) 0.003**, [decreased] 0.289, [no change]
Bacteroidetes IL(454) 0.028*, [decreased] 0.637, [no change]
Bacteroidetes CEC(454) 0.020*, [decreased] 0.637, [no change]
Firmicutes IL(RT) 0.205, [no change] 0.059{, [increased]
Firmicutes CEC(RT) 0.053{, [increased] 0.099{, [increased]
Firm./Bacteroid. Ratio IL(RT) 0.004**, [increased] 0.034*, [increased]
Firm./Bacteroid. Ratio CEC(RT) 0.006**, [increased] 0.045*, [increased]
Beta-proteobacteria IL(454) 0.020*, [increased] 0.013*, [increased]
Beta-proteobacteria CEC(454) 0.009**, [increased] 0.007**, [increased]
a-AUT(+MA), n = 9; Control(+MA), n = 5.b-AUT(2MA), n = 6; AUT(+MA), n = 9.MW- Mann-Whitney test.*, p,0.05;**, p,0.01;{, p,0.1 (trend).doi:10.1371/journal.pone.0024585.t006
Intestinal Gene Expression and Dysbiosis in Autism
PLoS ONE | www.plosone.org 13 September 2011 | Volume 6 | Issue 9 | e24585

defects in each of these genes. Transcripts for the enterocyte marker,
villin, were not reduced in AUT-GI ilea and did not predict the
expression levels of any of the disaccharidases or transporters in
multiple regression models. This suggests that a general loss of
enterocytes is unlikely. However, we cannot exclude the possibility
that defects in the maturational status of enterocytes or enterocyte
migration along the crypt-villus axis contribute to deficits in
disaccharidase and transporter expression [42].
The ileal expression of CDX2, a master transcriptional
regulator in the intestine, was a significant predictor of mRNA
expression of all five disaccharidases and transporters in AUT-GI
and Control-GI children, based on linear regression models.
However, as ASD status remained a significant predictor of
disaccharidase mRNA expression even after adjusting for CDX2
and villin, additional factors must also contribute. One potential
factor is diet. Dietary intake of carbohydrates can regulate the
mRNA expression of disaccharidases and hexose transporters in
mice and rats [43,44,45]. Several studies suggest that ASD
children exhibit feeding selectivity and aberrant nutrient con-
sumption [46,47,48,49,50,51,52]. However, of the four studies
reporting on carbohydrate intake, none found differences in total
carbohydrate intake in ASD children [47,48,49,50]. Furthermore,
one study found no association between dietary intake of
macronutrients (i.e., carbohydrates, proteins, or fats) and GI
Table 8. Association of atopic disease (AD) status with host gene expression and bacterial phylotypes in AUT-GI children.
Atopic Disease (AD)
VariableAUT(+AD) vs. Control(+AD)a,p-valueMW, [effect in AUT(+AD)]
AUT(2AD) vs. AUT(+AD)b,p-valueMW, [effect in AUT(+AD)]
Bacteroidetes IL(RT) 0.008**, [decreased] 0.563, [no change]
Bacteroidetes CEC(RT) 0.028*, [decreased] 0.418, [no change]
Bacteroidetes IL(454) 0.049*, [decreased] 0.643, [no change]
Bacteroidetes CEC(454) 0.064{, [decreased] 0.908, [no change]
Firmicutes IL(RT) 0.064{, [increased] 0.133, [no change]
Firmicutes CEC(RT) 0.015*, [increased] 0.049*, [increased]
Firm./Bacteroid. Ratio IL(RT) 0.002**, [increased] 0.064{, [increased]
Firm./Bacteroid. Ratio CEC(RT) 0.006**, [increased] 0.049*, [increased]
Beta-proteobacteria IL(454) 0.049*, [increased] 0.203, [no change]
Beta-proteobacteria CEC(454) 0.028*, [increased] 0.133, [no change]
a-AUT(+AD), n = 8; Control(+AD), n = 7.b-AUT(2AD), n = 7; AUT(+AD), n = 8.MW- Mann-Whitney test.*, p,0.05;**, p,0.01;{, p,0.1 (trend).doi:10.1371/journal.pone.0024585.t008
Table 7. Association of wheat allergy (WA) with host gene expression and bacterial phylotypes in AUT-GI children.
Wheat Allergies (WA)
VariableAUT(+WA) vs. Control(+WA)a,p-valueMW, [effect in AUT(+WA)]
AUT(2WA) vs. AUT(+WA)b, p-valueMW,[effect in AUT(+WA)]
Bacteroidetes IL(RT) 0.007**, [decreased] 0.643, [no change]
Bacteroidetes CEC(RT) 0.017*, [decreased] 0.643, [no change]
Bacteroidetes IL(454) 0.017*, [decreased] 0.488, [no change]
Bacteroidetes CEC(454) 0.089{, [decreased] 0.908, [no change]
Firmicutes IL(RT) 0.174, [no change] 0.083{, [increased]
Firmicutes CEC(RT) 0.089{, [increased] 0.008**, [increased]
Firm./Bacteroid. Ratio IL(RT) 0.011*, [increased] 0.203, [no change]
Firm./Bacteroid. Ratio CEC(RT) 0.011*, [increased] 0.049*, [increased]
Beta-proteobacteria IL(454) 0.089{, [increased] 0.643, [no change]
Beta-proteobacteria CEC(454) 0.042*, [increased] 0.418, [no change]
a-AUT(+WA), n = 8; Control(+WA), n = 4.b-AUT(2WA), n = 7; AUT(+WA), n = 8.MW- Mann-Whitney test.*, p,0.05;**, p,0.01;{, p,0.1 (trend).doi:10.1371/journal.pone.0024585.t007
Intestinal Gene Expression and Dysbiosis in Autism
PLoS ONE | www.plosone.org 14 September 2011 | Volume 6 | Issue 9 | e24585

Figure 7. A model for GI disease in children with autism. A) Schematic representation of enterocyte-mediated digestion of disaccharides andtransport of monosaccharides in the small intestine. Disaccharidases (SI, MGAM, and LCT) in the enterocyte brush border break down disaccharidesinto their component monosaccharides. The monosaccharides, glucose and galactose, are transported from the small intestinal lumen intoenterocytes by the sodium-dependent transporter SGLT1. On the basolateral enterocyte membrane, GLUT2, transports glucose, galactose, andfructose out of enterocytes and into the circulation. The expression levels of disaccharidases and hexose transporters may be controlled, in part, by
Intestinal Gene Expression and Dysbiosis in Autism
PLoS ONE | www.plosone.org 15 September 2011 | Volume 6 | Issue 9 | e24585

symptoms [47]. Unfortunately, dietary diaries for the period
immediately preceding biopsy were not available for the children
evaluated in our study; hence, the extent to which dietary intake
affected intestinal gene expression could not be determined.
Hormonal and growth factor regulation of some disaccharidases
and hexose transporters have been reported in in vitro studies and
in animals [53,54]. Inflammatory cytokines can regulate SI gene
expression in human intestinal epithelial cells in vitro [55]. Thus,
immunological or hormonal imbalances reported in ASD children
[5,8,9,10,11,12,56,57,58] may also contribute to expression deficits.
Additionally, intestinal microbes can influence the expression of
disaccharidases and transporters [59] through the influence of
pathogen-associated molecular patterns (PAMPs) and butyrate (a
byproduct of bacterial fermentation) on CDX2 expression and
activity [60,61,62,63]. In this regard, the observation that CDX2
was decreased in AUT-GI children with increased levels of
Betaproteobacteria may be important.
Whatever the underlying mechanisms, reduced capacity for
digestion and transport of carbohydrates can have profound effects.
Within the intestine, malabsorbed carbohydrates can lead to
osmotic diarrhea [64]; non-absorbed sugars may also serve as
substrates for intestinal microflora that produce fatty acids and gases
(methane, hydrogen, and carbon dioxide), promoting additional GI
symptoms such as bloating and flatulence [65]. The deficiency of
even a single gene in this important pathway can result in severe GI
disease, as occurs with glucose-galactose malabsorption syndrome
caused by SGLT1 deficiency, Fanconi-Bickel syndrome resulting
from GLUT2 mutations, sucrase-isomaltase deficiency, and con-
genital lactase deficiency [40,41].
Changes in the type and quantity of dietary carbohydrates can
influence composition and function of intestinal microflora
[66,67,68]; thus, we reasoned that carbohydrate maldigestion
and malabsorption, resulting from deficient expression of disac-
charidases and hexose transporters, might have similar effects in
AUT-GI subjects. Pyrosequencing analysis of mucoepithelial
bacteria revealed significant multicomponent dysbiosis in AUT-
GI children, including decreased levels of Bacteroidetes, an
increase in the Firmicute/Bacteroidete ratio, increased cumulative
levels of Firmicutes and Proteobacteria, and increased levels of
bacteria in the class Betaproteobacteria.
A recent pyrosequencing study reported an increase in
Bacteroidetes in fecal samples of ASD subjects [69]. Although
these findings may appear to be incongruent with those reported
here, our data were obtained using biopsies rather than free fecal
material. Others have reported differences in the composition of
fecal versus mucosal microflora [35,70,71,72]. Only about 50% of
cells in feces are viable, with dead and injured cells making up the
remaining fractions [73]. The loss of Bacteroidetes from the
mucoepithelium as a result of death, injury, or competition for
binding in the mucosal space can result in increased wash out of
Bacteroidete cells into the fecal stream. Thus, higher levels of
Bacteroidetes in feces could be indicative of an inability to thrive in
the mucosal microbiome rather than an indication that Bacter-
oidetes are found at higher levels in the microbiome.
The trend toward increased Firmicutes was largely attributable
to Clostridia with Ruminococcaceae and Lachnospiraceae as major
contributors. Several Ruminococcaceae and Lachnospiraceae are known
butyrate producers and may thus influence short-chain fatty acid
(SCFA) levels [74]. SCFA influence colonic pH, and some
Bacteroides sp. are sensitive to acidic pH [75]. Three previous
reports indicated differences in Clostridia species in children with
ASD, including greater abundance of Clostridium clusters I, II, XI
and C. bolteae [14,15,16]. Stratification of AUT-GI children based
on the timing of GI symptom development relative to autism onset
revealed that the levels of Clostridiales and cumulative levels of
Lachnospiraceae and Ruminococcaceae were significantly higher in
AUT-GI children for whom GI symptoms developed before or at
the same time as the onset of autism symptoms compared to AUT-
GI children for whom GI symptoms developed after the onset of
autism and compared to Control-GI children. However, we
cannot discern whether changes in Clostridiales occurred before
the onset of autism in this subgroup. We can only conclude that
increased levels of Clostridiales members in biopsies taken after the
development of both GI symptoms and autism are associated with
the timing of GI onset relative to autism onset in this cohort.
Although the reason for this association remains unclear, this
finding may suggest that the timing of GI onset relative to autism is
an important variable to consider in the design of future
prospective studies investigating the microbiota of children with
autism.
Although we found only a trend for increased Firmicutes in
AUT-GI children, the cumulative levels of Firmicutes and
Proteobacteria were significantly higher. These results suggest that,
in some patients, a decrease in Bacteroidetes is associated with an
increase in Firmicutes, whereas, in others, increases in Proteobac-
teria are associated with a reduced abundance of Bacteroidetes.
Three AUT-GI patients had high levels of Alpha-, Beta-, or
Gammaproteobacteria. In addition, the AUT-GI group had
elevated levels of Betaproteobacteria compared to the Control-GI
group, primarily reflecting the presence of Alcaligenaceae. Alcaligenaceae
sequences were not detected in any tissues from Control-GI
children.
Deficient digestion and absorption of di- and monosaccharides
in the small intestine may alter the balance of growth substrates,
thus eliminating the growth advantages that Bacteroidetes enjoy in
the healthy intestine and enabling competitive growth of bacterial
phylotypes better suited for growth on undigested and unabsorbed
carbohydrates. In support of this hypothesis, multiple linear
regression models demonstrated that levels of ileal SGLT1 and SI
mRNA were associated with levels of Bacteroidetes in ileum and
cecum, or cecum alone, respectively. Levels of ileal SI, MGAM,
and GLUT2 mRNA were associated with levels of cecal
Firmicutes, although the magnitude of the effects of MGAM
and GLUT2 differed between AUT-GI and Control-GI children.
Significant associations were also observed between levels of SI
and MGAM mRNA and of Proteobacteria in ileum and cecum,
and of Betaproteobacteria in cecum. Although deficiencies in
disaccharidase and transporter expression appear to at least
partially contribute to these alterations in the AUT-GI microbiota,
diagnostic status remained a significant predictor of Bacteroidete
and cecal Firmicute abundance even after adjusting for gene
expression.
Metabolic interactions between intestinal microflora and their
hosts are only beginning to be understood. Nonetheless, there is
already abundant evidence that microflora can have system-wide
effects [76,77,78,79,80,81,82,83] and influence immune responses,
brain development and behavior [24,25,26,84,85]. We acknowl-
edge that this is a small study comprising 22 subjects. The small
the transcription factor CDX2. B) In the normal small intestine, where expression of disaccharidases and hexose transporters are high, nearly alldisaccharides are efficiently digested and monosaccharides are absorbed from the lumen. C) In the AUT-GI intestine, where expression ofdisaccharidases and hexose transporters are deficient, mono- and disaccharides accumulate in the lumen of the ileum and cecum resulting indysbiosis, diarrhea, bloating, and flatulence.doi:10.1371/journal.pone.0024585.g007
Intestinal Gene Expression and Dysbiosis in Autism
PLoS ONE | www.plosone.org 16 September 2011 | Volume 6 | Issue 9 | e24585

sample size evaluated in this study is a limitation arising from the
difficulty in obtaining biopsies from young children undergoing
invasive endoscopic examination. This caveat notwithstanding,
our data show that at least some children with autism have a
distinct intestinal profile that is linked to deficient expression of
disaccharidases and hexose transporters, potentially promoting
maldigestion, malabsorption, and multicomponent, compositional
dysbiosis. Although the underlying cause of these changes and the
extra-intestinal effects these changes may elicit remain speculative,
the identification of specific molecular and microbial signatures
that define GI pathophysiology in AUT-GI children sets the stage
for further research aimed at defining the epidemiology, diagnosis,
and informed treatment of GI symptoms in autism.
Materials and Methods
Ethics StatementThe Institutional Review Board (IRB) at Columbia University
Medical Center reviewed and approved the use of de-identified
residual ileal and cecal samples, obtained as described in an earlier
publication [86], and waived the need for patient consent for these
analyses, as all samples were analyzed anonymously. Samples
assessed in the present study were restricted to those derived from
male children from the original cohort between 3 and 5 years of age
to control for confounding effects of gender and age on intestinal
gene expression and the microbiota. This subset comprised 15 AUT-
GI (patients #1-15) and 7 Control-GI (patients #16-22) patients.
Clinical ProceduresSpecific clinical procedures for defining neuropsychiatric and
regression status in this cohort have been previously described
[86]. Briefly, neuropsychiatric status was established for all subjects
using Diagnostic and Statistical Manual-Fourth Edition, Text
Revision (DSM-IV-TR) diagnostic criteria. Only cases meeting full
DSM-IV-TR criteria for Autistic Disorder (AUT) were included
for further analysis. DSM-IV-TR diagnosis of AUT was confirmed
by certified raters using the Autism Diagnostic Interview-Revised
(ADI-R). Regression status was determined based on ADI-R and
Shortened CPEA Regression Interview. Control-GI children were
evaluated in the same manner as cases to exclude subjects with any
developmental disturbances, including ASD. Age of AUT onset
was determined by an ADI-R certified interviewer. Questions
posed to parents in standardized data collection forms regarding
GI symptoms were based on previous work [27]. Symptoms were
only reported if the child had experienced the specific GI
symptoms, including food allergies, for 3 consecutive months.
History of medication use, presence of comorbid conditions, age at
first GI episode, and presence and type of food allergies were also
acquired through parental questionnaires.
RNA and DNA extractionAll biopsies were snap frozen at collection and stored at 280uC
until extraction. RNA and DNA were extracted sequentially from
individual ileal and cecal biopsies [total of 176 biopsies from 15
AUT-GI patients and 7 Control-GI patients: 8 biopsies per patient
(4 each from ileum and cecum), yielding 88 ileal and 88 cecal
biopsies] in TRIzol (Invitrogen) using standard protocols. RNA
from half of the biopsies (2 ileal and 2 cecal biopsies per AUT-GI or
Control-GI patient) was derived from residual extracts from the
original study completed in 2008 [86]. RNA from the other half of
the biopsies (the remaining 2 ileal and 2 cecal biopsies per AUT-GI
or Control-GI patient) was newly extracted from stored biopsies
(stored undisturbed at 280uC) at the inception of the current study
in 2008. The interphase and organic phase fractions were stored at
280uC, following RNA extraction, for subsequent DNA extraction.
All extractions were stored in aliquots at 280uC to avoid repeated
freeze thawing of samples. RNA and DNA concentrations, purity,
and integrity were determined for all residual extracts and newly
extracted biopsies just prior to cDNA synthesis for mRNA
expression studies and just prior to PCR of newly extracted DNA
using a Nanodrop ND-1000 Spectrophotometer (Nanodrop
Technologies) and Bioanalyzer (Agilent Technologies).
Quantitative Real-Time PCR of human mRNAIntron/exon spanning, gene-specific PCR primers and probes
(Table S6) for SI, MGAM, LCT, SGLTI, GLUT2, villin, and
CDX2, with GAPDH and b-actin as dual housekeeping gene
controls, were designed for real-time PCR using Primer Express
1.0 software (Applied Biosystems). Taqman probes were labeled
with the reporter FAM (6-carboxyfluorescein) and the quencher
BBQ (Blackberry) (TIB MolBiol). Assays were designed and
implemented as previously described [87,88,89]. For more details,
see Text S2. Levels of mRNA expression for each gene and in
each AUT-GI individual were considered significantly increased
or decreased if they were above the 75th percentile or below the
25th percentile, respectively, of gene expression obtained for all
Control-GI children and were at least two-fold increased or
decreased from the Control-GI mean (Figure 2A and Table S3).
Lactase genotypingGenomic DNA from AUT-GI and Control-GI patients was
subjected to previously-described, PCR-restriction fragment length
polymorphism (PCR-RFLP) analysis for the C/T-13910 and G/
A-22018 polymorphisms associated with adult-type hypolactasia
with minor modifications [90]. For details, see Text S1, Text S2,
and Figure S1.
Barcoded pyrosequencing of intestinal microbiotaPCR was carried out using bacterial 16S rRNA gene-specific
(V2-region), barcoded primers as previously described [91].
Barcoded 16S rRNA genes were amplified from DNA samples
from the 88 ileal biopsies and 88 cecal biopsies. Amplicons were
sequenced at 454 Life Sciences on a GS FLX sequencer. For
primer sequences and detailed methods, see Text S2.
Quantitative Real-time PCR of Bacteroidete and Firmicute16S rRNA genes
Primer sequences and PCR conditions used for bacterial real-
time PCR assays to quantify Bacteroidetes, Firmicutes, and total
Bacterial 16S rRNA genes have been previously described [92,93],
and details are outlined in the Text S2; primer sequences are
listed in Table S6. Copy numbers of Bacteroidetes, Firmicutes, or
Firmicute to Bacteroidete ratios that were above the 75th
percentile or below the 25th percentile of Control-GI children
were scored as an increase or decrease, respectively (Figure 2B,C). Percent changes in bacterial parameters for individuals in the
AUT-GI group were determined based on the mean levels in
Control-GI children (Table S4).
Bioinformatic analysis of pyrosequencing readsPyrosequencing reads ranging from 235 to 300 base pairs in
length (encompassing all sequences within the major peak
obtained from pyrosequencing) were filtered for analysis. Low-
quality sequences - i.e., those with average quality scores below
25 - were removed based on previously described criteria [91,94].
Additionally, reads with any ambiguous characters were omitted
from analysis. Sequences were then binned according to barcode,
Intestinal Gene Expression and Dysbiosis in Autism
PLoS ONE | www.plosone.org 17 September 2011 | Volume 6 | Issue 9 | e24585

followed by removal of primer and barcode sequences. Taxonomic
classifications of bacterial 16S rRNA sequences were obtained
using the RDP classifier tool (http://rdp.cme.msu.edu/) with a
minimum 80% bootstrap confidence estimate. To normalize data
for differences in total sequences obtained per patient, phylotype
abundance was expressed as a percentage of total bacterial
sequence reads per patient at all taxonomic levels. Taxonomy
note: the RDP classifier binned all of the limited number of
sequences obtained for the phylum Cyanobacteria into the
chloroplast-derived genus Streptophyta. Heatmaps were constructed
with MeV (Version 4.5.0), using abundance data from pyrose-
quencing reads. Heatmap scales were made linear where possible,
with the upper limit reflecting the highest abundance recorded for
any taxa in a given heatmap (red), the lower limit reflecting
sequences above 0% abundance (green), and the midpoint limit
(white) set to the true midpoint between 0% and the upper limit.
In some instances, the midpoint limit was adjusted to highlight
salient differences between the AUT-GI and Control-GI groups.
Gray cells in all heatmaps reflect the complete absence of
sequences detected for a given taxa in a given patient.
Operational Taxonomic Unit (OTU)-based analysis was carried
out in MOTHUR (version 1.8.0) [95]. Filtered sequences
generated from 454 pyrosequencing were aligned to the green-
genes reference alignment (greengenes.lbl.gov), using the Needle-
man-Wunsch algorithm with the ‘‘align.seqs’’ function (ksize = 9).
Pairwise genetic distances among the aligned sequences were
calculated using the ‘‘dist.seqs’’ function (calc = onegap, coun-
tends = T). Sequences were assigned to OTUs (97% identity) using
nearest neighbor clustering. Rarefaction curves to assess coverage
and diversity (Shannon Diversity Index) were constructed in
MOTHUR. For OTU analysis of Bacteroidete sequences, phylum
level classification in RDP was used to subselect all Bacteroidete
sequences, followed by OTU assignment at 97% identity. Repre-
sentative sequences (defined as the sequence with the minimum
distance to all other sequences in the OTU) from each OTU were
obtained using the get.oturep command in MOTHUR. Represen-
tative sequences were classified using the nearest species match from
Greengenes Blast (greengenes.lbl.gov) and NCBI BLAST align-
ment. OTU abundance by patient was expressed as percent relative
abundance, determined by dividing the number of reads for an
OTU in a given patient sample by the total number of bacterial
reads obtained through pyrosequencing for that sample.
Statistical analysisMost of our data were not normally distributed, based on
Kolmogorov-Smirnov test and evaluation of skewness and
kurtosis; thus, the non-parametric Mann-Whitney U test was
performed to evaluate differences between groups using StatView
(Windows version 5.0.1; SAS Institute). The comparative results of
gene expression and bacteria 16S rRNA gene levels were
visualized as box-and-whisker plots showing: the median and the
interquartile (midspread) range (boxes containing 50% of all
values), the whiskers (representing the 25th and 75th percentiles),
and the extreme data points (open circles). Chi-square test was
used to evaluate between-group genotypes for adult-type hypo-
lactasia, as well as differences in the frequency of atopic disease
between groups. Kruskal-Wallis one-way analysis of variance was
employed to assess significance of LCT mRNA expression levels
split by genotype and group. To evaluate the effects of CDX2
and/or villin on enzyme and transporter levels and the effects of
levels of enzymes and transporters on bacterial levels, multiple
linear regression analyses were conducted. For details on multiple
linear regression analyses see Table 3, Table 4, and Text S2.
Significance was accepted for all analyses at p,0.05.
Supporting Information
Figure S1 Lactase genotyping. (A) Distribution of genotypes
for LCT-13910 and LCT-22018 polymorphisms between AUT-GI
and Control-GI patients (chi-square test, p = 0.896). (B) Distribution
of LCT mRNA expression in all individuals (AUT-GI and Control-
GI) with the homozygous adult-type hypolactasia genotype (13910-
C/C; 22018-G/G) compared to all individuals (AUT-GI and
Control-GI) possessing at least one copy of the normal allele
(heterozygous: 13910-C/T; 22018-G/A and homozygous: 13910-
T/T; 22018-A/A); Mann-Whitney, p = 0.033. (C) Distribution of
LCT mRNA expression levels split by genotype and group (AUT-
GI and Control-GI); Kruskal-Wallis, p = 0.097. (D) Distribution of
LCT mRNA expression for all patients possessing at least one copy
of the normal (lactase persistence) allele for AUT-GI (n = 12) and
Control-GI (n = 6); Mann-Whitney, p = 0.0246. Adult-type hypo-
lactasia genotype is highlighted in red. *, p,0.05.
(TIF)
Figure S2 Villin normalization and CDX2 expressionstratified by total disaccharidase and transporter defi-ciencies. Disaccharidase or transporter mRNA/villin mRNA
ratios for SI (A; Mann-Whitney, p = 0.001), MGAM (B; Mann-
Whitney, p = 0.001), LCT (C; Mann-Whitney, p = 0.005), SGLT1
(D; Mann-Whitney, p = 0.0008), and GLUT2 (E; Mann-Whitney,
p = 0.002). (F) CDX2 mRNA expression in AUT-GI children
stratified by number of total disaccharidase and transporter
deficiencies [All 5 deficient (n = 10) or fewer than 5 deficient
(n = 5)] compared to all Control-GI children (n = 7). AUT (All 5) vs.
AUT (,5); Mann-Whitney, p = 0.037. AUT (All 5) vs. Control;
Mann-Whitney, p = 0.064. *, p,0.05; **, p,0.01; ***, p,0.001;
{, p,0.1 (trend).
(TIF)
Figure S3 Diversity of AUT-GI and Control-GI phylo-types. (A–B) Rarefaction curves assessing the completeness of
sampling from pyrosequencing data obtained for individual AUT-
GI (red) and Control-GI (blue) subjects’ ileal (A) and cecal (B)
biopsies. The y-axis indicates the number of OTUs detected
(defined at 97% threshold for sequence similarity); the x-axis
indicates the number of sequences sampled. (C–D) Rarefaction
curves to estimate phylotype diversity, using the Shannon Diversity
Index, from pyrosequencing data obtained for individual AUT-GI
(red) and Control-GI (blue) subjects’ ileal (C) and cecal (D) biopsies.
(TIF)
Figure S4 OTU analysis of Bacteroidete phylotypes. (A–B) Abundance distributions of the 12 most abundant Bacteroidete
OTUs in ileal (A) and cecal (B) biopsies from AUT-GI and
Control-GI children (bottom row displays cumulative levels of all
12 OTUs by patient). (C–D) Cumulative abundance of the 12
OTUs in ilea (C; Mann-Whitney, p = 0.008) and ceca (D; Mann-
Whitney, p = 0.008) of AUT-GI and Control-GI children. (E)
Classification of representative sequences obtained from each
Bacteroidete OTU. Color code denotes the family-level, Ribo-
somal Database-derived taxonomic classification of each repre-
sentative OTU sequence. **, p,0.01.
(TIF)
Figure S5 Clostridiales/Bacteroidales ratios and abun-dance of Firmicutes assayed by pyrosequencing andreal-time PCR. (A–B) Order-level distribution of the Clostri-
diales/Bacteroidales ratio from pyrosequencing reads obtained
from ileal (A; Mann-Whitney, p = 0.012) and cecal (B; Mann-
Whitney, p = 0.032) biopsies from AUT-GI and Control-GI
patients. (C–D) Phyla-level abundance of Firmicutes in the ilea
(C; Mann-Whitney, p = 0.098) and ceca (D; Mann-Whitney,
Intestinal Gene Expression and Dysbiosis in Autism
PLoS ONE | www.plosone.org 18 September 2011 | Volume 6 | Issue 9 | e24585

p = 0.148) of AUT-GI and Control-GI children obtained by
pyrosequencing. (E–F) Phyla-level abundance of Firmicutes in the
ilea (E; Mann-Whitney, p = 0.245) and ceca (F; Mann-Whitney,
p = 0.053) of AUT-GI and Control-GI children obtained by real-
time PCR. Copy number values for Firmicutes are normalized
relative to total bacteria copy numbers. (G–H) Abundance of
Clostridiales from ileal (G; Mann-Whitney, p = 0.072) and cecal (H;
Mann-Whitney, p = 0.098) biopsies from AUT-GI and Control-GI
patients obtained by pyrosequencing. *, p,0.05; {, p,0.1 (trend);
n.s., not significant.
(TIF)
Figure S6 Percent difference in abundance of Bacter-oidetes, Firmicutes, and Proteobacteria in individualAUT-GI patients. (A–B) Bar graphs indicating the percent
difference in phylotype abundance for Bacteroidetes, Firmicutes,
and Proteobacteria in AUT-GI patients (#1-15) relative to the
Control-GI mean abundance for each of the three phylotypes
obtained by pyrosequencing of ileal (A) and cecal (B) biopsies.
(TIF)
Figure S7 Genus-level distribution of members of thefamilies Ruminococcaceae and Lachnospiraceae. (A–B)
Heatmap representation of abundance distributions (by patient) of
Ruminococcaceae and Lachnospiraceae genus members in ileal (A) and
cecal (B) biopsies from AUT-GI and Control-GI patients. *, genus
members contributing to the trend toward increased Firmicutes in
AUT-GI children.
(TIF)
Figure S8 Increased Betaproteobacteria in AUT-GIchildren is associated with total deficiencies in disac-charidases and hexose transporters and CDX2 mRNAexpression. (A–B) Abundance of Betaproteobacteria in AUT-GI
children with deficiency in all 5 disaccharidases and transporters
(All 5; n = 10), AUT-GI children with deficiency in fewer than 5
disaccharidases and transporters (,5; n = 5), and Control-GI
children (n = 7) in ileum (A) and cecum (B). (A) Ileum: AUT-GI
(All 5) vs. AUT-GI (,5), Mann-Whitney, p = 0.028; AUT-GI (All
5) vs. Control-GI, Mann-Whitney, p = 0.015; AUT-GI (,5) vs.
Control-GI, Mann-Whitney, p = 0.935. (B) Cecum: AUT-GI (All
5) vs. AUT-GI (,5), Mann-Whitney, p = 0.014; AUT-GI (All 5)
vs. Control-GI, Mann-Whitney, p = 0.006; AUT-GI (,5) vs.
Control-GI, Mann-Whitney, p = 0.808. (C–D) Ileal CDX2
mRNA expression in AUT-GI children with Betaproteobacteria
above the 75th percentile of Control-GI children [AUT (+) b-
proteo.], AUT-GI children with Betaproteobacteria levels below
the 75th percentile of Control-GI children [AUT (2) b-proteo.],
and Control-GI children in ileum (C) and cecum (D). (C) Ileum:
AUT (+) b-proteo. (n = 8) vs. AUT (2) b-proteo. (n = 7), Mann-
Whitney, p = 0.037; AUT (+) b-proteo. vs. Control-GI (n = 7),
Mann-Whitney, p = 0.064; AUT (2) b-proteo. vs. Control-GI,
Mann-Whitney, p = 0.749. (D) Cecum: AUT (+) b-proteo. (n = 10)
vs. AUT (2) b-proteo. (n = 5), Mann-Whitney, p = 0.028; AUT (+)
b-proteo. vs. Control-GI (n = 7), Mann-Whitney, p = 0.097; AUT
(2) b-proteo. vs. Control-GI, Mann-Whitney, p = 0.808.
*, p,0.05; **, p,0.01; {, p,0.1 (trend); n.s., not significant.
(TIF)
Table S1 Reported comorbid conditions, food allergies,and medication use by patient.(DOC)
Table S2 Reported behavioral regression in AUT-GIchildren. Legend: ADI-R, Autism Diagnostic Interview-Revised;
CDI, MacArthur Communicative Development Inventory; CPEA,
Collaborative Program for Excellence in Autism.
(TIF)
Table S3 Fold-change in gene expression in AUT-GIchildren. Legend: Fold-change values were calculated relative to
the mean expression level obtained for all Control-GI children for
each gene. Expression levels for individual patients that were at
least two-fold increased (.2) or decreased (,0.5) relative to the
Control-GI mean are highlighted in red and green, respectively.
(TIF)
Table S4 Percent change in bacterial levels in AUT-GIchildren. Legend: Percent change values were calculated for
real-time PCR and ratio data relative to the mean levels obtained
for all Control-GI children for each bacterial variable. Percent
difference values were calculated for pyrosequencing data by
subtracting the mean percent abundance of Control-GI children
from the percent abundance of each AUT-GI patient for each
variable.
(TIF)
Table S5 Evaluation of confounding effects attributed tothe use of (A) probiotics, (B) proton-pump inhibitors,and (C) antibiotics.(DOC)
Table S6 Real-time PCR primers and probes used forgene expression and bacterial quantitative analysis.(TIF)
Text S1 Supporting Results.(DOC)
Text S2 Supporting Methods.(DOC)
Acknowledgments
We thank Jonathan Eisen and Sean Conlan for discussions, comments, and
review of the manuscript; Diane McFadden for review of the manuscript;
Stephen K. Hutchison, Michael Egholm, and Birgitte Simen for
pyrosequencing support at 454 Life Sciences; Craig Street and Komal
Jain for data management; and Gergana Nestor for technical support.
Author Contributions
Conceived and designed the experiments: BLW MH TB MLB WIL.
Performed the experiments: BLW DLH AB. Analyzed the data: BLW MH
MCP IW OJ. Wrote the paper: BLW MH WIL. Created Figures and
Tables: BLW. Supervised research: WIL.
References
1. Buie T, Campbell DB, Fuchs GJ, 3rd, Furuta GT, Levy J, et al. (2010)
Evaluation, diagnosis, and treatment of gastrointestinal disorders in individuals
with ASDs: a consensus report. Pediatrics 125 Suppl 1: S1–18.
2. White JF (2003) Intestinal pathophysiology in autism. Exp Biol Med (Maywood)
228: 639–649.
3. Wakefield AJ, Anthony A, Murch SH, Thomson M, Montgomery SM, et al.
(2000) Enterocolitis in children with developmental disorders. Am J Gastroenterol
95: 2285–2295.
4. Wakefield AJ, Ashwood P, Limb K, Anthony A (2005) The significance of ileo-
colonic lymphoid nodular hyperplasia in children with autistic spectrum
disorder. Eur J Gastroenterol Hepatol 17: 827–836.
5. Furlano RI, Anthony A, Day R, Brown A, McGarvey L, et al. (2001) Colonic
CD8 and gamma delta T-cell infiltration with epithelial damage in children with
autism. J Pediatr 138: 366–372.
6. Torrente F, Ashwood P, Day R, Machado N, Furlano RI, et al. (2002)
Small intestinal enteropathy with epithelial IgG and complement depo-
Intestinal Gene Expression and Dysbiosis in Autism
PLoS ONE | www.plosone.org 19 September 2011 | Volume 6 | Issue 9 | e24585

sition in children with regressive autism. Mol Psychiatry 7: 375–382,
334.
7. Horvath K, Papadimitriou JC, Rabsztyn A, Drachenberg C, Tildon JT (1999)
Gastrointestinal abnormalities in children with autistic disorder. J Pediatr 135:
559–563.
8. Ashwood P, Wills S, Van de Water J (2006) The immune response in autism: a
new frontier for autism research. J Leukoc Biol 80: 1–15.
9. Ashwood P, Anthony A, Torrente F, Wakefield AJ (2004) Spontaneous mucosal
lymphocyte cytokine profiles in children with autism and gastrointestinalsymptoms: mucosal immune activation and reduced counter regulatory
interleukin-10. J Clin Immunol 24: 664–673.
10. Ashwood P, Anthony A, Pellicer AA, Torrente F, Walker-Smith JA, et al. (2003)
Intestinal lymphocyte populations in children with regressive autism: evidence
for extensive mucosal immunopathology. J Clin Immunol 23: 504–517.
11. Enstrom AM, Onore CE, Van de Water JA, Ashwood P (2010) Differential
monocyte responses to TLR ligands in children with autism spectrum disorders.
Brain Behav Immun 24: 64–71.
12. Jyonouchi H, Geng L, Ruby A, Zimmerman-Bier B (2005) Dysregulated innate
immune responses in young children with autism spectrum disorders: their
relationship to gastrointestinal symptoms and dietary intervention. Neuropsy-
chobiology 51: 77–85.
13. D’Eufemia P, Celli M, Finocchiaro R, Pacifico L, Viozzi L, et al. (1996)
Abnormal intestinal permeability in children with autism. Acta Paediatr 85:
1076–1079.
14. Finegold SM, Molitoris D, Song Y, Liu C, Vaisanen ML, et al. (2002)
Gastrointestinal microflora studies in late-onset autism. Clin Infect Dis 35:
S6–S16.
15. Song Y, Liu C, Finegold SM (2004) Real-time PCR quantitation of clostridia in
feces of autistic children. Appl Environ Microbiol 70: 6459–6465.
16. Parracho HM, Bingham MO, Gibson GR, McCartney AL (2005) Differences
between the gut microflora of children with autistic spectrum disorders and thatof healthy children. J Med Microbiol 54: 987–991.
17. Knivsberg AM, Reichelt KL, Hoien T, Nodland M (2002) A randomised,
controlled study of dietary intervention in autistic syndromes. Nutr Neurosci 5:
251–261.
18. Sandler RH, Finegold SM, Bolte ER, Buchanan CP, Maxwell AP, et al. (2000)
Short-term benefit from oral vancomycin treatment of regressive-onset autism.
J Child Neurol 15: 429–435.
19. Adams JB, Johansen LJ, Powell LD, Quig D, Rubin RA (2011) Gastrointestinal
flora and gastrointestinal status in children with autism–comparisons to typical
children and correlation with autism severity. BMC Gastroenterol 11: 22.
20. Sonnenburg ED, Sonnenburg JL, Manchester JK, Hansen EE, Chiang HC,
et al. (2006) A hybrid two-component system protein of a prominent human gut
symbiont couples glycan sensing in vivo to carbohydrate metabolism. Proc Natl
Acad Sci U S A 103: 8834–8839.
21. Flint HJ, Bayer EA, Rincon MT, Lamed R, White BA (2008) Polysaccharide
utilization by gut bacteria: potential for new insights from genomic analysis. Nat
Rev Microbiol 6: 121–131.
22. Wong JM, Jenkins DJ (2007) Carbohydrate digestibility and metabolic effects.
J Nutr 137: 2539S–2546S.
23. Jacobs DM, Gaudier E, van Duynhoven J, Vaughan EE (2009) Non-digestible
food ingredients, colonic microbiota and the impact on gut health and
immunity: a role for metabolomics. Curr Drug Metab 10: 41–54.
24. O’Hara AM, Shanahan F (2006) The gut flora as a forgotten organ. EMBO Rep
7: 688–693.
25. Macpherson AJ, Harris NL (2004) Interactions between commensal intestinal
bacteria and the immune system. Nat Rev Immunol 4: 478–485.
26. Heijtz RD, Wang S, Anuar F, Qian Y, Bjorkholm B, et al. (2011) Normal gut
microbiota modulates brain development and behavior. Proc Natl Acad Sci U S A
108: 3047–3052.
27. Richler J, Luyster R, Risi S, Hsu WL, Dawson G, et al. (2006) Is there a
‘regressive phenotype’ of Autism Spectrum Disorder associated with the measles-
mumps-rubella vaccine? A CPEA Study. J Autism Dev Disord 36: 299–316.
28. Kellett GL, Brot-Laroche E, Mace OJ, Leturque A (2008) Sugar absorption in
the intestine: the role of GLUT2. Annu Rev Nutr 28: 35–54.
29. Khurana S, George SP (2008) Regulation of cell structure and function by actin-
binding proteins: villin’s perspective. FEBS Lett 582: 2128–2139.
30. Arijs I, De Hertogh G, Lemaire K, Quintens R, Van Lommel L, et al. (2009)
Mucosal gene expression of antimicrobial peptides in inflammatory bowel
disease before and after first infliximab treatment. PLoS One 4: e7984.
31. Suh E, Traber PG (1996) An intestine-specific homeobox gene regulates
proliferation and differentiation. Mol Cell Biol 16: 619–625.
32. Troelsen JT, Mitchelmore C, Spodsberg N, Jensen AM, Noren O, et al. (1997)
Regulation of lactase-phlorizin hydrolase gene expression by the caudal-related
homoeodomain protein Cdx-2. Biochem J 322 (Pt 3): 833–838.
33. Uesaka T, Kageyama N, Watanabe H (2004) Identifying target genes regulated
downstream of Cdx2 by microarray analysis. J Mol Biol 337: 647–660.
34. Balakrishnan A, Stearns AT, Rhoads DB, Ashley SW, Tavakkolizadeh A (2008)
Defining the transcriptional regulation of the intestinal sodium-glucose
cotransporter using RNA-interference mediated gene silencing. Surgery 144:
168–173.
35. Zoetendal EG, von Wright A, Vilpponen-Salmela T, Ben-Amor K,
Akkermans AD, et al. (2002) Mucosa-associated bacteria in the human
gastrointestinal tract are uniformly distributed along the colon and differ from
the community recovered from feces. Appl Environ Microbiol 68: 3401–3407.
36. Rauch M, Lynch SV (2010) Probiotic manipulation of the gastrointestinal
microbiota. Gut Microbes 1: 335–338.
37. Vesper BJ, Jawdi A, Altman KW, Haines GK, 3rd, Tao L, et al. (2009) The
effect of proton pump inhibitors on the human microbiota. Curr Drug Metab
10: 84–89.
38. Dethlefsen L, Huse S, Sogin ML, Relman DA (2008) The pervasive effects of an
antibiotic on the human gut microbiota, as revealed by deep 16S rRNA
sequencing. PLoS Biol 6: e280.
39. Gurney JG, McPheeters ML, Davis MM (2006) Parental report of health
conditions and health care use among children with and without autism:
National Survey of Children’s Health. Arch Pediatr Adolesc Med 160: 825–830.
40. Scheepers A, Joost HG, Schurmann A (2004) The glucose transporter families
SGLT and GLUT: molecular basis of normal and aberrant function.
JPEN J Parenter Enteral Nutr 28: 364–371.
41. Swallow DM (2003) Genetic influences on carbohydrate digestion. Nutr Res Rev
16: 37–43.
42. Hodin RA, Chamberlain SM, Meng S (1995) Pattern of rat intestinal brush-
border enzyme gene expression changes with epithelial growth state. Am J Physiol
269: C385–391.
43. Kishi K, Tanaka T, Igawa M, Takase S, Goda T (1999) Sucrase-isomaltase and
hexose transporter gene expressions are coordinately enhanced by dietary
fructose in rat jejunum. J Nutr 129: 953–956.
44. Tanaka T, Suzuki A, Kuranuki S, Mochizuki K, Suruga K, et al. (2008) Higher
expression of jejunal LPH gene in rats fed the high-carbohydrate/low-fat diet
compared with those fed the low-carbohydrate/high-fat diet is associated with in
vitro binding of Cdx-2 in nuclear proteins to its promoter regions. Life Sci 83:
122–127.
45. Mochizuki K, Honma K, Shimada M, Goda T (2010) The regulation of jejunal
induction of the maltase-glucoamylase gene by a high-starch/low-fat diet in
mice. Mol Nutr Food Res 54: 1445–1451.
46. Bandini LG, Anderson SE, Curtin C, Cermak S, Evans EW, et al. (2010) Food
selectivity in children with autism spectrum disorders and typically developing
children. J Pediatr 157: 259–264.
47. Levy SE, Souders MC, Ittenbach RF, Giarelli E, Mulberg AE, et al. (2007)
Relationship of dietary intake to gastrointestinal symptoms in children with
autistic spectrum disorders. Biol Psychiatry 61: 492–497.
48. Herndon AC, DiGuiseppi C, Johnson SL, Leiferman J, Reynolds A (2009) Does
nutritional intake differ between children with autism spectrum disorders and
children with typical development? J Autism Dev Disord 39: 212–222.
49. Emond A, Emmett P, Steer C, Golding J (2010) Feeding symptoms, dietary
patterns, and growth in young children with autism spectrum disorders.
Pediatrics 126: e337–342.
50. Shearer TR, Larson K, Neuschwander J, Gedney B (1982) Minerals in the hair
and nutrient intake of autistic children. J Autism Dev Disord 12: 25–34.
51. Raiten DJ, Massaro T (1986) Perspectives on the nutritional ecology of autistic
children. J Autism Dev Disord 16: 133–143.
52. Schreck KA, Williams K, Smith AF (2004) A comparison of eating behaviors
between children with and without autism. J Autism Dev Disord 34: 433–438.
53. Matosin-Matekalo M, Mesonero JE, Delezay O, Poiree JC, Ilundain AA, et al.
(1998) Thyroid hormone regulation of the Na+/glucose cotransporter SGLT1 in
Caco-2 cells. Biochem J 334 ( Pt 3): 633–640.
54. Emvo EN, Raul F, Koch B, Neuville P, Foltzer-Jourdainne C (1996) Sucrase-
isomaltase gene expression in suckling rat intestine: hormonal, dietary, and
growth factor control. J Pediatr Gastroenterol Nutr 23: 262–269.
55. Ziambaras T, Rubin DC, Perlmutter DH (1996) Regulation of sucrase-
isomaltase gene expression in human intestinal epithelial cells by inflammatory
cytokines. J Biol Chem 271: 1237–1242.
56. Suzuki K, Hashimoto K, Iwata Y, Nakamura K, Tsujii M, et al. (2007)
Decreased serum levels of epidermal growth factor in adult subjects with high-
functioning autism. Biol Psychiatry 62: 267–269.
57. Iseri E, Guney E, Ceylan MF, Yucel A, Aral A, et al. (2010) Increased Serum
Levels of Epidermal Growth Factor in Children with Autism. J Autism Dev
Disord.
58. Curin JM, Terzic J, Petkovic ZB, Zekan L, Terzic IM, et al. (2003) Lower
cortisol and higher ACTH levels in individuals with autism. J Autism Dev Disord
33: 443–448.
59. Hooper LV, Wong MH, Thelin A, Hansson L, Falk PG, et al. (2001) Molecular
analysis of commensal host-microbial relationships in the intestine. Science 291:
881–884.
60. Barros R, Marcos N, Reis CA, De Luca A, David L, et al. (2009) CDX2
expression is induced by Helicobacter pylori in AGS cells. Scand J Gastroenterol
44: 124–125.
61. Ikeda H, Sasaki M, Ishikawa A, Sato Y, Harada K, et al. (2007) Interaction of
Toll-like receptors with bacterial components induces expression of CDX2 and
MUC2 in rat biliary epithelium in vivo and in culture. Lab Invest 87: 559–571.
62. Nguyen HT, Dalmasso G, Powell KR, Yan Y, Bhatt S, et al. (2009) Pathogenic
bacteria induce colonic PepT1 expression: an implication in host defense
response. Gastroenterology 137: 1435–1447 e1431–1432.
63. Dalmasso G, Nguyen HT, Yan Y, Charrier-Hisamuddin L, Sitaraman SV, et al.
(2008) Butyrate transcriptionally enhances peptide transporter PepT1 expression
and activity. PLoS One 3: e2476.
Intestinal Gene Expression and Dysbiosis in Autism
PLoS ONE | www.plosone.org 20 September 2011 | Volume 6 | Issue 9 | e24585

64. Hammer HF, Santa Ana CA, Schiller LR, Fordtran JS (1989) Studies of osmotic
diarrhea induced in normal subjects by ingestion of polyethylene glycol andlactulose. J Clin Invest 84: 1056–1062.
65. Robayo-Torres CC, Quezada-Calvillo R, Nichols BL (2006) Disaccharide
digestion: clinical and molecular aspects. Clin Gastroenterol Hepatol 4:276–287.
66. Flint HJ, Duncan SH, Scott KP, Louis P (2007) Interactions and competitionwithin the microbial community of the human colon: links between diet and
health. Environ Microbiol 9: 1101–1111.
67. O’Keefe SJ (2008) Nutrition and colonic health: the critical role of themicrobiota. Curr Opin Gastroenterol 24: 51–58.
68. Sonnenburg ED, Zheng H, Joglekar P, Higginbottom SK, Firbank SJ, et al.(2010) Specificity of polysaccharide use in intestinal bacteroides species
determines diet-induced microbiota alterations. Cell 141: 1241–1252.69. Finegold SM, Dowd SE, Gontcharova V, Liu C, Henley KE, et al. (2010)
Pyrosequencing study of fecal microflora of autistic and control children.
Anaerobe 16: 444–453.70. Gillevet P, Sikaroodi M, Keshavarzian A, Mutlu EA (2010) Quantitative
assessment of the human gut microbiome using multitag pyrosequencing. ChemBiodivers 7: 1065–1075.
71. Marteau P, Pochart P, Dore J, Bera-Maillet C, Bernalier A, et al. (2001)
Comparative study of bacterial groups within the human cecal and fecalmicrobiota. Appl Environ Microbiol 67: 4939–4942.
72. Momozawa Y, Deffontaine V, Louis E, Medrano JF (2011) Characterization ofBacteria in Biopsies of Colon and Stools by High Throughput Sequencing of the
V2 Region of Bacterial 16S rRNA Gene in Human. PLoS One 6: e16952.73. Ben-Amor K, Heilig H, Smidt H, Vaughan EE, Abee T, et al. (2005) Genetic
diversity of viable, injured, and dead fecal bacteria assessed by fluorescence-
activated cell sorting and 16S rRNA gene analysis. Appl Environ Microbiol 71:4679–4689.
74. Louis P, Young P, Holtrop G, Flint HJ (2010) Diversity of human colonicbutyrate-producing bacteria revealed by analysis of the butyryl-CoA:acetate
CoA-transferase gene. Environ Microbiol 12: 304–314.
75. Duncan SH, Louis P, Thomson JM, Flint HJ (2009) The role of pH indetermining the species composition of the human colonic microbiota. Environ
Microbiol 11: 2112–2122.76. Ley RE, Turnbaugh PJ, Klein S, Gordon JI (2006) Microbial ecology: human
gut microbes associated with obesity. Nature 444: 1022–1023.77. Ley RE, Backhed F, Turnbaugh P, Lozupone CA, Knight RD, et al. (2005)
Obesity alters gut microbial ecology. Proc Natl Acad Sci U S A 102:
11070–11075.78. Collins SM, Bercik P (2009) The relationship between intestinal microbiota and
the central nervous system in normal gastrointestinal function and disease.Gastroenterology 136: 2003–2014.
79. Gupta G, Gelfand JM, Lewis JD (2005) Increased risk for demyelinating diseases
in patients with inflammatory bowel disease. Gastroenterology 129: 819–826.80. Fullwood A, Drossman DA (1995) The relationship of psychiatric illness with
gastrointestinal disease. Annu Rev Med 46: 483–496.
81. Lossos A, River Y, Eliakim A, Steiner I (1995) Neurologic aspects of
inflammatory bowel disease. Neurology 45: 416–421.
82. Bushara KO (2005) Neurologic presentation of celiac disease. Gastroenterology
128: S92–97.
83. Turnbaugh PJ, Ley RE, Mahowald MA, Magrini V, Mardis ER, et al. (2006) An
obesity-associated gut microbiome with increased capacity for energy harvest.
Nature 444: 1027–1031.
84. Sudo N, Sawamura S, Tanaka K, Aiba Y, Kubo C, et al. (1997) The
requirement of intestinal bacterial flora for the development of an IgE
production system fully susceptible to oral tolerance induction. J Immunol
159: 1739–1745.
85. Sudo N, Chida Y, Aiba Y, Sonoda J, Oyama N, et al. (2004) Postnatal microbial
colonization programs the hypothalamic-pituitary-adrenal system for stress
response in mice. J Physiol 558: 263–275.
86. Hornig M, Briese T, Buie T, Bauman ML, Lauwers G, et al. (2008) Lack of
association between measles virus vaccine and autism with enteropathy: a case-
control study. PLoS One 3: e3140.
87. Williams BL, Yaddanapudi K, Hornig M, Lipkin WI (2007) Spatiotemporal
analysis of purkinje cell degeneration relative to parasagittal expression domains
in a model of neonatal viral infection. J Virol 81: 2675–2687.
88. Williams BL, Yaddanapudi K, Kirk CM, Soman A, Hornig M, et al. (2006)
Metallothioneins and zinc dysregulation contribute to neurodevelopmental
damage in a model of perinatal viral infection. Brain Pathol 16: 1–14.
89. Williams BL, Lipkin WI (2006) Endoplasmic reticulum stress and neurodegen-
eration in rats neonatally infected with borna disease virus. J Virol 80:
8613–8626.
90. Buning C, Ockenga J, Kruger S, Jurga J, Baier P, et al. (2003) The C/
C(213910) and G/G(222018) genotypes for adult-type hypolactasia are not
associated with inflammatory bowel disease. Scand J Gastroenterol 38: 538–542.
91. Hamady M, Walker JJ, Harris JK, Gold NJ, Knight R (2008) Error-correcting
barcoded primers for pyrosequencing hundreds of samples in multiplex. Nat
Methods 5: 235–237.
92. Frank DN, St Amand AL, Feldman RA, Boedeker EC, Harpaz N, et al. (2007)
Molecular-phylogenetic characterization of microbial community imbalances in
human inflammatory bowel diseases. Proc Natl Acad Sci U S A 104:
13780–13785.
93. Guo X, Xia X, Tang R, Zhou J, Zhao H, et al. (2008) Development of a real-
time PCR method for Firmicutes and Bacteroidetes in faeces and its application
to quantify intestinal population of obese and lean pigs. Lett Appl Microbiol 47:
367–373.
94. Huse SM, Huber JA, Morrison HG, Sogin ML, Welch DM (2007) Accuracy and
quality of massively parallel DNA pyrosequencing. Genome Biol 8: R143.
95. Schloss PD, Westcott SL, Ryabin T, Hall JR, Hartmann M, et al. (2009)
Introducing mothur: open-source, platform-independent, community-supported
software for describing and comparing microbial communities. Appl Environ
Microbiol 75: 7537–7541.
Intestinal Gene Expression and Dysbiosis in Autism
PLoS ONE | www.plosone.org 21 September 2011 | Volume 6 | Issue 9 | e24585