Impacts of Mergers and Acquisitions on Acquirer Banks ...
27
Australasian Accounting, Business and Finance Journal Volume 11 | Issue 3 Article 4 Impacts of Mergers and Acquisitions on Acquirer Banks’ Performance Burhan Ali Shah Quaid-i-Azam University Islamabad, Pakistan, [email protected] Niaz Khan Quaid-i-Azam University Islamabad, Pakistan Follow this and additional works at: hp://ro.uow.edu.au/aab Copyright ©2017 Australasian Accounting Business and Finance Journal and Authors. Research Online is the open access institutional repository for the University of Wollongong. For further information contact the UOW Library: [email protected] Recommended Citation Shah, Burhan Ali and Khan, Niaz, Impacts of Mergers and Acquisitions on Acquirer Banks’ Performance, Australasian Accounting, Business and Finance Journal, 11(3), 2017, 30-54. doi:10.14453/aab.v11i3.4
Transcript of Impacts of Mergers and Acquisitions on Acquirer Banks ...

Australasian Accounting, Business and FinanceJournal
Volume 11 | Issue 3 Article 4
Impacts of Mergers and Acquisitions on AcquirerBanks’ PerformanceBurhan Ali ShahQuaid-i-Azam University Islamabad, Pakistan, [email protected]
Niaz KhanQuaid-i-Azam University Islamabad, Pakistan
Follow this and additional works at: http://ro.uow.edu.au/aabfjCopyright ©2017 Australasian Accounting Business and Finance Journal and Authors.
Research Online is the open access institutional repository for the University of Wollongong. For further information contact the UOW Library:[email protected]
Recommended CitationShah, Burhan Ali and Khan, Niaz, Impacts of Mergers and Acquisitions on Acquirer Banks’Performance, Australasian Accounting, Business and Finance Journal, 11(3), 2017, 30-54.doi:10.14453/aabfj.v11i3.4
Impacts of Mergers and Acquisitions on Acquirer Banks’ Performance
AbstractThis study investigates the effects of mergers and acquisitions (M & A) on the operating performance of theacquirer banks in Pakistan. For this purpose, a sample of 18 transactions, involving acquirer banks, listed onthe Karachi Stock Exchange, is used. The Financial Ratio Analysis (FRA) is used to determine the effects of M& A. The significance of change in the operating performances is tested through a paired sample t-test. Theresults indicate deterioration in the performances of the acquirer banks in the post-merger period.
KeywordsM & A, mergers and acquisitions, financial ratio analysis, ratios, profitability, liquidity, capital adequacy,performance, Pakistan
This article is available in Australasian Accounting, Business and Finance Journal: http://ro.uow.edu.au/aabfj/vol11/iss3/4

Impacts of Mergers and Acquisitions on Acquirer Banks’ Performance
Burhan Ali Shah1 and Niaz Khan2
Abstract
This study investigates the effects of mergers and acquisitions (M & A) on the operating performance of the acquirer banks in Pakistan. For this purpose, a sample of 18 transactions, involving acquirer banks, listed on the Karachi Stock Exchange, is used. The Financial Ratio Analysis (FRA) is used to determine the effects of M & A. The significance of change in the operating performances is tested through a paired sample t-test. The results indicate a deterioration in the performances of the acquirer banks in the post-merger period.
JEL Classification: G21, G34 Keywords: M & A, mergers and acquisitions, financial ratio analysis, ratios, profitability, liquidity, capital adequacy, performance, Pakistan
1Quaid-i-Azam University Islamabad, Pakistan 2 Quaid-i-Azam University Islamabad, Pakistan

Shah & Khan | Impacts of Mergers and Acquisitions on Acquirer Banks’ Performance
31
1. INTRODUCTION M & A is a process in which two, or even more than two, firms are amalgamated into a single entity in order to enhance their market position and market share through swapping out the competitors, and increasing the efficiency of a firm by combining the resources (Odeck, 2008). The Oxford dictionary defines merger as “converting two or more business concerns into one”. Thus, merger can be defined as the amalgamation of two or more than two firms by purchase/acquisition or through common interests, but different from the consolidation where the firm continues its operations without creating any new entity (Kemal, 2011). Problem statement M & A has been one of the popular trends for business expansion in developed countries and is increasing in developing countries as well (Al-Sharkas, Hassan, & Lawrence, 2008). Pakistan’s economy has also witnessed glimpses of such trends in the last many years, particularly in the banking sector. The frequent increase in the minimum capital requirements by the State Bank of Pakistan made it difficult for the small banks to survive. Thus they opted for M & A, particularly in the late 1990s and onwards. This creates an essential need to investigate the effects of M & A on the performances of the merged banks so that other banks can make more informed decision. Therefore, the current study is undertaken to evaluate the effects of M & A on the post-merger operating performances of the acquirer banks in Pakistan. Objectives of the study The current study precisely explores the reasons of M & A in order to examine the impact of M & A on the performances of the acquirer banks in terms of profitability, liquidity and capital adequacy and determine the possible outcomes of M & A for the information of the banks’ management. Significance of the study Many researchers (Kumar, 2009; Yeh & Hoshino, 2002; Badreldin & Kalhoefer, 2009; Al- Sharkas, Hassan, & Lawrence, 2008; Odeck, 2008; Kwoka & Pollitt, 2010; Rezitis, 2008; Sufain, 2004; Lin, 2005; Asimakopoulos & Athanasoglou, 2013; Tse & Soufani, 2001; Berger & Humphery, 1992; Vallascas & Hagendorff, 2011) worked on the effects of M & A almost all over the world. However, in Pakistan the phenomenon is quite new and little attention has been paid to this important area of research with quite nominal work done (Arshad, 2012) leaving room for further research. Particularly, after 2006 (Afza & Yusuf, 2012) no research is observed to have been undertaken investigating the impacts of M & A, though the said period is more important for this purpose, with 45 mergers occurred in financial sectors during this period. Kemal (2011) and Arshad (2012) investigated the impacts of M & A in Pakistan but their studies were restricted to a single entity (i.e. SCB and RBS respectively). This study therefore acquires significance by studying all M & A transactions occurring over a period of 10 years (2002-2011) and providing a comprehensive picture of the effect of M & A during the period under review. Study Plan The study is divided in five sections. Section 1 gives the introduction, problem statement and associated details. Section 2 provides a detailed review of the relevant literature. Section 3 discusses research methodology and all associated aspects in detail. Section 4 covers data analysis and discussion. Section 5 concludes the research and gives recommendations.

AABFJ | Volume 11, no. 3, 2017
32
2. REVIEW OF LITERATURE AND THEORETICAL FRAMEWORK Two approaches are usually used to measure the effects of M & A on the firm performance. One is operating performance approach, which compares the pre and post-merger performances of merged firms. Second, the share price approach, which measures the effects of M & A on the basis of share prices of the merged firms (Kumar, 2009). Operating performance approach Yeh & Hoshino (2002), Rehman & Limmack (2004), Cabanda & Pascual (2007), Badreldin & Kalhoefer (2009) and Kumar (2009) examine the post merger operating performances of acquiring organizations on the basis of financial ratios analysis and found no improvement in the operating performances. On the other hand, Pawaskar (2001) found lower operating performance in the post-merger period. Similarly, Mantravadi & Reddy (2008) observe a negative impact of mergers on operating performce, and found horizontal mergers causing higher decline in the operating performances as compared with conglomerate and vertical mergers. However, some other studies (Healy, Palepu, & Ruback, 1992; Beena, 2004; Tarawneg. 2006; Lau, Proimos & Weight, 2008) observe improvement in post merger performances of firms. Similarly some other researchers (Favero & Pepi, 1995; Harris, Ozgen, & Ozcan, 2000; Worthington, 2001; Feroz, Kim, & Raab, 2005; Al- Sharkas et al., 2008; Odeck, 2008; Kwoka & Pollitt, 2010) found higher operating performances in the post merger periods, on the basis of data envelopment analysis (DEA) and stochastic frontier analysis (SFA). However, some studies observe mixed results. For instance, Vennet (1996) founds improvement in the cost efficiency but decline in productivity efficiency. According to Lin (2005) homogenous banks’ merger does not increase efficiency, but heterogeneous banks’ merger increases the cost efficiency. Some studies (Krishnasamy, Ridzwa, & Vignesan, 2004; Sufian & Fadzlan, 2007; Rezitis, 2008) report decline in the operating efficiency/ performances of the merged banks. Share price approach Yuce & Ng (2005) using event study method investigate the effects of the M & A and observe abnormal returns on the target and acquirer firms’ stocks. Other researchers (Andreou, Louca & Panayides, 2012; Alexandrou, Gounopoulos, & Thomas, 2014; Khanal, Mishra & Mottaleb, 2014) also observe positive effects of M & A on stocks’ prices. On the other hand, some studies (Toyne & Tripp, 1998; Andre, Kooli, & Her, 2004; Asimakopoulos & Athanasoglo, 2013) found abnormal returns on target firms’ stocks and decline in the acquirer firms’ stocks’ prices but Malhotra & Zhu (2006) report abnormal return on acquirer firms’ stocks as well. Research in Pakistan A very insignificant research is observed to have been carried out on the M & A in Pakistan. Kemal (2011) observes improvement in the solvency ratios but does not report any improvement in the liquidity, profitability and market ratios of Royal Bank of Scotland (RBS) after the RBS’s merger with the ABM AMRO Bank. Bashir, Sajid, & Sheikh (2011) found an insignificant increase in the value of acquirer firms but, on the other hand, an insignificant loss is observed in the value of target firms. Afza & Yusuf (2012) examine the impact of M & A on the efficiency of banking sector considering 12 mergers occurred between 1998 and 2006. They observe an insignificant improvement of only 0.3% in cost efficiency and a decline of 5 % in profit efficiency in the post-merger period. Arshad (2012)

Shah & Khan | Impacts of Mergers and Acquisitions on Acquirer Banks’ Performance
33
investigated the post-merger performance of Standard Chartered Bank (SCB) after acquiring the Union Bank in December 2006, and found improvement in some ratios but deterioration in more ratios reflecting negative post-merger effects. Theoretical Framework The following theoretical framework is developed for the purpose of this study. It shows the relationship between the M & A transactions as independent variable and the operating performance as dependent variable. The dependent variable (operating performance) is measured by using financial ratios, grouped into three categories including profitability, liquidity and capital adequacy ratios.
Figure 1: Theoretical framework
3. RESEARCH DESIGN/METHODOLOGY This study intends to test the following hypotheses developed on the basis of the literature review and reflected in the theoretical framework drawn in figure 1.
1. Profitability testing hypothesis H0: μ1 = μ2 ; H1: μ1 ≠ μ2 2. Liquidity testing hypothesis H0: μ1 = μ2 ; H1: μ1 ≠ μ2 3. Capital adequacy testing hypothesis H0: μ1 = μ2 ; H1: μ1 ≠ μ2
Where μ1 represents the average performance of the three pre-merger years (T-3, T-2, T-1) and μ2 represents the average performance of the three post-merger years (T+1, T+2, T+3) of the respective banks. 3.1 Measurement of Variables In order to measure the effects of M & A, the average performance (μ1) of the three pre-merger years (T-3, T-2, T-1) is compared with the average performance (μ2) of the three post-merger years (T+1, T+2, T+3) of the respective banks. The year of merger is indicated by T0
and is not included in the performance evaluation in order to eliminate the effect of the merger cost. The operating performances of the acquirer banks are measured on the basis of profitability, liquidity and capital adequacy ratios. Table 1 shows the list of profitability ratios used to measure the performances of the acquirer banks (Kumbirai & Webb, 2010; Ismail, Abdou, & Annis, 2011; Kumar, 2009; Kemal, 2011).
Mergers and Acquisitions
Profitability Ratio
Operating Performance
Liquidity Ratios
Capital adequacy Ratio

AABFJ | Volume 11, no. 3, 2017
34
Table 1: Profitability Ratios S.No Ratio Measurement 01 Return on assets (ROA) (Profit or Loss after taxation / Total assets)*100 02 Return on equity (ROE) (Profit or Loss after taxation / owner equity)
*100 03 Net markup (interest)
income to total assets [Net-markup or interest income (after provision) / total assets]* 100
04 Non markup (interest) income to total assets
(Non-markup or interest income / total assets)* 100
05 Net interest margin (Interest income - interest expenses / total assets) *100
06 Admin. expenses to profit before tax.
Admin. expenses / profit before tax
Table 2 shows the list of liquidity ratios (Arshad, 2012; Kemal, 2011; Pawaskar, 2001; Badreldin & Kalhoefer, 2009; and Yeh & Hoshino, 2002) used to measure the ability of the banks to pay off their short-term obligations as an indicator of their performances.
Table 2: Liquidity Ratios S.No Ratio Measurement 01 Cash and cash equivalent to total
assets [(Cash+ cash equivalent) / total assets]*100
02 Advances to total assets (Advances / total assets)*100 03 Investment to total assets (Investment / total assets)*100
The frequent increase in the minimum capital requirements by SBP is considered one of the primary reasons for mergers in the banking sector of Pakistan (Khawaja & Din, 2006). Capital adequacy is therefore assumed as a performance measure of the effect of M & A. Table 3 shows the list of capital adequacy ratios used in this study.
Table 3: Capital Adequacy Ratios S.No Ratio Measurement 01 Capital adequacy ratio Total equity / total assets 02 Total deposits to total equity Total deposit / total equity
3.2 Data Collection and Analysis Techniques A total of 16 M & A transactions between banks, listed on Karachi Stock Exchange (KSE), took place during the 10 years period i.e. 2002-2011. The list of the merged banks is provided in annexure-A. In order to measure the effects of M & A, the average performance (μ1) of the three pre-merger years (T-3, T-2, T-1) is compared with the average performance (μ2) of the three post-merger years (T+1, T+2, T+3) of the respective banks. Thus, a total of 48 observations are made for 16 mergers due to the three pre-merger years and 48 observations are made for the 16 mergers due to the three post-merger years. However, due to the non-availability of data, two observations are dropped making the total of observations equal to 46 for calculating the mean of each of the pre and post-merger performances. For this purpose, the data is collected from the audited financial statements of the respective acquirer banks for the three pre-merger years and the three post-merger years, for each of the M & A transactions.
Shah & Khan | Impacts of Mergers and Acquisitions on Acquirer Banks’ Performance
35
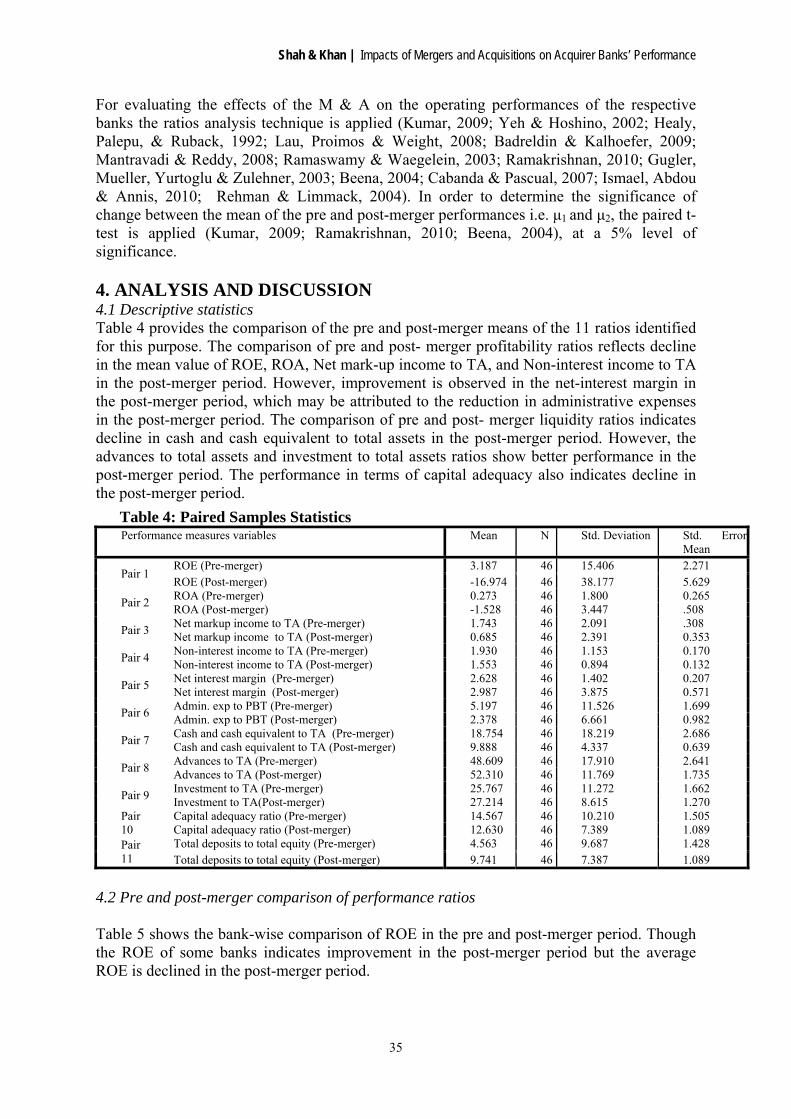
For evaluating the effects of the M & A on the operating performances of the respective banks the ratios analysis technique is applied (Kumar, 2009; Yeh & Hoshino, 2002; Healy, Palepu, & Ruback, 1992; Lau, Proimos & Weight, 2008; Badreldin & Kalhoefer, 2009; Mantravadi & Reddy, 2008; Ramaswamy & Waegelein, 2003; Ramakrishnan, 2010; Gugler, Mueller, Yurtoglu & Zulehner, 2003; Beena, 2004; Cabanda & Pascual, 2007; Ismael, Abdou & Annis, 2010; Rehman & Limmack, 2004). In order to determine the significance of change between the mean of the pre and post-merger performances i.e. μ1 and μ2, the paired t-test is applied (Kumar, 2009; Ramakrishnan, 2010; Beena, 2004), at a 5% level of significance. 4. ANALYSIS AND DISCUSSION 4.1 Descriptive statistics Table 4 provides the comparison of the pre and post-merger means of the 11 ratios identified for this purpose. The comparison of pre and post- merger profitability ratios reflects decline in the mean value of ROE, ROA, Net mark-up income to TA, and Non-interest income to TA in the post-merger period. However, improvement is observed in the net-interest margin in the post-merger period, which may be attributed to the reduction in administrative expenses in the post-merger period. The comparison of pre and post- merger liquidity ratios indicates decline in cash and cash equivalent to total assets in the post-merger period. However, the advances to total assets and investment to total assets ratios show better performance in the post-merger period. The performance in terms of capital adequacy also indicates decline in the post-merger period.
4.2 Pre and post-merger comparison of performance ratios
Table 5 shows the bank-wise comparison of ROE in the pre and post-merger period. Though the ROE of some banks indicates improvement in the post-merger period but the average ROE is declined in the post-merger period.
Table 4: Paired Samples Statistics Performance measures variables Mean N Std. Deviation Std. Error
Mean
Pair 1 ROE (Pre-merger) 3.187 46 15.406 2.271 ROE (Post-merger) -16.974 46 38.177 5.629
Pair 2 ROA (Pre-merger) 0.273 46 1.800 0.265 ROA (Post-merger) -1.528 46 3.447 .508
Pair 3 Net markup income to TA (Pre-merger) 1.743 46 2.091 .308 Net markup income to TA (Post-merger) 0.685 46 2.391 0.353
Pair 4 Non-interest income to TA (Pre-merger) 1.930 46 1.153 0.170 Non-interest income to TA (Post-merger) 1.553 46 0.894 0.132
Pair 5 Net interest margin (Pre-merger) 2.628 46 1.402 0.207 Net interest margin (Post-merger) 2.987 46 3.875 0.571
Pair 6 Admin. exp to PBT (Pre-merger) 5.197 46 11.526 1.699 Admin. exp to PBT (Post-merger) 2.378 46 6.661 0.982
Pair 7 Cash and cash equivalent to TA (Pre-merger) 18.754 46 18.219 2.686 Cash and cash equivalent to TA (Post-merger) 9.888 46 4.337 0.639
Pair 8 Advances to TA (Pre-merger) 48.609 46 17.910 2.641 Advances to TA (Post-merger) 52.310 46 11.769 1.735
Pair 9 Investment to TA (Pre-merger) 25.767 46 11.272 1.662 Investment to TA(Post-merger) 27.214 46 8.615 1.270
Pair 10
Capital adequacy ratio (Pre-merger) 14.567 46 10.210 1.505 Capital adequacy ratio (Post-merger) 12.630 46 7.389 1.089
Pair 11
Total deposits to total equity (Pre-merger) 4.563 46 9.687 1.428 Total deposits to total equity (Post-merger) 9.741 46 7.387 1.089

AABFJ | Volume 11, no. 3, 2017
36
Table 5: Return on Equity (ROE) Pre-Merger Post-Merger
Bank (T-3) (T-2) (T-1) Mean (μ1) (T+1) (T+2) (T+3) Mean (μ2)
Faysal Bank 2002 -13.103 8.639 10.702 2.079 26.964 17.167 21.524 21.885
Mashreq Bank 2002 7.025 1.740 8.561 5.775 -3.725 -45.599 -40.489 -29.938
KASB Bank 2003 -9.551 -15.199 -12.375 5.757 -15.728 6.452 -1.173
KASB Bank 2004 -9.551 -15.199 2.038 -7.571 -15.728 6.452 4.615 -1.554
Crescent Bank 2004 1.740 8.561 5.996 5.432 -45.599 -40.489 -21.330 -35.806
Allied Bank 2005 30.501 -9.701 1.870 7.556 24.860 20.506 18.593 21.320
JS Bank 2006 6.285 3.761 3.974 4.673 0.682 1.038 -10.521 -2.934
SCB 2006 25.750 35.560 48.260 36.523 6.418 1.584 1.402 3.135
Allied Bank 2006 -9.701 1.870 21.239 4.469 20.506 18.593 23.772 20.957
Atlas Bank 2006 -2.461 0.248 -1.107 -5.961 -27.634 -48.911 -27.502
KASB Bank 2007 5.757 -15.728 6.452 -1.173 -10.576 -85.256 -124.203 -73.345
NIB Bank 2008 2.463 2.724 -1.344 1.281 1.664 -74.012 -14.946 -29.098
KASB Bank 2009 6.452 4.615 -10.576 0.163 -124.203 -72.023 -40.716 -78.981
Askari Bank 2010 21.857 2.978 7.410 10.748 9.157 6.452 -29.259 -4.550
Summit Bank 2011 -3.289 -50.976 -8.986 -21.084 -89.231 -53.950 -71.590
Faysal Bank 2011 10.350 9.389 7.206 8.982 6.749 8.346 7.547
Mean (μ) overall 3.187 -16.975

Shah & Khan | Impacts of Mergers and Acquisitions on Acquirer Banks’ Performance
37
Table 6 shows the bank-wise comparison of ROA, reflecting decline in the mean of ROA in the post-merger period. Table 6: Return on Assets (ROA)
Pre-Merger Post-Merger
Bank (T-3) (T-2) (T-1) Mean (μ1) (T+1) (T+2) (T+3) Mean (μ2)
Faysal Bank 2002 -1.544 0.880 1.216 0.184 4.879 2.508 3.023 3.470
Mashreq Bank 2002 1.268 0.463 3.653 1.794 -0.919 -8.586 -8.469 -5.991
KASB Bank 2003 -1.525 -3.220 -2.372 0.777 -1.587 0.586 -0.075
KASB Bank 2004 -1.525 -3.220 0.312 -1.477 -1.587 0.586 0.533 -0.156
Crescent Bank 2004 0.463 3.653 1.958 2.024 -8.586 -8.469 -6.753 -7.936
Allied Bank 2005 -1.059 0.363 0.134 -0.187 1.935 1.407 1.219 1.520
JS Bank 2006 0.955 0.945 0.984 0.961 0.186 0.278 -2.030 -0.522
SCB 2006 2.334 3.074 4.040 3.149 1.168 0.234 0.224 0.542
Allied Bank 2006 0.363 0.134 1.770 0.756 1.407 1.219 1.823 1.483
Atlas Bank 2006 -0.704 0.049 -0.327 -1.453 -3.702 -5.834 -3.663
KASB Bank 2007 0.777 -1.587 0.586 -0.075 -1.937 -7.525 -5.119 -4.860
NIB Bank 2008 0.371 0.280 -0.297 0.118 0.353 -6.628 -1.406 -2.560
KASB Bank 2009 0.586 0.533 -1.937 -0.273 -5.119 -4.248 -1.303 -3.556
Askari Bank 2010 1.622 0.207 0.489 0.773 0.523 0.395 -1.524 -0.202
Summit Bank 2011 -0.818 -5.818 -0.687 -2.441 -2.229 -1.603 -1.916
Faysal Bank 2011 0.868 0.698 0.488 0.685 0.494 0.568 0.531
Mean (μ) overall 0.272 -1.528

AABFJ | Volume 11, no. 3, 2017
38
The average of net markup income to total assets is also decreased in the post-merger period despite improvement in the net markup income of some banks. See Table 7 for detail.
Table 7: Net Markup Income to Total Assets
Pre-Merger Post-Merger
Banks (T-3) (T-2) (T-1) Mean (μ1) (T+1) (T+2) (T+3) Mean (μ2)
Faysal Bank 2002 -1.712 1.653 2.459 0.800 1.996 2.162 3.286 2.481
Mashreq Bank 2002 0.845 2.013 7.463 3.440 0.244 -3.799 -2.837 -2.131
KASB Bank 2003 0.445 0.855 0.650 2.567 -0.527 1.366 1.135
KASB Bank 2004 0.445 0.855 2.394 1.231 -0.527 1.366 1.130 0.656
Crescent Bank 2004 2.013 7.463 -0.006 3.156 -3.799 -2.837 -2.960 -3.199
Allied Bank 2005 0.729 3.035 2.043 1.936 4.276 2.897 3.184 3.452
JS Bank 2006 1.652 2.313 1.791 1.918 1.342 3.062 -0.178 1.409
SCB 2006 4.026 3.813 5.255 4.365 4.284 2.459 2.303 3.015
Allied Bank 2006 3.035 2.043 4.175 3.084 2.897 3.184 3.656 3.246
Atlas Bank 2006 1.513 1.786 1.650 0.207 0.737 -2.446 -0.501
KASB Bank 2007 2.567 -0.527 1.366 1.135 -3.894 -0.763 -2.988 -2.548
NIB Bank 2008 1.812 1.784 1.213 1.603 2.761 1.933 -0.473 1.407
KASB Bank 2009 1.366 1.130 -3.894 -0.466 -2.988 -1.959 0.283 -1.555
Askari Bank 2010 1.534 1.971 2.700 2.068 2.645 2.108 -0.697 1.352
Summit Bank 2011 1.124 -4.147 0.417 -0.869 0.077 1.477 0.777
Faysal Bank 2011 2.259 1.627 1.470 1.786 2.631 2.679 2.655
Mean (μ) overall 1.743 0.685

Shah & Khan | Impacts of Mergers and Acquisitions on Acquirer Banks’ Performance
39
Decline is also observed in the average non-markup income to total assets in the post-merger period. The bank-wise comparison of non-markup income to total assets is shown in table 8. Table 8: Non-Markup Income to Total Assets Pre-Merger Post-Merger
Bank (T-3) (T-2) (T-1) Mean (μ1) (T+1) (T+2) (T+3) Mean (μ2)
Faysal Bank 2002 1.259 2.060 1.956 1.759 6.155 2.619 2.032 3.602
Mashreq Bank 2002 2.306 2.025 1.719 2.017 1.220 1.352 1.172 1.248
KASB Bank 2003 2.059 3.516 2.787 0.920 1.195 2.530 1.548
KASB Bank 2004 2.059 3.516 1.923 2.499 1.195 2.530 2.215 1.980
Crescent Bank 2004 2.025 1.719 3.393 2.379 1.352 1.172 0.656 1.060
Allied Bank 2005 1.458 2.016 1.220 1.565 1.078 1.353 1.218 1.216
JS Bank 2006 3.483 5.309 5.968 4.920 2.191 2.503 1.158 1.951
SCB 2006 2.210 2.551 2.440 2.400 2.583 2.289 2.309 2.393
Allied Bank 2006 2.016 1.220 1.111 1.449 1.353 1.218 1.525 1.365
Atlas Bank 2006 0.027 0.140 0.084 1.631 0.898 0.168 0.899
KASB Bank 2007 0.920 1.195 2.530 1.548 1.315 0.988 1.177 1.160
NIB Bank 2008 0.844 1.173 0.363 0.793 0.860 1.124 1.481 1.155
KASB Bank 2009 2.530 2.215 1.315 2.020 1.177 1.206 1.272 1.218
Askari Bank 2010 2.762 1.454 1.128 1.781 0.932 1.288 1.000 1.074
Summit Bank 2011 0.713 0.745 1.091 0.850 1.123 1.479 1.301
Faysal Bank 2011 1.799 1.636 1.643 1.693 1.838 1.389 1.613
Mean (μ) overall 1.930 1.553

AABFJ | Volume 11, no. 3, 2017
40
The bank-wise comparison of net interest margin, given in table 9, shows a better performance in the post-merger period. Table 9: Net Interest Margin Pre-Merger Post-Merger
Bank (T-3) (T-2) (T-1) Mean (μ1) (T+1) (T+2) (T+3) Mean (μ2)
Faysal Bank 2002 -1.648 1.697 2.641 0.897 2.559 2.339 2.981 2.626
Mashreq Bank 2002 1.146 2.174 5.853 3.057 1.026 0.761 -0.956 0.277
KASB Bank 2003 2.969 1.813 2.391 2.557 2.379 1.542 2.159
KASB Bank 2004 2.969 1.813 2.596 2.459 2.379 1.542 1.704 1.875
Crescent Bank 2004 2.174 5.853 0.805 2.944 0.761 -0.956 1.762 0.522
Allied Bank 2005 3.733 3.602 3.121 3.485 4.586 3.834 4.110 4.177
JS Bank 2006 1.651 1.787 1.743 1.727 1.393 3.119 2.459 2.324
SCB 2006 4.026 3.813 5.255 4.365 6.841 5.684 5.461 5.995
Allied Bank 2006 3.602 3.121 4.508 3.744 3.834 4.110 4.787 4.244
Atlas Bank 2006 1.513 1.786 1.650 0.207 2.032 0.680 0.973
KASB Bank 2007 2.557 2.379 1.542 2.159 0.822 -0.763 19.036 6.365
NIB Bank 2008 2.138 2.424 1.213 1.925 2.761 1.933 1.430 2.041
KASB Bank 2009 1.542 1.704 0.822 1.356 19.036 -0.960 2.722 6.933
Askari Bank 2010 3.906 4.158 3.987 4.017 3.233 2.949 2.390 2.857
Summit Bank 2011 3.789 1.597 1.905 2.430 0.104 0.744 0.424
Faysal Bank 2011 3.854 2.902 2.372 3.043 3.119 3.328 3.223
Mean (μ) overall 2.628 2.987

Shah & Khan | Impacts of Mergers and Acquisitions on Acquirer Banks’ Performance
41
The bank-wise comparison of administrative expenses to profit before taxes is given in table 10. Improvement is observed in administrative expenses as the average of this ratio is decreased in the post-merger period. Table 10: Admin Expenses to Profit Before Tax Pre-Merger Post-Merger
Bank (T-3) (T-2) (T-1) Mean (μ1) (T+1) (T+2) (T+3) Mean (μ2)
Faysal Bank 2002 -0.901 0.801 0.578 0.159 0.304 0.514 0.360 0.393
Mashreq Bank 2002 0.860 1.406 0.633 0.967 -2.648 -0.666 -0.744 -1.353
KASB Bank 2003 -2.113 -1.992 -2.052 27.649 -1.217 16.167 14.200
KASB Bank 2004 -2.113 -1.992 5.794 0.563 -1.217 16.167 17.598 10.849
Crescent Bank 2004 1.406 0.633 0.636 0.892 -0.666 -0.744 -0.650 -0.687
Allied Bank 2005 -2.272 4.452 8.528 3.569 0.794 0.999 1.322 1.038
JS Bank 2006 9.964 25.920 -17.383 6.167 -11.833 8.835 -1.197 -1.399
SCB 2006 0.678 0.516 0.433 0.542 2.953 11.368 9.670 7.997
Allied Bank 2006 4.452 8.528 0.881 4.620 0.999 1.322 0.894 1.072
Atlas Bank 2006 -1.360 13.742 6.191 -1.211 -1.233 -0.695 -1.046
KASB Bank 2007 27.649 -1.217 16.167 14.200 -0.951 -0.400 -0.722 -0.691
NIB Bank 2008 26.353 55.740 -3.014 26.359 8.299 -0.551 -1.355 2.131
KASB Bank 2009 16.167 17.598 -0.951 10.938 -0.722 -0.774 -1.478 -0.991
Askari Bank 2010 2.083 12.797 4.260 6.380 3.581 5.185 -1.113 2.551
Summit Bank 2011 -4.048 -0.515 -3.871 -2.811 -1.448 -2.392 -1.920
Faysal Bank 2011 1.813 3.294 8.033 4.380 5.890 5.127 5.508
Mean (μ) overall 5.197 2.378

AABFJ | Volume 11, no. 3, 2017
42
Table 11 shows the bank-wise comparison of liquidity in terms of cash and cash equivalents to total assets. The ratio is declined in the post-merger period despite increase in cash and cash equivalents of some banks. Table 11: Cash and Cash Equivalent to Total Assets Pre-Merger Post-Merger
Bank (T-3) (T-2) (T-1) Mean (μ1) (T+1) (T+2) (T+3) Mean (μ2)
Faysal Bank 2002 21.842 4.986 24.225 17.018 7.972 12.317 8.610 9.633
Mashreq Bank 2002 46.194 71.988 60.252 59.478 11.547 10.957 12.726 11.743
KASB Bank 2003 21.439 13.739 17.589 25.605 11.042 13.249 16.632
KASB Bank 2004 21.439 13.739 12.112 15.764 11.042 13.249 10.273 11.522
Crescent Bank 2004 71.988 60.252 8.376 46.872 10.957 12.726 5.447 9.710
Allied Bank 2005 11.359 10.540 8.640 10.180 10.887 10.496 7.553 9.646
JS Bank 2006 19.999 53.626 43.513 39.046 6.448 9.952 12.232 9.544
SCB 2006 16.325 17.026 11.223 14.858 11.798 8.309 7.969 9.358
Allied Bank 2006 10.540 8.640 10.333 9.838 10.496 7.553 7.095 8.381
Atlas Bank 2006 1.862 3.019 2.440 8.072 6.115 5.737 6.641
KASB Bank 2007 25.605 11.042 13.249 16.632 3.119 5.406 6.556 5.027
NIB Bank 2008 14.486 10.184 7.097 10.589 6.400 7.727 6.506 6.878
KASB Bank 2009 13.249 10.273 3.119 8.880 6.556 27.722 8.228 14.168
Askari Bank 2010 10.194 10.732 12.248 11.058 10.407 10.414 9.776 10.199
Summit Bank 2011 6.051 7.455 6.151 6.552 9.547 10.088 9.817
Faysal Bank 2011 7.634 5.197 9.484 7.438 8.948 9.033 8.991
Mean (μ) overall 18.754 9.889

Shah & Khan | Impacts of Mergers and Acquisitions on Acquirer Banks’ Performance
43
Table 12 shows the bank-wise comparison of liquidity in terms of advances to total assets. The advances to total assets ratio appears to have increased in the post-merger period indicating better performance in the post-merger period. Table 12: Advances to Total Assets Pre-Merger Post-Merger
Bank (T-3) (T-2) (T-1) Mean (μ1) (T+1) (T+2) (T+3) Mean (μ2)
Faysal Bank 2002 54.724 34.824 71.228 53.592 66.725 73.468 61.379 67.191
Mashreq Bank 2002 31.935 49.974 52.704 44.871 42.295 42.956 33.317 39.523
KASB Bank 2003 48.500 13.807 31.154 65.719 62.426 61.930 63.358
KASB Bank 2004 48.500 13.807 45.484 35.931 62.426 61.930 67.806 64.054
Crescent Bank 2004 49.974 52.704 26.398 43.025 42.956 33.317 23.959 33.410
Allied Bank 2005 44.871 38.246 41.713 41.610 63.372 58.131 62.468 61.324
JS Bank 2006 28.614 38.329 12.101 26.348 33.912 49.309 39.883 41.035
SCB 2006 55.244 63.717 50.015 56.325 50.503 43.480 41.738 45.240
Allied Bank 2006 38.246 41.713 63.714 47.891 58.131 62.468 60.755 60.451
Atlas Bank 2006 1.592 10.357 5.974 43.458 75.280 65.834 61.524
KASB Bank 2007 65.719 62.426 61.930 63.358 64.182 52.502 55.757 57.481
NIB Bank 2008 70.163 73.701 49.610 64.492 42.956 48.876 41.864 44.565
KASB Bank 2009 61.930 67.806 64.182 64.639 55.757 50.967 36.392 47.705
Askari Bank 2010 60.961 69.180 59.598 63.246 48.405 44.949 45.475 46.276
Summit Bank 2011 67.381 52.087 48.522 55.996 42.836 47.529 45.183
Faysal Bank 2011 69.885 53.130 54.761 59.259 59.950 56.527 58.238
Mean (μ) overall 48.609 52.310

AABFJ | Volume 11, no. 3, 2017
44
Table 13 shows the bank-wise comparison of liquidity in terms of investment to total assets. The investment to total assets ratio also increased indicating better performance in the post-merger period. Table 13: Investment to Total Assets Pre-Merger Post-Merger
Bank (T-3) (T-2) (T-1) Mean (μ1) (T+1) (T+2) (T+3)
Mean (μ2)
Faysal Bank 2002 20.696 0.679 12.672 11.349 25.911 16.450 24.042 22.134
Mashreq Bank 2002 11.743 8.862 20.187 13.598 27.314 24.925 29.951 27.397
KASB Bank 2003 25.107 59.684 42.396 21.287 22.216 20.032 21.178
KASB Bank 2004 25.107 59.684 29.866 38.219 22.216 20.032 19.627 20.625
Crescent Bank 2004 8.862 20.187 24.151 17.734 24.925 29.951 20.154 25.010
Allied Bank 2005 33.262 38.317 40.195 37.258 20.659 28.981 24.237 24.626
JS Bank 2006 27.849 30.374 33.468 30.564 33.040 26.029 32.534 30.534
SCB 2006 21.549 16.285 25.257 21.030 17.194 10.242 28.100 18.512
Allied Bank 2006 38.317 40.195 25.740 34.751 28.981 24.237 24.264 25.827
Atlas Bank 2006 27.839 22.478 25.159 26.175 10.957 16.316 17.816
KASB Bank 2007 21.287 22.216 20.032 21.178 18.821 26.927 24.647 23.465
NIB Bank 2008 18.340 15.567 24.487 19.465 31.919 33.946 34.127 33.330
KASB Bank 2009 20.032 19.627 18.821 19.493 24.647 30.260 50.093 35.000
Askari Bank 2010 23.851 19.160 29.591 24.201 42.960 45.465 46.116 44.847
Summit Bank 2011 21.783 35.035 35.070 30.629 40.714 34.798 37.756
Faysal Bank 2011 23.503 32.881 35.394 30.592 30.626 34.777 32.701
Mean (μ) overall 25.767 27.214

Shah & Khan | Impacts of Mergers and Acquisitions on Acquirer Banks’ Performance
45
Table 14 shows the bank-wise comparison of capital adequacy ratio. The results indicate lower performance in the post-merger period despite increase in the capital adequacy of some banks. Table 14: Capital Adequacy Ratio Pre-Merger Post-Merger
Bank (T-3) (T-2) (T-1) Mean (μ1) (T+1) (T+2) (T+3) Mean (μ2)
Faysal Bank 2002 11.783 10.189 11.358 11.110 18.096 14.608 14.044 15.583
Mashreq Bank 2002 18.047 26.596 42.668 29.104 24.669 18.830 20.916 21.472
KASB Bank 2003 15.969 21.183 18.576 13.497 10.091 9.084 10.891
KASB Bank 2004 15.969 21.183 15.327 17.493 10.091 9.084 11.553 10.243
Crescent Bank 2004 26.596 42.668 32.653 33.972 18.830 20.916 31.662 23.803
Allied Bank 2005 -3.471 -3.739 7.192 -0.006 7.782 6.862 6.557 7.067
JS Bank 2006 15.195 25.127 24.757 21.693 27.198 26.821 19.292 24.437
SCB 2006 9.063 8.645 8.372 8.693 18.195 14.801 16.013 16.337
Allied Bank 2006 -3.739 7.192 8.336 3.930 6.862 6.557 7.669 7.029
Atlas Bank 2006 28.606 19.814 24.210 24.376 13.397 11.927 16.567
KASB Bank 2007 13.497 10.091 9.084 10.891 18.314 8.826 4.121 10.420
NIB Bank 2008 15.063 10.269 22.072 15.802 21.231 8.956 9.410 13.199
KASB Bank 2009 9.084 11.553 18.314 12.984 4.121 5.897 3.201 4.406
Askari Bank 2010 7.420 6.966 6.598 6.994 5.709 6.120 5.207 5.679
Summit Bank 2011 24.886 11.413 7.641 14.646 2.498 2.971 2.734
Faysal Bank 2011 8.387 7.435 6.765 7.529 7.320 6.803 7.061
Mean (μ) overall 14.567 12.630

AABFJ | Volume 11, no. 3, 2017
46
Table 15 shows the bank-wise comparison of deposit to equity ratio as measure of capital adequacy. This ratio increased indicating a weaker performance in the post-merger period. Table 15: Deposit to Equity Pre-Merger Post-Merger
Bank (T-3) (T-2) (T-1) Mean (μ1) (T+1) (T+2) (T+3) Mean (μ2)
Faysal Bank 2002 7.618 7.303 8.317 7.746 3.927 5.528 5.241 4.898
Mashreq Bank 2002 4.670 3.178 1.569 3.139 2.174 3.666 3.710 3.183
KASB Bank 2003 5.645 3.511 4.578 6.575 8.542 9.994 8.370
KASB Bank 2004 5.645 3.511 4.435 4.530 8.542 9.994 7.734 8.757
Crescent Bank 2004 3.178 1.569 1.883 2.210 3.666 3.710 2.039 3.138
Allied Bank 2005 -29.633 -28.763 12.324 -15.357 11.648 13.279 13.307 12.745
JS Bank 2006 4.685 4.405 3.602 4.231 2.634 2.899 3.769 3.101
SCB 2006 10.357 10.948 9.951 10.419 4.114 4.082 4.335 4.177
Allied Bank 2006 -28.763 12.324 11.094 -1.782 13.279 13.307 10.977 12.521
Atlas Bank 2006 0.225 1.429 0.827 2.956 5.099 7.517 5.190
KASB Bank 2007 6.575 8.542 9.994 8.370 3.814 8.853 21.203 11.290
NIB Bank 2008 5.014 7.065 3.201 5.093 2.262 7.258 6.251 5.257
KASB Bank 2009 9.994 7.734 3.814 7.181 21.203 18.618 23.690 21.170
Askari Bank 2010 11.661 12.927 13.778 12.789 16.398 15.684 17.900 16.661
Summit Bank 2011 2.855 7.722 11.777 7.451 31.629 31.384 31.506
Faysal Bank 2011 9.541 9.674 11.825 10.346 11.442 12.232 11.837
Mean (μ) overall 4.563 9.740
Shah & Khan | Impacts of Mergers and Acquisitions on Acquirer Banks’ Performance
47
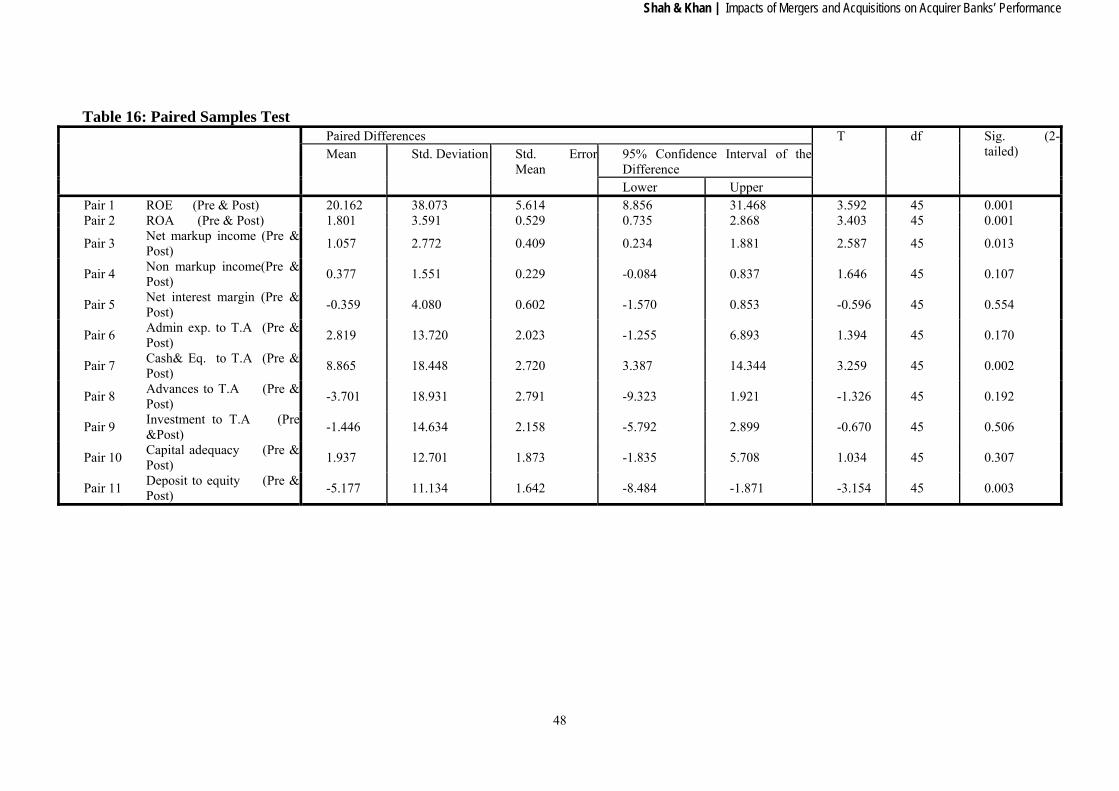
4.3 Hypothesis testing
Table 16 shows the results of hypothesis testing applying the paired t-test statistic to measure the change between the pre and post-merger means of respective ratios. ROE is decreased in the post-merger period and the difference in the pre and post-merger averages (μ1 and μ2) is found statistically significant at 1% level of significance. Thus, H0 is rejected and the alternate hypothesis, H1 is accepted. Similarly the mean of ROA shows a deteriorating trend in the post-merger period and the change is found statistically significant at 1% level of significance. Thus, H0 is rejected and the alternate hypothesis, H1 is accepted. The decrease in the post-merger mean (μ2) of the net markup income to total assets is also found statistically significant but at 5% level of significance. Thus, the null hypothesis is rejected and the alternate hypothesis is accepted. However, the change in the non-Markup income to total assets is found statistically insignificant at even 5% level of significance, as shown in the following table. Thus, we failed to reject the null hypothesis in this case. Similarly, the change in the net interest margin is found statistically insignificant at 5% level of significance. Thus, we again failed to reject the null hypothesis. The change in the admin expenses to profit before tax is also found statistically insignificant at 5% level of significance and therefore we failed to reject the null hypothesis.
The impact of M & A on liquidity is measured in terms of three ratios. The decrease in the post-merger mean (μ2) of the cash and cash equivalent to total assets is found statistically significant at 1% level of significance. Thus, H0 is rejected and the alternate hypothesis, H1 is accepted. However, the change in the advances to total assets is found statistically insignificant at even 5% level of significance, and therefore we failed to reject the null hypothesis. Similarly, the change in the investment to total assets is found statistically insignificant at 5% level of significance. Thus, we again failed to reject the null hypothesis.
The impact of M & A on capital adequacy is measured in terms of two ratios. The change in the capital adequacy ratio is found statistically insignificant at 5% level of significance, and therefore we failed to reject the null hypothesis. However, the difference in the pre and post-merger mean performances of deposit to equity is found statistically significant at 1% level of significance. Thus, H0 is rejected and the alternate hypothesis, H1 is accepted.
AABFJ | Volume 11, no. 3, 2017
48
Shah & Khan | Impacts of Mergers and Acquisitions on Acquirer Banks’ Performance Table 16: Paired Samples Test Paired Differences T df Sig. (2-
tailed) Mean Std. Deviation Std. ErrorMean
95% Confidence Interval of theDifference Lower Upper
Pair 1 ROE (Pre & Post) 20.162 38.073 5.614 8.856 31.468 3.592 45 0.001 Pair 2 ROA (Pre & Post) 1.801 3.591 0.529 0.735 2.868 3.403 45 0.001
Pair 3 Net markup income (Pre & Post)
1.057 2.772 0.409 0.234 1.881 2.587 45 0.013
Pair 4 Non markup income(Pre & Post)
0.377 1.551 0.229 -0.084 0.837 1.646 45 0.107
Pair 5 Net interest margin (Pre & Post)
-0.359 4.080 0.602 -1.570 0.853 -0.596 45 0.554
Pair 6 Admin exp. to T.A (Pre & Post)
2.819 13.720 2.023 -1.255 6.893 1.394 45 0.170
Pair 7 Cash& Eq. to T.A (Pre & Post)
8.865 18.448 2.720 3.387 14.344 3.259 45 0.002
Pair 8 Advances to T.A (Pre & Post)
-3.701 18.931 2.791 -9.323 1.921 -1.326 45 0.192
Pair 9 Investment to T.A (Pre &Post)
-1.446 14.634 2.158 -5.792 2.899 -0.670 45 0.506
Pair 10 Capital adequacy (Pre & Post)
1.937 12.701 1.873 -1.835 5.708 1.034 45 0.307
Pair 11 Deposit to equity (Pre & Post)
-5.177 11.134 1.642 -8.484 -1.871 -3.154 45 0.003
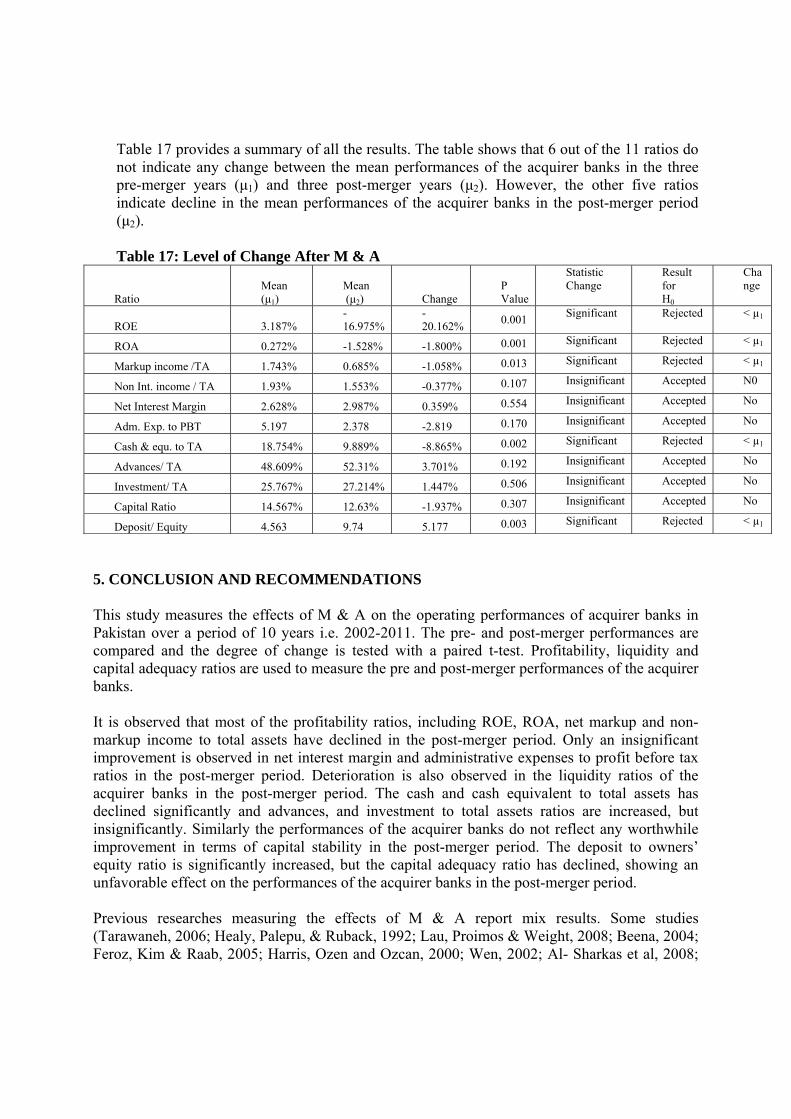
Table 17 provides a summary of all the results. The table shows that 6 out of the 11 ratios do not indicate any change between the mean performances of the acquirer banks in the three pre-merger years (μ1) and three post-merger years (μ2). However, the other five ratios indicate decline in the mean performances of the acquirer banks in the post-merger period (μ2). Table 17: Level of Change After M & A
Ratio Mean (μ1)
Mean (μ2) Change
P Value
Statistic Change
Result for H0
Change
ROE 3.187% -16.975%
-20.162%
0.001 Significant Rejected < µ1
ROA 0.272% -1.528% -1.800% 0.001 Significant Rejected < µ1
Markup income /TA 1.743% 0.685% -1.058% 0.013 Significant Rejected < µ1
Non Int. income / TA 1.93% 1.553% -0.377% 0.107 Insignificant Accepted N0
Net Interest Margin 2.628% 2.987% 0.359% 0.554 Insignificant Accepted No
Adm. Exp. to PBT 5.197 2.378 -2.819 0.170 Insignificant Accepted No
Cash & equ. to TA 18.754% 9.889% -8.865% 0.002 Significant Rejected < µ1
Advances/ TA 48.609% 52.31% 3.701% 0.192 Insignificant Accepted No
Investment/ TA 25.767% 27.214% 1.447% 0.506 Insignificant Accepted No
Capital Ratio 14.567% 12.63% -1.937% 0.307 Insignificant Accepted No
Deposit/ Equity 4.563 9.74 5.177 0.003 Significant Rejected < µ1
5. CONCLUSION AND RECOMMENDATIONS This study measures the effects of M & A on the operating performances of acquirer banks in Pakistan over a period of 10 years i.e. 2002-2011. The pre- and post-merger performances are compared and the degree of change is tested with a paired t-test. Profitability, liquidity and capital adequacy ratios are used to measure the pre and post-merger performances of the acquirer banks. It is observed that most of the profitability ratios, including ROE, ROA, net markup and non-markup income to total assets have declined in the post-merger period. Only an insignificant improvement is observed in net interest margin and administrative expenses to profit before tax ratios in the post-merger period. Deterioration is also observed in the liquidity ratios of the acquirer banks in the post-merger period. The cash and cash equivalent to total assets has declined significantly and advances, and investment to total assets ratios are increased, but insignificantly. Similarly the performances of the acquirer banks do not reflect any worthwhile improvement in terms of capital stability in the post-merger period. The deposit to owners’ equity ratio is significantly increased, but the capital adequacy ratio has declined, showing an unfavorable effect on the performances of the acquirer banks in the post-merger period. Previous researches measuring the effects of M & A report mix results. Some studies (Tarawaneh, 2006; Healy, Palepu, & Ruback, 1992; Lau, Proimos & Weight, 2008; Beena, 2004; Feroz, Kim & Raab, 2005; Harris, Ozen and Ozcan, 2000; Wen, 2002; Al- Sharkas et al, 2008;

AABFJ | Volume 11, no. 3, 2017
50
Odeck, 2008; Worthington, 2001; Kwoka & Pollitt, 2010) observed improvement in the operating performances in the post-merger period. However, other studies (Kumar, 2009; Yeh & Hoshino, 2002; Badreldin & Kalhoefer, 2009; Mantravadi & Reddy, 2008; Cabanda & Pascual, 2007; Pawaskar, 2001; Krishnasamy, Ridzwa & Vignesan, 2004; Rezitis, 2008; Sufian & Fadzlan, 2007) indicate decline or no change in the post-merger performances. The current research also resulted in similar findings. Most of the ratios studied do not show any significant change in the post-merger period, while some of the ratios are shown to have declined in the post-merger period. In summary, the performances of the acquirer banks are observed to have deteriorated in the post merger period. Therefore, the banks may better invest their resources in expanding their networking instead of participating in the ineffective mergers deals. Kumar (2009) also suggests that banks should not engage in M & A due to the ineffectiveness of such deals. Banks, in Pakistan may also expand their business in certain other ways, for example Islamic banking, for improving performances. Limitation of the study and future research This study is confined to the financial sector of Pakistan, including only the M & As that occurred in the banking sector, thus limiting the scope of this study, which may restrict the generalizability of the findings. Further, the study pooled the data and observed the overall impact of M & A on the performance of all the acquirer banks as a whole, but not on the performance of each bank individually, which might have performed better in the post-merger periods, in some cases. Future researchers may examine the banks’ operating performances on a case to case basis. Future researchers may also investigate the role of management expertise in making the M & A successful or otherwise.
References
Afza, T., & Yusuf, M. U. (2012). The Impact of Mergers on Efficiency of Banks in Pakistan. Elixir International Journal, 9158-9163.
Al-Sharkas, A. A., Hassan , M. K., & Lawrence, S. (2008). The Impact of Mergers and Acquisitions on the Efficiency of the US Banking Industry: Further Evidence. Journal of Business Finance & Accounting, 50–70. https://doi.org/10.1111/j.1468-5957.2007.02059.x
Alexandrou, G., Gounopoulos, D., & Thomas, H. M. (2014). Mergers and Acquisitions in Shipping. Transportation Research, 212–234. https://doi.org/10.1016/j.tre.2013.11.007
Andre, P., Kooli, M., & Her, J. (2004). The Long-Run Performance of Mergers and Acquisitions: Evidence from the Canadian Stock Market. Financial Management, 27-43.
Andreou, P. C., Louca, C., & Panayides, P. M. (2012). Valuation Effects of Mergers and Acquisitions in Freight Transportation. Transportation Research, 1221–1234.
https://doi.org/10.1016/j.tre.2012.06.006 Arshad, A. (2012). Post-merger Performance Analysis of Standard Chartered Bank pakistan.
Intredisciplinary Journal of Contemporary Research in Business, 164-173. Asimakopoulos, I., & Athanasoglou, P. P. (2013). Revisiting the Merger and Acquisition
Performance of European Banks. International Review of Financial Analysis, 237–249. https://doi.org/10.1016/j.irfa.2012.08.010 Badreldin, A., & Kalhoefer, C. (2009). The Effect of Mergers and Acquisitions on Bank
Performance in Egypt. New Cairo: German Univerdity in Cairo.

Shah & Khan | Impacts of Mergers and Acquisitions on Acquirer Banks’ Performance
51
Bashir, A., Sajid , M. R., & Sheikh, S. F. (2011). The Impact of Mergers and Acquisitions on Shareholders Wealth: Evidence from Pakistan. Middle-East Journal of Scientific Research, 261-264.
Beena, P. L. (2000). An Analysis of Mergers in the Private Corporate Sector in India. Center for Development Studies, 1-62.
Berger, A. N., & Humphery, D. B. (1992). Bank Scale Economies, Mergers, Concentration, and Efficiency: The U.S. Experience. Working Paper Series.
Berger, A. N., & Humphrey, D. B. (1997). Efficiency of Financial Institutions: International Survey and Directions for Future Research. European Journal of Operational Research, 175-212. https://doi.org/10.1016/S0377-2217(96)00342-6
Brigham, E. F., & Ehrahardt, M. C. (2012). Financial Management. New Dehli: Cengage Learning.
Cabanda , E., & Pascual, M. P. (2007). Merger in the Philippines: Evidence in the Corporate Performance of William Gothong and Aboitiz (WG&B) Shipping Companies. Journal of Business Case Study, 87-100.
Feroz, E. H., Kim, S., & Raab, R. (2005). Performance Measurement in Corporate Governance: Do Mergers Improve Managerial Performance in the Post Merger Period? Review of Accounting and Finance, 86-101. https://doi.org/10.1108/eb043432
Gugler, K., Mueller, D. C., & Zulehner, C. (2003). The Effects of Merger: An international Comparison. International Journal of Industrial Organization, 625-653.
https://doi.org/10.1016/S0167-7187(02)00107-8 Healy, P. M., Palepy, K. G., & Ruback, R. (1992). Does Corporate Performance Improve after
Mergers? Journal of Financial Economics, 135-165. https://doi.org/10.1016/0304-405X(92)90002-F Harris, J., Ozgen , H., & Ozcan, Y. (2000). Do Mergers Enhance the Performance of Hospital
Efficiency? The Journal of the Operational Research Society, 801-811. https://doi.org/10.1057/palgrave.jors.2600869 Ismail, T. H., Abdou, A. A., & Annis, R. M. (2011). Review of Literature Linking Corporate
Performance to Mergers and Acquisitions. The Review of Financial and Accounting Studies, 89-104.
Kemal, M. U. (2011). Post-Merger Profitability: A Case of Royal Bank of Scotland (RBS). International Journal of Business and Social Science, 157-162.
Khanal, A. R., Mishra, A. K., & Mottaleb, K. A. (2014). Impact of Mergers and Acquisitions on Stock Prices:The U.S. Ethanol-based Biofuel Industry. Biomass and Bioenergy, 138-145.
https://doi.org/10.1016/j.biombioe.2013.12.004 Krishnasamy, G., Ridzwa, A. F., & Vignesan, P. (2004). Malaysia Post-Merger
Banks’Productivity: Application of Malmquist Productivity Index. Managerial finance, 63-74. https://doi.org/10.1108/03074350410769038
Kumar, R. (2009). Post-Merger Corporate Performance: An Indian Perspective. Management Research News, 145-157. https://doi.org/10.1108/01409170910927604
Kwoka, J., & Pollitt, M. (2010). Do Mergers Improve Efficiency? Evidence from Restructuring the US Electric Power Sector. International Journal of Industrial Organization, 645–656. https://doi.org/10.1016/j.ijindorg.2010.03.001
Lau, B., Proimos, & Wright, S. (2008). Accounting Measures of Operating Performance Outcomes for Australian Mergers. Journal of Applied Accounting, 168-180.
https://doi.org/10.1108/09675420810919720

AABFJ | Volume 11, no. 3, 2017
52
Lin, P. W. (2005). An Empirical Analysis of Bank Mergers and Cost Efficiency in Taiwan. Small Business Economics, 197-206. https://doi.org/10.1007/s11187-003-6451-y
Malhotra, S., & Zhu, P. (2006). Shareholder Benefits and Firm Performance: an Empirical Analysis of International Acquisitions by Firms from a Developing Economy. Working Paper Series, available at: www.ssrn.com.
Mantravadi, P., & Reddy, A. V. (2008). Type of Merger and Impact on Operating Performance: The Indian Experience. Economic and Political Weekly, 66-74.
Odeck, J. (2008). The Effect of Mergers on Efficiency and Productivity of Public Transport Services. Transportation Research Part A, 696–708.
https://doi.org/10.1016/j.tra.2007.12.004 Pawaskar, V. (2001). Effect of Mergers on Corporate Performance in India. Vikalpa, 19-32. Ramakrishnan, K. (2010). Mergers in Indian Industry: Performance and Impacting Factors.
Business Strategy Series, 261-268. https://doi.org/10.1108/17515631011063794 Ramaswany, K., & Waegelein, J. (2003). Firm Financial Performance Following Mergers.
Review of Quantitative Finance and Accounting, 115-126. https://doi.org/10.1023/A:1023089924640 Rehman, A. R., & Limmack, R. J. (2004). 'Corporate Acquisitions and the Operating
Performance of Malaysian Companies. Journal of Business Finance & Accounting, 359-400. https://doi.org/10.1111/j.0306-686X.2004.00543.x
Rezitis, A. N. (2008). Efficiency and Productivity Effects of Bank Mergers: Evidence from the Greek Banking Industry. Economic Modelling, 236–254.
https://doi.org/10.1016/j.econmod.2007.04.013 Salmi, T., Dahlstedt , R., & Luoma , M. (1998). Financial Ratios as Predictors of Firms' Industry
Branch. The Finnish Journal of Business Economics, 263-277. Sufian, F. (2004). The Efficiency Effects of Bank Mergers and Acquisitions in a Developing
Economy: Evidence from Malaysia. International Journal of Applied Econometrics and Quantitative Studies, 53-74.
Tarawneg, M. (2006). A Comparison of Financial Performance in the Banking Sector: Some Evidence from Omani Commercial Banks. . International Research Journal of Finance and Economics, 103-112.
Thomson Reuters. (2013). Mergers & Acquisitions Review. New York: Thomson Reuters Publisher.
Toyne, M. F., & Tripp, J. D. (1998). Interstate Bank Mergers and Their Impact on Shareholder Returns: Evidence from the 1990s. Quarterly Journal of Business and Economics, 48-58.
Tse, T., & Soufani, K. (2001). Wealth Effect of Takeovers in Merger Activity Eras: Empirical Evidence from the UK. International Journal of Economics of Business, 365-377.
https://doi.org/10.1080/13571510110079829 Vallascas, F., & Hagendorff, J. (2011). The Impact of European Bank Mergers on Bidder
Default Risk. Journal of Banking & Finance, 902-915. https://doi.org/10.1016/j.jbankfin.2010.09.001 Vennet, R. V. (1996). The Effect of Mergers and Acquisitions on the Efficiency and
Profitability of EC Credit Institutions. Journal of Banking and Finance, 1531-1558. https://doi.org/10.1016/S0378-4266(96)00014-3 Wen, L. P. (2002). The Efficiency of Commercial Bank Mergers inTaiwan: An Envelopment
Analysis. International Journal of Management, 154-164. Worthington, A. C. (2001). Efficiency in Pre-Merger and Post-Merger Non-Bank Financial
Institutions. Managerial and Decision Economics, 439–452.

Shah & Khan | Impacts of Mergers and Acquisitions on Acquirer Banks’ Performance
53
https://doi.org/10.1002/mde.1033 Yeh, T., & Hoshino, Y. (2002). Productivity and Operating Performance of Japanese
MergingFirms: Keiretsu-Related and Independent Mergers. Japan and the World Economy, 347-366. https://doi.org/10.1016/S0922-1425(01)00081-0
Yuce, A., & Ng., A. (2005). Effects of Private and Public Canadian Mergers. Journal of Administrative Sciences, 111-124. https://doi.org/10.1111/j.1936-4490.2005.tb00713.x

AABFJ | Volume 11, no. 3, 2017
54
ANNEXURE
Annexure-A: List of Mergers and Acquisitions (2002-2011)
Sr #
Acquired Acquirer Acquired date
01 Al- Faysal Investment Ltd. Faysal Bank Ltd 10-01-2002 02 KASB & Company Ltd. KASB Bank Ltd. 04-05-2003 03 Crescent Investment Bank Ltd. Mashreq Bank Pakistan Ltd. 09-06-2003 04 KASB Leasing Ltd. KASB Bank Ltd. 10-03-2004 05 Trust Commercial Bank Ltd Crescent Commercial Bank Ltd. 18-10-2004 06 Ibrahim Leasing Ltd. Allied Bank Ltd. 31-05-2005 07 Atlas Investment Bank Ltd. Atlas Bank Ltd. 26-07-2006 08 First Allied Bank Modaraba Allied Bank Ltd. 25-08-2006 09 Union Bank Ltd. Standard Chartered Bank (Pakistan)
Ltd. 29-12-2006
10 Jahangir Siddiqui Investment Bank Ltd.
JS Bank Ltd. 30-12-2006
11 International Housing Finance Ltd. KASB Bank Ltd. 22-11-2007 12 Pakistan Industrial Credit &
Investment Corporation Ltd. NIB Bank Ltd. 01-01-2008
13 PICIC Commercial Bank Ltd. NIB Bank Ltd. 01-01-2008 14 Network Leasing Corporation Ltd. KASB Bank Ltd. 17-02-2009 15 Askari Leasing Ltd. Askari Bank Ltd. 10-03-2010 16 The Royal Bank of Scotland Ltd. Faysal Bank Ltd. 03-01-2011 17 Atlas Bank Ltd. Summit Bank Ltd. 11-01-2011 18 MyBank Ltd. Summit Bank Ltd. 06-07-2011
(Source: http://www.kse.com.pk)