Impacts of aviation fuel sulfur content on climate and ... · 10522 Z. Z. Kapadia et al.: Impacts...
21
Atmos. Chem. Phys., 16, 10521–10541, 2016 www.atmos-chem-phys.net/16/10521/2016/ doi:10.5194/acp-16-10521-2016 © Author(s) 2016. CC Attribution 3.0 License. Impacts of aviation fuel sulfur content on climate and human health Zarashpe Z. Kapadia 1,2 , Dominick V. Spracklen 2 , Steve R. Arnold 2 , Duncan J. Borman 3 , Graham W. Mann 2,4 , Kirsty J. Pringle 2 , Sarah A. Monks 2,a,b , Carly L. Reddington 2 , François Benduhn 5 , Alexandru Rap 2 , Catherine E. Scott 2 , Edward W. Butt 2 , and Masaru Yoshioka 2 1 Doctoral Training Centre in Low Carbon Technologies, Energy Research Institute, School of Process Environmental and Materials Engineering, University of Leeds, Leeds, UK 2 Institute for Climate and Atmospheric Science, School of Earth and Environment, University of Leeds, Leeds, UK 3 Centre for Computational Fluid Dynamics, School of Civil Engineering, University of Leeds, Leeds, UK 4 National Centre for Atmospheric Science, School of Earth and Environment, University of Leeds, Leeds, UK 5 Institute for Advanced Sustainability Studies, Potsdam, Germany a now at: Cooperative Institute for Research in Environmental Sciences, University of Colorado, Boulder, Colorado, USA b now at: Chemical Sciences Division, NOAA Earth System Research Laboratory, Boulder, Colorado, USA Correspondence to: Zarashpe Z. Kapadia ([email protected]) Received: 5 May 2015 – Published in Atmos. Chem. Phys. Discuss.: 10 July 2015 Revised: 28 May 2016 – Accepted: 7 June 2016 – Published: 24 August 2016 Abstract. Aviation emissions impact both air quality and cli- mate. Using a coupled tropospheric chemistry-aerosol micro- physics model we investigate the effects of varying aviation fuel sulfur content (FSC) on premature mortality from long- term exposure to aviation-sourced PM 2.5 (particulate matter with a dry diameter of < 2.5 μm) and on the global radiation budget due to changes in aerosol and tropospheric ozone. We estimate that present-day non-CO 2 aviation emissions with a typical FSC of 600 ppm result in ∼ 3600 [95 % CI: 1310–5890] annual premature mortalities globally due to in- creases in cases of cardiopulmonary disease and lung cancer, resulting from increased surface PM 2.5 concentrations. We quantify the global annual mean combined radiative effect (RE comb ) of non-CO 2 aviation emissions as -13.3 mW m -2 ; from increases in aerosols (direct radiative effect and cloud albedo effect) and tropospheric ozone. Ultra-low sulfur jet fuel (ULSJ; FSC = 15 ppm) has been proposed as an option to reduce the adverse health im- pacts of aviation-induced PM 2.5 . We calculate that swap- ping the global aviation fleet to ULSJ fuel would re- duce the global aviation-induced mortality rate by ∼ 620 [95 % CI: 230–1020] mortalities a -1 and increase RE comb by +7.0 mW m -2 . We explore the impact of varying aviation FSC between 0 and 6000 ppm. Increasing FSC increases aviation-induced mortality, while enhancing climate cooling through increas- ing the aerosol cloud albedo effect (CAE). We explore the relationship between the injection altitude of aviation emis- sions and the resulting climate and air quality impacts. Com- pared to the standard aviation emissions distribution, re- leasing aviation emissions at the ground increases global aviation-induced mortality and produces a net warming ef- fect, primarily through a reduced CAE. Aviation emissions injected at the surface are 5 times less effective at form- ing cloud condensation nuclei, reducing the aviation-induced CAE by a factor of 10. Applying high FSCs at aviation cruise altitudes combined with ULSJ fuel at lower altitudes results in reduced aviation-induced mortality and increased negative RE compared to the baseline aviation scenario. 1 Introduction Aviation is the fastest growing form of transport (Eyring et al., 2010; Lee et al., 2010; Uherek et al., 2010), with a pro- jected growth in passenger air traffic of 5 % yr -1 until 2030 (Barrett et al., 2012; ICAO, 2013), and a projected near dou- bling of emissions by 2025, relative to 2005 (Eyers et al., 2004). These emissions, and changes to them, have both cli- Published by Copernicus Publications on behalf of the European Geosciences Union.
Transcript of Impacts of aviation fuel sulfur content on climate and ... · 10522 Z. Z. Kapadia et al.: Impacts...
Atmos. Chem. Phys., 16, 10521–10541, 2016www.atmos-chem-phys.net/16/10521/2016/doi:10.5194/acp-16-10521-2016© Author(s) 2016. CC Attribution 3.0 License.
Impacts of aviation fuel sulfur content on climate and human healthZarashpe Z. Kapadia1,2, Dominick V. Spracklen2, Steve R. Arnold2, Duncan J. Borman3, Graham W. Mann2,4,Kirsty J. Pringle2, Sarah A. Monks2,a,b, Carly L. Reddington2, François Benduhn5, Alexandru Rap2,Catherine E. Scott2, Edward W. Butt2, and Masaru Yoshioka2
1Doctoral Training Centre in Low Carbon Technologies, Energy Research Institute, School of Process Environmental andMaterials Engineering, University of Leeds, Leeds, UK2Institute for Climate and Atmospheric Science, School of Earth and Environment, University of Leeds, Leeds, UK3Centre for Computational Fluid Dynamics, School of Civil Engineering, University of Leeds, Leeds, UK4National Centre for Atmospheric Science, School of Earth and Environment, University of Leeds, Leeds, UK5Institute for Advanced Sustainability Studies, Potsdam, Germanyanow at: Cooperative Institute for Research in Environmental Sciences, University of Colorado, Boulder,Colorado, USAbnow at: Chemical Sciences Division, NOAA Earth System Research Laboratory, Boulder, Colorado, USA
Correspondence to: Zarashpe Z. Kapadia ([email protected])
Received: 5 May 2015 – Published in Atmos. Chem. Phys. Discuss.: 10 July 2015Revised: 28 May 2016 – Accepted: 7 June 2016 – Published: 24 August 2016
Abstract. Aviation emissions impact both air quality and cli-mate. Using a coupled tropospheric chemistry-aerosol micro-physics model we investigate the effects of varying aviationfuel sulfur content (FSC) on premature mortality from long-term exposure to aviation-sourced PM2.5 (particulate matterwith a dry diameter of < 2.5 µm) and on the global radiationbudget due to changes in aerosol and tropospheric ozone.We estimate that present-day non-CO2 aviation emissionswith a typical FSC of 600 ppm result in ∼ 3600 [95 % CI:1310–5890] annual premature mortalities globally due to in-creases in cases of cardiopulmonary disease and lung cancer,resulting from increased surface PM2.5 concentrations. Wequantify the global annual mean combined radiative effect(REcomb) of non-CO2 aviation emissions as−13.3 mW m−2;from increases in aerosols (direct radiative effect and cloudalbedo effect) and tropospheric ozone.
Ultra-low sulfur jet fuel (ULSJ; FSC= 15 ppm) has beenproposed as an option to reduce the adverse health im-pacts of aviation-induced PM2.5. We calculate that swap-ping the global aviation fleet to ULSJ fuel would re-duce the global aviation-induced mortality rate by ∼ 620[95 % CI: 230–1020] mortalities a−1 and increase REcomb by+7.0 mW m−2.
We explore the impact of varying aviation FSC between0 and 6000 ppm. Increasing FSC increases aviation-induced
mortality, while enhancing climate cooling through increas-ing the aerosol cloud albedo effect (CAE). We explore therelationship between the injection altitude of aviation emis-sions and the resulting climate and air quality impacts. Com-pared to the standard aviation emissions distribution, re-leasing aviation emissions at the ground increases globalaviation-induced mortality and produces a net warming ef-fect, primarily through a reduced CAE. Aviation emissionsinjected at the surface are 5 times less effective at form-ing cloud condensation nuclei, reducing the aviation-inducedCAE by a factor of 10. Applying high FSCs at aviation cruisealtitudes combined with ULSJ fuel at lower altitudes resultsin reduced aviation-induced mortality and increased negativeRE compared to the baseline aviation scenario.
1 Introduction
Aviation is the fastest growing form of transport (Eyring etal., 2010; Lee et al., 2010; Uherek et al., 2010), with a pro-jected growth in passenger air traffic of 5 % yr−1 until 2030(Barrett et al., 2012; ICAO, 2013), and a projected near dou-bling of emissions by 2025, relative to 2005 (Eyers et al.,2004). These emissions, and changes to them, have both cli-
Published by Copernicus Publications on behalf of the European Geosciences Union.

10522 Z. Z. Kapadia et al.: Impacts of aviation fuel sulfur content on climate and human health
mate and air quality impacts (Lee et al., 2009; Barrett et al.,2010, 2012; Woody et al., 2011).
Aviation emits a range of gas-phase and aerosol pollu-tants that can influence climate. Emissions of carbon diox-ide (CO2) from aviation warm the climate (Lee et al., 2009,2010). Emissions of nitrogen oxides (NOx) warm the cli-mate through tropospheric ozone (O3) formation, which actsas a greenhouse gas, and cool climate via a decrease in thelifetime of the well-mixed greenhouse gas methane (CH4)
through increases in the OH radical (Holmes et al., 2011;Myhre et al., 2011). Sulfate and nitrate aerosols, formedfrom aviation sulfur dioxide (SO2) and NOx emissions andthrough altered atmospheric oxidants, lead to a cooling(Unger, 2011; Righi et al., 2013; Dessens et al., 2014), andblack carbon (BC) emissions result in a warming (Balkanskiet al., 2010). Additionally, the formation of persistent linearcontrails and contrail-cirrus from aircraft leads to warming(Lee et al., 2010; Rap et al., 2010; Burkhardt and Karcher,2011). Overall, aviation emissions are thought to have awarming impact on climate, with net radiative forcing (RF)estimated as +55 mW m−2 (excluding cirrus cloud enhance-ment) (Lee et al., 2010).
Previous studies have separately assessed the impacts ofaviation through different atmospheric species. Short-termO3 has been estimated to have a radiative effect ranging be-tween 6 and 36.5 mW m−2 (Sausen et al., 2005; Köhler etal., 2008; Hoor et al., 2009; Lee et al., 2009; Holmes etal., 2011; Myhre et al., 2011; Unger, 2011; Frömming etal., 2012; Skowron et al., 2013; Unger et al., 2013; Kho-dayari et al., 2014; Brasseur et al., 2016). The aerosol di-rect effect is highly uncertain [−28 to +20 mW m−2] (Righiet al., 2013), with the direct aerosol effects for sulfate rang-ing between −0.9 and −7 mW m−2 (Sausen et al., 2005; Fu-glestvedt et al., 2008; Lee et al., 2009; Balkanski et al., 2010;Unger, 2011; Gettelman and Chen, 2013; Brasseur et al.,2016), nitrate ranging between −4 and −7 mW m−2 (Ungeret al., 2013; Brasseur et al., 2016), BC ranging between 0.1and 0.3 mW m−2 (Sausen et al., 2005; Fuglestvedt et al.,2008; Lee et al., 2009; Balkanski et al., 2010; Unger, 2011;Gettelman and Chen, 2013; Unger et al., 2013; Brasseur etal., 2016), and for organic carbon (OC) ranging between−0.67 and −0.01 mW m−2 (Sausen et al., 2005; Fuglestvedtet al., 2008; Lee et al., 2009; Balkanski et al., 2010; Unger,2011; Gettelman and Chen, 2013; Unger et al., 2013). Fewstudies estimate the aerosol cloud albedo effect (aCAE)from aviation: Righi et al. (2013) assessed the aCAE to be−15.4± 10.6 mW m−2 while Gettelman and Chen (2013) es-timate −21± 11 mW m−2.
Aviation emissions can increase atmospheric concentra-tions of fine particulate matter with a dry diameter of< 2.5 µm (PM2.5). Short-term exposure to PM2.5 can exacer-bate existing respiratory and cardiovascular ailments, whilelong-term exposure can result in chronic respiratory and car-diovascular diseases, lung cancer, chronic changes in phys-iological functions and mortality (Pope et al., 2002; World
Health Organisation, 2003; Ostro, 2004). In the US avia-tion emissions are estimated to lead to adverse health ef-fects in ∼ 11 000 people (ranging from mortality, respiratoryailments and hospital admissions due to exacerbated respi-ratory conditions) and ∼ 23 000 work loss days per annum(Ratliff et al., 2009). Landing and take-off aviation emissionsincrease PM2.5 concentrations, particularly around airports(Woody et al., 2011), increasing US mortality rates by∼ 160per annum.
Previous studies have estimated the number of prematuremortalities due to exposure to pollution resulting from avia-tion emissions. Barrett et al. (2012, 2010) used the method-ology of Ostro (2004) to estimate that aviation emissionsare responsible for ∼ 10 000 premature mortalities a−1 dueto increases in cases of cardiopulmonary disease and lungcancer. Yim et al. (2015) using the same methodology butwith the inclusion of the Rapid Dispersion Code (RDC)to simulate the local air quality impacts of aircraft groundlevel emissions estimated 13 920 (95 % CI: 7220–20 880)mortalities a−1. Morita et al. (2014), using the integratedexposure–response (IER) model from Burnett et al. (2014)to derive relative risk (RR), estimate that aviation results in405 (95 % CI: 182–648) mortalities a−1 due to increases incases of lung cancer, stroke, ischemic heart disease, trachea,bronchus, and chronic obstructive pulmonary disease. Jacob-son et al. (2013) estimate 310 (95 % CI: −400 to 4300) mor-talities a−1 from aviation emissions due to cardiovascular ef-fects. Taking these studies in account, the different method-ologies applied and modes of mortality investigated aviationis estimated to be responsible for between 310 and 13 920mortalities a−1.
The introduction of cleaner fuels and pollution controltechnologies can improve ambient air quality and reduce ad-verse health effects of fossil fuel combustion (World HealthOrganisation, 2005). One proposed solution to reduce the ad-verse health effects of aviation-induced PM2.5 is the use ofultra-low sulfur jet fuel (ULSJ), reducing the formation ofsulfate aerosol (Barrett et al., 2012, 2010; Ratliff et al., 2009;Hileman and Stratton, 2014). ULSJ fuels typically have a fuelsulfur content (FSC) of 15 ppm, compared with an FSC ofbetween 550 and 750 ppm in standard aviation fuels (Bar-rett et al., 2012). The current global regulatory standard foraviation fuel is a maximum FSC of 3000 ppm (Ministry ofDefence, 2011; ASTM International, 2012).
Despite the potential for decreased emission of SO2, ap-plication of ULSJ fuel will not completely remove the im-pacts of aviation on PM2.5. It is estimated that over a half ofaviation-attributable surface-level sulfate is associated withoxidation of non-aviation SO2 by OH produced from avia-tion NOx emissions, and not directly produced from aviation-emitted SO2 (Barrett et al., 2010). Therefore, even a com-pletely desulfurized global aviation fleet would likely con-tribute a net source of sulfate PM2.5. Nevertheless, previ-ous work has shown that the use of ULSJ fuel reducesglobal aviation-induced PM2.5 by ∼ 23 %, annually avoid-
Atmos. Chem. Phys., 16, 10521–10541, 2016 www.atmos-chem-phys.net/16/10521/2016/
Z. Z. Kapadia et al.: Impacts of aviation fuel sulfur content on climate and human health 10523
ing ∼ 2300 (95 % CI: 890–4200) mortalities (Barrett et al.,2012).
Altering the sulfur content of aviation fuel also modifiesthe net climate impact of aviation emissions. A reduction infuel sulfur content reduces the formation of cooling sulfateaerosols (Unger, 2011; Barrett et al., 2012), increasing thenet warming effect of aviation emissions. The roles of sul-fate both in climate cooling and in increasing surface PM2.5concentrations mean that policy makers must consider bothhealth and climate when considering effects from potentialreductions in sulfur emissions from a given emissions sector(Fiore et al., 2012).
In this study, we investigate the impacts of changes inthe sulfur content of aviation fuel on climate and humanhealth. A coupled tropospheric chemistry-aerosol micro-physics model is used to quantify global atmospheric re-sponses in aerosol and O3 to varying FSC scenarios. Radia-tive effects due to changes in tropospheric O3 and aerosolsare calculated using a radiative transfer model, while the im-pacts of changes in surface PM2.5 on human health are esti-mated using concentration response functions. Using a cou-pled tropospheric chemistry-aerosol microphysics model thatincludes nitrate aerosol allows us to assess the impacts of ni-trate and aerosol indirect effects in addition to the ozone andaerosol direct effects that have been more routinely calcu-lated.
2 Methods
2.1 Coupled chemistry-aerosol microphysics model
2.1.1 Model description
We use GLOMAP-mode (Mann et al., 2010), embeddedwithin the 3-D off-line Eulerian chemical transport modelTOMCAT (Arnold et al., 2005; Chipperfield, 2006). Me-teorology (wind, temperature and humidity) and large-scale transport is specified from interpolation of 6-hourlyEuropean Centre for Medium Range Weather Forecasts(ECMWF) reanalysis (ERA-40) fields (Chipperfield, 2006;Mann et al., 2010). Cloud fraction and cloud top pressurefields are taken from the International Satellite Cloud Cli-matology Project (ISCCP-D2) archive for the year 2000(Rossow and Schiffer, 1999).
GLOMAP-mode is a two-moment aerosol microphysicsscheme representing particles as an external mixture ofseven size modes (four soluble and three insoluble) (Mann etal., 2010). We use the nitrate-extended version of GLOMAP-mode (Benduhn et al., 2016) which, as well as tracking size-resolved sulfate, BC, OC, sea-salt and dust components, alsoincludes a dissolution solver to accurately characterise thesize-resolved partitioning of ammonia and nitric acid intoammonium and nitrate components in each soluble mode.Aerosol components are assumed to be internally mixed
within each mode. GLOMAP-mode includes representationsof nucleation, particle growth via coagulation, condensationand cloud processing, wet and dry deposition, and in- andbelow-cloud scavenging (Mann et al., 2010).
TOMCAT includes a tropospheric gas-phase chemistryscheme (inclusive of Ox-NOy-HOx), treating the degrada-tion of C1-C3 non-methane hydrocarbons (NMHCs) and iso-prene, together with a sulfur chemistry scheme (Spracklenet al., 2005; Breider et al., 2010; Mann et al., 2010). Thetropospheric chemistry is coupled to aerosol as described inBreider et al. (2010).
The nitrate-extended version of the TOMCAT-GLOMAP-mode coupled model used in this investigation employs a hy-brid solver to simulate the dissolution of semi-volatile inor-ganic gases (such as H2O, HNO3, HCl and NH3) into theaerosol-liquid-phase.
Emissions of DMS are calculated using monthly meansea-water concentrations of DMS from (Kettle and Andreae,2000), driven by ECMWF winds and sea-air exchange pa-rameterisations from Nightingale et al. (2000). Emissions ofSO2 are included from both continuous (Andres and Kasg-noc, 1998) and explosive volcanoes (Halmer et al., 2002),and wildfires for year 2000 (Van Der Werf et al., 2003; Den-tener et al., 2006). Anthropogenic SO2 emissions (includingindustrial, power plant, road transport, off-road transport andshipping sectors) are representative of the year 2000 (Co-fala et al., 2005). Emissions of monoterpenes and isopreneare from Guenther et al. (1995). NH3 emissions are from theEDGAR inventory (Bouwman et al., 1997). NOx emissionsare considered from anthropogenic (Lamarque et al., 2010),natural (Lamarque et al., 2005) and biomass burning (van derWerf et al., 2010) sources.
Annual mean emissions of BC and OC aerosol from fos-sil fuel and biofuel combustion are from Bond et al. (2004).Monthly wildfire emissions are taken from the GFED v1(Global Fire Emissions Database) for the year 2000 (Van DerWerf et al., 2003). For primary aerosol emissions we use ge-ometric mean diameters (Dg) with standard deviations as de-scribed by Mann et al. (2010).
Here, we ran simulations at a horizontal resolution of2.8◦× 2.8◦ with 31 hybrid σ -p levels extending from the sur-face to 10 hPa. All simulations were conducted for 16 monthsfrom September 1999 to December 2000 inclusive, with thefirst 4 months discarded as spin-up time.
2.1.2 Model evaluation
GLOMAP has been extensively evaluated against obser-vations including comparisons of speciated aerosol mass(Mann et al., 2010; Spracklen et al., 2011b), aerosol number(Mann et al., 2010; Spracklen et al., 2010) and cloud conden-sation nuclei (CCN) concentrations (Spracklen et al., 2011a).TOMCAT simulated fields have been evaluated against ob-servations, with CO and O3 evaluated against aircraft ob-servations (Arnold et al., 2005), Mediterranean summertime
www.atmos-chem-phys.net/16/10521/2016/ Atmos. Chem. Phys., 16, 10521–10541, 2016

10524 Z. Z. Kapadia et al.: Impacts of aviation fuel sulfur content on climate and human health
ozone against satellite observations (Richards et al., 2013),along with O3 evaluated against satellite observations (Chip-perfield et al., 2015). Benduhn et al. (2016) shows that simu-lated surface concentrations of NO3 and NH4 are in reason-able agreement with observations in Europe, the US and EastAsia. Here we focus our evaluation on the aerosol verticalprofile as well as nitrate aerosol which has not been evalu-ated previously.
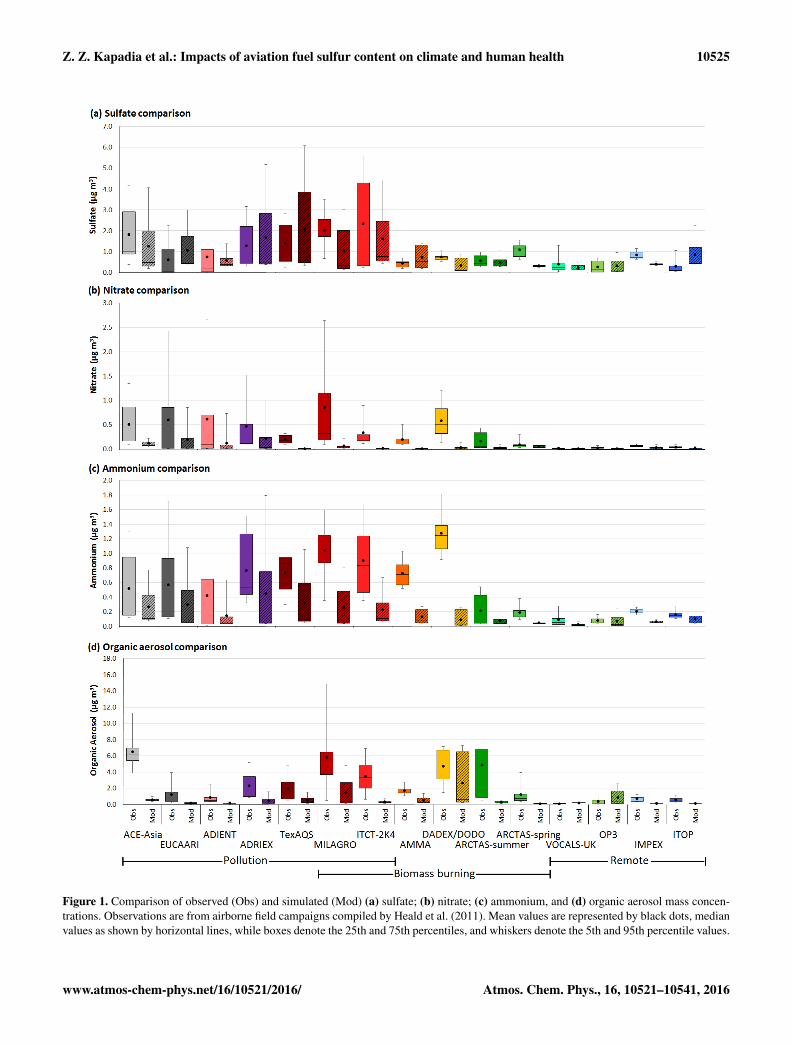
Figure 1 presents simulated sulfate, nitrate, ammoniumand organic aerosol mass concentrations in comparison toairborne observations compiled by Heald et al. (2011). Thesupplementary information presents the flight paths of eachof the aircraft field campaigns used in the study compiled byHeald et al. (2011) (Fig. S1 in the Supplement), and detailsof each of the aircraft field campaigns used (Table S1 in theSupplement). Observations were predominantly made usingan Aerodyne aerosol mass spectrometer (AMS). Simulatedprofiles are for year 2000, while observational aerosol pro-files are from field campaigns conducted between 2001 and2008.
Overall we find the model overestimates sulfates[NMB=+16.9 %], while underestimating nitrates[NMB=−60.7 %], ammonium [NMB=−47.1 %] andorganic aerosols (OA) [NMB=−56.2 %]. Model skillvaries depending on the conditions affecting each fieldcampaign. To explore this, we use the broad stratifica-tion of the field campaigns into anthropogenic pollution,biomass burning and remote conditions as used by Heald etal. (2011) and shown in Fig. 1. The model underestimatesaerosol concentrations in biomass burning regions [sulfateNMB=−14.9 %; nitrate NMB=−79.4 %; ammoniumNMB=−68.7 %, and; OA NMB=−74.5 %]. The modelperforms better in polluted [sulfate NMB=+31.6 %;nitrate NMB=−56.2 %; ammonium NMB=−28.6 %,and; OA NMB=−40.9 %], and remote regions [sulfateNMB=+25.4 %; nitrate NMB=−6.4 %; ammoniumNMB=−20.2 %, and; OA NMB=−41.5 %].
The overestimation of sulfate aerosol is likely due to thedecline in anthropogenic SO2 emissions in Europe and theUS between 2000 and 2008 (Vestreng et al., 2007; Handet al., 2012). An underestimation of OA has been reportedpreviously (Heald et al., 2011; Spracklen et al., 2011b) andis likely due to an underestimate in SOA formation in themodel. Whitburn et al. (2015) found biomass burning emis-sions of NH3 may be underestimated which would affect anumber of our comparisons.
The model underestimation of organic and inorganicaerosol components in biomass burning influenced re-gions could partly be due to very concentrated plumes inthese regions affecting campaign mean concentrations. Thereis a large uncertainty in biomass burning emissions and someevidence that they may be underestimated (Kaiser et al.,2012), which may contribute to the model bias. Biomassburning emissions also have large interannual variability (vander Werf et al., 2010; Wiedinmyer et al., 2011), meaning
that using year-specific emissions might improve compari-son against observations in these regions. Underestimationin Arctic inorganic aerosol, which will affect the ARCTAScomparisons, is a well-known problem in models, likelyrelated to problems with model wet deposition and emis-sions (Shindell et al., 2008; Eckhardt et al., 2015). Themodel underestimate over West Africa (AMMA, DADEXand DODO campaigns) is likely due to a combination oferrors in biomass burning emissions and poorly constrainedemission sources from anthropogenic activity (Knippertz etal., 2015).
Figure 2 presents simulated ozone concentration pro-files in comparison to ozonesonde observations compiled byTilmes et al. (2012). Observations were compiled from threenetworks, comprising 41 stations with continuous samplingfrom 1995 to 2011: (i) The World Ozone and Ultraviolet DataCenter (WOUDC) (http://www.woudc.org/); (ii) the GlobalMonitoring Division (GMD), and (iii) The Southern Hemi-sphere ADditional OZonesondes (SHADOZ) (Tilmes et al.,2012).
Regional model-observation comparison profiles pre-sented in Fig. 2 demonstrate good agreement between themodel and ozonesonde profiles, while demonstrating re-gional variations driven by variations in tropopause height,showing no evidence of systematic model bias in the uppertroposphere. Notable differences are seen between simulatedand observed ozone profiles over the Praha launch site inWestern Europe, with the model greatly overestimating ob-served ozone.
Evaluation of ozone model bias is conducted for the tropo-sphere, using a chemical tropopause definition of 150 ppbvozone, as previously used by Stevenson et al. (2013), Younget al. (2013) and Rap et al. (2015). We find the model overes-timates global ozone concentrations [NMB=+ 7.0 %] withoverestimates in Western Europe [+18.9 %] and the North-ern Hemisphere Polar West [NMB=+14.4 %] regions andunderestimates over the Atlantic/Africa [NMB=−11.0 %]and Southern Hemisphere Polar [NMB=−4.6 %] regions.
Differences between model and observational profiles canin part be explained by the differences in years of simulationand observation, a poor representation of deep convection re-sulting in model underestimations in the tropics and overesti-mations downwind (Thompson et al., 1997), in tandem withreductions in anthropogenic NOx emissions over this timeperiod (Konovalov et al., 2008).
2.2 Aviation emissions
Aircraft emit NOx , carbon monoxide (CO), SO2, BC, OCand hydrocarbons (HCs). The historical emissions data setfor the CMIP5 (5th Coupled Model Intercomparison Project)model simulations used by the IPCC 5th Assessment Reportonly included NOx and BC aviation emissions (Lamarque etal., 2009). Recently there have been efforts to add HCs, COand SO2 emissions to aviation emission inventories (Eyers et
Atmos. Chem. Phys., 16, 10521–10541, 2016 www.atmos-chem-phys.net/16/10521/2016/
Z. Z. Kapadia et al.: Impacts of aviation fuel sulfur content on climate and human health 10525
Figure 1. Comparison of observed (Obs) and simulated (Mod) (a) sulfate; (b) nitrate; (c) ammonium, and (d) organic aerosol mass concen-trations. Observations are from airborne field campaigns compiled by Heald et al. (2011). Mean values are represented by black dots, medianvalues as shown by horizontal lines, while boxes denote the 25th and 75th percentiles, and whiskers denote the 5th and 95th percentile values.
www.atmos-chem-phys.net/16/10521/2016/ Atmos. Chem. Phys., 16, 10521–10541, 2016

10526 Z. Z. Kapadia et al.: Impacts of aviation fuel sulfur content on climate and human health
Figure 2. Comparison of observed (solid lines) and simulated (dashed lines) ozone profiles. Observations are taken from ozonesonde obser-vations, and arranged by launch location regions according to Tilmes et al. (2012).
al., 2004; Quantify Integrated Project, 2005–2012; Wilker-son et al., 2010).
Here we develop a new 3-D civil aviation emissions dataset for the year 2000, based on CMIP5 historical aviationemissions (Lamarque et al., 2009). The new data set in-cludes emissions of NOx , CO, SO2, BC, OC, and HCs. Incontrast to existing data sets which provide a general emis-sions index for HCs (Eyers et al., 2004) we speciate HCs
as formaldehyde (HCHO), ethane (C2H6), propane (C3H8),methanol (CH3OH), acetaldehyde (CH3CHO), and acetone((CH3)2CO).
Table 1 describes our new emissions data set. NOx andBC emissions are taken directly from Lamarque et al. (2009).We calculate fuel burn from BC emissions data and the BCemissions index (Eyers et al., 2004) as used by Lamarque etal. (2009). Following DuBois and Paynter (2006), we assume
Atmos. Chem. Phys., 16, 10521–10541, 2016 www.atmos-chem-phys.net/16/10521/2016/
Z. Z. Kapadia et al.: Impacts of aviation fuel sulfur content on climate and human health 10527
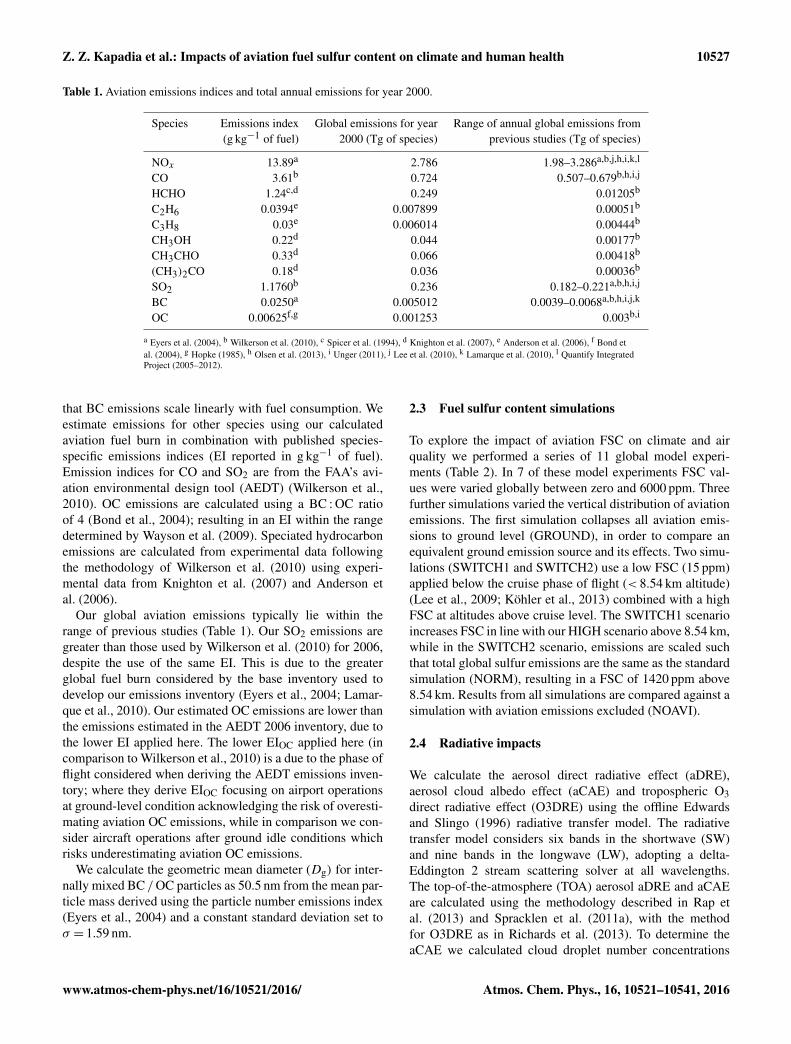
Table 1. Aviation emissions indices and total annual emissions for year 2000.
Species Emissions index Global emissions for year Range of annual global emissions from(g kg−1 of fuel) 2000 (Tg of species) previous studies (Tg of species)
NOx 13.89a 2.786 1.98–3.286a,b,j,h,i,k,l
CO 3.61b 0.724 0.507–0.679b,h,i,j
HCHO 1.24c,d 0.249 0.01205b
C2H6 0.0394e 0.007899 0.00051b
C3H8 0.03e 0.006014 0.00444b
CH3OH 0.22d 0.044 0.00177b
CH3CHO 0.33d 0.066 0.00418b
(CH3)2CO 0.18d 0.036 0.00036b
SO2 1.1760b 0.236 0.182–0.221a,b,h,i,j
BC 0.0250a 0.005012 0.0039–0.0068a,b,h,i,j,k
OC 0.00625f,g 0.001253 0.003b,i
a Eyers et al. (2004), b Wilkerson et al. (2010), c Spicer et al. (1994), d Knighton et al. (2007), e Anderson et al. (2006), f Bond etal. (2004), g Hopke (1985), h Olsen et al. (2013), i Unger (2011), j Lee et al. (2010), k Lamarque et al. (2010), l Quantify IntegratedProject (2005–2012).
that BC emissions scale linearly with fuel consumption. Weestimate emissions for other species using our calculatedaviation fuel burn in combination with published species-specific emissions indices (EI reported in g kg−1 of fuel).Emission indices for CO and SO2 are from the FAA’s avi-ation environmental design tool (AEDT) (Wilkerson et al.,2010). OC emissions are calculated using a BC : OC ratioof 4 (Bond et al., 2004); resulting in an EI within the rangedetermined by Wayson et al. (2009). Speciated hydrocarbonemissions are calculated from experimental data followingthe methodology of Wilkerson et al. (2010) using experi-mental data from Knighton et al. (2007) and Anderson etal. (2006).
Our global aviation emissions typically lie within therange of previous studies (Table 1). Our SO2 emissions aregreater than those used by Wilkerson et al. (2010) for 2006,despite the use of the same EI. This is due to the greaterglobal fuel burn considered by the base inventory used todevelop our emissions inventory (Eyers et al., 2004; Lamar-que et al., 2010). Our estimated OC emissions are lower thanthe emissions estimated in the AEDT 2006 inventory, due tothe lower EI applied here. The lower EIOC applied here (incomparison to Wilkerson et al., 2010) is a due to the phase offlight considered when deriving the AEDT emissions inven-tory; where they derive EIOC focusing on airport operationsat ground-level condition acknowledging the risk of overesti-mating aviation OC emissions, while in comparison we con-sider aircraft operations after ground idle conditions whichrisks underestimating aviation OC emissions.
We calculate the geometric mean diameter (Dg) for inter-nally mixed BC /OC particles as 50.5 nm from the mean par-ticle mass derived using the particle number emissions index(Eyers et al., 2004) and a constant standard deviation set toσ = 1.59 nm.
2.3 Fuel sulfur content simulations
To explore the impact of aviation FSC on climate and airquality we performed a series of 11 global model experi-ments (Table 2). In 7 of these model experiments FSC val-ues were varied globally between zero and 6000 ppm. Threefurther simulations varied the vertical distribution of aviationemissions. The first simulation collapses all aviation emis-sions to ground level (GROUND), in order to compare anequivalent ground emission source and its effects. Two simu-lations (SWITCH1 and SWITCH2) use a low FSC (15 ppm)applied below the cruise phase of flight (< 8.54 km altitude)(Lee et al., 2009; Köhler et al., 2013) combined with a highFSC at altitudes above cruise level. The SWITCH1 scenarioincreases FSC in line with our HIGH scenario above 8.54 km,while in the SWITCH2 scenario, emissions are scaled suchthat total global sulfur emissions are the same as the standardsimulation (NORM), resulting in a FSC of 1420 ppm above8.54 km. Results from all simulations are compared against asimulation with aviation emissions excluded (NOAVI).
2.4 Radiative impacts
We calculate the aerosol direct radiative effect (aDRE),aerosol cloud albedo effect (aCAE) and tropospheric O3direct radiative effect (O3DRE) using the offline Edwardsand Slingo (1996) radiative transfer model. The radiativetransfer model considers six bands in the shortwave (SW)and nine bands in the longwave (LW), adopting a delta-Eddington 2 stream scattering solver at all wavelengths.The top-of-the-atmosphere (TOA) aerosol aDRE and aCAEare calculated using the methodology described in Rap etal. (2013) and Spracklen et al. (2011a), with the methodfor O3DRE as in Richards et al. (2013). To determine theaCAE we calculated cloud droplet number concentrations
www.atmos-chem-phys.net/16/10521/2016/ Atmos. Chem. Phys., 16, 10521–10541, 2016
10528 Z. Z. Kapadia et al.: Impacts of aviation fuel sulfur content on climate and human health
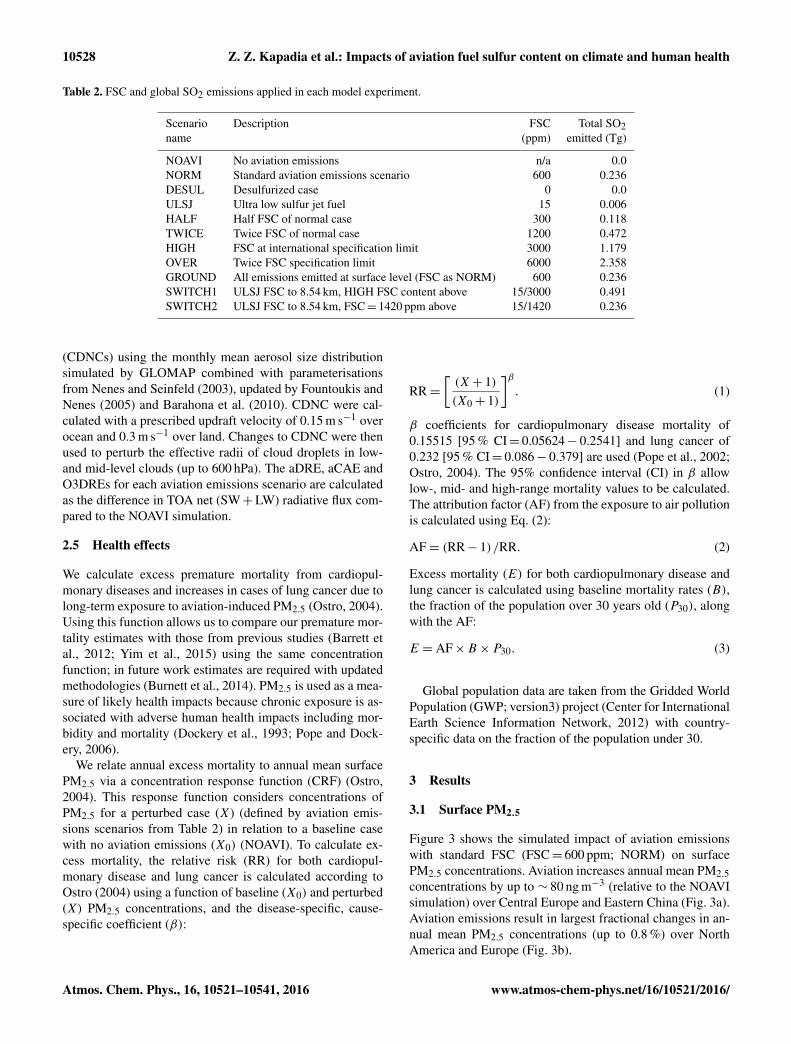
Table 2. FSC and global SO2 emissions applied in each model experiment.
Scenario Description FSC Total SO2name (ppm) emitted (Tg)
NOAVI No aviation emissions n/a 0.0NORM Standard aviation emissions scenario 600 0.236DESUL Desulfurized case 0 0.0ULSJ Ultra low sulfur jet fuel 15 0.006HALF Half FSC of normal case 300 0.118TWICE Twice FSC of normal case 1200 0.472HIGH FSC at international specification limit 3000 1.179OVER Twice FSC specification limit 6000 2.358GROUND All emissions emitted at surface level (FSC as NORM) 600 0.236SWITCH1 ULSJ FSC to 8.54 km, HIGH FSC content above 15/3000 0.491SWITCH2 ULSJ FSC to 8.54 km, FSC= 1420 ppm above 15/1420 0.236
(CDNCs) using the monthly mean aerosol size distributionsimulated by GLOMAP combined with parameterisationsfrom Nenes and Seinfeld (2003), updated by Fountoukis andNenes (2005) and Barahona et al. (2010). CDNC were cal-culated with a prescribed updraft velocity of 0.15 m s−1 overocean and 0.3 m s−1 over land. Changes to CDNC were thenused to perturb the effective radii of cloud droplets in low-and mid-level clouds (up to 600 hPa). The aDRE, aCAE andO3DREs for each aviation emissions scenario are calculatedas the difference in TOA net (SW+LW) radiative flux com-pared to the NOAVI simulation.
2.5 Health effects
We calculate excess premature mortality from cardiopul-monary diseases and increases in cases of lung cancer due tolong-term exposure to aviation-induced PM2.5 (Ostro, 2004).Using this function allows us to compare our premature mor-tality estimates with those from previous studies (Barrett etal., 2012; Yim et al., 2015) using the same concentrationfunction; in future work estimates are required with updatedmethodologies (Burnett et al., 2014). PM2.5 is used as a mea-sure of likely health impacts because chronic exposure is as-sociated with adverse human health impacts including mor-bidity and mortality (Dockery et al., 1993; Pope and Dock-ery, 2006).
We relate annual excess mortality to annual mean surfacePM2.5 via a concentration response function (CRF) (Ostro,2004). This response function considers concentrations ofPM2.5 for a perturbed case (X) (defined by aviation emis-sions scenarios from Table 2) in relation to a baseline casewith no aviation emissions (X0) (NOAVI). To calculate ex-cess mortality, the relative risk (RR) for both cardiopul-monary disease and lung cancer is calculated according toOstro (2004) using a function of baseline (X0) and perturbed(X) PM2.5 concentrations, and the disease-specific, cause-specific coefficient (β):
RR=[(X+ 1)(X0+ 1)
]β. (1)
β coefficients for cardiopulmonary disease mortality of0.15515 [95 % CI= 0.05624− 0.2541] and lung cancer of0.232 [95 % CI= 0.086− 0.379] are used (Pope et al., 2002;Ostro, 2004). The 95% confidence interval (CI) in β allowlow-, mid- and high-range mortality values to be calculated.The attribution factor (AF) from the exposure to air pollutionis calculated using Eq. (2):
AF= (RR− 1)/RR. (2)
Excess mortality (E) for both cardiopulmonary disease andlung cancer is calculated using baseline mortality rates (B),the fraction of the population over 30 years old (P30), alongwith the AF:
E = AF×B ×P30. (3)
Global population data are taken from the Gridded WorldPopulation (GWP; version3) project (Center for InternationalEarth Science Information Network, 2012) with country-specific data on the fraction of the population under 30.
3 Results
3.1 Surface PM2.5
Figure 3 shows the simulated impact of aviation emissionswith standard FSC (FSC= 600 ppm; NORM) on surfacePM2.5 concentrations. Aviation increases annual mean PM2.5concentrations by up to ∼ 80 ng m−3 (relative to the NOAVIsimulation) over Central Europe and Eastern China (Fig. 3a).Aviation emissions result in largest fractional changes in an-nual mean PM2.5 concentrations (up to 0.8 %) over NorthAmerica and Europe (Fig. 3b).
Atmos. Chem. Phys., 16, 10521–10541, 2016 www.atmos-chem-phys.net/16/10521/2016/

Z. Z. Kapadia et al.: Impacts of aviation fuel sulfur content on climate and human health 10529
Figure 3. Impact of aviation emissions (FSC= 600 ppm) on surface annual mean PM2.5 concentrations. (a) absolute (NORM–NOAVI) and(b) percentage changes. Boxes show the European (20–40◦ E, 35–66◦ N) and North American (146–56◦W, 29–72◦ N) regions.
Table 3. Global aviation-induced aerosol mass burdens for different emission scenarios. Values in parentheses show percentage changerelative to NORM case.
Scenario All components (Gg) Sulfates (Gg) Nitrates (Gg)
NORM 16.9 12.9 5.7ULSJ 12.4 (−26.8 %) 4.0 (−69.1 %) 5.9 (+4.5 %)DESUL 12.1 (−28.4 %) 3.7 (−71.6 %) 6.0 (+5.1 %)No NOx and SO2 2.0 (−88.3 %) 0.3 (−97.5 %) 0.1 (−97.9 %)
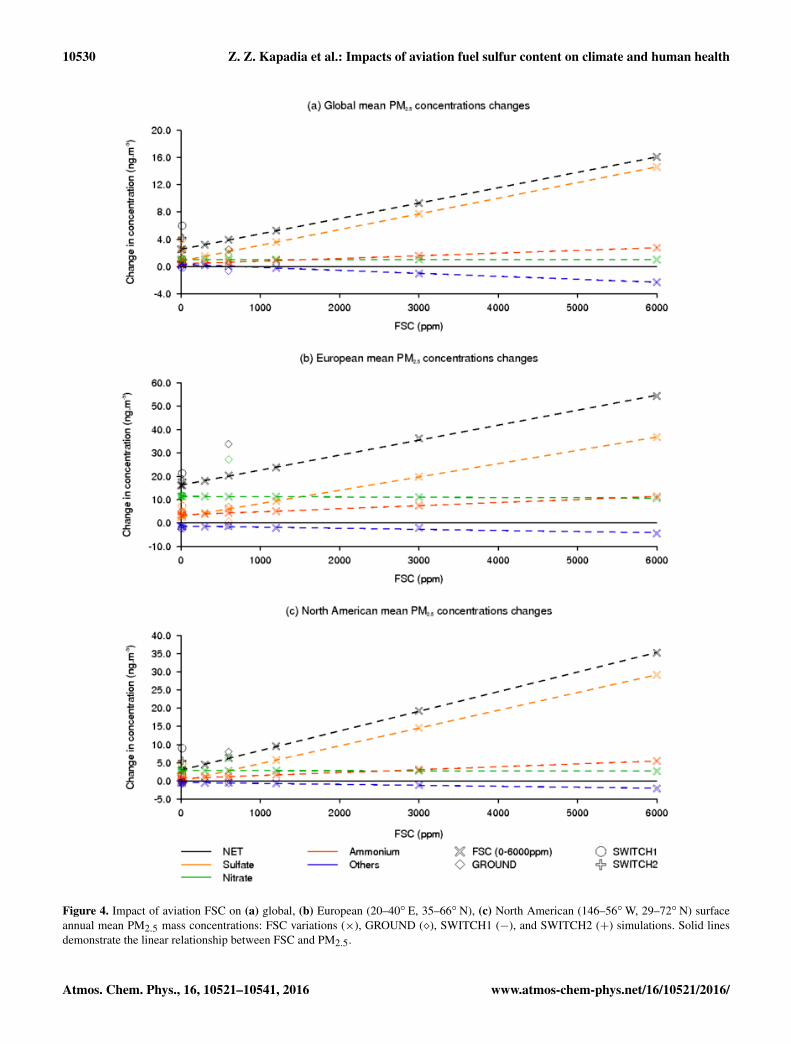
Figure 4 shows the impact of aviation emissions onglobal and regional mean PM2.5 concentrations as a func-tion of FSC. With standard FSC (FSC= 600 ppm), avia-tion increases global mean surface PM2.5 concentrations by3.9 ng m−3; with increases in PM2.5 dominated by sulfates[56.2 %], nitrates [26.0 %] and ammonium [16.0 %]. Avia-tion emissions increase European annual mean PM2.5 con-centrations by 20.3 ng m−3 (Fig. 4b), substantially more thanover North America (Fig. 4c) where an annual mean increaseof 6.3 ng m−3 is simulated. Increased PM2.5 is dominated bynitrates, both over Europe [55.5 %] and over North Amer-ica [44.4 %]. Sulfates contribute up to 44.6 % of increases inPM2.5 over North America, and 30.0 % over Europe.
The use of ULSJ fuel (FSC= 15 ppm) reduces global an-nual mean surface aviation-induced PM2.5 concentrations (inrelation to the NORM case) by 35.7 % [1.4 ng m−3] (Fig. 4);predominantly due to changes in sulfate [−1.4 ng m−3;−62.1 %] and ammonium [−0.2 ng m−3; −37.9 %], whichare marginally offset by very small increases in nitrates[+3.2× 10⁻³ ng m−3;+0.3 %]. Aviation emissions also leadto small changes to other aerosol components of +0.2 ng;which includes natural aerosols such as dust [+0.3 ng m−3;+61.8 %], sodium [−19.5 %] and chloride from sea salt[−19.5 %] with the changes due to changes in aerosollifetimes, along with changes in BC [−7.9 %] and OC[−19.3 %].
In comparison to the global mean, switchingto the use of ULSJ fuel in aviation larger ab-solute reductions in PM2.5 of −4.2 ng m−3 aresimulated over Europe [1sulfate=−3.4 ng m−3;1nitrate=+0.1 ng m−3; 1ammonium=−0.8 ng m−3;and 1others=−0.1 ng m−3] and of −3.4 ng m−3
over North America [1sulfate=−2.9 ng m−3;1nitrate=+0.02 ng m−3; 1ammonium=−0.5 ng m−3;and 1others=−0.01 ng m−3] (Fig. 4b, c). Over NorthAmerica, swapping to ULSJ fuel reduces aviation-inducedPM2.5 by 53.4 %, while a smaller reduction of 20.5 %is simulated over Europe. The smaller fractional changein PM2.5 over Europe is caused by smaller reductionsin aviation-induced sulfate [−55.9 %] and ammonium[−18.4 %] compared to over North America, which sees areduction in ammonium of 41.6 % and a reduction in sulfatesof 103 % indicating that over the US the ULSJ fuel scenariosees a reduction in sulfates in relation to a NOAVI scenario.
Complete desulfurization of jet fuel (FSC= 0 ppm;DESUL) reduces global mean aviation-induced surfacePM2.5 concentrations by 36.5 % [−1.43 ng m−3], withchanges in sulfates [−1.40 ng m−3; −63.5 %] and ammo-nium [−0.24 ng m−3; −38.8 %] dominating. Under this sce-nario the reductions in surface sulfate PM2.5 from aviationare 57.3 % over Europe and 105 % over North America.ULSJ fuel therefore gives similar results to complete desul-
www.atmos-chem-phys.net/16/10521/2016/ Atmos. Chem. Phys., 16, 10521–10541, 2016
10530 Z. Z. Kapadia et al.: Impacts of aviation fuel sulfur content on climate and human health
Figure 4. Impact of aviation FSC on (a) global, (b) European (20–40◦ E, 35–66◦ N), (c) North American (146–56◦W, 29–72◦ N) surfaceannual mean PM2.5 mass concentrations: FSC variations (×), GROUND (�), SWITCH1 (−), and SWITCH2 (+) simulations. Solid linesdemonstrate the linear relationship between FSC and PM2.5.
Atmos. Chem. Phys., 16, 10521–10541, 2016 www.atmos-chem-phys.net/16/10521/2016/

Z. Z. Kapadia et al.: Impacts of aviation fuel sulfur content on climate and human health 10531
Figure 5. Simulated differences in zonal annual mean sulfate (a) and nitrate (b) concentrations from the use of ULSJ fuel relative to standardfuel (ULSJ–NORM).
Figure 6. Estimated global aviation-induced mortality as a functionof FSC, and changes in vertical aviation emission distributions foryear 2000 (Shaded region denotes the 95 % confidence through ap-plication of low- and high-range cause-specific coefficients).
furization, due to the very small sulfur emission from ULSJfuel (Table 2).
In summary, increases in FSC result in increased surfacePM2.5, due to increased sulfate outweighing the small reduc-tions in nitrate. Simulated changes in sulfate, nitrate, ammo-nium and total PM2.5 are linear (R2> 0.99, p value< 0.001globally and for all individual regions) with respect to FSC(Fig. 4). Larger emission perturbations would likely lead toa non-linear response in atmospheric aerosol. The impactof variations in FSC on PM2.5 are regionally variable; overEurope changes in PM2.5 concentrations are observed to bemore sensitive to changes in FSC than over North America,and the global domain.
Figure 5 shows the impact of changing to ULSJ fuel onzonal mean sulfate and nitrate concentrations relative to stan-dard fuel (NORM). Table 3 reports the global aerosol bur-den from aviation under different emission scenarios. Withstandard FSC (FSC= 600 ppm), the global aviation-induced
aerosol burden is 16.9 Gg, dominated by sulfates (76.3 %)and nitrates (33.4 %). The use of ULSJ (FSC= 15 ppm) re-duces the global aerosol burden from aviation by 26.8 %.Complete desulfurization of aviation fuel reduces the globalaerosol burden from aviation by 28.4 %, with the global sul-fate burden from aviation reduced by 71.6 % (Table 3). Whenaviation emissions contain no sulfur, aviation-induced sul-fate is formed through aviation NOx-induced increases in OHconcentrations, resulting in the oxidation of SO2 from non-aviation sources (Unger et al., 2006; Barrett et al., 2010).
In line with previous work, we find that a substantial frac-tion of aviation sulfate can be attributed to aviation NOxemissions and not directly to aviation SO2 emissions. We es-timate that 36 % aviation-attributable sulfates formed at thesurface are associated with aviation NOx emissions, com-pared to ∼ 63 % estimated by Barrett et al. (2010) usingthe GEOS-Chem model (both estimates for FSC= 600 ppm).Differences between model estimates can be attributed to dif-ferences in model chemistry and microphysics, and differentaviation NOx emissions. We find desulfurization increasesthe aviation nitrate burden by 5.1 % (Table 3); although muchof this increase occurs at altitudes well above the surface(Fig. 5) and so is not reflected in surface PM2.5 concentra-tions.
We explored the impacts of NOx emission reductionsin combination with fuel desulfurization. A scenario withdesulfurized fuel and zero NOx emissions reduces the globalaviation-induced aerosol burden by 88.3 % (Table 3), incomparison to a desulfurized only case (DESUL), wherethe aviation-induced aerosol burden is reduced by 28.4 %.Removal of aviation NOx and SO2 emissions results in a95.0 % reduction in aviation-induced global mean surfacelevel aviation-induced PM2.5. These results imply that onlylimited sulfate reductions can be achieved through reducingFSC alone, with further reductions in aviation-induced PM2.5sulfates requiring additional controls on aviation NOx emis-sions.
www.atmos-chem-phys.net/16/10521/2016/ Atmos. Chem. Phys., 16, 10521–10541, 2016

10532 Z. Z. Kapadia et al.: Impacts of aviation fuel sulfur content on climate and human health
Figure 7. Impact of aviation emissions on low-cloud level (879 hPa) CCN (Dp > 50 nm) concentrations: (a) standard FSC (NORM–NOAVI)and (b) FSC= 15 ppm (ULSJ–NOAVI). Blue boxes define North American and European regions, and black boxes define Atlantic (60–14◦W, 1.4◦ S–60◦ N) and Pacific regions (135◦ E–121◦W, 15◦ S–60◦ N) referred to in the text.
3.2 Premature mortality
Figure 6 shows estimated annual premature mortalities (fromcardiopulmonary disease and lung cancer) due to aviation-induced changes in PM2.5 as a function of FSC. We estimatethat aviation emissions with standard FSC (FSC= 600 ppm)cause 3600 [95 % CI: 1310–5890] premature mortalities eachyear, with 3210 [95 % CI: 1160–5250] mortalities a−1 dueto increases in cases of cardiopulmonary disease and 390[95 % CI: 150–640] mortalities a−1 due to increases in casesof lung cancer. Low-, mid- and high-range cause-specificcoefficients (β) are used to account for uncertainty in thehealth impacts caused by exposure to PM2.5 (Sect. 2.5) (Os-tro, 2004). Our estimated global mortality due to aviationemissions is greatest in the Northern Hemisphere, which ac-counts for 98.7 % of global mortalities. Europe and NorthAmerica account for 42.3 and 8.4 % of mortality due to avi-ation emissions respectively.
Our estimate of the premature mortality due to aviationlies within the range of previous estimates (310–13 920 mor-talities a−1) (Barrett et al., 2010, 2012; Jacobson et al., 2013;Morita et al., 2014; Yim et al., 2004). Barrett et al. (2012)estimated ∼ 10 000 mortalities a−1 due to aviation, almosta factor of 3 higher than our central estimate. The greateraviation-induced mortality simulated by Barrett et al. (2012)can be attributed to greater aviation-induced surface PM2.5concentrations simulated in their study, particulary overhighly populated areas. Their study simulated maximumaviation-induced PM2.5 concentrations over Europe, easternChina and eastern North America greater than those in oursimulations by factors of 5 for Europe and eastern China and2.5 over eastern North America. Our aviation-induced sulfateconcentrations compare well with Barrett et al. (2012), indi-cating that the resulting differences in aviation-induced sur-face PM2.5 concentrations are a result of other aerosol com-ponents. Additionally, differences in mortality arise due to
the use of different cause-specific coefficients (β) within thesame CRF, as well as different population data sets. Moritaet al. (2014) estimate that aviation is responsible for 405[95 % CI: 182–648] mortalities a−1. This lower estimate isprimarily due to the mortality functions used, with Morita etal. (2014) using the integrated exposure response (IER) func-tion as described by Burnett et al. (2014). The IER functionconsiders a PM2.5 concentration below which there is no per-ceived risk, reducing estimated impacts of aviation in regionsof low PM2.5 concentrations.
We estimate that aviation emissions with ULSJ fuel resultin 2970 [95 % CI: 1080–4870] premature mortalities glob-ally per annum. Therefore, changing from standard FSC toULSJ would result in 620 [95 % CI: 230–1020] fewer prema-ture mortalities globally per annum; a reduction in aviation-induced mortalities of 17.4 %. Regionally we find the imple-mentation of an ULSJ fuel reduces annual mortality by 180over Europe and by 110 over North America.
Barrett et al. (2012) estimated that swapping to ULSJ fuelcould result in ∼ 2300 [95 % CI: 890–4200] fewer prema-ture mortalities globally per annum; a reduction of 23 %. Intheir work (using GEOS-Chem), the use of ULSJ reducesglobal mean PM2.5 concentrations (sulfates, nitrates and am-monium) by 0.89 ng m−3, less than the 1.61 ng m−3 reduc-tion in PM2.5 simulated here). Despite the greater reduc-tions in global mean surface layer PM2.5 concentrations sim-ulated here, Barrett et al. (2012) simulate greater reductionsin PM2.5 over populated regions, resulting in greater reduc-tions of aviation-induced mortality under the ULSJ scenario.Additionally, the GRUMPv1 population data set that Barrettet al. (2012) use resolves population data on a finer scalecompared to the resolution of GPWv3 population data setused here (Center for International Earth Science Informa-tion Network, 2012); differences which could contribute todifferences in estimates of mortality.
Atmos. Chem. Phys., 16, 10521–10541, 2016 www.atmos-chem-phys.net/16/10521/2016/
Z. Z. Kapadia et al.: Impacts of aviation fuel sulfur content on climate and human health 10533
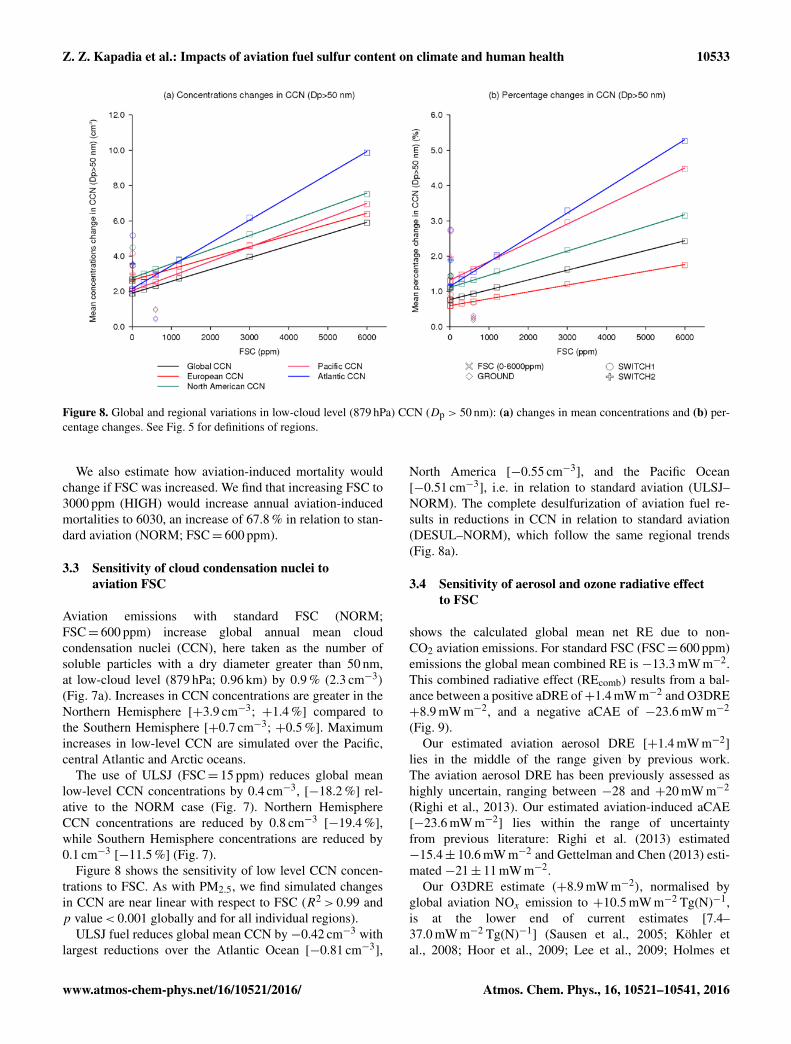
Figure 8. Global and regional variations in low-cloud level (879 hPa) CCN (Dp > 50 nm): (a) changes in mean concentrations and (b) per-centage changes. See Fig. 5 for definitions of regions.
We also estimate how aviation-induced mortality wouldchange if FSC was increased. We find that increasing FSC to3000 ppm (HIGH) would increase annual aviation-inducedmortalities to 6030, an increase of 67.8 % in relation to stan-dard aviation (NORM; FSC= 600 ppm).
3.3 Sensitivity of cloud condensation nuclei toaviation FSC
Aviation emissions with standard FSC (NORM;FSC= 600 ppm) increase global annual mean cloudcondensation nuclei (CCN), here taken as the number ofsoluble particles with a dry diameter greater than 50 nm,at low-cloud level (879 hPa; 0.96 km) by 0.9 % (2.3 cm−3)
(Fig. 7a). Increases in CCN concentrations are greater in theNorthern Hemisphere [+3.9 cm−3; +1.4 %] compared tothe Southern Hemisphere [+0.7 cm−3; +0.5 %]. Maximumincreases in low-level CCN are simulated over the Pacific,central Atlantic and Arctic oceans.
The use of ULSJ (FSC= 15 ppm) reduces global meanlow-level CCN concentrations by 0.4 cm−3, [−18.2 %] rel-ative to the NORM case (Fig. 7). Northern HemisphereCCN concentrations are reduced by 0.8 cm−3 [−19.4 %],while Southern Hemisphere concentrations are reduced by0.1 cm−3 [−11.5 %] (Fig. 7).
Figure 8 shows the sensitivity of low level CCN concen-trations to FSC. As with PM2.5, we find simulated changesin CCN are near linear with respect to FSC (R2> 0.99 andp value< 0.001 globally and for all individual regions).
ULSJ fuel reduces global mean CCN by−0.42 cm−3 withlargest reductions over the Atlantic Ocean [−0.81 cm−3],
North America [−0.55 cm−3], and the Pacific Ocean[−0.51 cm−3], i.e. in relation to standard aviation (ULSJ–NORM). The complete desulfurization of aviation fuel re-sults in reductions in CCN in relation to standard aviation(DESUL–NORM), which follow the same regional trends(Fig. 8a).
3.4 Sensitivity of aerosol and ozone radiative effectto FSC
shows the calculated global mean net RE due to non-CO2 aviation emissions. For standard FSC (FSC= 600 ppm)emissions the global mean combined RE is −13.3 mW m−2.This combined radiative effect (REcomb) results from a bal-ance between a positive aDRE of+1.4 mW m−2 and O3DRE+8.9 mW m−2, and a negative aCAE of −23.6 mW m−2
(Fig. 9).Our estimated aviation aerosol DRE [+1.4 mW m−2]
lies in the middle of the range given by previous work.The aviation aerosol DRE has been previously assessed ashighly uncertain, ranging between −28 and +20 mW m−2
(Righi et al., 2013). Our estimated aviation-induced aCAE[−23.6 mW m−2] lies within the range of uncertaintyfrom previous literature: Righi et al. (2013) estimated−15.4± 10.6 mW m−2 and Gettelman and Chen (2013) esti-mated −21± 11 mW m−2.
Our O3DRE estimate (+8.9 mW m−2), normalised byglobal aviation NOx emission to +10.5 mW m−2 Tg(N)−1,is at the lower end of current estimates [7.4–37.0 mW m−2 Tg(N)−1] (Sausen et al., 2005; Köhler etal., 2008; Hoor et al., 2009; Lee et al., 2009; Holmes et
www.atmos-chem-phys.net/16/10521/2016/ Atmos. Chem. Phys., 16, 10521–10541, 2016

10534 Z. Z. Kapadia et al.: Impacts of aviation fuel sulfur content on climate and human health
Figure 9. Aviation-induced radiative effects due to variations infuel sulfur content (FSC), the ground release of aviation emissions(GROUND), and variations in the vertical distribution of aviationSO2 emissions (SWITCH1 and SWITCH2 simulations).
al., 2011; Myhre et al., 2011; Unger, 2011; Frömminget al., 2012; Skowron et al., 2013; Unger et al., 2013;Khodayari et al., 2014). This can be attributed to thelower net O3 chemical production efficiency (OPE) withinour model (1.33). Unger (2011) estimated an O3DRE of7.4 mW m−2 Tg(N)−1 with a model OPE of ∼ 1, while theensemble of models considered by Myhre et al. (2011) havean OPE range of 1.5–2.4, resulting in an O3DRE range of16.2–25.4 mW m−2 Tg(N)−1.
We calculate that an aviation fleet utilising ULSJfuel would result in a global annual mean REcomb of−6.3 mW m−2 [aDRE=+1.8 mW m−2; aCAE= –16.8 mWm−2; and O3DRE=+8.7 mW m−2]. Thus, swapping fromstandard aviation fuel to ULSJ fuel reduces the net coolingeffect from aviation-induced aerosol and O3 by 7.0 mW m−2,in comparison to the reduction of 3.3 mW m−2 estimated byBarrett et al. (2012). In our model, this change is primarilydue a reduction in cooling from the aCAE of +6.7 mW m−2
combined with smaller contributions from an increasedaDRE of +0.4 mW m−2, and reduction in warming from theO3DRE of −0.12 mW m−2 (Fig. 9).
When we assume fully desulfurized aviation jet fuel(DESUL; FSC= 0 ppm), the REcomb induced by aviation-induced aerosol and O3 is very similar to that for ULSJ fueland is estimated as −6.1 mW m−2 [aDRE=+1.8 mW m−2;aCAE=−16.6 mW m−2; and O3DRE=+8.7 mW m−2].
Increases in FSC result in reductions in the aerosol DRE(aDRE), changing from a positive aerosol DRE for lowFSC scenarios, to a negative aerosol DRE for high FSC(FSC> 1200 ppm). As FSC is increased, we find the aCAEexhibits a larger cooling effect, i.e. becoming more nega-tive with increases in FSC, increasing by a factor ∼ 5 asFSC is increased from 0 to 6000 ppm. The REcomb is domi-nated by these changes to the aCAE. Increases in FSC from0 to 6000 ppm result in a greater negative (cooling) aviation-
Figure 10. Relationship between net radiative effect (sum of ozonedirect (O3DRE), aerosol direct radiative (aDRE) and aerosol cloudalbedo (aCAE) effects) and annual mortality rates: for low- mid-and high-range mortality sensitivities.
induced REcomb; increasing in magnitude by a factor of∼ 5 (−16.6 mW m−2 for FSC= 0 ppm to−82.1 mW m−2 forFSC= 6000 ppm) (Fig. 9). Therefore, we find that increasesin FSC provide a cooling effect due to the dominating effectfrom aviation-induced aCAE.
3.5 Relationship between aviation-induced radiativeeffects and mortality due to aviation non-CO2emissions
Figure 10 shows the net RE and premature mortal-ity for different aviation emission scenarios. Increasesin FSC lead to approximately linear increases in bothestimated mortality and the negative net RE. Wequantify the impact of FSC on mortality and REs interms of d(mortalities)/d(FSC) [mortalities ppm−1] andd(RE)/d(FSC) [mW m−2 ppm−1]. We calculate the sen-sitivity of global premature mortality to be 1.0 mortali-ties ppm−1 [95 % CI= 0.4 to 1.6 mortalities ppm−1, wherethe range is due to uncertainty in β]. The global meanREcomb has a sensitivity of −1.2× 10⁻² mW m−2 ppm−1,dominated by large changes to the aCAE[−1.1× 10⁻² mW m−2 ppm−1], and much smaller changesin the aDRE [−6.9× 10⁻⁴ mW m−2 ppm−1] and O3 RE[+4.4× 10⁻⁵ mW m−2 ppm−1].
The different slopes in the relationship between estimatedRE and mortality (Fig. 10) are driven by the range of coeffi-cients used in the CRF. This highlights the considerable un-certainty in the health impacts caused by exposure to PM2.5.We note that uncertainty in the RE due to aerosol and ozoneexists, but is not included in Fig. 9.
To assess how the vertical distributions of aviation SO2emissions influence human health and climate effects, weperformed three additional simulations where we altered thevertical distribution of aviation SO2 emissions (GROUND,SWITCH1 and SWITCH2 simulations). In these simulations
Atmos. Chem. Phys., 16, 10521–10541, 2016 www.atmos-chem-phys.net/16/10521/2016/

Z. Z. Kapadia et al.: Impacts of aviation fuel sulfur content on climate and human health 10535
the relationships between mortality and net RE deviate fromthe linear relationship seen when varying FSC between 0 and6000 ppm (Fig. 10).
In relation to the standard aviation emissions simula-tion (FSC= 600 ppm; NORM), when we release all avia-tion emissions at the surface (GROUND; FSC= 600 ppm)aviation-induced surface PM2.5 concentrations increase by+13.5 ng m−3 [+65.7 %] over Europe and by +1.7 ng m−3
[+27.1 %] over North America, but decrease by−1.4 ng m−3
[−36.7 %] globally (Fig. 4). Greater surface layer PM2.5perturbations (GROUND–NORM) over populated regionsincrease aviation-induced annual mortality by +22.9 %[+830 mortalities a−1] (Fig. 6).
Releasing aviation emissions at the surface (GROUNDcase) increases global mean cloud level CCN by only0.4 cm−3 relative to NOAVI; providing a reduction inCCN of 82.1 % [−1.89 cm−3] relative to the NORM case(i.e. GROUND–NORM). That is, injecting aviation emis-sions into the free troposphere in the standard scenariois over 5 times more efficient at increasing CCN con-centrations compared to when the same emissions are re-leased at the surface [GROUND CCN= 0.4 cm−3; NORMCCN= 2.3 cm−3]; both in relation to the NOAVI scenario.Similar behaviour has been demonstrated previously for vol-canic SO2 emissions by Schmidt et al. (2012), where vol-canic SO2 emissions injected into the free troposphere (FT)were more than twice as effective at producing new CCNcompared to boundary layer emissions of DMS. Injection ofaviation SO2 emissions at the surface will increase both de-position rates and aqueous phase oxidation of SO2; the latterresulting in the growth of existing CCN, but not the forma-tion of new CCN. In contrast, when SO2 is emitted into theFT the dominant oxidation mechanism is to H2SO4, leadingto the formation of new CCN through particle formation andthe condensational growth of particles to larger sizes. Subse-quent entrainment of these new particles into the lower atmo-sphere results in enhanced CCN concentrations in low-levelclouds. Reduced CCN formation when aviation emissionsare injected at the surface has implications for the aCAE.When aviation emissions are released at the surface we cal-culate an aCAE of −2.3 mW m−2; a factor of 10 smallerthan the standard aviation scenario. This demonstrates thatlow-level CCN concentrations and the aCAE are particularlysensitive to aviation emissions, because of the efficient for-mation of CCN when SO2 emissions are injected into theFT. Injecting aviation emissions at the surface also results inan increase in the aDRE of +5.9 mW m−2, resulting in anREcomb of +5.0 mW m−2 (Fig. 9).
Surface O3 concentrations are also less sensitive to avia-tion when emissions are located at the surface. Global meanaviation-induced surface O3 concentrations are reduced from0.15 ppbv (NORM) to 0.03 ppbv when all emissions are inthe surface layer. Releasing aviation emissions at the surfacealso reduces the global O3 burden by 3.1 Tg. These perturba-tions in O3 concentrations result in a reduction in the O3 ra-
diative effect from+8.9 mW m−2 (NORM; FSC= 600 ppm)to+1.5 mW m−2 (GROUND; FSC= 600 ppm) (Fig. 9). Thisis a reflection of increases in the OPE of NOx with increasesin altitude due to lower background NOx and NMHC (non-methane hydrocarbon) concentrations (Köhler et al., 2008;Stevenson and Derwent, 2009; Snijders and Melkers, 2011;Skowron et al., 2013).
We investigated altering FSC between the take-off/landingand the cruise phases of flight using two scenarios(SWITCH1 and SWITCH2) (Table 2). Our SWITCH1 sce-nario increases global mean aviation-induced surface layerPM2.5 concentrations by +2.1 ng m−3 [52.2 %], Europeanmean concentrations by +0.9 ng m−3 [+4.5 %], and NorthAmerican concentrations by+2.7 ng m−3 [+42.2 %] relativeto NORM (Fig. 4). These changes increase aviation-inducedmortality by +17.4 % [+630 mortalities a−1] (Fig. 6). Thisscenario results in greater global mean increases in CCN(relative to NORM) of +1.2 cm−3 [+51.2 %], a largercooling aCAE [−42.4 mW m−2], larger warming aDRE[2.07 mW m−2], resulting in additional −18.1 mW m−2
[136 %] of aviation-induced cooling [SWITCH1 REcomb of−31.4 mW m−2].
The SWITCH2 scenario was designed to have the sameglobal total sulfur emission as the normal aviation simu-lation. SWITCH2 increased global mean surface aviation-induced PM2.5 concentrations by +0.3 ng m−3 [+6.6 %],but reduces mean surface PM2.5 concentrations over Europe[−1.8 ng m−3; −8.7 %] and North America [−0.8 ng m−3;−12.8 %] compared to NORM. Under this scenario globalaviation-induced mortality is decreased by 2.4 % [−90 mor-talities a−1] compared to the standard aviation simulation(Fig. 6). The SWITCH2 scenario results in a REcombof −18.2 mW m−2, providing an additional −4.9 mW m−2
[36.6 %] cooling in relation to standard aviation emissions(NORM; FSC = 600 ppm).
4 Discussion and conclusions
We have used a coupled chemistry-aerosol microphysicsmodel to estimate the impact of aviation emissions on aerosoland O3 concentrations, premature mortality and radiative ef-fect on climate.
We calculated the top-of-atmosphere (TOA) troposphericO3 radiative effect (O3DRE), aerosol direct RE (aDRE) andaerosol cloud albedo effect (aCAE). We find that these non-CO2 REs result in a net cooling effect on climate as hasbeen found previously (Sausen et al., 2005; Lee et al., 2009;Gettelman and Chen, 2013; Righi et al., 2013; Unger et al.,2013). For year 2000 aviation emissions with a standard fuelsulfur content (FSC= 600 ppm), we calculate a global an-nual mean net TOA RE of −13.3 mW m−2, due to a combi-nation of O3DRE [+8.9 mW m−2], aDRE [+1.4 mW m−2]and aCAE [−23.6 mW m−2].
www.atmos-chem-phys.net/16/10521/2016/ Atmos. Chem. Phys., 16, 10521–10541, 2016
10536 Z. Z. Kapadia et al.: Impacts of aviation fuel sulfur content on climate and human health
Our O3DRE [+8.9 mW m−2] when normalised torepresent the impact of the emissions of 1 Tg(N)[+10.45 mW m−2 Tg(N)−1] is at the lower endof the range provided by previous studies [7.39–36.95 mW m−2 Tg(N)−1] (Sausen et al., 2005; Hoor etal., 2009; Lee et al., 2009; Holmes et al., 2011; Myhre etal., 2011; Unger, 2011; Frömming et al., 2012; Unger et al.,2013; Khodayari et al., 2014). This can be attributed to ourmodel’s lower OPE of 1.33, in comparison to the range of1–2.4 from other models (Myhre et al., 2011; Unger, 2011).
Our estimate of aviation-induced aCAE [−23.6 mW m−2]lies just outside the range provided by Gettelmanand Chen (2013) and Righi et al. (2013) [−15.4 to−21 mW m−2]. Our estimated aDRE [+1.4 mW m−2] lieswithin the middle of the range given by previous work(Sausen et al., 2005; Fuglestvedt et al., 2008; Lee et al., 2009;Balkanski et al., 2010; Unger, 2011; Gettelman and Chen,2013; Righi et al., 2013; Unger et al., 2013).
We estimate that standard aviation (NORM;FSC= 600 ppm) is responsible for approximately 3600premature mortalities annually due to increased surfacelayer PM2.5, in line with previous work (Barrett et al.,2012). We find that aviation-induced mortalities are highestover Europe, eastern North America and eastern China;reflecting larger regional perturbations in surface layerPM2.5 concentrations. Comparing these estimates with totalglobal premature mortalities from ambient air pollutionfrom all anthropogenic sources (Lim et al., 2012), aviationis responsible for 0.1 % [0.04–0.18 %] of annual prematuremortalities.
We investigated the impact of varying aviation FSC overthe range 0–6000 ppm. Increases in FSC lead to increasesin surface PM2.5 concentrations and subsequent increases inaviation-induced mortality. Increases in FSC also lead to amore negative REcomb due to enhanced aCAEs. We estimatethat the use of ultra-low sulfur jet (ULSJ) fuel, with a FSC of15 ppm, could prevent 620 [230–1020] mortalities annuallycompared to standard aviation emissions. Swapping to ULSJfuel increases the global mean net RE by +7.0 mW m−2
compared to standard aviation emissions, largely due to areduced aCAE. We calculate a larger warming effect fromswitching to ULSJ fuel than that assessed by Barrett etal. (2012), who did not evaluate changes in aCAE.
Absolute reductions in FSC result in limited reduc-tions in aviation-induced surface layer PM2.5. We estimatethat aviation-NOx emissions are responsible for 36.2 % ofaviation-induced sulfate perturbations. Thus further reduc-tions in aviation-induced PM2.5 can potentially be achievedif NOx emission reductions are implemented in tandem withreductions to fuel sulfur content.
In line with previous work (Köhler et al., 2008; Stevensonand Derwent, 2009; Snijders and Melkers, 2011; Frömminget al., 2012; Skowron et al., 2013), decreasing the altitudeat which O3-forming species are emitted results in a reduc-tion in aviation-induced O3, and resulting O3DRE. This is
due to the relationship between altitude and OPE, and the in-verse relationship between altitude and background pollutantconcentrations. We also explored the sensitivity of emissioninjection altitude on aerosol, mortality and aerosol RE. In-jecting aviation emissions at the surface results in a reductionin global mean concentrations of PM2.5 (relative to NORM),but with higher regional concentrations over central Europeand eastern America; resulting in higher annual mortalitiesdue to aviation. We find that aviation emissions are a factor of5 less efficient at creating CCN when released at the surface,resulting in an aCAE of−2.3 mW m−2, a reduction of 90.1 %in relation to the standard aviation scenario. When aviationSO2 emissions are injected into the free-troposphere, thedominant oxidation pathway is to H2SO4 followed by par-ticle formation and condensational growth of new particlesto larger sizes. Subsequent entrainment of these new particlesinto the lower atmosphere leads to increased CCN concentra-tions and impacts on cloud albedo. Aviation SO2 emissionsare therefore particularly efficient at forming CCN with re-sulting impacts on cloud albedo.
We explored the impact of applying altitude-dependentvariations in aviation FSC. We tested a scenario with highFSC in the free troposphere and low FSC near the surface,resulting in the same global aviation sulfur emission as thestandard aviation scenario. In this scenario, aviation-inducedpremature mortalities were reduced by 2.4 % [−90 mortali-ties a−1] and the magnitude of the negative REcomb was in-creased by 36.6 %, providing an additional cooling impact ofclimate of −4.88 mW m−2.
Our simulations suggest that the climate and air qualityimpacts of aviation are sensitive to FSC and the altitude ofemissions. We explored a range of scenarios to maximise cli-mate cooling and reduce air quality impacts. Use of ULSJfuel (FSC= 15 ppm) at low altitude combined with high FSCin the free troposphere results in increased climate coolingwhilst reducing aviation mortality. More complicated emis-sion patterns, for example, use of high FSC only whilstover oceans might further enhance this effect. However, wenote that the greatest reduction in aviation-induced mortal-ity is simulated for complete desulfurization of aviation fuel.Given the uncertainty in both the climate and air quality im-pacts of aerosol and ozone, additional simulations from arange of atmospheric models are required to explore the ro-bustness of our calculations. Finally, we note that our cal-culations are limited to calculation of aviation-induced RE.Future work needs to assess the complex climate impactsof altering aviation FSC. Future work needs to estimate thehealth impacts of aviation using newly available concentra-tion response functions (Burnett et al., 2014).
5 Data availability
Ozone observations used in this work can be acquiredfrom Tilmes et al. (2012). Aerosol data are described in
Atmos. Chem. Phys., 16, 10521–10541, 2016 www.atmos-chem-phys.net/16/10521/2016/

Z. Z. Kapadia et al.: Impacts of aviation fuel sulfur content on climate and human health 10537
Heald et al. (2011). CMIP5 aviation emissions are avail-able from http://tntcat.iiasa.ac.at:8787/RcpDb/dsd?Action=htmlpage&page=about. Model outputs are available on re-quest from the corresponding author.
The Supplement related to this article is available onlineat doi:10.5194/acp-16-10521-2016-supplement.
Acknowledgements. The authors acknowledge the Engineering &Physical Sciences Research Council (EPSRC) for funding ofZ. Z. Kapadia through the EPSRC Doctoral Training Centre in LowCarbon Technologies (EPSRC Grant EP/G036608/1).
This work was undertaken on ARC2 as part of the High Perfor-mance Computing facilities at the University of Leeds, UK.
The authors are also grateful to Jean-Francois Lamarque and the“Historical emissions group” and IIASA for their publicly availablerecommended historical CMIP5 aviation emissions data.
Edited by: J. WestReviewed by: two anonymous referees
References
Anderson, B. E., Chen, G., and Blake, D. R.: Hydrocarbon emis-sions from a modern commercial airliner, Atmos. Environ., 40,3601–3612, doi:10.1016/j.atmosenv.2005.09.072, 2006.
Andres, R. J. and Kasgnoc, A. D.: A time-averaged inventory ofsubaerial volcanic sulfur emissions, J. Geophys. Res.-Atmos.,103, 25251–25261, doi:10.1029/98JD02091, 1998.
Arnold, S. R., Chipperfield, M. P., and Blitz, M. A.: A three-dimensional model study of the effect of new temperature-dependent quantum yields for acetone photolysis, J. Geophys.Res.-Atmos., 110, D22305, doi:10.1029/2005JD005998, 2005.
ASTM International: D1655-11b: Standard Specification for Avi-ation Turbine Fuels, ASTM International, West Conshohocken,PA, USA, 2012.
Balkanski, Y., Myhre, G., Gauss, M., Rädel, G., Highwood, E. J.,and Shine, K. P.: Direct radiative effect of aerosols emitted bytransport: from road, shipping and aviation, Atmos. Chem. Phys.,10, 4477–4489, doi:10.5194/acp-10-4477-2010, 2010.
Barahona, D., West, R. E. L., Stier, P., Romakkaniemi, S., Kokkola,H., and Nenes, A.: Comprehensively accounting for the effect ofgiant CCN in cloud activation parameterizations, Atmos. Chem.Phys., 10, 2467–2473, doi:10.5194/acp-10-2467-2010, 2010.
Barrett, S. R. H., Britter, R. E., and Waitz, I. A.: Global MortalityAttributable to Aircraft Cruise Emissions, Environ. Sci. Technol.,44, 7736–7742, doi:10.1021/es101325r, 2010.
Barrett, S. R. H., Yim, S. H. L., Gilmore, C. K., Murray, L. T.,Kuhn, S. R., Tai, A. P. K., Yantosca, R. M., Byun, D. W.,Ngan, F., Li, X., Levy, J. I., Ashok, A., Koo, J., Wong, H. M.,Dessens, O., Balasubramanian, S., Fleming, G. G., Pearlson, M.N., Wollersheim, C., Malina, R., Arunachalam, S., Binkowski,F. S., Leibensperger, E. M., Jacob, D. J., Hileman, J. I., andWaitz, I. A.: Public Health, Climate, and Economic Impacts of
Desulfurizing Jet Fuel, Environ. Sci. Technol., 46, 4275–4282,doi:10.1021/es203325a, 2012.
Benduhn, F., Mann, G. W., Pringle, K. J., Topping, D. O., McFig-gans, G., and Carslaw, K. S.: Size-resolved simulations of theaerosol inorganic composition with the new hybrid dissolutionsolver HyDiS-1.0 – Description, evaluation and first global mod-elling results, Geosci. Model Dev. Discuss., doi:10.5194/gmd-2015-264, in review, 2016.
Bond, T. C., Streets, D. G., Yarber, K. F., Nelson, S. M., Woo,J.-H., and Klimont, Z.: A technology-based global inventory ofblack and organic carbon emissions from combustion, J. Geo-phys. Res.-Atmos., 109, D14203, doi:10.1029/2003JD003697,2004.
Bouwman, A. F., Lee, D. S., Asman, W. A. H., Dentener, F. J., VanDer Hoek, K. W., and Olivier, J. G. J.: A global high-resolutionemission inventory for ammonia, Global Biogeochem. Cy., 11,561–587, doi:10.1029/97GB02266, 1997.
Brasseur, G. P., Gupta, M., Anderson, B. E., Balasubramanian, S.,Barrett, S., Duda, D., Fleming, G., Forster, P. M., Fuglestvedt, J.,and Gettelman, A.: Impact of Aviation on Climate: FAA’s Avi-ation Climate Change Research Initiative (ACCRI) Phase II, B.Am. Meteorol. Soc., 97, 561–583, 2016.
Breider, T. J., Chipperfield, M. P., Richards, N. A. D., Carslaw,K. S., Mann, G. W., and Spracklen, D. V.: Impact of BrO ondimethylsulfide in the remote marine boundary layer, Geophys.Res. Lett., 37, L02807, doi:10.1029/2009GL040868, 2010.
Burkhardt, U. and Karcher, B.: Global radiative forcing from con-trail cirrus, Nature Clim. Change, 1, 54–58, 2011.
Burnett, R. T., Pope, C. A., Ezzati, M., Olives, C., Lim, S. S., Mehta,S., Shin, H. H., Singh, G., Hubbell, B., Brauer, M., Anderson, H.R., Smith, K. R., Balmes, J. R., Bruce, N. G., Kan, H. D., Laden,F., Pruss-Ustun, A., Michelle, C. T., Gapstur, S. M., Diver, W.R., and Cohen, A.: An Integrated Risk Function for Estimatingthe Global Burden of Disease Attributable to Ambient Fine Par-ticulate Matter Exposure, Environ. Heal. Persp., 122, 397–403,doi:10.1289/ehp.1307049, 2014.
Chipperfield, M. P.: New version of the TOMCAT/SLIMCAT off-line chemical transport model: Intercomparison of stratospherictracer experiments, Q. J. Roy. Meteor. Soc., 132, 1179–1203,doi:10.1256/qj.05.51, 2006.
Chipperfield, M. P., Dhomse, S. S., Feng, W., McKenzie, R. L.,Velders, G. J. M., and Pyle, J. A.: Quantifying the ozone andultraviolet benefits already achieved by the Montreal Protocol,Nat. Commun., 6, 7233, doi:10.1038/ncomms8233, 2015.
Cofala, J., Amann, M., Klimont, Z., and Schopp, W.: Scenarios ofWorld Anthropogenic Emissions of SO2, NOx and CO up to2030, International Institute for Applied Systems Analysis, Lax-enburg, Austria, 2005.
Dentener, F., Kinne, S., Bond, T., Boucher, O., Cofala, J., Generoso,S., Ginoux, P., Gong, S., Hoelzemann, J. J., Ito, A., Marelli, L.,Penner, J. E., Putaud, J.-P., Textor, C., Schulz, M., van der Werf,G. R., and Wilson, J.: Emissions of primary aerosol and precur-sor gases in the years 2000 and 1750 prescribed data-sets for Ae-roCom, Atmos. Chem. Phys., 6, 4321–4344, doi:10.5194/acp-6-4321-2006, 2006.
Dessens, O., Köhler, M. O., Rogers, H. L., Jones, R. L., and Pyle,J. A.: Aviation and climate change, Transp. Policy, 34, 14–20,doi:10.1016/j.tranpol.2014.02.014, 2014.
www.atmos-chem-phys.net/16/10521/2016/ Atmos. Chem. Phys., 16, 10521–10541, 2016

10538 Z. Z. Kapadia et al.: Impacts of aviation fuel sulfur content on climate and human health
Dockery, D. W., Pope, C. A., Xu, X., Spengler, J. D., Ware, J. H.,Fay, M. E., Ferris, B. G., and Speizer, F. E.: An Association be-tween Air Pollution and Mortality in Six U.S. Cities, New Engl.J. Med., 329, 1753–1759, doi:10.1056/NEJM199312093292401,1993.
DuBois, D. and Paynter, G. C.: “Fuel Flow Method2” for EstimatingAircraft Emissions, SAE Technical Paper Series, 01, 2006.
Eckhardt, S., Quennehen, B., Olivié, D. J. L., Berntsen, T. K.,Cherian, R., Christensen, J. H., Collins, W., Crepinsek, S.,Daskalakis, N., Flanner, M., Herber, A., Heyes, C., Hodnebrog,Ø., Huang, L., Kanakidou, M., Klimont, Z., Langner, J., Law,K. S., Lund, M. T., Mahmood, R., Massling, A., Myriokefali-takis, S., Nielsen, I. E., Nøjgaard, J. K., Quaas, J., Quinn, P. K.,Raut, J.-C., Rumbold, S. T., Schulz, M., Sharma, S., Skeie, R. B.,Skov, H., Uttal, T., von Salzen, K., and Stohl, A.: Current modelcapabilities for simulating black carbon and sulfate concentra-tions in the Arctic atmosphere: a multi-model evaluation using acomprehensive measurement data set, Atmos. Chem. Phys., 15,9413–9433, doi:10.5194/acp-15-9413-2015, 2015.
Edwards, J. M. and Slingo, A.: Studies with a flexible new radiationcode. I: Choosing a configuration for a large-scale model, Q. J.Roy. Meteor. Soc., 122, 689–719, doi:10.1002/qj.49712253107,1996.
Eyers, C. J., Addleton, D., Atkinson, K., Broomhead, M. J., Chris-tou, R., Elliff, T., Falk, R., Gee, I., Lee, D. S., Marizy, C., S Mi-chot, Middel, J., Newton, P., Norman, P., Plohr, M., Raper, D.,and Stanciou, N.: AERO2K Global Aviation Emissions Invento-ries for 2002 and 2025, QINETIQ/04/01113, 2004.
Eyring, V., Isaksen, I. S. A., Berntsen, T., Collins, W. J., Cor-bett, J. J., Endresen, O., Grainger, R. G., Moldanova, J.,Schlager, H., and Stevenson, D. S.: Transport impacts on atmo-sphere and climate: Shipping, Atmos. Environ., 44, 4735–4771,doi:10.1016/j.atmosenv.2009.04.059, 2010.
Fiore, A. M., Naik, V., Spracklen, D. V., Steiner, A., Unger, N.,Prather, M., Bergmann, D., Cameron-Smith, P. J., Cionni, I.,Collins, W. J., Dalsoren, S., Eyring, V., Folberth, G. A., Ginoux,P., Horowitz, L. W., Josse, B., Lamarque, J.-F., MacKenzie, I.A., Nagashima, T., O’Connor, F. M., Righi, M., Rumbold, S. T.,Shindell, D. T., Skeie, R. B., Sudo, K., Szopa, S., Takemura, T.,and Zeng, G.: Global air quality and climate, Chem. Soc. Rev.,41, 6663–6683, 2012.
Fountoukis, C. and Nenes, A.: Continued development ofa cloud droplet formation parameterization for globalclimate models, J. Geophys. Res.-Atmos., 110, D11212,doi:10.1029/2004JD005591, 2005.
Frömming, C., Ponater, M., Dahlmann, K., Grewe, V., Lee, D. S.,and Sausen, R.: Aviation-induced radiative forcing and surfacetemperature change in dependency of the emission altitude, J.Geophys. Res., 117, D19104, doi:10.1029/2012JD018204, 2012.
Fuglestvedt, J., Berntsen, T., Myhre, G., Rypdal, K., and Skeie, R.B.: Climate forcing from the transport sectors, P. Natl. Acad. Sci.,105, 454–458, doi:10.1073/pnas.0702958104, 2008.
Gettelman, A. and Chen, C.: The climate impact of avi-ation aerosols, Geophys. Res. Lett., 40, 2785–2789,doi:10.1002/grl.50520, 2013.
Guenther, A., Hewitt, C. N., Erickson, D., Fall, R., Geron, C.,Graedel, T., Harley, P., Klinger, L., Lerdau, M., McKay, W. A.,Pierce, T., Scholes, B., Steinbrecher, R., Tallamraju, R., Taylor,J., and Zimmerman, P.: A global model of natural volatile organic
compound emissions, J. Geophys. Res.-Atmos., 100, 8873–8892,doi:10.1029/94JD02950, 1995.
Halmer, M. M., Schmincke, H. U., and Graf, H. F.: The annual vol-canic gas input into the atmosphere, in particular into the strato-sphere: a global data set for the past 100 years, J. Volcanol.Geoth. Res., 115, 511–528, doi:10.1016/S0377-0273(01)00318-3, 2002.
Hand, J. L., Schichtel, B. A., Malm, W. C., and Pitchford, M.L.: Particulate sulfate ion concentration and SO2 emissiontrends in the United States from the early 1990s through 2010,Atmos. Chem. Phys., 12, 10353–10365, doi:10.5194/acp-12-10353-2012, 2012.
Heald, C. L., Coe, H., Jimenez, J. L., Weber, R. J., Bahreini, R.,Middlebrook, A. M., Russell, L. M., Jolleys, M., Fu, T.-M., Al-lan, J. D., Bower, K. N., Capes, G., Crosier, J., Morgan, W.T., Robinson, N. H., Williams, P. I., Cubison, M. J., DeCarlo,P. F., and Dunlea, E. J.: Exploring the vertical profile of atmo-spheric organic aerosol: comparing 17 aircraft field campaignswith a global model, Atmos. Chem. Phys., 11, 12673–12696,doi:10.5194/acp-11-12673-2011, 2011.
Hileman, J. I. and Stratton, R. W.: Alternative jet fuel feasibility,Transp. Policy, 34, 52–62, doi:10.1016/j.tranpol.2014.02.018,2014.
Holmes, C. D., Tang, Q., and Prather, M. J.: Uncertainties in climateassessment for the case of aviation NO, P. Natl. Acad. Sci., 108,10997–11002, doi:10.1073/pnas.1101458108, 2011.
Hoor, P., Borken-Kleefeld, J., Caro, D., Dessens, O., Endresen,O., Gauss, M., Grewe, V., Hauglustaine, D., Isaksen, I. S. A.,Jöckel, P., Lelieveld, J., Myhre, G., Meijer, E., Olivie, D., Prather,M., Schnadt Poberaj, C., Shine, K. P., Staehelin, J., Tang, Q.,van Aardenne, J., van Velthoven, P., and Sausen, R.: The im-pact of traffic emissions on atmospheric ozone and OH: re-sults from QUANTIFY, Atmos. Chem. Phys., 9, 3113–3136,doi:10.5194/acp-9-3113-2009, 2009.
Hopke, P. K.: Receptor modeling in environmental chemistry,Chemical Analysis: A Series of Monographs on AnalyticalChemistry and Its Applications, Wiley, Hoboken, N. J., 1985.
ICAO: Annual Report of the Council 2012, International Civil Avi-ation Organisation (ICAO), 2013.
Jacobson, M. Z., Wilkerson, J. T., Naiman, A. D., and Lele, S.K.: The effects of aircraft on climate and pollution. Part II: 20-year impacts of exhaust from all commercial aircraft worldwidetreated individually at the subgrid scale, Faraday Discuss., 165,369–382, doi:10.1039/C3FD00034F, 2013.
Kaiser, J. W., Heil, A., Andreae, M. O., Benedetti, A., Chubarova,N., Jones, L., Morcrette, J.-J., Razinger, M., Schultz, M. G.,Suttie, M., and van der Werf, G. R.: Biomass burning emis-sions estimated with a global fire assimilation system basedon observed fire radiative power, Biogeosciences, 9, 527–554,doi:10.5194/bg-9-527-2012, 2012.
Kettle, A. J. and Andreae, M. O.: Flux of dimethylsulfidefrom the oceans: A comparison of updated data sets andflux models, J. Geophys. Res.-Atmos., 105, 26793–26808,doi:10.1029/2000JD900252, 2000.
Khodayari, A., Olsen, S. C., and Wuebbles, D. J.: Evaluation ofaviation NOx -induced radiative forcings for 2005 and 2050, At-mos. Environ., 91, 95–103, doi:10.1016/j.atmosenv.2014.03.044,2014.
Atmos. Chem. Phys., 16, 10521–10541, 2016 www.atmos-chem-phys.net/16/10521/2016/

Z. Z. Kapadia et al.: Impacts of aviation fuel sulfur content on climate and human health 10539
Knighton, W. B., Rogers, T. M., Anderson, B. E., Herndon, S. C.,Yelvington, P. E., and Miake-Lye, R. C.: Quantification of Air-craft Engine Hydrocarbon Emissions Using Proton Transfer Re-action Mass Spectrometry, J. Propul. Power, 23, 949–958, 2007.
Knippertz, P., Evans, M. J., Field, P. R., Fink, A. H., Liousse, C.,and Marsham, J. H.: The possible role of local air pollution inclimate change in West Africa, Nature Clim. Change, 5, 815–822, doi:10.1038/nclimate2727, 2015.
Köhler, M. O., Rädel, G., Dessens, O., Shine, K. P., Rogers, H. L.,Wild, O., and Pyle, J. A.: Impact of perturbations to nitrogenoxide emissions from global aviation, J. Geophys. Res.-Atmos.,113, D11305, doi:10.1029/2007JD009140, 2008.
Köhler, M. O., Rädel, G., Shine, K. P., Rogers, H. L., and Pyle, J.A.: Latitudinal variation of the effect of aviation NOx emissionson atmospheric ozone and methane and related climate metrics,Atmos. Environ., 64, 1–9, doi:10.1016/j.atmosenv.2012.09.013,2013.
Konovalov, I. B., Beekmann, M., Burrows, J. P., and Richter, A.:Satellite measurement based estimates of decadal changes in Eu-ropean nitrogen oxides emissions, Atmos. Chem. Phys., 8, 2623–2641, doi:10.5194/acp-8-2623-2008, 2008.
Lamarque, J.-F., Hess, P., Emmons, L., Buja, L., Washing-ton, W., and Granier, C.: Tropospheric ozone evolution be-tween 1890 and 1990, J. Geophys. Res.-Atmos., 110, D08304,doi:10.1029/2004JD005537, 2005.
Lamarque, J.-F., Smith, S. J., Bond, T., Cofala, J., Eyring, V.,Granier, C., Heil, A., Kainuma, M., Klimont, Z., Lee, D., Li-ousse, C., Mieville, A., Riahi, K., Schultz, M., Stevenson, D.,Van Aardenne, J., and van Vuuren, D.: RCP Database (Version2.0.5): Historical emissions data (1850–2000), International In-stitute for Applied Systems Analysis, in: International Institutefor Applied Systems Analysis, RCP Database, 2009.
Lamarque, J.-F., Bond, T. C., Eyring, V., Granier, C., Heil, A.,Klimont, Z., Lee, D., Liousse, C., Mieville, A., Owen, B.,Schultz, M. G., Shindell, D., Smith, S. J., Stehfest, E., Van Aar-denne, J., Cooper, O. R., Kainuma, M., Mahowald, N., Mc-Connell, J. R., Naik, V., Riahi, K., and van Vuuren, D. P.: His-torical (1850–2000) gridded anthropogenic and biomass burningemissions of reactive gases and aerosols: methodology and ap-plication, Atmos. Chem. Phys., 10, 7017–7039, doi:10.5194/acp-10-7017-2010, 2010.
Lee, D. S., Fahey, D. W., Forster, P. M., Newton, P. J., Wit, R. C.N., Lim, L. L., Owen, B., and Sausen, R.: Aviation and globalclimate change in the 21st century, Atmos. Environ., 43, 3520–3537, doi:10.1016/j.atmosenv.2009.04.024, 2009.
Lee, D. S., Pitari, G., Grewe, V., Gierens, K., Penner, J. E., Pet-zold, A., Prather, M. J., Schumann, U., Bais, A., Berntsen, T.,Iachetti, D., Lim, L. L., and Sausen, R.: Transport impacts onatmosphere and climate: Aviation, Atmos. Environ., 44, 4678–4734, doi:10.1016/j.atmosenv.2009.06.005, 2010.
Lim, S. S., Vos, T., Flaxman, A. D., Danaei, G., Shibuya, K., Adair-Rohani, H., AlMazroa, M. A., Amann, M., Anderson, H. R., An-drews, K. G., Aryee, M., Atkinson, C., Bacchus, L. J., Bahalim,A. N., Balakrishnan, K., Balmes, J., Barker-Collo, S., Baxter,A., Bell, M. L., Blore, J. D., Blyth, F., Bonner, C., Borges, G.,Bourne, R., Boussinesq, M., Brauer, M., Brooks, P., Bruce, N.G., Brunekreef, B., Bryan-Hancock, C., Bucello, C., Buchbinder,R., Bull, F., Burnett, R. T., Byers, T. E., Calabria, B., Carapetis,J., Carnahan, E., Chafe, Z., Charlson, F., Chen, H., Chen, J. S.,
Cheng, A. T.-A., Child, J. C., Cohen, A., Colson, K. E., Cowie,B. C., Darby, S., Darling, S., Davis, A., Degenhardt, L., Den-tener, F., Des Jarlais, D. C., Devries, K., Dherani, M., Ding, E.L., Dorsey, E. R., Driscoll, T., Edmond, K., Ali, S. E., Engell, R.E., Erwin, P. J., Fahimi, S., Falder, G., Farzadfar, F., Ferrari, A.,Finucane, M. M., Flaxman, S., Fowkes, F. G. R., Freedman, G.,Freeman, M. K., Gakidou, E., Ghosh, S., Giovannucci, E., Gmel,G., Graham, K., Grainger, R., Grant, B., Gunnell, D., Gutierrez,H. R., Hall, W., Hoek, H. W., Hogan, A., Hosgood Iii, H. D.,Hoy, D., Hu, H., Hubbell, B. J., Hutchings, S. J., Ibeanusi, S. E.,Jacklyn, G. L., Jasrasaria, R., Jonas, J. B., Kan, H., Kanis, J. A.,Kassebaum, N., Kawakami, N., Khang, Y.-H., Khatibzadeh, S.,Khoo, J.-P., Kok, C., Laden, F., Lalloo, R., Lan, Q., Lathlean, T.,Leasher, J. L., Leigh, J., Li, Y., Lin, J. K., Lipshultz, S. E., Lon-don, S., Lozano, R., Lu, Y., Mak, J., Malekzadeh, R., Mallinger,L., Marcenes, W., March, L., Marks, R., Martin, R., McGale, P.,McGrath, J., Mehta, S., Memish, Z. A., Mensah, G. A., Merri-man, T. R., Micha, R., Michaud, C., Mishra, V., Hanafiah, K.M., Mokdad, A. A., Morawska, L., Mozaffarian, D., Murphy,T., Naghavi, M., Neal, B., Nelson, P. K., Nolla, J. M., Norman,R., Olives, C., Omer, S. B., Orchard, J., Osborne, R., Ostro, B.,Page, A., Pandey, K. D., Parry, C. D. H., Passmore, E., Patra, J.,Pearce, N., Pelizzari, P. M., Petzold, M., Phillips, M. R., Pope,D., Pope III, C. A., Powles, J., Rao, M., Razavi, H., Rehfuess, E.A., Rehm, J. T., Ritz, B., Rivara, F. P., Roberts, T., Robinson, C.,Rodriguez-Portales, J. A., Romieu, I., Room, R., Rosenfeld, L.C., Roy, A., Rushton, L., Salomon, J. A., Sampson, U., Sanchez-Riera, L., Sanman, E., Sapkota, A., Seedat, S., Shi, P., Shield,K., Shivakoti, R., Singh, G. M., Sleet, D. A., Smith, E., Smith,K. R., Stapelberg, N. J. C., Steenland, K., Stöckl, H., Stovner, L.J., Straif, K., Straney, L., Thurston, G. D., Tran, J. H., Van Din-genen, R., van Donkelaar, A., Veerman, J. L., Vijayakumar, L.,Weintraub, R., Weissman, M. M., White, R. A., Whiteford, H.,Wiersma, S. T., Wilkinson, J. D., Williams, H. C., Williams, W.,Wilson, N., Woolf, A. D., Yip, P., Zielinski, J. M., Lopez, A. D.,Murray, C. J. L., and Ezzati, M.: A comparative risk assessmentof burden of disease and injury attributable to 67 risk factors andrisk factor clusters in 21 regions, 1990–2010: a systematic anal-ysis for the Global Burden of Disease Study 2010, The Lancet,380, 2224–2260, doi:10.1016/S0140-6736(12)61766-8, 2012.
Mann, G. W., Carslaw, K. S., Spracklen, D. V., Ridley, D. A.,Manktelow, P. T., Chipperfield, M. P., Pickering, S. J., andJohnson, C. E.: Description and evaluation of GLOMAP-mode:a modal global aerosol microphysics model for the UKCAcomposition-climate model, Geosci. Model Dev., 3, 519–551,doi:10.5194/gmd-3-519-2010, 2010.
Ministry of Defence: Defence Standard 91-91, Turbine Fuel, Kero-sine Type, Jet A-1. NATO Code: F-35, Joint Service Designation:AVTUR, Glasgow, United Kingdom, 2011.
Morita, H., Yang, S., Unger, N., and Kinney, P. L.: GlobalHealth Impacts of Future Aviation Emissions Under Alterna-tive Control Scenarios, Environ. Sci. Technol., 48, 14659–14667,doi:10.1021/es5055379, 2014.
Myhre, G., Shine, K. P., Rädel, G., Gauss, M., Isaksen, I. S.A., Tang, Q., Prather, M. J., Williams, J. E., van Velthoven,P., Dessens, O., Koffi, B., Szopa, S., Hoor, P., Grewe, V.,Borken-Kleefeld, J., Berntsen, T. K., and Fuglestvedt, J. S.:Radiative forcing due to changes in ozone and methane
www.atmos-chem-phys.net/16/10521/2016/ Atmos. Chem. Phys., 16, 10521–10541, 2016
10540 Z. Z. Kapadia et al.: Impacts of aviation fuel sulfur content on climate and human health
caused by the transport sector, Atmos. Environ., 45, 387–394,doi:10.1016/j.atmosenv.2010.10.001, 2011.
Nenes, A. and Seinfeld, J. H.: Parameterization of cloud dropletformation in global climate models, J. Geophys. Res.-Atmos.,108, 4415, doi:10.1029/2002JD002911, 2003.
Nightingale, P. D., Malin, G., Law, C. S., Watson, A. J., Liss, P. S.,Liddicoat, M. I., Boutin, J., and Upstill-Goddard, R. C.: In situevaluation of air-sea gas exchange parameterizations using novelconservative and volatile tracers, Global Biogeochem. Cy., 14,373–387, doi:10.1029/1999GB900091, 2000.
Olsen, S. C., Wuebbles, D. J., and Owen, B.: Comparison of global3-D aviation emissions datasets, Atmos. Chem. Phys., 13, 429–441, doi:10.5194/acp-13-429-2013, 2013.
Ostro, B. D.: Outdoor air pollution: Assessing the environmentalburden of disease at national and local levels, WHO Environ-mental Burden of Disease Series, No. 5, Geneva, Switzerland,2004.
Pope, C. A. and Dockery, D. W.: Health effects of fine particulate airpollution: lines that connect, J. Air Waste Manage., 56, 709–742,2006.
Pope, C. A., Burnett, R. T., Thun, M. J., Calle, E. E., Krewski,D., Ito, K., and Thurston, G. D.: Lung Cancer, CardiopulmonaryMortality, and Long-term Exposure to Fine Particulate Air Pol-lution, JAMA, 287, 1132–1141, doi:10.1001/jama.287.9.1132,2002.
EU FP6 Integrated Project QUANTIFY: Quantifying the ClimateImpact of Global and European Transport Systems: QUAN-TIFY emission inventories and scenarios: http://www.pa.op.dlr.de/quantify/ (last access: 15 July 2011), 2005–2012.
Rap, A., Forster, P. M., Jones, A., Boucher, O., Haywood, J. M., Bel-louin, N., and De Leon, R. R.: Parameterization of contrails in theUK Met Office Climate Model, J. Geophys. Res., 115, D10205,doi:10.1029/2009jd012443, 2010.
Rap, A., Scott, C. E., Spracklen, D. V., Bellouin, N., Forster, P. M.,Carslaw, K. S., Schmidt, A., and Mann, G.: Natural aerosol di-rect and indirect radiative effects, Geophys. Res. Lett., 40, 3297–3301, doi:10.1002/grl.50441, 2013.
Rap, A., Richards, N. A. D., Forster, P. M., Monks, S. A., Arnold,S. R., and Chipperfield, M. P.: Satellite constraint on the tropo-spheric ozone radiative effect, Geophys. Res. Lett., 42, 5074–5081, doi:10.1002/2015GL064037, 2015.
Ratliff, G., Sequeira, C., Waitz, I., Ohsfeldt, M., Thrasher, T., Gra-ham, M., and Thompson, T.: Aircraft Impacts on Local and Re-gional Air Quality in the United States, Massachusetts Instituteof Technology, PARTNER report (Report No. PARTNER-COE-2009-002), 2009.
Richards, N. A. D., Arnold, S. R., Chipperfield, M. P., Miles,G., Rap, A., Siddans, R., Monks, S. A., and Hollaway, M. J.:The Mediterranean summertime ozone maximum: global emis-sion sensitivities and radiative impacts, Atmos. Chem. Phys., 13,2331–2345, doi:10.5194/acp-13-2331-2013, 2013.
Righi, M., Hendricks, J., and Sausen, R.: The global impact ofthe transport sectors on atmospheric aerosol: simulations foryear 2000 emissions, Atmos. Chem. Phys., 13, 9939–9970,doi:10.5194/acp-13-9939-2013, 2013.
Rossow, W. B. and Schiffer, R. A.: Advances in UnderstandingClouds from ISCCP, B. Am. Meteorol. Soc., 80, 2261–2287,doi:10.1175/1520-0477(1999)080<2261:AIUCFI>2.0.CO;2,1999.
Sausen, R., Isaksen, I., Grewe, V., Hauglustaine, D., Lee, D. S.,Myhre, G., Köhler, M. O., Pitari, G., Schumann, U., Stordal, F.,and Zerefos, C.: Aviation radiative forcing in 2000: An updateon IPCC (1999), Meteorol. Z., 14, 555–561, 2005.
Schmidt, A., Carslaw, K. S., Mann, G. W., Rap, A., Pringle, K. J.,Spracklen, D. V., Wilson, M., and Forster, P. M.: Importance oftropospheric volcanic aerosol for indirect radiative forcing of cli-mate, Atmos. Chem. Phys., 12, 7321–7339, doi:10.5194/acp-12-7321-2012, 2012.
Shindell, D. T., Chin, M., Dentener, F., Doherty, R. M., Faluvegi, G.,Fiore, A. M., Hess, P., Koch, D. M., MacKenzie, I. A., Sander-son, M. G., Schultz, M. G., Schulz, M., Stevenson, D. S., Teich,H., Textor, C., Wild, O., Bergmann, D. J., Bey, I., Bian, H., Cuve-lier, C., Duncan, B. N., Folberth, G., Horowitz, L. W., Jonson, J.,Kaminski, J. W., Marmer, E., Park, R., Pringle, K. J., Schroeder,S., Szopa, S., Takemura, T., Zeng, G., Keating, T. J., and Zu-ber, A.: A multi-model assessment of pollution transport to theArctic, Atmos. Chem. Phys., 8, 5353–5372, doi:10.5194/acp-8-5353-2008, 2008.
Skowron, A., Lee, D. S., and De León, R. R.: The assess-ment of the impact of aviation NOx on ozone and otherradiative forcing responses – The importance of represent-ing cruise altitudes accurately, Atmos. Environ., 74, 159–168,doi:10.1016/j.atmosenv.2013.03.034, 2013.
Snijders, T. A. and Melkers, J. A.: Effect of cruise altitudeand alternative aviation fuels on radiative forcing, in: 47thAIAA/ASME/SAE/ASEE Joint Propulsion Conference & Ex-hibit, Joint Propulsion Conferences, American Institute of Aero-nautics and Astronautics, 2011.
Spicer, C. W., Holdren, M. W., Riggin, R. M., and Lyon, T. F.:Chemical composition and photochemical reactivity of exhaustfrom aircraft turbine engines, Ann. Geophys., 12, 944–955,doi:10.1007/s00585-994-0944-0, 1994.
Spracklen, D. V., Pringle, K. J., Carslaw, K. S., Chipperfield,M. P., and Mann, G. W.: A global off-line model of size-resolved aerosol microphysics: I. Model development and pre-diction of aerosol properties, Atmos. Chem. Phys., 5, 2227–2252, doi:10.5194/acp-5-2227-2005, 2005.
Spracklen, D. V., Carslaw, K. S., Merikanto, J., Mann, G. W., Red-dington, C. L., Pickering, S., Ogren, J. A., Andrews, E., Bal-tensperger, U., Weingartner, E., Boy, M., Kulmala, M., Laakso,L., Lihavainen, H., Kivekäs, N., Komppula, M., Mihalopoulos,N., Kouvarakis, G., Jennings, S. G., O’Dowd, C., Birmili, W.,Wiedensohler, A., Weller, R., Gras, J., Laj, P., Sellegri, K., Bonn,B., Krejci, R., Laaksonen, A., Hamed, A., Minikin, A., Harri-son, R. M., Talbot, R., and Sun, J.: Explaining global surfaceaerosol number concentrations in terms of primary emissionsand particle formation, Atmos. Chem. Phys., 10, 4775–4793,doi:10.5194/acp-10-4775-2010, 2010.
Spracklen, D. V., Carslaw, K. S., Pöschl, U., Rap, A., and Forster,P. M.: Global cloud condensation nuclei influenced by carbona-ceous combustion aerosol, Atmos. Chem. Phys., 11, 9067–9087,doi:10.5194/acp-11-9067-2011, 2011a.
Spracklen, D. V., Jimenez, J. L., Carslaw, K. S., Worsnop, D. R.,Evans, M. J., Mann, G. W., Zhang, Q., Canagaratna, M. R.,Allan, J., Coe, H., McFiggans, G., Rap, A., and Forster, P.:Aerosol mass spectrometer constraint on the global secondaryorganic aerosol budget, Atmos. Chem. Phys., 11, 12109–12136,doi:10.5194/acp-11-12109-2011, 2011b.
Atmos. Chem. Phys., 16, 10521–10541, 2016 www.atmos-chem-phys.net/16/10521/2016/

Z. Z. Kapadia et al.: Impacts of aviation fuel sulfur content on climate and human health 10541
Stevenson, D. S. and Derwent, R. G.: Does the location of aircraftnitrogen oxide emissions affect their climate impact?, Geophys.Res. Lett., 36, L17810, doi:10.1029/2009GL039422, 2009.
Stevenson, D. S., Young, P. J., Naik, V., Lamarque, J.-F., Shindell,D. T., Voulgarakis, A., Skeie, R. B., Dalsoren, S. B., Myhre, G.,Berntsen, T. K., Folberth, G. A., Rumbold, S. T., Collins, W. J.,MacKenzie, I. A., Doherty, R. M., Zeng, G., van Noije, T. P. C.,Strunk, A., Bergmann, D., Cameron-Smith, P., Plummer, D. A.,Strode, S. A., Horowitz, L., Lee, Y. H., Szopa, S., Sudo, K., Na-gashima, T., Josse, B., Cionni, I., Righi, M., Eyring, V., Conley,A., Bowman, K. W., Wild, O., and Archibald, A.: Troposphericozone changes, radiative forcing and attribution to emissions inthe Atmospheric Chemistry and Climate Model Intercompari-son Project (ACCMIP), Atmos. Chem. Phys., 13, 3063–3085,doi:10.5194/acp-13-3063-2013, 2013.
Thompson, A. M., Tao, W.-K., Pickering, K. E., Scala, J. R.,and Simpson, J.: Tropical Deep Convection and Ozone Forma-tion, B. Am. Meteorol. Soc., 78, 1043–1054, doi:10.1175/1520-0477(1997)078<1043:TDCAOF>2.0.CO;2, 1997.
Tilmes, S., Lamarque, J.-F., Emmons, L. K., Conley, A., Schultz,M. G., Saunois, M., Thouret, V., Thompson, A. M., Olt-mans, S. J., Johnson, B., and Tarasick, D.: Technical Note:Ozonesonde climatology between 1995 and 2011: description,evaluation and applications, Atmos. Chem. Phys., 12, 7475–7497, doi:10.5194/acp-12-7475-2012, 2012.
Uherek, E., Halenka, T., Borken-Kleefeld, J., Balkanski, Y.,Berntsen, T., Borrego, C., Gauss, M., Hoor, P., Juda-Rezler, K.,Lelieveld, J., Melas, D., Rypdal, K., and Schmid, S.: Trans-port impacts on atmosphere and climate: Land transport, Atmos.Environ., 44, 4772–4816, doi:10.1016/j.atmosenv.2010.01.002,2010.
Unger, N.: Global climate impact of civil aviation for standardand desulfurized jet fuel, Geophys. Res. Lett., 38, L20803,doi:10.1029/2011gl049289, 2011.
Unger, N., Shindell, D. T., Koch, D. M., and Streets, D. G.: Crossinfluences of ozone and sulfate precursor emissions changes onair quality and climate, P. Natl. Acad. Sci. USA, 103, 4377–4380,doi:10.1073/pnas.0508769103, 2006.
Unger, N., Zhao, Y., and Dang, H.: Mid-21st century chemical forc-ing of climate by the civil aviation sector, Geophys. Res. Lett.,40, 641–645, doi:10.1002/grl.50161, 2013.
Van Der Werf, G. R., Randerson, J. T., Collatz, G. J., and Giglio, L.:Carbon emissions from fires in tropical and subtropical ecosys-tems, Glob. Change Biol., 9, 547–562, doi:10.1046/j.1365-2486.2003.00604.x, 2003.
van der Werf, G. R., Randerson, J. T., Giglio, L., Collatz, G. J., Mu,M., Kasibhatla, P. S., Morton, D. C., DeFries, R. S., Jin, Y., andvan Leeuwen, T. T.: Global fire emissions and the contribution ofdeforestation, savanna, forest, agricultural, and peat fires (1997–2009), Atmos. Chem. Phys., 10, 11707–11735, doi:10.5194/acp-10-11707-2010, 2010.
Vestreng, V., Myhre, G., Fagerli, H., Reis, S., and Tarrasón,L.: Twenty-five years of continuous sulphur dioxide emis-sion reduction in Europe, Atmos. Chem. Phys., 7, 3663–3681,doi:10.5194/acp-7-3663-2007, 2007.
Wayson, R. L., Fleming, G. G., and Iovinelli, R.: Methodologyto Estimate Particulate Matter Emissions from Certified Com-mercial Aircraft Engines, J. Air Waste Manage., 59, 91–100,doi:10.3155/1047-3289.59.1.91, 2009.
Whitburn, S., Van Damme, M., Kaiser, J. W., van der Werf,G. R., Turquety, S., Hurtmans, D., Clarisse, L., Clerbaux,C., and Coheur, P. F.: Ammonia emissions in tropicalbiomass burning regions: Comparison between satellite-derivedemissions and bottom-up fire inventories, Atmos. Environ.,doi:10.1016/j.atmosenv.2015.03.015, 2015.
Wiedinmyer, C., Akagi, S. K., Yokelson, R. J., Emmons, L. K., Al-Saadi, J. A., Orlando, J. J., and Soja, A. J.: The Fire INventoryfrom NCAR (FINN): a high resolution global model to estimatethe emissions from open burning, Geosci. Model Dev., 4, 625–641, doi:10.5194/gmd-4-625-2011, 2011.
Wilkerson, J. T., Jacobson, M. Z., Malwitz, A., Balasubrama-nian, S., Wayson, R., Fleming, G., Naiman, A. D., and Lele,S. K.: Analysis of emission data from global commercial avi-ation: 2004 and 2006, Atmos. Chem. Phys., 10, 6391–6408,doi:10.5194/acp-10-6391-2010, 2010.
Woody, M., Haeng Baek, B., Adelman, Z., Omary, M., Fat Lam,Y., Jason West, J., and Arunachalam, S.: An assessment ofAviation’s contribution to current and future fine particulatematter in the United States, Atmos. Environ., 45, 3424–3433,doi:10.1016/j.atmosenv.2011.03.041, 2011.
World Health Organisation: Health Aspects of Air Pollution withParticulate Matter, Ozone and Nitrogen Dioxide, Bonn, Ger-many, 2003.
World Health Organisation: Air Quality Guidelines a Global Up-date 2005: Particulate matter, ozone, nitrogen dioxide and sul-phur dioxide, Germany, 2005.
Yim, N.-H., Kim, S.-H., Kim, H.-W., and Kwahk, K.-Y.: Knowl-edge based decision making on higher level strategic concerns:system dynamics approach, Expert Syst. Appl., 27, 143–158,doi:10.1016/j.eswa.2003.12.019, 2004.
Yim, S. H. L., Lee, G. L., Lee, I. H., Allroggen, F., Ashok, A.,Caiazzo, F., Eastham, S. D., Malina, R., and Barrett, S. R.H.: Global, regional and local health impacts of civil aviationemissions, Environ. Res. Lett., 10, 034001, doi:10.1088/1748-9326/10/3/034001, 2015.
Young, P. J., Archibald, A. T., Bowman, K. W., Lamarque, J.-F.,Naik, V., Stevenson, D. S., Tilmes, S., Voulgarakis, A., Wild, O.,Bergmann, D., Cameron-Smith, P., Cionni, I., Collins, W. J., Dal-søren, S. B., Doherty, R. M., Eyring, V., Faluvegi, G., Horowitz,L. W., Josse, B., Lee, Y. H., MacKenzie, I. A., Nagashima, T.,Plummer, D. A., Righi, M., Rumbold, S. T., Skeie, R. B., Shin-dell, D. T., Strode, S. A., Sudo, K., Szopa, S., and Zeng, G.: Pre-industrial to end 21st century projections of tropospheric ozonefrom the Atmospheric Chemistry and Climate Model Intercom-parison Project (ACCMIP), Atmos. Chem. Phys., 13, 2063–2090, doi:10.5194/acp-13-2063-2013, 2013.
www.atmos-chem-phys.net/16/10521/2016/ Atmos. Chem. Phys., 16, 10521–10541, 2016