Impact of Windows and Daylight Exposure on Overall …jcsm.aasm.org/acceptedpapers/jc-274-13.pdf20...
30
1 Impact of Windows and Daylight Exposure on Overall Health and 1 Sleep Quality of Office Workers - A Case-Control Pilot Study 2 3 Mohamed Boubekri, Ph.D. 1* , Ivy N. Cheung, B.A. 2* , Kathryn J. Reid, Ph.D. 2 , 4 Nai-Wen Kuo, Ph.D. 1,3 , Chia-Hui Wang, Ph.D. 1,4 , Phyllis C. Zee, M.D., Ph.D. 2 5 6 7 1 School of Architecture, University of Illinois at Urbana-Champaign, Champaign, IL, USA 8 2 Department of Neurology, Northwestern University, Chicago, IL, USA 9 3 School of Health Care Administration, Taipei Medical University, Taipei, Taiwan 10 4 Department of Architecture, Hwa-Hsia Institute of Technology, Taipei, Taiwan 11 *These authors contributed equally to this work. 12 13 14 Correspondence Information 15 Address correspondence to: Mohamed Boubekri, Ph.D., School of Architecture, University of 16 Illinois at Urbana-Champaign, 611 Taft Drive, Champaign, IL 61820; Tel: (217) 333-2848; Fax: 17 (217) 244-2900; E-mail: [email protected] 18 19 20 Disclosure Statement 21 This was not an industry supported study. Dr. Zee has a Philips/Respironics 22 Educational/Research Gift to Northwestern University, has stock ownership of Teva, and is a 23 consultant for Sanofi-Aventis, UCB, Johnson and Johnson, Merck and Co, Takeda, Purdue, 24 Philips, Jazz, Vanda, and Ferring. Dr. Reid has grant support from Philips Consumer Lifestyles 25 for research unrelated to the work reported in the paper. The other authors have indicated no 26 financial conflicts of interest. 27
-
Upload
nguyendang -
Category
Documents
-
view
217 -
download
0
Transcript of Impact of Windows and Daylight Exposure on Overall …jcsm.aasm.org/acceptedpapers/jc-274-13.pdf20...

1
Impact of Windows and Daylight Exposure on Overall Health and 1
Sleep Quality of Office Workers - A Case-Control Pilot Study 2
3
Mohamed Boubekri, Ph.D.1*
, Ivy N. Cheung, B.A.2*
, Kathryn J. Reid, Ph.D.2, 4
Nai-Wen Kuo, Ph.D.1,3
, Chia-Hui Wang, Ph.D.1,4
, Phyllis C. Zee, M.D., Ph.D.2 5
6
7 1School of Architecture, University of Illinois at Urbana-Champaign, Champaign, IL, USA 8 2Department of Neurology, Northwestern University, Chicago, IL, USA 9 3School of Health Care Administration, Taipei Medical University, Taipei, Taiwan 10 4Department of Architecture, Hwa-Hsia Institute of Technology, Taipei, Taiwan 11
*These authors contributed equally to this work. 12
13
14
Correspondence Information 15
Address correspondence to: Mohamed Boubekri, Ph.D., School of Architecture, University of 16
Illinois at Urbana-Champaign, 611 Taft Drive, Champaign, IL 61820; Tel: (217) 333-2848; Fax: 17
(217) 244-2900; E-mail: [email protected] 18
19
20
Disclosure Statement 21
This was not an industry supported study. Dr. Zee has a Philips/Respironics 22
Educational/Research Gift to Northwestern University, has stock ownership of Teva, and is a 23
consultant for Sanofi-Aventis, UCB, Johnson and Johnson, Merck and Co, Takeda, Purdue, 24
Philips, Jazz, Vanda, and Ferring. Dr. Reid has grant support from Philips Consumer Lifestyles 25
for research unrelated to the work reported in the paper. The other authors have indicated no 26
financial conflicts of interest. 27

2
ABSTRACT 1
Study Objective: This research examined the impact of daylight exposure on the health of office 2
workers from the perspective of subjective well-being and sleep quality as well as actigraphy 3
measures of light exposure, activity, and sleep-wake patterns. 4
Methods: Participants (N=49) included 27 workers working in windowless environments and 22 5
comparable workers in workplaces with significantly more daylight. Windowless environment is 6
defined as one without any window or one where workstations were far away from windows and 7
without any exposure to daylight. Well-being of the office workers was measured by Short Form-8
36 (SF-36), while sleep quality was measured by Pittsburgh Sleep Quality Index (PSQI). In 9
addition, a subset of participants (N=21; 10 workers in windowless environments and 11 workers 10
in workplaces with windows) had actigraphy recordings to measure light exposure, activity and 11
sleep-wake patterns. 12
Results: Workers in windowless environments reported poorer scores than their counterparts on 13
two SF-36 dimensions, role limitation due to physical problems and vitality, as well as poorer 14
overall sleep quality from the global PSQI score and the sleep disturbances component of the 15
PSQI. Compared to the group without windows, workers with windows at the workplace had 16
more light exposure during the workweek, a trend towards more physical activity, and longer 17
sleep duration as measured by actigraphy. 18
Conclusions: We suggest that architectural design of office environments should place more 19
emphasis on sufficient daylight exposure of the workers in order to promote office workers’ 20
health and well-being. 21
Keywords: light exposure, sleep quality, quality of life, architectural design, office environment 22
3
BRIEF SUMMARY 1
Current Knowledge/Study Rationale: Both the amount and timing of light exposure is 2
important for physical and mental health. While research indicates possible links between light 3
exposure in work places and workers’ productivity and performance, less is known about the role 4
of work place light exposure on workers’ quality of life and sleep quality. 5
Study Impact: Office workers with more light exposure at the work place tended to have longer 6
sleep duration, better sleep quality, more physical activity, and better quality of life compared to 7
office workers with less light exposure at the work place. Office workers’ physical and mental 8
well-being may be improved via enhanced indoor lighting for those with insufficient daylight in 9
current offices as well as increased emphasis on light exposure in the design of future offices. 10

4
1. Introduction 1
Since the sick building syndrome of the 1970s and the World Health Organization’s 2
“Declaration on Occupational Health for All” in 1994,1 occupational health has become a salient 3
issue among health professionals and architects alike. With the increased interest today in green 4
architecture, daylighting is becoming an important design consideration. Typically, daylighting 5
recommendations are made in the form of daylight factor levels ranging between 2% to 6% 6
depending on building types and activities. A daylight factor is a percentage of indoor 7
illuminance compared to the outdoor illuminance on a horizontal surface. The daylight factor 8
principle is valid for stable overcast sky conditions only; sunny conditions are too dynamic and 9
changing to be considered. 10
Although there are many studies that have explored the relationship between daylighting, 11
psychological well-being and workers’ productivity or school children’s performance,2-4
few 12
have addressed the impacts of daylight at the work place on sleep, quality of life, and overall 13
health. Exposure to light-dark patterns is one of the main environmental cues for circadian 14
rhythms that influence approximately 24-hour biological, mental, and behavioral patterns such as 15
sleep and activity.5 The timing of light exposure is very influential on these rhythms, and 16
previous research has shown that office environment lighting during work hours can act as a 17
regulator of circadian physiology and behavior, with blue-enriched artificial lighting even 18
competing with natural light as an entrainer.6 Given that office hours occur during biologically 19
natural daylight hours, we posit that light exposure in the office environment will have effects on 20
sleep, and via sleep and other influences also have effects on physical and mental health. 21
There is much evidence that links insufficient sleep and/or reduced sleep quality to a 22
range of significant short-term impairments such as memory loss, slower psychomotor reflexes 23
5
and diminished attention.7-9
If windowless environments or lack of daylight affect office workers’ 1
sleep quality, there will be subsequent effects not only individually but also on a societal level, 2
leading to more accidents, work place errors, and decreased productivity. Sleep quality is also an 3
important health indicator that may have effects on and interactions with mood,10, 11
cognitive 4
performance,12
and health outcomes such as diabetes13
and other illnesses. Therefore, it is crucial 5
to investigate the effects of daylight as it may provide a profound way to improve office workers’ 6
productivity and health as well as the safety of the community they work and live in. Deprivation 7
to light damages monoamine neurons and produces a depressive behavioral phenotype in rats.14
8
In humans, a direct correlation between the severity level of seasonal affective disorder and 9
exposure to natural light is well documented.15-17
Results of several studies suggest that both 10
natural and artificial bright light, particularly in the morning, can significantly improve health 11
outcomes such as depression, agitation, sleep, circadian rest-activity, and SAD.18-26
12
The aforementioned effects of light exposure, or the lack thereof, illustrate the 13
importance of proper light exposure for physical well-being and mental health. In our modern 14
society, many responsibilities at the work place and at home dictate self-imposed alterations 15
and/or loss of daylight in our daily lives. Findings from the previously discussed research 16
suggest that the light exposure determined by our daily schedules will have subsequent 17
consequences on our mood, cognitive performance, and overall well-being. However, studies 18
exploring the impact of daylight exposure, or lack thereof, on the health of office workers are 19
very scarce. Therefore, the aim of this study was to examine the influence of light exposure at 20
the work place, through the existence or absence of windows and of daylight, on office workers’ 21
sleep patterns, physical activity, and quality of life via actigraphy and subjective measures. In our 22
study we compared two groups of office workers, namely those with windows and abundant 23

6
levels of daylight and those without windows and with no direct contact with daylight at their 1
workstations, in terms of overall health and well-being, subjective sleep quality using well-2
validated scales, and objective measures of sleep, activity levels and light exposure via 3
actigraphy. We hypothesized office workers with windows in the work place would have more 4
light exposure, better sleep quality, more physical activity, and higher quality of life ratings 5
compared to office workers without windows in the work place. 6
7
2. Methods 8
2.1 Participants 9
A total of 49 participants were recruited, including 27 day shift workers in windowless 10
work places and 22 comparable day shift workers in work places with windows. Workers were 11
selected from volunteers within administrative support staff and other office workers on the 12
campus of the University of Illinois at Urbana-Champaign (UIUC) whose work schedule was 13
from 8AM to 5PM. The typical recruitment process was done by contacting an office manager, 14
who in turn provided names of volunteers from his/her group. The participants were not told 15
about the specific objectives of the study but were informed that the study was about the impact 16
of work place, physical and social conditions on productivity and well-being. 17
In addition, a subset of the participants had actigraphy recordings to measure light 18
exposure, activity, and sleep. A total of 21 participants had actigraphy recordings, including 10 19
office workers in windowless work places and 11 office workers in work places with windows. 20
Participants were selected for actigraphy based on a convenience sample with volunteers from 21
office locations with and without windows. 22
Once the volunteers were identified, daylight factors at their workstations were measured. 23
7
Only daylight factors above 2% were kept in the study for workers in work places with windows. 1
Generally daylight factors below 2% are deemed not useful for task performance illumination. In 2
this study, we define a windowless work place as one without any window or one where 3
workstations were far away from windows and therefore had no exposure to daylight and no 4
views to the outside world. The Institutional Review Board of the University of Illinois at 5
Urbana-Champaign approved the research study, and all volunteers gave informed written 6
consent as required by UIUC regulations and standards. The cities of Urbana-Champaign are 7
relatively small, and the commute for most participants is generally less than 15 minutes by car. 8
Nearly all participants drove individual cars to work. 9
10
2.2 Measures - Questionnaires 11
Office workers’ health related quality of life was measured by Short Form 36 (SF-36), a 12
questionnaire with 36 items related to the physical and psychosocial domains of health 13
influenced by a person’s experiences, beliefs, and perceptions of health. The SF-36 survey is a 14
well-validated health status questionnaire that measures an individual’s physical functioning, 15
bodily pain, and perception of the ability to perform physical, social, and emotional role 16
functions.27
17
The Pittsburgh Sleep Quality Index (PSQI) was utilized to evaluate subjective sleep 18
quality of the participants. This self-rated questionnaire assesses sleep quality and disturbances 19
over a 1-month time interval.28
The PSQI is composed of 19 self-rated questions and 5 questions 20
rated by a bed partner or roommate. Only the self-rated items were used in scoring the scale. The 21
19 questions generate seven component scores: subjective sleep quality, sleep latency, sleep 22
duration, habitual sleep efficiency, sleep disturbances, use of sleeping medication, and daytime 23
8
dysfunction. Each component score ranges from 0 (no difficulty) to 3 (severe difficulty). The 1
component scores are summed to produce a global score with a range of 0–21. A higher score 2
indicates lower sleep quality. A PSQI global score >5 is considered suggestive of significant 3
sleep disturbance. 4
A daylight deprivation survey was administered that includes questions pertaining to 5
demographic characteristics (age, gender, race, and working experience) and behavioral 6
characteristics (self-reported amount of exposure to daylight on a scale of 1-10 with 1 being 7
always exposed and 10 being never exposed, hours of outdoor activities per day, eating behavior 8
prior going to bed and duration of current light exposure level). 9
10
2.3 Measures - Actigraphy 11
Participants wore an Actiwatch-L (Minimitter) on their non-dominant wrist. An actiwatch 12
device is an ambulatory physiological data logger often used in research and clinical settings to 13
detect and record motion during wake and sleep. The Actiwatch-L has an accelerometer 14
sensitivity of 0.05 g-force and is equipped with a photodiode for measuring amount and duration 15
of light illuminance. Participants were instructed to continuously wear these actiwatches for a 16
period of two weeks without removing them (except for bathing) during the period of time they 17
were answering the questionnaires. Participants were also instructed to leave the actiwatches 18
exposed to the environment at all times and to avoid covering them with clothing. The 19
questionnaires and actiwatches were administered during late spring and summer seasons. 20
Valid data were recorded for a range of 6 to 10 workdays and 2 to 4 free days in 21
participants, with the average participant yielding 8.4 workdays and 3.4 free days of actigraphy 22
data meeting inclusion criteria for analysis, as determined by less than 4 hours of off-wrist time 23

9
per day. Analysis was conducted on Actiware software version 5 (Philips Respironics) with 30 1
second sampling epochs and wake threshold value of 40 activity counts. Sleep start was defined 2
as the first 10 minute period in which no more than one epoch was scored as mobile. Sleep end 3
was defined as the last 10 minute period in which no more than one epoch was scored as 4
immobile. Wake threshold selection was set at medium. 5
Actigraphy measures were calculated as the average of each participant’s valid workdays 6
(split into wake time to 8AM for workday mornings, 8AM to 5PM for work hours, and 5PM to 7
sleep start for workday evenings) and valid free days for activity and light exposure variables, 8
and for nighttime hours following workdays and free days for sleep variables. Actigraphy 9
variables analyzed include total activity counts (sum of all valid physical activity counts for all 10
epochs in the active period from wake time to 8AM for workday mornings, 8AM to 5PM on 11
workdays for work hours, 5PM to sleep start for workday evenings, and for wake periods during 12
free days), sleep onset time (clock time of sleep start on nights following workdays and free 13
days), sleep onset latency (time elapsed between the start time of a given rest interval and the 14
following sleep start time on nights following workdays and free days), sleep efficiency (the 15
percentage of scored total sleep time to interval duration minus total invalid time for the given 16
rest period on nights following workdays and free days), wake after sleep onset (total minutes 17
between the start time and end time of a given sleep interval scored as wake on nights following 18
workdays and free days), sleep time (total minutes between the start time and end time of a given 19
interval scored as sleep on nights following workdays and free days), sleep fragmentation (sum 20
of percent mobile and percent immobile bouts less than 1 minute duration to the number of 21
immobile bouts for the given interval on nights following workdays and free days), and average 22
light exposure (sum of all valid illuminance data in lux on a logarithmic scale for all epochs from 23
10
the start time to the end time of a given interval multiplied by the epoch length in minutes from 1
wake time to 8AM for workday mornings, 8AM to 5PM on workdays for work hours, 5PM to 2
sleep start for workday evenings, and for wake periods during free days). 3
4
2.4. Statistical methods 5
First, we performed a Chi-square test (Homogeneity for Proportions) to compare 6
distributions of the demographics and behavioral characteristics as measured by the daylight 7
deprivation survey (age, race, gender, working experience, self-reported amount of exposure to 8
daylight, hours of outdoor activities per day, eating behavior prior to going to bed, and duration 9
of current light level exposure) between participants working in work places without windows 10
and participants working in work places with windows. Secondly, we performed t-tests to 11
determine any statistical difference between the two groups in terms of office workers’ health 12
related quality of life and sleep quality as measured on the SF-36 and PSQI. 13
For the subset of participants with actigraphy recording, distributions of the 14
demographics and behavioral characteristics as measured by the daylight deprivation survey 15
between workers in work places with no windows and workers in work places with windows 16
were compared to distributions in the overall group. T-tests were then utilized to gauge 17
differences between the two groups in terms of the following previously define actigraphy 18
measures: total activity counts, sleep onset time, sleep onset latency, sleep efficiency, wake after 19
sleep onset, sleep time, fragmentation index, and light exposure. Pearson’s bivariate correlations 20
were run between work hour light exposure as measured by actigraphy and subjective 21
questionnaires and other actigraphy variables. 22
23

11
3. Results 1
3.1 Demographics and behavioral characteristics of the two groups of workers 2
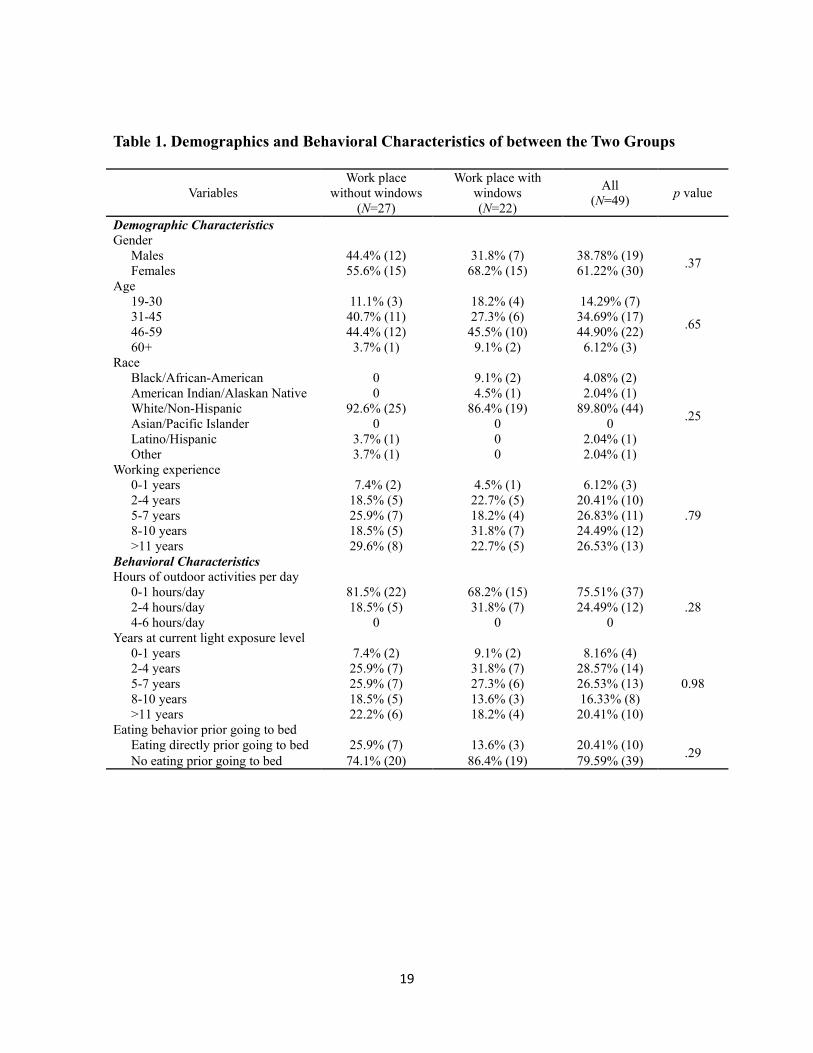
Results of the Chi-square test show no significant differences between these two groups 3
in terms of distributions of age, race, gender, working experience, hours of outdoor activities per 4
day, eating behavior prior to going to bed, and duration of current light level exposure (Table 1). 5
Therefore, these two groups are comparable except in their amount of self-reported amount of 6
exposure to daylight (Table 2). 7
For the subset of participants with actigraphy recording, distributions of the 8
demographics and behavioral characteristics as measured by the daylight deprivation survey 9
between workers in work places with no windows and workers in work places with windows are 10
comparable to respective distributions in the overall group, again with no significant differences 11
in these distributions between these groups except in their amount of self-reported amount of 12
exposure to daylight. 13
14
3.2 Light exposure of the two groups of workers 15
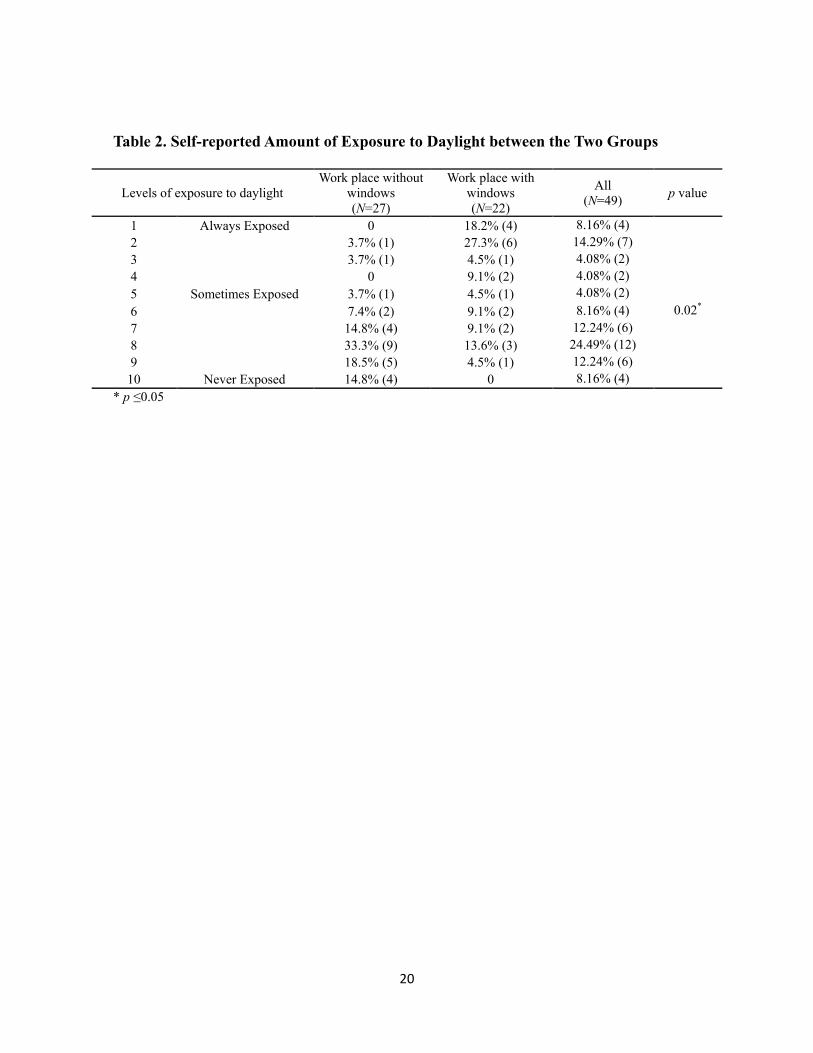
The self-reported amount of exposure to daylight scale show office workers in work 16
places without windows perceived they had significantly less exposure to daylight compared to 17
office workers in work places with windows, as expected (Table 2). Results from actigraphy 18
confirm average light exposure differences during work hours for the two groups, with workers 19
in work places with windows receiving more light exposure than workers in work places without 20
windows (Table 3 and Figure 1a; 3.00 log lux versus 2.58 log lux; p=0.02). There was no 21
significant difference in light exposure from wake time to start of the work period (Table 3; 2.57 22
log lux versus 2.38 log lux; p=0.32), however workers with windows in the work place had more 23

12
light exposure during workday evenings (Table 3; 2.50 log lux versus 1.93 log lux; p=0.008) and 1
during free days (Table 3; 3.30 log lux versus 2.37 log lux; p=0.003) compared to workers 2
without windows in the work place. While we cannot say from our data collection whether this 3
difference is from natural daylight or artificial lighting in the office building, workers without 4
windows at the work place had significantly lower average light exposure than workers with 5
windows during workday work hours and evenings as well as during free days. 6
7
3.3 Physical and mental conditions of the two groups of workers 8
Workers in work places without windows had significantly worse scores on two of the 9
SF-36 dimensions, role limitation due to physical problems (RP) and vitality (VT), compared to 10
the workers in work places with windows (Figure 2; p=0.001 and p=0.004, respectively). There 11
was also a positive correlation between light exposure during work hours and role limitation due 12
to physical problems (R=0.503, p=0.02). Overall, both the physical component summary (PCS) 13
(p=0.09) and mental component summary (MCS) (p=0.11) scores of those in work places 14
without windows are lower than scores of those working in work places with windows (Table 4). 15
Participants in work places without windows reported poorer scores on all eight dimensions of 16
the SF-36 compared to participants in work places with windows. 17
In addition, actigraphy monitoring indicates that workers with windows had more than 18
four times as much activity on average during work hours than workers without windows, 19
although this difference did not reach statistically significance (Table 3 and Figure 1b; 476,290 20
activity counts versus 115,280 activity counts; p=0.06). There was also a trend for workers with 21
windows to have more physical activity during workday mornings (Table 3; 135,071 activity 22
counts versus 36,274 activity counts; p=0.07) and workday evenings (Table 3; 295,188 activity 23

13
counts versus 69,083 activity counts; p=0.09) compared to workers without windows, however 1
there was no significant statistical difference during free days (Table 3; 839,780 activity counts 2
versus 224,696 activity counts; p=0.12). There was little correlation between activity and light 3
exposure levels during work hours (R=-0.075, p=0.75), workday evenings (R=-0.025, p=0.91), 4
and free days (R=-0.138, p=0.55). 5
6
3.4 Sleep quality of the two groups of workers 7
Workers without windows reported a tendency towards having poorer scores on overall 8
sleep quality from the global PSQI score compared to workers with windows (Table 5 and Figure 9
3; p=0.05), although we did note that the global PSQI score in both groups is high as a score 10
greater than 5 is considered suggestive of poor sleep quality. The significant difference in global 11
score may be attributed mainly to sleep disturbance, which was found to be different between the 12
two groups (Table 5 and Figure 3; p=0.02), while differences in daytime dysfunction and sleep 13
efficiency components contributed only moderately to poorer global PSQI scores for workers 14
without windows compared to workers with windows (Table 5 and Figure 3; p=0.08, and p=0.07, 15
respectively). Other PSQI sub scores did not differ significantly between the two groups. 16
Analysis of rest and activity patterns from actigraphy data show workers with windows at 17
the work place slept an average of 46 minutes more on average per night during the workweek 18
than workers without windows at the work place (Table 3 and Figure 1c; 476 minutes versus 430 19
minutes; p=0.02). There was also a positive correlation between light exposure during work 20
hours and sleep time on workday nights (R=0.483, p=0.03). While there were no significant 21
differences between workers with windows and workers without windows in sleep onset time 22
(21:46 versus 22:04), sleep onset latency (19 minutes versus 9 minutes), sleep efficiency (91% 23
14
versus 89%), wake after sleep onset (30 minutes versus 37 minutes), and sleep fragmentation (19 1
versus 22) on workday evenings, the averages point towards better measures of sleep quality for 2
workers with windows at the work place than workers without windows at the work place during 3
the workweek. Similarly, workers with windows at the workplace slept more than their 4
counterparts on free days (506 minutes versus 389 minutes; p=0.005) and, although there were 5
no differences in sleep onset time (22:06 versus 22:48), sleep onset latency (15 minutes versus 6
20 minutes), sleep efficiency (91% versus 90%), wake after sleep onset (31 minutes versus 36 7
minutes), and sleep fragmentation (20 versus 22) on free day evenings, the averages point 8
towards better measures of sleep quality for workers with windows at the work place than 9
workers without windows at the work place during free day evenings. 10
11
4. Discussion 12
These results demonstrate a relationship between work place light exposure and office 13
workers’ sleep quality, activity patterns, and quality of life. Workers in work places with 14
windows not only had significantly more light exposure during work hours but also slept an 15
average of 46 minutes more per night during the workweek than workers in work places without 16
windows. Workers with windows in the work place also had more light exposure during the 17
workday evenings and during free days as well as longer sleep time compared to workers 18
without windows in the work place. However, there were no differences in light exposure in the 19
mornings before the work period. Workers without windows also reported poorer scores than 20
their counterparts on the global PSQI score and the PSQI component sleep disturbances. None of 21
the other component scores of the PSQI were significantly different between the groups, nor 22
were actigraphy sleep variables other than sleep time different between the two groups. 23

15
These findings suggest that light exposure, or lack thereof, during work hours may have 1
effects beyond the work place that impact sleep duration and quality, which may then have 2
further effects on other health factors. Research indicates that insufficient sleep and reduced 3
sleep quality have myriad health and safety consequences. For example, insufficient sleep and 4
reduced sleep quality have been associated with higher evening levels of cortisol,29
impaired 5
glucose metabolism,30
increases in appetite via decreased leptin and increased ghrelin levels,31
6
and higher body mass index32
as well as increased fatigue, deterioration of performance, 7
alertness, and mental concentration, which can lead to increased error rates and subsequent risk 8
of injury.7-9
9
These health and performance consequences may impact perceived health related quality of 10
life, as measured by the SF-36. Our results from the SF-36 show work places without windows 11
have significantly negative impact on workers’ role limitation due to physical problems (RP) and 12
vitality (VT), as well as a marginal negative impact on workers’ mental health compared to work 13
places with windows. These results are similar to the findings of a study that examined 5 14
dimensions (GH, V, SF, RE, and MH) of the SF-36 and found that the scores of vitality (VT), 15
social functioning (SF) and mental health (MH) for those working in dark offices are lower than 16
those working in offices with more lighting.33
Another study focusing on predictors of burnout 17
among nurses found that exposure to at least 3 hours of daylight per day resulted in less stress 18
and higher satisfaction at work.34
While those with more daylight in the work place also have 19
higher daily physical activity during work hours and workday evenings, our analysis cannot 20
determine whether the workers get more activity because of the daylight or whether they have 21
more daylight exposure due to activity. There was no difference in physical activity between the 22
two groups during free days despite differences in light exposure during free days, and 23
16
correlations between physical activity levels and light exposure during work hours, workday 1
evenings, and free days did not suggest a strong relationship. Nonetheless, it remains a 2
possibility that differences in activity level may influence light exposure and also sleep, yet the 3
tendency towards higher activity levels indicates workers with more daylight exposure may have 4
less physical problems or complaints regarding vitality in parallel with our findings on subjective 5
measures of the SF-36. 6
Prior to this study, little was known about how architectural features such as windows 7
impact light exposure and subsequent effects on physical and mental factors. Via examination of 8
the influence of office settings with and without windows on office workers’ light exposure, 9
sleep, physical activity, and quality of life via actigraphy and subjective measures, this research 10
study shows office workers in work places with windows may have more light exposure, better 11
sleep quality, more physical activity, and higher quality of life ratings compared to office 12
workers in the work place without windows. 13
This study has some limitations that could be addressed in future work. For example, the 14
small sample size and sampling methodology could be addressed in a larger study. Participants 15
for this study were volunteers based on a convenience sample, which may have introduced bias. 16
The amount of light in an office may be associated with position or level of experience in the 17
work place; however, we found no differences in age, race, gender, years at current job, and 18
duration of working in current light levels between workers in office settings with and without 19
windows. We also do not have data from the participants on caffeine use, measurements of stress 20
levels, and chronotype, which is of interest given the outcome measures of this study. Although 21
we observed no differences in sleep onset time between the two groups of workers on both 22
workday nights and free day nights, the possibility remains that chronotype, circadian timing, or 23

17
other behavioral measures may be responsible for some of the differences observed in the two 1
groups of workers. This warrants further investigation. The objective measures of wrist 2
actigraphy support the subjective findings; however, actigraphy data was collected for only 21 of 3
the 49 total participants. Furthermore, although actigraphy has reasonable validity and reliability 4
and is often used as a sleep assessment tool in sleep medicine, this methodology has some 5
limitations. Sleep diaries were not collected in this study, and therefore were unavailable for the 6
actigraphy analysis. For sleep-wake periods, actigraphy has low specificity for detecting 7
wakefulness within sleep periods. Actigraphy is also neither sensitive to low light levels nor 8
calibrated for artificial fluorescent lighting. As such, light exposure measurements for workers in 9
office settings without windows may be an underestimate. In addition, since light exposure data 10
is collected from the wrist, there is the possibility that error may be introduced by covering of the 11
actiwatch and, therefore, reported values may not be fully representative of the light levels 12
reaching the retina. Our data collection methods also do not allow for differentiation between 13
natural daylight and artificial lighting, and does not allow for analysis of specific wavelengths of 14
light exposure. Future studies would benefit from using devices that collect spectral distribution 15
for comparison between the two work place groups. Lastly, additional benefits of work places 16
with windows, such as the roles of views and other dimensions, were not taken into account in 17
this study. Views may bring some psychological dimension while daylight may have 18
physiological effects. Future research may be able to dissociate the different roles of views and 19
daylighting of windows. This can be done for example by exploring the differences between 20
skylights that provide very limited views to the sky only versus side windows. Despite these 21
limitations, significant differences are seen with light exposure levels and subsequent measures 22
of sleep quality and physical and mental well-being. 23

18
As emphasized in the WHO Declaration on Occupational Health for All1, the focal point 1
for practical occupational health activities is the work place. Therefore, employers have a social 2
responsibility to plan and design a safe and healthy working environment for their employees. 3
Some countries (such as Canada, Germany and France) recommend certain amounts of daylight 4
in schools and offices. Yet even in these countries it is not a requirement. In the United States, 5
the national building code lists windows primarily as a means of emergency escape and rescue as 6
opposed to natural lighting. Given the results of this study, we conclude that emphasizing 7
daylight exposure and lighting in the work place may positively impact the well-being of people 8
working in those spaces. Lower amounts of light exposure in the work place was associated with 9
reduced sleep duration, poorer sleep quality, lower activity levels, and reduced quality of life in 10
this sample of office workers. Light exposure in the work place may therefore have long lasting 11
and compounding effects on the physical and mental health of the workers not only during but 12
also beyond work hours. Enhanced indoor lighting for those with insufficient lighting in current 13
offices as well as increased emphasis on light exposure in the architectural design of future office 14
environments is recommended to improve office workers’ sleep quality and physical well-being. 15
Workers with limited or no access to windows in the workplace may increase their light 16
exposure during work hours in various ways. Taking a walk during a break or enjoying lunch 17
outdoors are simple ways to increase daytime natural light exposure. Further research is needed 18
to determine what light exposure durations or intensities are sufficient or optimal for benefits to 19
well-being. 20
5. Acknowledgements 21
The authors thank the subjects for their participation. This research was supported by the Illinois 22
Campus Research Board of the University of Illinois at Urbana-Champaign and NIH grants 5T32 23
HL790915 and P01 AG11412. 24
19
Table 1. Demographics and Behavioral Characteristics of between the Two Groups
Variables
Work place
without windows
(N=27)
Work place with
windows
(N=22)
All
(N=49) p value
Demographic Characteristics
Gender
Males 44.4% (12) 31.8% (7) 38.78% (19) .37
Females 55.6% (15) 68.2% (15) 61.22% (30)
Age
19-30 11.1% (3) 18.2% (4) 14.29% (7)
.65 31-45 40.7% (11) 27.3% (6) 34.69% (17)
46-59 44.4% (12) 45.5% (10) 44.90% (22)
60+ 3.7% (1) 9.1% (2) 6.12% (3)
Race
Black/African-American 0 9.1% (2) 4.08% (2)
.25
American Indian/Alaskan Native 0 4.5% (1) 2.04% (1)
White/Non-Hispanic 92.6% (25) 86.4% (19) 89.80% (44)
Asian/Pacific Islander 0 0 0
Latino/Hispanic 3.7% (1) 0 2.04% (1)
Other 3.7% (1) 0 2.04% (1)
Working experience
0-1 years 7.4% (2) 4.5% (1) 6.12% (3)
.79
2-4 years 18.5% (5) 22.7% (5) 20.41% (10)
5-7 years 25.9% (7) 18.2% (4) 26.83% (11)
8-10 years 18.5% (5) 31.8% (7) 24.49% (12)
>11 years 29.6% (8) 22.7% (5) 26.53% (13)
Behavioral Characteristics
Hours of outdoor activities per day
0-1 hours/day 81.5% (22) 68.2% (15) 75.51% (37)
.28 2-4 hours/day 18.5% (5) 31.8% (7) 24.49% (12)
4-6 hours/day 0 0 0
Years at current light exposure level
0-1 years 7.4% (2) 9.1% (2) 8.16% (4)
2-4 years 25.9% (7) 31.8% (7) 28.57% (14)
5-7 years 25.9% (7) 27.3% (6) 26.53% (13) 0.98
8-10 years 18.5% (5) 13.6% (3) 16.33% (8)
>11 years 22.2% (6) 18.2% (4) 20.41% (10)
Eating behavior prior going to bed
Eating directly prior going to bed 25.9% (7) 13.6% (3) 20.41% (10) .29
No eating prior going to bed 74.1% (20) 86.4% (19) 79.59% (39)
20
Table 2. Self-reported Amount of Exposure to Daylight between the Two Groups
Levels of exposure to daylight
Work place without
windows
(N=27)
Work place with
windows
(N=22)
All
(N=49) p value
1 Always Exposed 0 18.2% (4) 8.16% (4)
0.02*
2 3.7% (1) 27.3% (6) 14.29% (7)
3 3.7% (1) 4.5% (1) 4.08% (2)
4 0 9.1% (2) 4.08% (2)
5 Sometimes Exposed 3.7% (1) 4.5% (1) 4.08% (2)
6 7.4% (2) 9.1% (2) 8.16% (4)
7 14.8% (4) 9.1% (2) 12.24% (6)
8 33.3% (9) 13.6% (3) 24.49% (12)
9 18.5% (5) 4.5% (1) 12.24% (6)
10 Never Exposed 14.8% (4) 0 8.16% (4)
* p

21
Table 3. Results of t-Test for Actigraphy Measures between the Two Groups
Mean S.D.
p value Work place without
windows
(N=10)
Work place with
windows
(N=11)
Workdays
Mornings
Total activity counts (arbitrary units) 36,274 48,654 135,071 163,184 0.07†
Average light exposure (log lux-min) 2.38 0.51 2.57 0.36 0.32
Work hours
Total activity counts (arbitrary units) 115,208 172,793 476,290 523,782 0.06†
Average light exposure (log lux-min) 2.58 0.55 3.00 0.16 0.02*
Evenings
Total activity counts (arbitrary units) 69,083 96,477 295,188 412,374 0.09
Average light exposure (log lux-min) 1.93 0.51 2.50 0.36 0.008**
Sleep onset time (hour: minute) 22:04 1:34 21:46 0:48 0.58
Sleep onset latency (min) 19.16 38.88 9.61 7.15 0.43
Sleep efficiency (%) 89.35 4.22 91.24 3.29 0.26
Wake after sleep onset (min) 37.25 13.38 30.10 14.87 0.26
Sleep time (min) 429.65 39.84 476.31 45.23 0.02*
Sleep fragmentation 22.23 11.06 18.84 5.81 0.38
Free days
Total activity counts (arbitrary units) 224,696 262,373 839,780 1,113,613 0.12
Average light exposure (log lux-min) 2.37 0.55 3.03 0.32 0.003**
Sleep onset time (hour: minute) 22:48 1:48 22:06 1:08 0.29
Sleep onset latency (min) 19.56 50.04 15.03 17.97 0.78
Sleep efficiency (%) 90.13 4.46 90.82 6.02 0.77
Wake after sleep onset (min) 36.38 17.53 31.13 19.00 0.52
Sleep time (min) 413.67 71.45 506.17 62.86 0.005**
Sleep fragmentation 21.55 9.11 20.27 8.30 0.74
† p p , ** p 1
Workday mornings refer to wake time to 8AM period on workdays; Workday work hours refers to 8AM-5PM
work period on workdays; Workday evenings refers to 5PM to sleep onset period for activity and light
measures and refers to the sleep period following a workday for the sleep measures; Free days refer to days
spent away from the office environment without work hours.

22
Table 4. Results of t-Test for Short Form 36 between the Two Groups
Mean S.D.
p value
Work place
without windows
(N=27)
Work place with
windows
(N=22)
Norms of U.S.A.
general
population
PCS (physical
component summary)
50.09±7.83 53.57±5.86 50.00±10 0.09†
MCS (mental component
summary) 44.47 10.71 49.51±10.86 50.00±10 0.11
Physical Function (PF) 89.07 13.45 91.36 10.49 82.29 23.76 0.52
Role limitation due to
physical problems (RP) 67.59 37.86 96.59 8.78 82.51 25.52 0.001***
Bodily Pain (BP) 74.81 19.67 78.32 19.79 71.33 23.66 0.54
General Health (GH) 67.59 20.40 75.91 19.50 70.85 20.98 0.15
Vitality (VT) 45.56 21.27 61.82 15.32 58.31 20.02 0.004**
Social Function (SF) 79.63 21.13 88.07 18.29 84.30 22.92 0.15
Role limitation due to
emotional problems (RE) 69.14 42.29 81.82 36.70 87.40 21.44 0.27
Mental Health (MH) 68.15 15.59 75.64 16.37 74.99 17.76 0.10
† p p * p * p 01

23
Table 5. Results of t-Test for Pittsburgh Sleep Quality Index between the Two Groups
Mean S.D.
p value Work places without
windows
(N=27)
Work places with
windows
(N=22)
Component 1: Subjective sleep quality 1.11 0.64 1.00 0.76 0.58
Component 2: Sleep latency 1.00 1.07 0.73 0.88 0.34
Component 3: Sleep duration 1.48 0.94 1.14 0.89 0.29
Component 4: Sleep efficiency 0.74 1.16 0.27 0.55 0.07†
Component 5: Sleep disturbance 1.31 0.67 0.95 0.38 0.02*
Component 6: Use of sleep medication 0.42 1.00 0.14 0.64 0.23
Component 7: Daytime dysfunction 1.12 0.51 0.82 0.66 0.08†
Global PSQI Score 7.23 4.21 5.05 3.17 0.05*
† p p

���
�
��
Figure 1. Actigraphy measures of light exposure, total activity, and sleep time between ��
workers in work places with windows (N=11) and without windows (N=10). ��
Actigraphy data collected in a subset of the office workers show that those with windows in the ��
work place had higher light exposure (a), more total activity (b), and longer sleep time (c) than ��
workers without windows in the work place. * p < 0.05, † p < 0.10 ���

���
�
��
Figure 2. Short Form 36 (SF-36) measures of vitality and role limitation due to physical ��
problems between workers in work places with windows (N=22) and without windows ��
(N=27). ��
Workers with windows in the work place reported better scores on vitality (a) and role limitation ��
due to physical problems (b) on the SF-36 compared to workers with no windows in the work ��
place. * p < 0.05 ��

���
�
���
Figure 3. Pittsburg Sleep Quality Index (PSQI) measures between workers in work places ��
with windows (N=22) and without windows (N=27). ��
Workers with windows in the work place reported better overall global score on the PSQI (a) ��
compared to workers with no windows in the work place. The difference in global score is made ��
up mainly of differences in sleep disturbances (b), daytime dysfunction (c), and sleep efficiency ��
(d), with workers without windows reporting poorer scores than workers with windows on all ��
three PSQI subscores. * p < 0.05, † p < 0.10 �

27
6. References 1
1. WHO. Declaration on Occupational Health for All. Geneva, Switzerland: World Health 2
Organization Office of Occupational Health, 1994. 3
2. Haynes BP. The impact of office comfort on productivity. Journal of Facilities Management 4
2008;6:37-51. 5
3. Group HM. Windows and offices: A study of office worker performance and the indoor 6
environment. California Energy Commission: P500-03-082-A-9, 2003. 7
4. Thayer BM. Daylighting and Productivity at Lockheed. Solar Today 1995;9:26-29. 8
5. Roenneberg T, Kantermann T, Juda M, Vetter C, Allebrandt KV. Light and the human 9
circadian clock. Handbook of experimental pharmacology 2013:311-31. 10
6. Vetter C, Juda M, Lang D, Wojtysiak A, Roenneberg T. Blue-enriched office light competes 11
with natural light as a zeitgeber. Scandinavian journal of work, environment & health 12
2011;37:437-45. 13
7. Åkerstedt T, Czeisler C, Dinges D, Horne J. Accidents and sleepiness: A consensus statement. 14
At: International Conference on Work Hours, Sleep and Accidents. Stockholm, Sweden: 15
Journal of Sleep Research, 1994;3. 16
8. Leger D. The cost of sleep-related accidents: a report for the National Commission on Sleep 17
Disorders Research. Sleep 1994;17:84-93. 18
9. Mitler MM, Carskadon MA, Czeisler CA, Dement WC, Dinges DF, Graeber RC. 19
Catastrophes, sleep, and public policy: consensus report. Sleep 1988;11:100-9. 20
10. Bower B, Bylsma LM, Morris BH, Rottenberg J. Poor reported sleep quality predicts low 21
positive affect in daily life among healthy and mood-disordered persons. Journal of sleep 22
research 2010;19:323-32. 23
28
11. Leppamaki S, Partonen T, Vakkuri O, Lonnqvist J, Partinen M, Laudon M. Effect of 1
controlled-release melatonin on sleep quality, mood, and quality of life in subjects with 2
seasonal or weather-associated changes in mood and behaviour. European 3
neuropsychopharmacology : the journal of the European College of 4
Neuropsychopharmacology 2003;13:137-45. 5
12. Nebes RD, Buysse DJ, Halligan EM, Houck PR, Monk TH. Self-reported sleep quality 6
predicts poor cognitive performance in healthy older adults. The journals of gerontology. 7
Series B, Psychological sciences and social sciences 2009;64:180-7. 8
13. Knutson KL, Ryden AM, Mander BA, Van Cauter E. Role of sleep duration and quality in the 9
risk and severity of type 2 diabetes mellitus. Archives of internal medicine 2006;166:1768-74. 10
14. Gonzalez MM, Aston-Jones G. Light deprivation damages monoamine neurons and produces 11
a depressive behavioral phenotype in rats. Proceedings of the National Academy of Sciences 12
of the United States of America 2008;105:4898-903. 13
15. Graw P, Recker S, Sand L, Krauchi K, Wirz-Justice A. Winter and summer outdoor light 14
exposure in women with and without seasonal affective disorder. Journal of affective 15
disorders 1999;56:163-9. 16
16. Kripke D, Mullaney D, Savides TJ, Gillin JC. Phototherapy for nonseasonal major depressive 17
disorders. In: Rosenthal N, Blehar N, eds. Phototherapy for nonseasonal major depressive 18
disorders. New York: The Guilford Press, 1989:342–56. 19
17. Saarijarvi S, Lauerma H, Helenius H, Saarilehto S. Seasonal affective disorders among rural 20
Finns and Lapps. Acta psychiatrica Scandinavica 1999;99:95-101. 21
18. Beauchemin KM, Hays P. Sunny hospital rooms expedite recovery from severe and 22
refractory depressions. Journal of affective disorders 1996;40:49-51. 23

29
19. Benedetti F, Colombo C, Barbini B, Campori E, Smeraldi E. Morning sunlight reduces length 1
of hospitalization in bipolar depression. Journal of affective disorders 2001;62:221-3. 2
20. Lewy AJ, Bauer VK, Cutler NL et al. Morning vs evening light treatment of patients with 3
winter depression. Archives of general psychiatry 1998;55:890-6. 4
21. Lovell BB, Ancoli-Israel S, Gevirtz R. Effect of bright light treatment on agitated behavior in 5
institutionalized elderly subjects. Psychiatry research 1995;57:7-12. 6
22. Rosenthal NE, Sack DA, Gillin JC et al. Seasonal affective disorder. A description of the 7
syndrome and preliminary findings with light therapy. Archives of general psychiatry 8
1984;41:72-80. 9
23. Rosenthal NE, Sack DA, Carpenter CJ, Parry BL, Mendelson WB, Wehr TA. Antidepressant 10
effects of light in seasonal affective disorder. The American journal of psychiatry 11
1985;142:163-70. 12
24. Terman JS, Terman M, Lo ES, Cooper TB. Circadian time of morning light administration 13
and therapeutic response in winter depression. Archives of general psychiatry 2001;58:69-75. 14
25. Van Someren EJ, Kessler A, Mirmiran M, Swaab DF. Indirect bright light improves circadian 15
rest-activity rhythm disturbances in demented patients. Biological psychiatry 1997;41:955-63. 16
26. Wallace-Guy GM, Kripke DF, Jean-Louis G, Langer RD, Elliott JA, Tuunainen A. Evening 17
light exposure: implications for sleep and depression. Journal of the American Geriatrics 18
Society 2002;50:738-9. 19
27. Ware JE, Jr., Sherbourne CD. The MOS 36-item short-form health survey (SF-36). I. 20
Conceptual framework and item selection. Medical care 1992;30:473-83. 21
28. Buysse DJ, Reynolds CF, 3rd, Monk TH, Berman SR, Kupfer DJ. The Pittsburgh Sleep 22
Quality Index: a new instrument for psychiatric practice and research. Psychiatry research 23

30
1989;28:193-213. 1
29. Leproult R, Copinschi G, Buxton O, Van Cauter E. Sleep loss results in an elevation of 2
cortisol levels the next evening. Sleep 1997;20:865-70. 3
30. Spiegel K, Leproult R, Van Cauter E. Impact of sleep debt on metabolic and endocrine 4
function. Lancet 1999;354:1435-9. 5
31. Spiegel K, Leproult R, L'Hermite-Baleriaux M, Copinschi G, Penev PD, Van Cauter E. 6
Leptin levels are dependent on sleep duration: relationships with sympathovagal balance, 7
carbohydrate regulation, cortisol, and thyrotropin. J Clin Endocrinol Metab 2004;89:5762-71. 8
32. Taheri S, Lin L, Austin D, Young T, Mignot E. Short sleep duration is associated with 9
reduced leptin, elevated ghrelin, and increased body mass index. PLoS medicine 2004;1:e62. 10
33. Mills PR, Tomkins SC, Schlangen LJ. The effect of high correlated colour temperature office 11
lighting on employee wellbeing and work performance. Journal of circadian rhythms 12
2007;5:2. 13
34. Alimoglu MK, Donmez L. Daylight exposure and the other predictors of burnout among 14
nurses in a University Hospital. International journal of nursing studies 2005;42:549-55. 15
16
17


![Intrinsic Square Function Characterizations of Hardy ...math.usm.my/bulletin/pdf/acceptedpapers/2014-01-060-R1.pdf · Hardy spaces Hp(Rn) with p2(0;1] on the Euclidean space Rn and](https://static.fdocuments.net/doc/165x107/5f5ca41e4a53dd5e8b3e5be0/intrinsic-square-function-characterizations-of-hardy-mathusmmybulletinpdfacceptedpapers2014-01-060-r1pdf.jpg)