Impact of the International Coffee Agreement's Export Quota System on the World's ...€¦ · ·...
68
Policy, Planning, and Rewhach WORKING PAPERS Intemadional Commodity Markets Intemational Economics Department The World Bank February 1989 WPS148 Impact of the International Coffee Agreement's Export Quota System on the World's Coffee Market Takamasa Akiyama and Panayotis N. Varangis The new global coffee model shows which producing countries have gained and which have lost from the operation of the International Coffee Agreement - and what would happen if the Agreement were discontinued. The Policy, Planning, and Research Camplex disttibutes PPR Woiking Papers to ditsseinate the findings of we*kin prgres and to ancourege the exchange of idea among Bank staff and all others inte=tsd in development issues. These papers cafry the nanmes of the authors, reflect only their views, and should be used and cited accordingly. Tbe findings, interpretations, and cinclusiora are the authos' own. They should not be auntt totheWorld Bank. its Boardof Director., its managenant, or any of its manbercountries. Public Disclosure Authorized Public Disclosure Authorized Public Disclosure Authorized Public Disclosure Authorized Public Disclosure Authorized Public Disclosure Authorized Public Disclosure Authorized Public Disclosure Authorized
-
Upload
nguyendieu -
Category
Documents
-
view
219 -
download
3
Transcript of Impact of the International Coffee Agreement's Export Quota System on the World's ...€¦ · ·...

Policy, Planning, and Rewhach
WORKING PAPERS
Intemadional Commodity Markets
Intemational Economics DepartmentThe World BankFebruary 1989
WPS 148
Impact of theInternational Coffee Agreement's
Export Quota Systemon the World's Coffee Market
Takamasa Akiyamaand
Panayotis N. Varangis
The new global coffee model shows which producing countrieshave gained and which have lost from the operation of theInternational Coffee Agreement - and what would happen ifthe Agreement were discontinued.
The Policy, Planning, and Research Camplex disttibutes PPR Woiking Papers to ditsseinate the findings of we*k in prgres and toancourege the exchange of idea among Bank staff and all others inte=tsd in development issues. These papers cafry the nanmes ofthe authors, reflect only their views, and should be used and cited accordingly. Tbe findings, interpretations, and cinclusiora are theauthos' own. They should not be auntt totheWorld Bank. its Board of Director., its managenant, or any of its manbercountries.
Pub
lic D
iscl
osur
e A
utho
rized
Pub
lic D
iscl
osur
e A
utho
rized
Pub
lic D
iscl
osur
e A
utho
rized
Pub
lic D
iscl
osur
e A
utho
rized
Pub
lic D
iscl
osur
e A
utho
rized
Pub
lic D
iscl
osur
e A
utho
rized
Pub
lic D
iscl
osur
e A
utho
rized
Pub
lic D
iscl
osur
e A
utho
rized

NfPlannig and Resarc
International Commodity Markets
Ex-post simulations of the global coffee model 1990s if the quota system were suspended inover the recent period of operation of the Inter- 1990. But prices would recover in the secondnational Coffee Agreement's export quota half of the decade as production and exportssystem, 1981-86, show the following. The quota declined in lagged response so the very lowsystem had a stabilizing effect on world coffee prices of the first half.prices in the 198 1-85 period. In 1986, whencoffee. prices increased sharply due to the For 1990-2000 most producing countriesdrought in Brazil and the export quotas were would be better off in total real export revenuessuspended, prices would have been 24 percent with tht export quota system. But the extent ofhigher in the absence of the quotas over the the benefits vary considerably from one country1981-85 period. But the quotas have reduced to another. Low-cost countries - such as Costaexport revenues (in real terms), except for such Rica, Indonesia, the Philippines, and Papua Newlarge producers as Brazil and Columbia. These Guinea - could more than compensate for thecountries gained from tne scheme because they lower world prices under the without-quotaface very small or even zero marginal export situation by large increases in exports. High-rvenues from incnrased exports, due to their cost countries - such as C6te d'lvoire, Ellarge market shares. Salvador, Ethiopia, and India- would suffer
both from the lower prices and lower exportIn projections of the coffee market, with and quantities without the export quota scheme. The
without the export quota system, prices would two largest producers - Brazil and Columbiabe substantially lower during the first half of the - would also benefit from the extension of the
quota scheme.
This paper is a product of the Intemational Commodity Markets Division, Inter-national Economics Department. Copies are available free from the World Bank,1818 H Street NW, Washington DC 20433. Please contact Dawn Gustafson,room S7-044, extension 33714.
The PPR Working Paper Series disseminates the findings of work under way in the Bank's Policy. Planning, and ResearchComplex. An objective of the series is to get these fmdings out quickly, even if presentations are less than fully polished.The findings, interpretations, and conclusions in these papers do not necessarily represent official policy of the Bank.
Produced at the PPR Dissemination Center

COITENTS
II. Recent Developments in the World Coffee Marketand the ICA..... . ........o..................... 2
III. Description of the Model and Validation.......................3
Supply Block ........ o.o, : 7Demand Blockoo .... 60000000..O.... U 10oooo*olParameters and Elasticities in the Model ....... ..............10Evaluation of Ex-Post Simulation Results.....................16
IV. Ex-Post Simulation Results of the Model With andWithout the ICAo .... oo*.9o..oo.o.* ............ .o..*oo**99o*2l
V. Ex-Ante Simulation Results of the Model With andWithout the ICA......o...............o..o ......... ooo.. o.28
VI. The Impact of the Quota System ............ o...............49
VII. Policies to Cope with the Lower Prices in theAbsence of the Export Quota....oooo... .. 5.... ... ...
VIII. Conclusions. ................ 52
AN= oEXo ....... .o ... *oo*oo ..... o. ... o*o**.. 54
REFERENCES-o- -o ........ ooo.o..o.o*o..o.... .**oo*o62

- ii -
ACKNOWLEDCGEENTS
We would like to thank Ron Duncan, Chief of the International Commodity
Markets Division for his important contributions to this paper. O.A. Akoto,
Senior Economist of the International Coffee Organization, and Don Larson of
the International Commodity Markets Division, are also be to thanked for their
valupble comments. We also would like to thank Bela Balassa, a consultant for
the World Bank, for his critique of an earlier draft of this paper.
IMPACT OF THE INTERNATIONAL COFFEE ACREEMENT'S EXPORT QUOTA SYSTEM
ON THE WORLD COPFFE WARKET
I. Introduction
1. The International Coffee Agreement (ICA), utilizing an export quota
system, has been an important factor in the international coffee market in
recent years. The export quota scheme has succeeded in keeping world coffee
prices fairly stable in the most recent period of its operation (since October
1980) in spite of wide fluctuations in world coffee production. However,
recent criticisms against the quota system, especially from consuming
countries, have been intense. The major reasons for the frustration of
consuming countries are (i) inflexibility in allocation of quotas among
producing countries and among coffee varieties and (ii) the sales to the non-
member countries at large price discounts. The current Agreement is to expire
in September 1989 and discussions are already underway among the ICA members
for the negotiation of a new agreement. Because of the wide differences of
opinion over the unresolved issues, there is a fairly high degree of
uncertainty about whether a new agreement will come into force in October
1989.
2. Given this uncertainty, it is of interest to assess the impact the ICA
has had in the past and could have in the future on the world coffee market
and on each of the major exporting countries. For this purpose a new global
econometric model of the coffee economy was built. This paper presents
the model and some simulation results based on assumptions of an industry with
and without the quota system.
II. Recent Developments in the World Coffee Market and the ICA
3. The first international coffee agreement came into force in October
1963 with the main aim of halting a declining price trend. Its main market
regulatory instrument was an export quota system. The quota system was
discontinued in 1973 because producing and consuming countries could not agree
on the price and quota levels.
4. World coffee prices were at historically low levels in the early
1970s. When an extremely serious frost hit Brazil in 1975, prices skyrocketed
to reach US¢379/kg in 1977. After 1977 prices declined sharply and this sharp
decline prodded producing and consuming countries into negotiating a new
agreement with an export quota system as its main economic provision.
5. The export quota system was quite successful in keeping a floor under
prices between October 1980 and February 1986, when the quota system was
suspended. The suspension was triggered by a sharp increase in prices caused
by a forecasted reduction in Brazil's 1986/87 crop as a consequence of a very
severe drought in 1985. Prices declined steadily after the spring of 1986,
which led to prolonged discussions among ICA members and the eventual
reinstatement of the quota system in October 1987.

- 3 -
6. When the export quota system is operative, the global quota and each
exporting member's quota are determined at the beginning of each international
coffee year (October to September). Exporting members (covering over 95% of
world exports) can export only up to thm&,r quota levels to importing members
(covering between 85% and 90% of world imports). The quotas are adjusted
frequently, depending on the relationship between world prices and the price
range set under the Agreement. When the quota system is not operative there
are no constraints on members' exports.
7. There are no restrictions on exports from exporting members to non-ICA
importing members (non-quota market). The non-quota market countries consist
of New Zealand, the USSR and other centrally planned economies of Eastern
Europe axcept Yugoslavia, and all developing countries except Portugal and
Greece. No consistent and reliable data exist on prices in the non-quota
markets. Some ICA exporting members burdened with large stocks are reported
to have given as much as 50% discount to quota market prices. It is also
known that many transactions with the non-quota market countries involve
barter trade. Attempts to penalize these discounted sales have been made by
the ICO but with limited success.
III. Description of the Model and Validation
8. Specifications of commodity models vary greatly, depending on the
purposes for which the modrls are designed--short-term, long-term, global,
country-specific, etc. The present model was built to analyze the global
market as well as the coffee sectors of major producing countries, and to
- 4 -
undertake analysis of the operation of the ICA over the long run. The
specification of this model differs from the earlier World Bank model (Akiyama
and Duncan, 1982), especially in the way in which world prices are
determined. In solving for wc id prices the present model searches for a
price that equilibrates export supply and import demand in the quota market.
In the earlier model price was solved as a function of stocks and world
demand.
9. The new model also incorporates a simple version of the vintage capital
approach to the specification of the supply response (Akiyama and Trivedi,
1987). In this specification, supply of all the major producing countries is
determined in two stages--at planting and at harvesting. The model also uses
country-specific retail prices in the demand equations for all the major
consuming ICA-member countries and country-specific farmgate prices in the
supply equations for all the major producing countries.
10. The basic structure of the model is depicted in the flow charts of
Figures 1 and 2. The model consists of a supply block (Figure 1) and a demand
block (Figure 2). The supply block models new plantings, production, domestic
consumption and exports for 31 countries/regions. The demand block models
demand in 22 ICA-importing member countries. (The non-quota market is
exogenous to the model).
11. When the export quota system is operative, global and member-country
exports to the quota market are fixed. When the quota system is not operative
the exports of each country/region are determined by production, domestic

Figure 1: SUPPLY BLOCK OF THE MODEL
- -i Rate ) H Inot0tion
8 Z s | Corry-Oor ; WrlNew | ea Existingoe sc t[ Real Slocks Plantings a - D tTrees n Consurpti rF3rRgate i la_sP rice _ _ Population
|Year-End ProuctionYil
l tocks -
l Eport
3 xports Exports to
0Expots to *In Quota Years
Quorto Market this variable Is
I e~~~~~xosionus
W orld ExpDorts|
|to Qwota Market|
W orld szport iDes n;d |NFote:
| in Quota iMark:tl Direction of causal relationship
____Relationship with lags

Figure 2: DEMAND BLOCK OF THE MODEL
World Exports to Quota Market
I.
World Pri ce
~cE ~ T FRate
War~~~~~~~~~~
iPopuation -Import Demand It Retail| t . ~~~~~~~~~Price i
|-Taste
Note:-~ Direction of Casual Relationship

- 7 -
consumption and carry-over stocks of these countries/regions and are
responsive to world prices. World prices, proxied by the ICO "Other Milds"
Indicator Price, are determined by equating export supply to import demand in
the quota market. This price-determination algorithm is used both when the
quota system is operative and when it is not.
Supply Block
12. For each producing country, behavioral equations were estimated for new
plantings, production, domestic consumption, total ,exports and farmgate
prices. Identity equations are also used to define or link endogenous
variables. The equations consist of the following:
RFGPt = f (EXt, CPIt, WPtP...) Behavioral (1)
NPt = f (RFGPt, RFGPt_ji,.. ) Behavioral (2)
PCAPt = f (NPt, NPt-l*' YLD... Identity (3)
PDt = f (PcAPt, RFGTt...) Behavioral (4)
DCt = f (EXt, CPIt, POPt, GDPt, WPt...) Behavioral (5)
ESt = PDt + EStl1 - DCt -Xt Identity (6)
XAVt = PDt + ESt_1 - DCt Identity (7)
Xt= f (XAVt, WPt, EXt, CPIt, ....) Behavioral (8)
XMt = xt - XNmt Identity (9)

where:
RFGP = Farmgu,e price in real local currency terms.
EX = Exchange rate vis-a-vis US dollar.
CPI = Consumer Price Index.
WP = World coffee price, ICO "Other Milds" Indicator Price.
NP = Net change in number of "bearing trees" (USDA, Foreign Agriculture
Service: Coffee) from one year to the next.
PCAP = Production potential based on existing trees and estimated yields.
YLD = Yield per hectare.
PD = Production.
DC = Domestic consumption.
POP = Population
GDP = Real Gross Domestic Product.
ES = Year-end stocks.
X = Total export quantity.
XAV = Export availability.
XM = Exports to quota market.
XNM = Exports to non-quota market.
-9-
13. Specification of production is based on a vintage-capital production
approach. First, new plantings are determined by recent real farmgate prices,
which in turn are a function of exchange rates, inflation and world prices.
New and past plantings with yield determine production capacity. Production
is a function of production capacity, recent real farmgate prices and other
variables such as weather and the biennial production cycle.
14. Domestic demand equations in exporting countries are a function of
world price, inflation rate, exchange rate, population and GDP. Export
availability is defined as production plus carry-over sto.cks minus domestic
consumption. Export availability, world price, exchange rate and inflation
determine total exports. Finally, exports to the quota market are defined as
total exports minus exports to the non-quota market. Exports to the non-quota
market are exogenous. As discussed above, when the quota system is operative,
exports to the quota market also become ePogenous.
15. There are 31 individual countries/tegions modelled as ICA-exporting
countries. They are Costa Rica, Dominican Republic, El Salvador, Guatemala,
Honduras, Nicaragua, Mexico, Rest of Central America and Carribean, Brazil,
Colombia, Peru, Ecuador, Venezuela, Rest of South America, Cameroon, Burundi,
Ethiopia, Kenya, Madagascar, Rwanda, Tanzania, Uganda, C6te d'Ivoire, Angola,
Zaire, Rest of Africa, India, Indonesia, Philippines, Rest of Asia and Papua
New Guinea.

- 10 -
Demand Block
16. The total quota-market demand is defined as the sum of demand in 22 ICA
importing member countries. For each country, demand is specified in a
conventional manner, i.e., on a per capita basis with real income per capita,
population, taste and real retail prices as explanatory variables. Real
retail prices, in turn, are a function of exchange rates, inflation and world
prices. A time trend is used as a proxy for taste change. The 22 countries
modelled as ICA importing countries are the United States, Canada, Federal
Republic of Germany, France, United Kingdom, Italy, Portugal, Spain, Greece,
Belgium, Netherlands, Ireland, Switzerland, Austria, Denmark, Sweden, Norway,
Finland, Yugoslavia, Japan, Australia and New Zealand.
Parameters and Elasticities in the Model
17. A large number of parameters and elasticities were estimated and used
in the model. Those for supply and import demand are discussed here.
(i) Supply
18. Depending on availability and reliability of data, there are four
categories of supply specification in the model. They are:

- 11 -
(a) For Colombia, equations describing new plantings,
stumping, production capacity of old trees and production
were established. 1/
(b) For ten countries, equations describing net new plantings
and production were estimated. The countries specified in
this way are Costa Rica, Guatemala, the Dominican Republic,
Honduras, Mexico, Brazil, C6te d'Ivoire, Kenya, India and
Indonesia.
(c) For 15 countries and regions, simple supply equations
were specified due to lack of success in the estimation of
new planting equations or the unavailability of tree stock
data. They are the El Salvador, Nicaragua, Ecuador, Peru,
Rest-of-South America, Cameroon, Burundi, Ethiopia,
Madagascar, Rwanda, Tanzania, Zaire, The Philippines, Rest-
of-Asia, and Papua New Guinea.
More detailed analysis was possible for Colombia, because of theavailability of reliable data from the Federation de Cafecultores on newplantings, stumping and stock of old trees.

- 12 -
(d) For five countries and regions, production is exogenous.
They are Venezuela, Uganda, Angola, Rest-of-Africa and
Rest-of-Central America. 1/
19. In terms of world production shares, the countries for which the
vintage-capital approach was used (countries which fall into categories (a)
and (b) above) cover about 70%. Equations (1)-(4) above constitute the
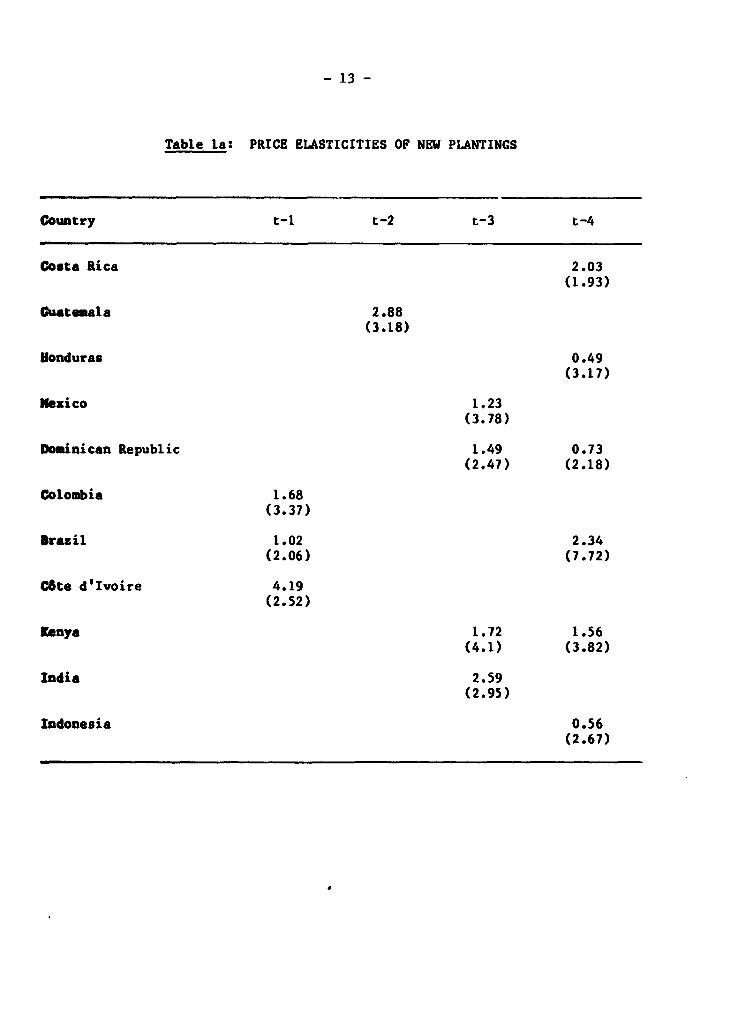
components of supply for these countries. Table la presents the price
elasticities of new plantings for the countries in categories (a) and (b).
20. For countries in category (c), no account was taken of tree stocks.
For these countries, it was assumed that tree stocks or production potential
change with time, and prices affect production only in the short term, i.e.,
PDt = f (TM , RFCPt, RFCPt1.. ) (10)
1/ For these countries, production was taken to be exogenous due to theunsatisfactory results obtained from attempts to estimate supplyequations. However, due to the small role these countries play in theworld market we do not believe that this reduces the effectiveness of themodel.
- 13 -
Table la: PRICE ELASTICITIES OF NEW PLANTINGS
Country t-1 t-2 t-3 t-4
Costa Rica 2.03(1.93)
Cutemala 2.88(3.18)
Honduras 0.49(3.17)
Nexico 1.23(3.78)
Dominican Republic 1.49 0.73(2.47) (2.18)
Colombia 1.68(3.37)
Brazil 1.02 2.34(2.06) (7.72)
Cbte d'lvoire 4.19(2.52)
Kenya 1.72 1.56(4.1) (3.82)
India 2.59(2.95)
Indonesia 0.56(2.67)
- 14 -
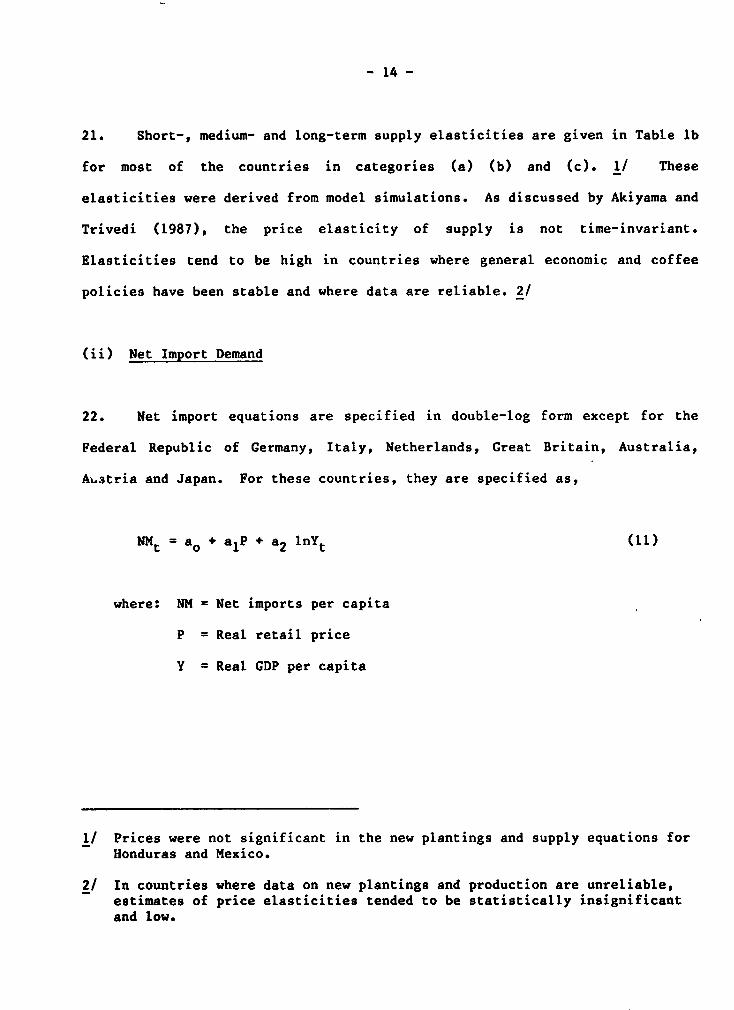
21. Short-, medium- and long-term supply elasticities are given in Table lb
for most of the countries in categories (a) (b) and (c). 1/ These
elasticities were derived from model simulations. As discussed by Akiyama and
Trivedi (1987), the price elasticity of supply is not time-invariant.
Elasticities tend to be high in countries where general economic and coffee
policies have been stable and where data are reliable. 2/
(ii) Net Import Demand
22. Net import equations are specified in double-log form except for the
Federal Republic of Germany, Italy, Netherlands, Great Britain, Australia,
Au.stria and Japan. For these countries, they are specified as,
NMt = aO + alP + a2 lnYt (11)
where: NM = Net imports per capita
P = Real retail price
Y = Real GDP per capita
1/ Prices were not significant in the new plantings and supply equations forHonduras and Mexico.
2/ In countries where data on new plantings and production are unreliable,estimates of price elasticities tended to be statistically insignificantand low.

- 15 -
Table lb: ELASTICITIES OF SUPPLY IN SELECTED COUNTRIES
'iears After Price ChangeTwo Years Five Years Ten Years
Brazil 0.03 0.10 0.36Burundi 0.03 0.47 0.95Cameroon 0.04 0.14 0.16Colombia 0.16 0.44 0.74Costa Rica 0.11 0.15 0.41C8te d'Ivoire 0.55 0.68 0.84Dominican Republic 0.19 0.34 0.78Ecuador 0.11 0.13 0.14El Salvador 0.13 0.15 0.16Ethiopia 0.06 0.15 0.19Guatemala 0.13 0.13 0.20Hondur-q 0.13 0.15 0.20India * 0.09 0.10 0.15lIdonesia 0.14 0.17 0.25Kenya 0.04 0.14 0.45Nexico 0.02 0.06 0.13Papua New Guinea 0.07 0.18 0.18Philippines 0.06 0.18 0.20Zaire 0.02 0.15 0.17

- 16 -
This specification was used because in these countries income elasticities are
observed to decline with per capita net imports. 1/ Average income and price
elasticities of demand for the estimated period 1968-86 2/ are given in Table
2. 3/
Evaluation of Ex-Post Simulation Results
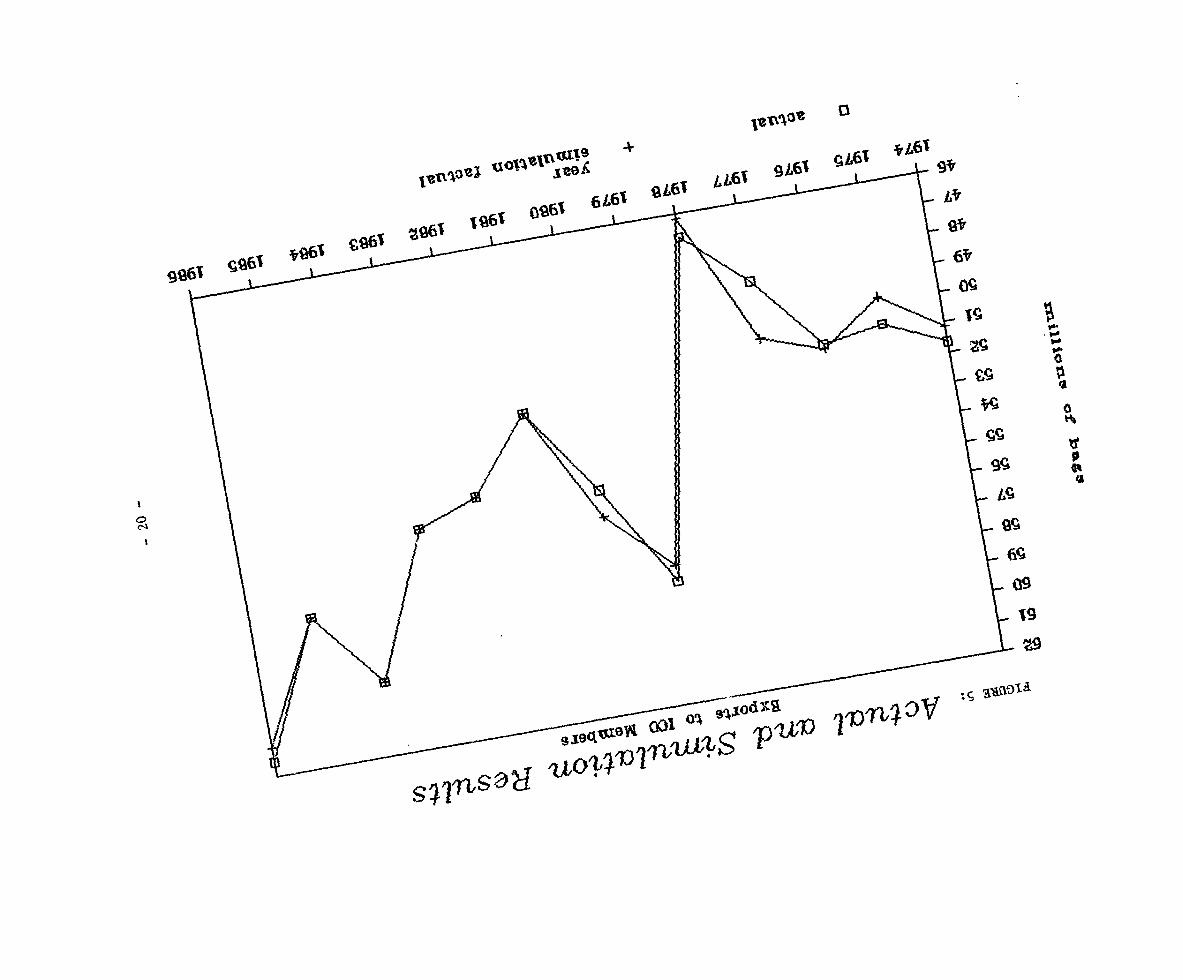
23. The model was run for the period 1974-84 and the results compared with
the actual values. The simulation results and the actual values for the ICO
"Other Milds" Indicator Price, world production and total exports to the quota
markets are given in Figures 3-5. As these figures show, the fit to the
actual values are very good and the model captures all the important turning
points. The differences between the simulated and actual values for
1/ Income elasticity is given by a2/NMt. Thus it declines with NMt.
2/ The crop year used in producing countries varies from one country toanother in terms of starting date. For example, Colombia's crop year isthe same as the international year which starts on 1 October, but Brazil'scrop year starts on 1 July. In this paper the production year refers tothe ending year unless otherwise specified, e.g., Brazil's production forthe 1987/88 crop year is referred to as Brazil's 1988 crop. All exportsare on the international coffee year basis, thus exports for the periodOctober 1987-September 1988 are referred to here as exports of 1988.
3/ Income elasticities for some countries such as Japan and Ireland werefound to be very high. This is due to the low per-capita consumptionlevels in these countries in the 1960s and early 1970s.

- 17 -
Table 2: DEMAND ELASTICITIES
Importing ImportingCountries Income Price Countries Income Price
Belgium 0.36 -0.28 United States N.S. /a -0.46Denmark 0.58* -0.43 Australia 1.72 -0.37Prance 0.68 -0.13 Austria 1.30 -0.54Federal Republicof Cermany 0.98 -J.17 Canada 0.28 -0.13
Greece 0.52 -0.49 Finland 0.34 -0.08Ireland 2.89 -0.34 Japan 2.03 -0.31Italy 0.92 -0.18 Norway 0.26 -0.14Netherlands 0.89 -0.34 Sweden N.S. -0.29Portugal 0.62 -0.28 Switzerland 0.56 * -0.24Spain 1.07 -0.07 * Yugoslavia N.S. N.S.United Kingdom 1.26 -0.51 New Zealand 1.28 -0.13
Selected Producing Countries Income Price /b
Hcwador 0.40 -0.08Mexico N.S. -0.14Brazil N.S. -0.09Colombia 0.41 -0.14India 0.24 N.S.Indonesia N.S. -0.07Dominican Republic N.S. -0.08
/a Statistically not significant.
/b Note that due to the unavailability of retail price data for thesecountries, the international coffee price in terms of local currenciesand deflated by the local CPI was used. Therefore, the priceelasticities presented here should be underestimates of the demandresponse to changes in retail prices.
* Significant at 10% level of significance. All others significant at 5%level of significance.
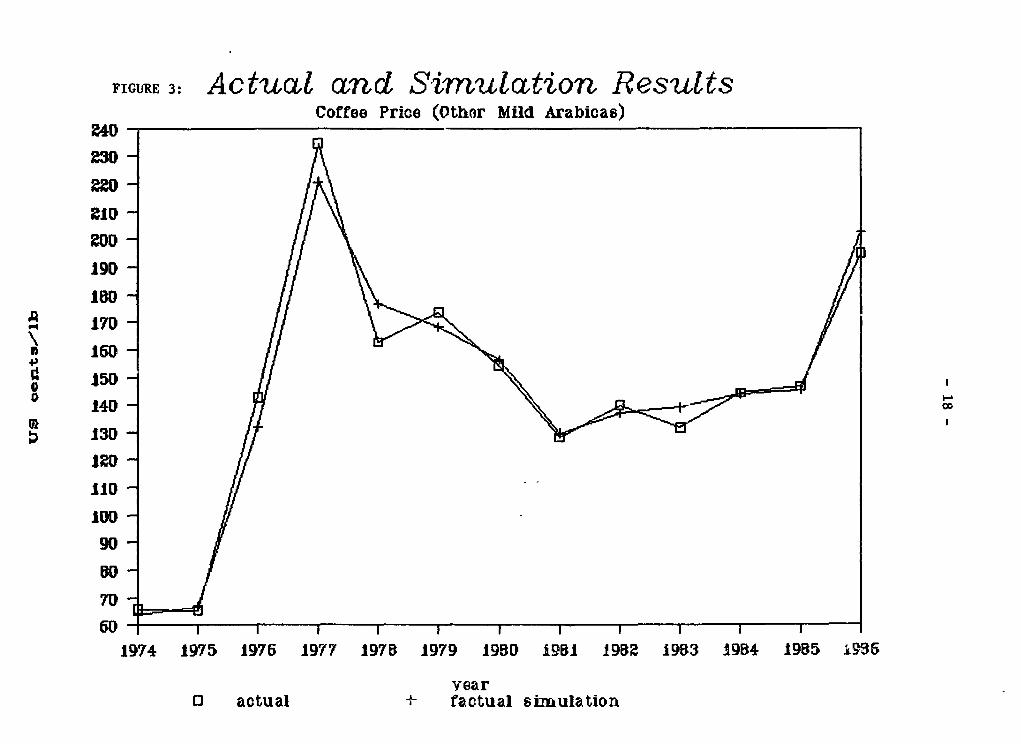
FIGURE 3: Actual and Simulation ResultsCoffee Price (Othor Mild Arabicas)
240 -
CID
~109
goD
190
100
170
150
140- covi
130
110
90
70
1974 1975 1976 1977 1970 1979 1980 1951 19B2 1903 1904 1955 1935
wear0 actual X- factual simulation
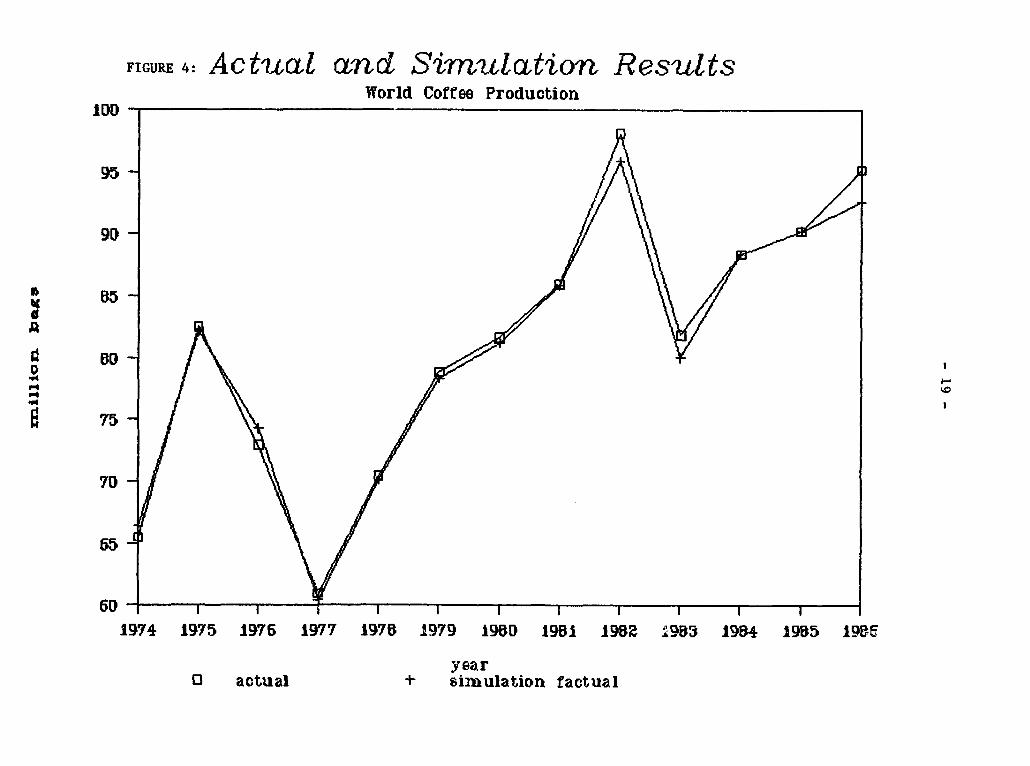
FIGURE 4: Actual and Simulation ResultsWorld Coffee Production
1DD -
95 \
90
80P4
55
60-1974 1975 1976 1977 1979 1979 1950 1951 1909 2953 1984 1985 195
year0 actual + simulation factual
13
c~~~~~26l 1,96~~~~~~~~~~~~~6
94;
0~~~~~~~~~~~~~~~~~~~~~~~~0
09
031~~~~~~~~~1
ola/071p1UTV

- 21 -
the total exports to the quota markets are zero for the period 1981-85 because
in the simulation run these values are exogenous.
24. Some test statistics for these variables are given in Table 3. The
root-mean-squared-percentage error for the price is only 4.3% and that for
world production only 1.4%.
Table 3: TEST STATISTICS FOR THE EX-POST SIMULATION RUN
ICO "Other Milds" World Total Exports toIndicator Price Production The Quota Market
Mean % Absolute Error 5.4 1.1 0.9
Root Mean Squared % Error 4.3 1.4 1.4
IV. Ex-Post Simulation Results of the Model With and Without the ICA
25. In order to evaluate the effects of the ICA, the model was run with the
quotas (factual) and without the quotas (counter-factual) for the period 1981-
86. The simulation results for some of the key variables are given in Figures
6-8.
26. To allow examination of the market stabilizing effects of the ICA,
variances of these key variables are given .n Table 4. The results show the
significant price stabilization effects the ICA had during the period 1981-

FIGURE 6: Factual vs. Counterfactutl SimulationsCoffee Price (Other Mild Arabicas)
Z60 -
Z5D
24Dg30
190
b 170
o 15014D13012011010090BD70
1974 1975 1975 1977 1978 1979 1900 1901 1902 1903 1904 19B5 1905
year0 counter factual + factual

FIGURE 7: F ctctual and Counterfactuat SimutltionsWorld Coffee Producticn
95-
90
E15-ID
0~~7
75
70
1974 1975 1976 1977 1978 1979 1980 1981 190. 1983 1904 19u5 1986
year0 courkterf actual t factual

FIGURE 8: Factualc nd Counterfcctuat SimulcttionsExports to IOU Members
51
5D
59
50
5 57
* 55
55
5 ~54
D ~53
50
49-
40-
47-
46- a -1974 1975 1975 1977 197B 1979 19BO 19B1 195B 1953 1984 1955 1955
year*: 1Jn caunterfactual + factual

- 25 -
85. An interesting result is the ICA's price stabilizing effect in 1986 when
the quota system was not in force. The explanation for this is that when the
quota system was in force during the period 1981-85, many producing countries
were forced to accumulate stocks. When the quotas were lifted in 1986, these
sttocks were released which pushed prices down. The si.nulation results show
that had the quotas not been in force for the period 1981-85, total stocks
held in producing countries at the end of 1985 would have been 22 million bags
instead of an actual 33 million bags. The results also show that exports to
the quota market would have been 55 million bags in 1986 instead of the actual
62.5 million bags had the quota system been non-operative. Thus the quota
system had a significant effect in reducing world prices in 1986. If there had
been no quota scheme during the period 1981-85, world coffee prices would have
been 24X higher in 1986. This result would not have been found if the
simulation was performed over only a short period.
27. The results in Table 4 also show that under the quota system exports to
the quota market were more unstable than without the quota; but total real
export revenues were more stable. In other words, under the quota system
total exports are adjusted to stabilize prices and this results in stabilizing
export revenues.
28. In order to evaluate the costs and benefits of the quota system for
injor producing countries, factual and counter-factual simulatiun results were
compared. Originally, an atttempt was made to calculate economic welfare of
individual countries. However, as discussed in the Annex, it was found to be
very difficult to calculate these. Thus, comparisons were made only for real
export revenues. The deflator used was the World Bank's MUV. Also it was

- 26 -
Table 4: VARIANCES OF KEY VARIABLES WITH AND WITHOUT THE EXPORT QUOTAS;1981-85 AND 1981-86
Total ExportQuantity to Total Real
the Quota Market Export Revenue /aWorld Prices With Without With Without
Dates With Quota Without Quota Quota Quota Quota Quota
1981-85 31.5 182.5 7.3 1.0 1,496 3,6221981-86 584.9 2,142.8 10.4 1.5 3,490 9,762
/a Deflated by World Bank's MUV.
assumed that sales on the non-quota market were made at prices 30Z less than
in the quota market.
29. Total export revenues in 1985 constant dollar terms for total exports
and for individual country exports under the quota and without-quota scenarios
are given in Table 5. For the total of real export revenues there is hardly
any difference for the period 1981-85. However, if 1986 is included the world
total would have been 4.7Z higher if the quota system had not existed during
the period 1981-85. As discussed above, this is because world prices would
have been higher in 1986 had the quotas not existed in the period 1981-85.
30. For individual countries it is interesting to note that most of the
small exporters would have been better-off in terms of real export revenues
without the quotas. But large exporters such as Brazil, Colombia and Cate
d'Ivoire are among the few countries that gained from the quota system. When
large countries increase their exports world prices decline--often to the

- 27 -
Table 5: TOTAL REAL EIORT REVENUES (1981415/16)
Coontry Date Quota Ib Qota I I DlftarC /a
I-lllln of coasteot 1985 US$--__----
World Total 1981-85 54.869 55I 115 -0.5World Total 1981-86 69,828 75,081 .4.7
Costa RIca 1981-85 1445 1524 -5.5Costa Rica 1981-86 1781 1942 -9.1
El Salvador 1981.85 2230 2184 2.1tl Salvador 1981-86 2781 2952 -3.6
G..tatala 1981-8s 1947 1978 -1.6Goateaola 1981-86 2468 2627 -6.4
bad-ras 1981-8S 942 969 -2.9Hotduras 1981-86 1278 1587 -8.5
NarItao 1981-85 2166 2261 -4.4Ibelco 1981-8b sool 5302 -10.0
NicareQoh 1981-85 721 737 -2.5MiCeaQoa 1981-86 859 909 -5.9
Colnbla 1981-85 8271 8114 i.0
Cobl bla 1981-86 10876 11558 -4.4
tatacuala 1981-85 57 55 S.0Veazoela 1981-86 125 144 .15.7
Cameroon 1981-85 1597 1353 5.lCaa-rooc 1981-86 1809 1867 -3.2
Etnlople 1981-85 1252 1225 0.7Etalopla 1981-86 1508 1567 -S.9
Cote dv-olra 1991-85 5726 5659 1.8Cota d'Iaolra 1981-86 4712 4697 -5.7
Kenac 1981-85 1505 150D 0.4K..y. 1981-86 1769 1878 -6.2
voleda 1991-85 2172 2081 4.7
UQ4ada 1981-86 2712 2755 -1.6
2Z1re 1981-85 1018 976 4.1
Za1re 1981-86 IS14 1595 -S.5
IndIa 1981-85 1050 1IS5 -8.1IndIa 1981-86 1453 1615 -12.6
Doniolcas RapoD1IC 1981-85 485 581 -20.00aeIaIc 0.P.b6 IC 1981-86 773 772 0.2
Br,aIl 1981-85 1S568 15191 2.4
BrazIl 1981-86 17979 18527 -1.9
Ecuador 1981-85 1198 1516 -9.8Euador 1981-86 1661 1757 -5.8
Peru 1981-85 748 869 -14.8Pert 1981-86 1091 1118 -2.5
8u.-di 1991-85 427 459 -7.58urundl 1981-86 604 599 0.7
Madagascar 1981-85 776 785 -0.9Vadagacar 1981-86 991 1041 -5.1
R.eada 1981-85 446 452 -1.4Rnaoda 1981-86 638 665 -4.0
taccanl 1981-85 776 809 -4.2Tlazaala 1981-86 97S 1029 -5.8
Angola 1981-85 408 420 -3.0Anqola 1981-86 444 487 -9.0
Indonola 1981-85 S532 5588 -7.8Iadon sls 1981-86 4550 5055 -10.7
PsIllDDplaW 1981-85 594 457 -16.2PhIl.lIpDoIa 1981-86 595 586 1.6
Papaa IN GuInea 1981-85 660 662 -0.2PApUa me. OJaI n 1981-86 854 914 -7.0
/a NqatIW Indlcata lou r total loor? revboa In It * 19h-cuOta cane.

- 28 -
extent that marginal export revenues are small or even zero.
31. A qualification has to be made about the interpretation of these
results. It was assumed when the counter-factual runs were made that there
would be no changes in government policies on production. In many producing
countries, export taxes on coffee are reported to be high because the
governments wanted to suppress production so there would not be large stocks
accumulated under the quota system, i.e., export taxes are necessary because
of the implementation of the quota system. If this is the case, in the
counter-factual case some of these countries could have had lower export taxes
on coffee and consequently larger production and exports than what the
simulation results indicate--and therefore world prices would have been lower.
However, it may be in the large countries' interests to increase export taxes
when there is no global export quota. Therefore, it is not clear what the net
impact on production, exports and price would be if we allow for export taxes
being endogenous.
V. Ex-Ante Simulation Results of the Model With and Without the ICA
32. The model was run ex-ante to project the world coffee market with and
without the ICA quota system. Assumptions used for the main exogenous
variables in the model are:
(i) Purchasing power parity is assumed to hold for the projected
period. To implement this assumption, all exchange rates were
kept at their average for 1987 and the inflation rate at 0%.

- 29 -
(ii) Population increases at the rate given in the World Development
Report of 1988.
(iii) CDP in industrial countries increases at an average rate of 2.5%
p.a. and that of developing countries increases at an average
rate of 4.5%.
(a) Projections with the quotas
33. The assumption was made that the ICA export quota system will
continue through 2000 and that the global quota will increase at a rate of
about 1.5% p.a. for the period 1989-2000--which approximates the projected
demand growth rate of total import demand of the importing ICA members when
prices are about US¢200/kg in terms of 1985 constant dollars. Non-quota
imports are assumed to increase at about 2.6% p.a.--a slightly lower rate than
the long-term trend of demand in these countries as consumption growth rates
usually decline with higher per capita consumption levels. The total domestic
demand growth rate in producing countries is projected to be 2.3% p.a., which,
with the export demand growth rate, gives total world demand growth of about
12t p.a. Projections for key variables under the quota and without-quota
F4renarios are given in Figures 9 to 12.
34. Under these assumptions, world coffee prices in 1985 US dollar terms
are projected to be about US¢210/kg until the early 1990s and show some
decline to the USc205/kg level in the late 1990s. World production is
projected to increase at only about 1.2Z p.a. for the period 1985-2000 but
this will be sufficient to meet the expected demand increase because present

FIGURE 9: Forecasts with and without QuotasCoffee Price (Other Mild Arabicas)
100 -
95 -
90
* 0~5
70
ID~ 5
60 - | | W | § § W | U . X w |
19B7 1900 i909 1990 1991 1992 1993 1994 1995 1996 1997 1998 1999 2wn0
year0 quota + non-quota

FIGURE 10: Forecatst with and without Quot asWorld Coffea Pr¢duction
115 -
110
105 i
9 100 1S 0
04
-P 90
00
75 g a -
1987 1900 1909 1990 1991 1992 1993 1994 1995 1996 1997 1990 1999 2000
yeare0 quota + no-quota

- 32 -
CY)~~~~~~~~~~~~~~~~~~~~~~~~~~4
0 B C
r-T~~~~~1
-. LX L" b- I- t- t- LO to t a" o ko 5 Xt U-
c 2w q Ja i:ts oF 11
FIGURM 12: Forecasts with and without QuotasWorld Export Revenues
B.5 -
8.4
8-2
* 7.8
"II
D1i 7.4D
2 ~6.0
P4~ 5,
5.4
1957 1988 1989 1990 1991 1992 1993 1994 1995 1996 1997 1998 1999 2000
year0 quota + non-quota

- 34 -
world production--taken as the base year for calculating growth rates--is
considerably higher than world consumption. The model shows that the world's
three largest coffee producers, Brazil, Colombia and Indonesia, will increase
their production at about 2X p.a. An important reason for their high expected
production growth rates is the high rate of real depreciation of the
currencies of these countries (about 30%) that took place over che last five
years. However, production in many other countries such as C6te d'Ivoire,
Ethiopia, Madagascar, El Salvador, Nicaragua, Dominican Republic and Haiti, is
projected to decline, or at best stagnate, due to overvaluation of their
currencies or to the very lin.ited rate of new plantings in the recent past due
to various reasons such as low real producer prices.
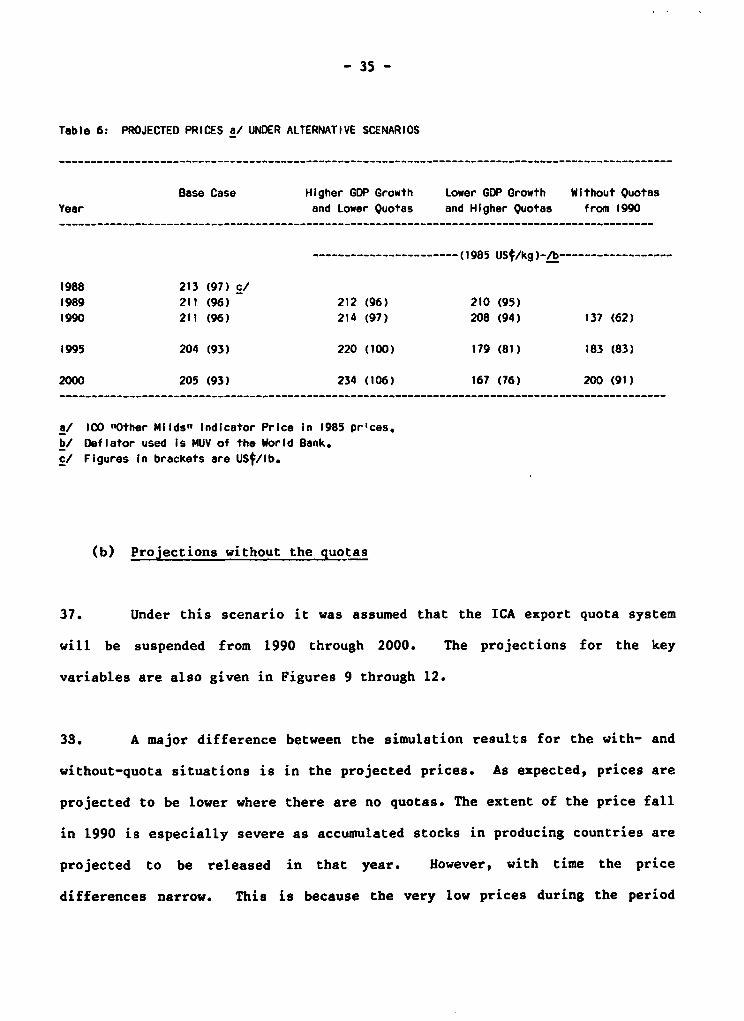
35. To evaluate the impact on world prices of different GDP growth rates
in importing countries and different global export quota growth rates, two
additional simulation runs were made with the coffee model. One had GDP
growing at 0.5% p.a. lower than the base case and the global export quota
increasing at 1.7% p.a., the other had the GDP growing at 0.5% p.a. higher
than the base case and the global quota increasing at 1.3% p.a. The results
are given in Table 6.
36. As the simulation results in Table 6 show, the differences in
projected prices widen substantially with time. The large price differences
under the two scenarios are a result of the low price elasticities of demand.
Thus prices are considerably higher when the secular demand trend is higher
and the quotas lower. The figures in Table 6 also suggest that real world
coffee export revenues are likely to increase at a very modest rate in the
1990s--about 1.5% p.a. in the base case and 2.3% p.a. in the "Higher GDP
-rowth and lower quotas" case.
- 35 -
Table 6: PROJECTED PRICES a/ UNDER ALTERNATIVE SCENARIOS
Base Case Higher GDP Growth Lower GDP Growth Without QuotasYear and Lower Quotas and Higher Quotas from 1990
----------------------- (1985 USf/kg)-/b------------------
1988 213 (97) c/1989 211 (96) 212 (96) 210 (95)1990 211 (96) 214 (97) 208 (94) 137 (62)
1995 204 (93) 220 (100) 179 (81) 183 (83)
2000 205 (93) 234 (106) 167 (76) 200 (91)
a/ 100 Other Milds" Indicator Price In 1985 pr'ces.b/ Deflator used Is MUV of the World Bank.c/ Figures In brackets are USt/lb.
(b) Projections without the quotas
37. Under this scenario it was assumed that the ICA export quota system
will be suspended from 1990 through 2000. The projections for the key
variables are also given in Figures 9 through 12.
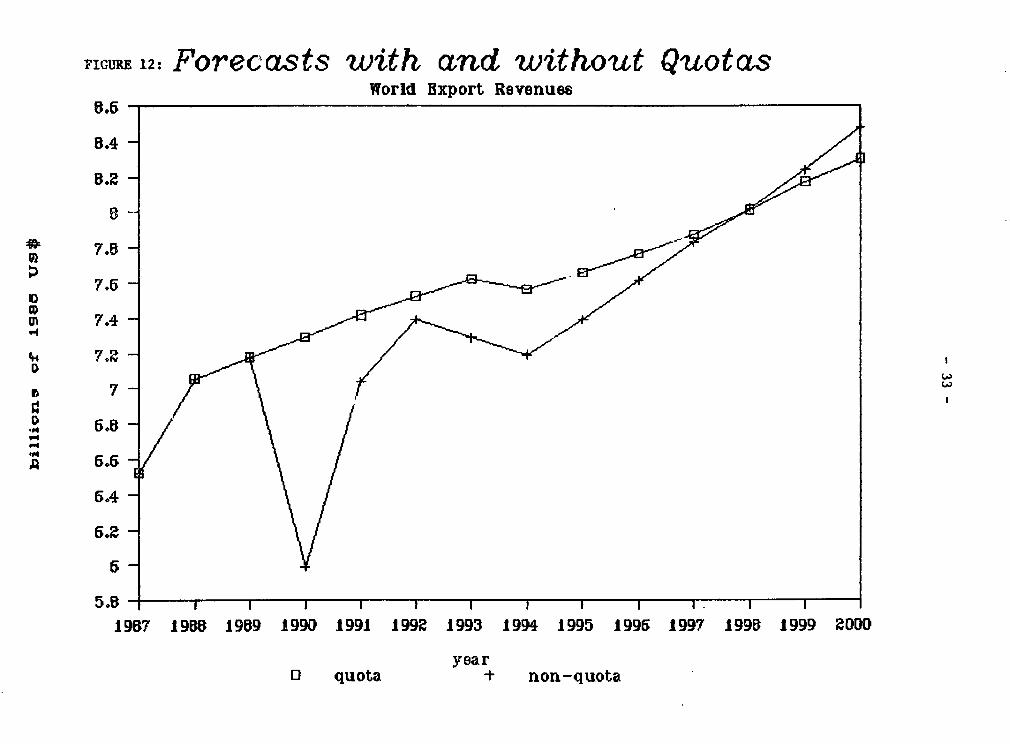
38. A major difference between the simulation results for the with- and
without-quota situations is in the projected prices. As expected, prices are
projected to be lower where there are no quotas. The extent of the price fall
in 1990 is especially severe as accumulated stocks in producing countries are
projected to be released in that year. However, with time the price
differences narrow. This is because the very low prices during the period
- 36 -
1990-1994 discourage production; hence, by the late 1990s exports and prices
are not very different from the quota case. In the absence of quotas, however,
the coffee cycle would extend into the 21st century, with the higher prices
after 1995 giving rise to increased plantings and resulting in lower prices
after the year 2000. The extent and speed of price recovery after the very
low prices of 1990 depends on the size and lagged nature of the price
elasticities of supply in major coffee-producing countries. At the extreme,
if the price elasticities of supply in these countries were near zero, world
prices would not recover quickly. The shape of the price recovery path also
depends on government policies taken in major producing countries. The
simulation results given here assume that changes in world prices will be
passed to producers to the same extent as in the past 20 years or so. It is
also assumed that the stocking behavior of these countries is the same as
their pre-1981 behavior. However, if governments in producing countries take
policies such as real devaluations or reductions in export taxes or both, it
would have the same effect as if world prices fell little. There would be no
price recovery because world production would not fall.
39. Production and exports under the non-quota scenario vary from one
country to another. The simulation results show countries following three
types of production/exports path. They are:
40. Category I. These countries consistently export more under the
without-quota scenario than under the quota scenario. The reason for this is
that they are able to increase production capacity even with low world prices-
-mainly due to the low cost of production or of high real producer prices.
- 37 -
Countries which fall in this category are Brazil, Costa Rica, Mexico, Peru,
Burundi, Cameroon, Rwanda, Tanzania, Zaire, Indonesia, Philippines and Papua
New Guinea. Projected exports to the ICA members under the two scenarios for
Brazil, Costa Rica, Burundi, Uganda, Indonesia and Papua New Guinea are shown
in Figures 13 to 18.
41. Category II. These countries have enough production potential to
export more in the without-quota case than in the quota case. But the low
world prices of the early 1990s reduce production potential and by the late
1990s their exports are less in the without-quota case than in the quota
case. Countries that fall in this category are Colombia, Ecuador, Dominican
Republic, Guatamala, Honduras, Venezuela, Kenya and Madagascar. Projected
exports to the ICA members under the two scenarios are given for Colombia,
Honduras and Kenya in Figure 19 to 21.
42. Category III. These countries have hardly enough production
potential to export the quota quantities in 1990. If prices fall due to the
quota suspension throughout the 1990s their production falls and their
production is projected to be lower in the without-quota case than in the
quota case. El Salvador, Angola, C6te d'Ivoire, Ethiopia and India are in
this category and the projected exports to the ICA members by C8te d'Ivoire
and El Salvador are shown in Figures 22 and 23.

FIGURE 13: BRAZILExports to IOD Members
'19
ZD -~
15-
19B7 I9BB 19B9 199 1991 199e 1993 1994 1995 1995 1997 199B 1999 W0DD
yearsO quota - no-quota

FIGURE 14: COSTA RICABxports to IW Members
Z .7-
Z,5-
2,5
2.3
2.2
Z.1
Oo 1.9I"~~~~~~~~~~~~~~~~~~~~~~~~~~~~~~~~~~~~~~~~~~~~~~~I
P"L
1.4
1.5
IX.
1957 1900 1909 199D 1991 1992 1993 1994 1995 1996 1997 1990 1999 2000
years0 quota + no-quota

FIGURE 15: INDONESIAExports to IW Members
17B~B
6~~
19B7 19BB 19B9 199D 1991 1992 1993 1994 1995 1996 1997 1998 1999 2ODB
yearO quota + no-quota

FIGURE 16: PAPUA NE W G UINEABxports to 100 Members
1.3 -
I2 .
1.1
Pod 0.9
0.0
19B7 19B5 19B9 1990 1991 1992 1993 1994 1995 1996 1997 1998 1999 2W0D
years0 quota + no-quota

FIGURE 17: UGANDAExports to IW0 Members
3.2 -
34
3
2.9
.P42.
-~~Z.
2.5
1987 1980 19B9 1990 1991 1992 1993 1994 1995 1996 1997 1998 1999 2000
yearsO quota -+ no-quota

FIGURE 18: BUR UNDIExports to IWO Members
640 -
630-
620 -
510-
600-
02 590-550D57D-
550-550-
540-53D-
510-soD-490-
45D-
450-
1957 1955 1959 1990 1991 1999 1993 1994 1995 1995 1997 1995 1999 ZWD
years0 quota + no-quota

FIGURE 19: COLOMBIABxports to 100 Members
13 ,
11.5
11 4
10.5
ID-
9
8.5 T
1987 1900 1909 1990 1991 1995 1993 1994 1995 1995 1997 1998 1999 2DD0
years0 quota - no-quota
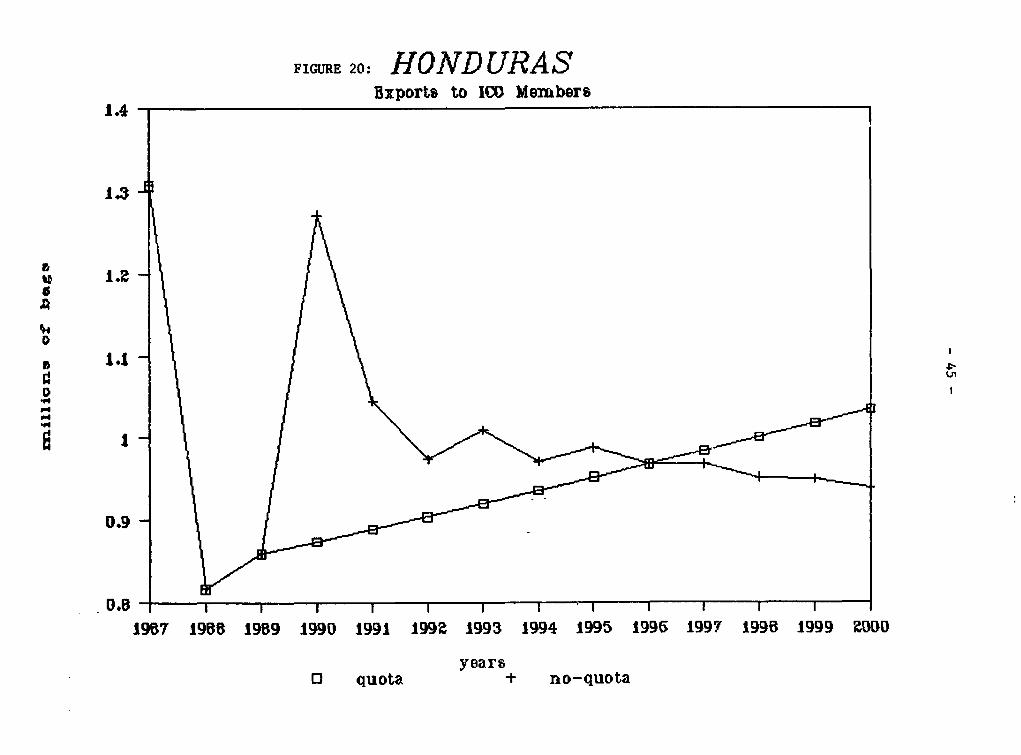
FIGURE 20: HOND URASBxports to INO Members
1.4 -
1.3
,1.Z
19B7 19BB 1959 1990 1991 1992 1993 1994 1995 1996 1997 199B 1999 ZWDD
yearsO quota no-quota

FIGURE 21: KUENAYAExports to IOD Members
1.9
1.B
q d 1.7
1.
1.4
a 1.7 -
1957 1955 1959 1i991 1991 199D 1993 1994 1995 1995 1997 1995 1999 2DDD
years0 quota -I no-quota

FIGURE 22: CO TE D' IVOIREExports to ICD Members
4.7-
4.5-
4.1 -
P4~~
.I
19B7 1908 1959 199D 1991 1992 1993 1994 1995 1996 1997 1990 1999 2WD
years0 quota 1 -no-quota

FIGURE 23: FL SALVADORExports to IWU Members
e.5 I
B~~~~~~~~~~~~~~~~~~~~~~~~~~~~~~~~~~~~~~~~
Z.45 Ji
ZA4 -
I .9
1i- I.7 , , I ,
19BY 1398 19B9 1990 1991 1992 1993 1994 1995 1995 1997 1995 1999 2WO
yeanO quta * hor -

- 49 -
VI. The Impact of the Quota System
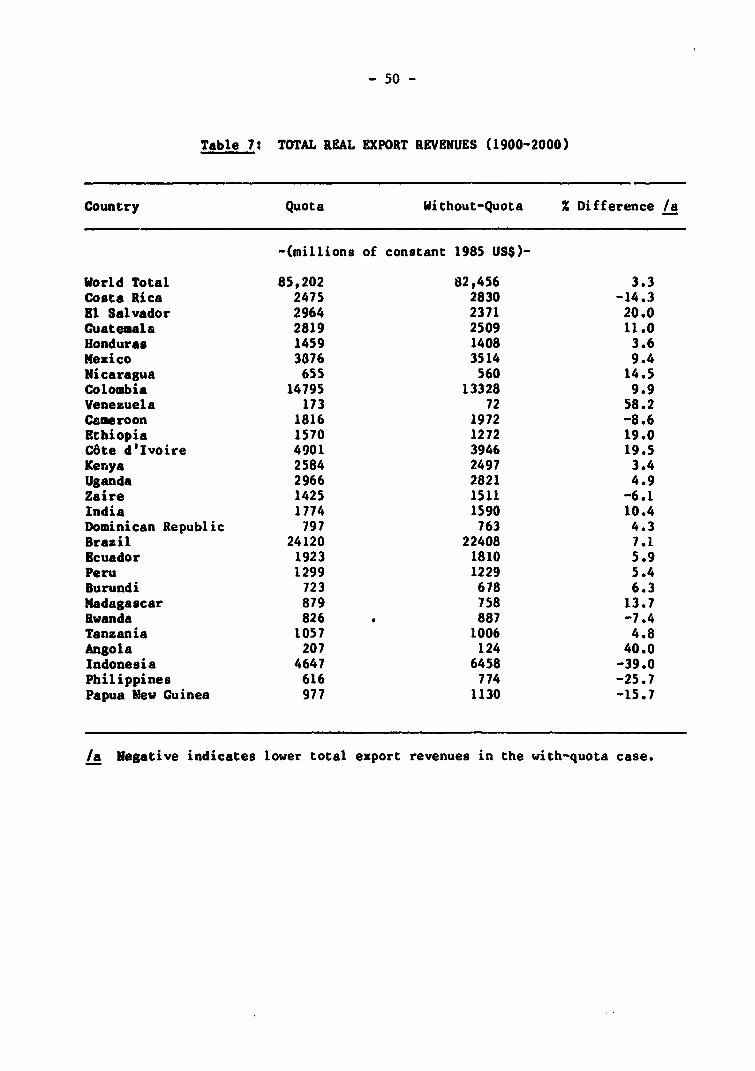
43. The expected impact for producing countries of the quota system were
estimated by comparing projected export revenues in real terms during the
period 1990-2000 from the quota and without-quota simulations (see Table 7).
The quota system benefits the producing countries as a whole by US$2.7 billion
in 1985 constant US dollars (or 3.,JZ increase) over this period but as Figure
12 shows its benefits decline with time and in the late 1990s the combined
export revenue of coffee-producing countries is higher under the without-quota
scenario.
44. The benefits vary greatly from one country to another. The extent of
the difference in a country's export revenues between the quota and without-
quota case depends mainly on the extent of the difference in the export
quantities under the two scenarios. If a country has enough production
potential that it can increase its expurt quantities to cover the loss
incurred from lower world prices under the without-quota scenario, its export
revenues would be higher under the without-quota scenario than under the quota
scenario. Thus Category III and most of Category II countries gain from the
quotas while most countries in Category I lose from the quota system; an
important exception in Category I is Brazil, which gains from continuation of
the export quota scheme.
- 50 -
Table 7: TOTAL REAL EXPORT REVENUES (1900-2000)
Country Quota Without-Quota 2 Difference /a
-(millions of constant 1985 US$)-
World Total 85,202 82,456 3.3Costa Rica 2475 2830 -14.3El Salvador 2964 2371 20.0Guatemala 2819 2509 11.0Honduras 1459 1408 3.6Mexico 3876 3514 9.4Nicaragua 655 560 14.5Colombia 14795 13328 9.9Venezuela 173 72 58.2Cameroon 1816 1972 -8.6Ethiopia 1570 1272 19.0CBte d'Ivoire 4901 3946 19.5Kenya 2584 2497 3.4Uganda 2966 2821 4.9Zaire 1425 1511 -6.1India 1774 1590 10.4Dominican Republic 797 763 4.3Brazil 24120 22408 7.1Ecuador 1923 1810 5.9Peru 1299 1229 5.4Burundi 723 678 6.3Madagascar 879 758 13.7Rwanda 826 . 887 -7.4Tanzania 1057 1006 4.8Angola 207 124 40.0Indonesia 4647 6458 -39.0Philippines 616 774 -25.7Papua New Guinea 977 1130 -15.7
/a Negative indicates lower total export revenues in the with-quota case.

- 51 -
VII. Policies to Cope with the Lower Prices in the Absence of The Export Quota
45. The simulation results discussed in the last two sections show that
real coffee export revenues of many coffee-exporting countries would decline
sharply if the quota system is suspended in 1990. For each country there are
limited policy options available to cope with such a situation. In countries
where other cash crops are available, diversification out of coffee may be the
most appropriate option. But this is a decision which has to be made within a
long-run context, because of the nature of tree crop investment. In some
countries this option may be desirable even if the quota syptem is continued;
even under the quota scenario real export :evenues of coffee are expected to
increase only at low rates.
46. Countries which do not have the diversification option, may have to
increase their competitiveness in producing coffee. This may be accomplished
through employment of more efficient production and processing technology,
reductions of export taxes on coffee and real devalvation of their
currencies. Some improved management practices, such as stumping, can improve
yields in the short run. This is not the case with replanting of higher-
yielding varieties which has a negative impact on farm incomes in the short
run. Because the very low world coffee prices under the without-quota
scenario could last as long as four years, governments might consider
emergency policies to reduce export taxes or devalue their currencies, or
both-at least until coffee production technology improves. One catch in such
a suggestion is that if all producing countries take these measures, world
coffee prices may remain very low for a period considerably longer than that
projected hete.

- 52 -
VIII. Conclusions
47. The simulation results in this paper gave se2aral interesting
findings which models foscussed on short-term effects would not be able to
reveal. The ex-post simulation results show that the quota system had an
important effect in stabilizing world coffee prices for the period 1981-85.
They also show that world coffee prices in 1986, the year prices increased
sharply due to the drought in Brazil in 1985, would have been much higher had
the quota system not operated during the period 1981-85. Thus the quota
system had a price stabilizing effect on the upside too. The simulation
results for individual exporting countries showed that the quotas led to
decreased real export revenues for most countries, except for large exporters
like Brazil and Colombia. These countries gained from the export quota system
because they face very small or even zero marginal export revenues from
increased exports due to their large market shares.
48. The projections of the world coffee market, with and without the
export quota system, showed that world coffee prices would be substantially
lower during the first half of the 1990s if the system were to be suspended in
October 1989. However, the differences in prices between the quota and non-
quota scenarios narrow with time as production and hence exports in many
countries decline due to the low prices in the early 1990s.
49. Total coffee export revenues in real terms are projected to be less
under the without-quota scenario than under the quota scenario until the late
1990s; but in the late 1990s total real export revenue is higher under the
without-quota scenario as the price differentials narrow.
- 53 -
SO. For the period 1990-2000 most producing countries would be better off
in terms of total real export revenues with the export quota system. However,
the eztent of the benefits of the quota system vary considerably from one
country to another. Countries with low production costs could more than
compensate foiL the lower world prices under the without-quota situation by
targe increases in export quantities; while other higher-cost countries would
suffer both from the lower world prices and lower export quantitites in the
absence of the quota.
Si. As the period of lower world prices following suspension of the
esport quota scheme is projected to last for several years, countries with
high production costs may have to consider reductions in coffee export taxes
or devaluation of their currency to reduce the impact on their coffee
industry. However, if large producers followed this strategy it would have a
depressing impact on world prices.

- 54 -
ANNEX
Problems in the Estimation of Economic Welfare Changes
52. An attempt was made to calculate and compare economic welfare under
the quota and without-quota scenarios. 1/ The estimate of the economic
welfare depends greatly on the shape of the supply curve. At an extreme, if
the price elasticity of supply is assumed to be zero in the short-run,
producer surplus is reduced to export revenues. However, this assumption is a
poor one for estimating producer surplus as it assumes that the same quantity
of exports will be made at any price, even if the price drops down to zero. A
more realistic export supply curve for the case when the export quota is in
effect is the one depicted in Annex Graph 1.
Annex Graph 1
Price
A _
Exports
1/ The producer surpluses are derived from export supply curves rather thanfrom supply curves.

- 55 -
53. According to this curve, exports will be X only when prices are above
P*. Below P , exports will decline even in the presence of a quota fixing
exports at X
Annex Graph 2
Price
PN. / I ix
Exports
To calculate and compare economic welfare under quota and without-
quota scenarios, the export supply curves under these two scenarios need to be
carefully defined. In Annex Graph 2 curve ACD corresponds to the quota case
and curve ACB to the without-quota case. The calculation and comparison of
the producer surpluses for a small country (price taker) under the two
scenarios is as follows: Without the quota the price is PNQ, while if quotas
exist the price is PQ. The producer surplus under the without-quota scenario
is then PNQGA and under quota P QECA. Comparing the two is reduced to
comparing the area (i) to area (ii). In order to calculate area (ii) one
needs to calculate P *. P* is the price at which exporters would export X in
- 56 -
the without-quota scenario. In order to calculate P , some constant price
elasticity of export supply has to be assumed because the estimated supply
elasticities are not considered reliable when P* is low. For selected
countries the differences in the producer surpluses between the quota and
without-quota scenarios for each year for the period 1990-2000 were calculated
and are given in Annex Table 1. The assumed short-term elasticity of supply
is 0.3. Positive figures imply benefits from the quota system and negative
figures imply losses. Among the selected countries only Indonesia, Papua New
Guinea, and the Philippines manage to do better under the without-quota
scenario, especially in the long run. These three countries have managed to
substantially expand exports. All three of them are considered low-cost
coffee producers.
Other than the ad-hoc imposition of a constant price elasticity of
export supply and the magnitude of its elasticity, there is a more serious
problem concerning the economic welfare calculations above. This problem
arises when the supply curve shifts when quotas are lifted.
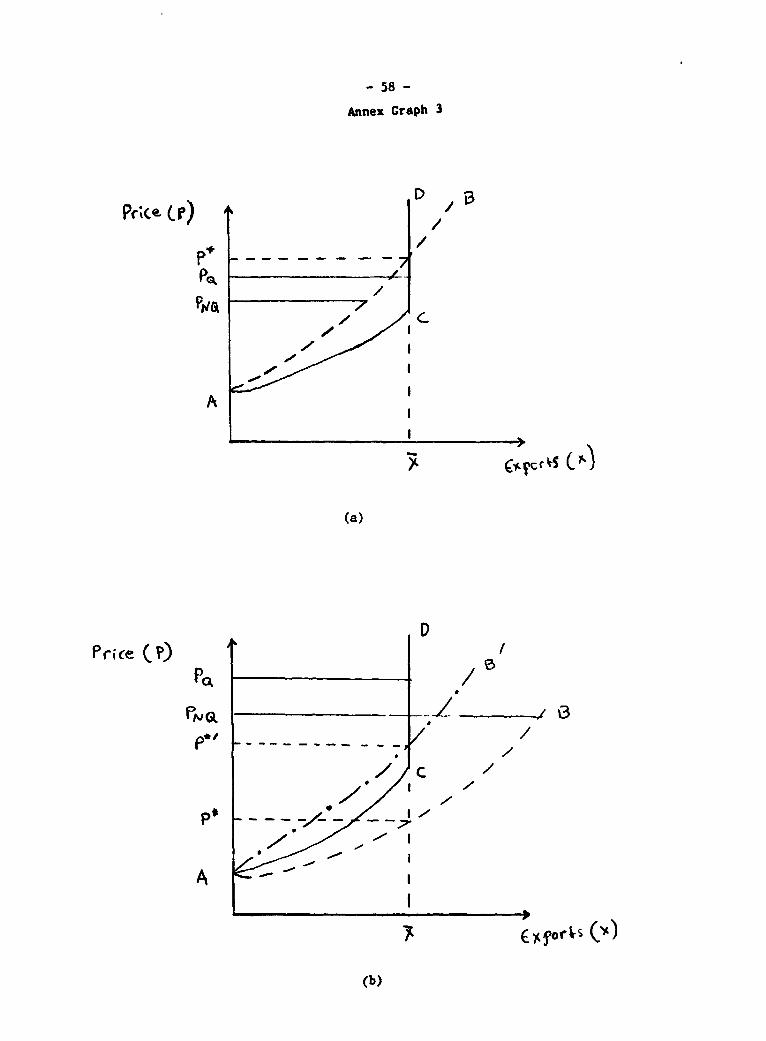
In Annex Graph 3(a) the export supply curve shifts in and in 3(b)
shifts outwards when export quotas are lifted. These shifts are possible if,
for example, the stocking behavior of exporters changes as a result of the
change in the export quota regime. In both cases, the calculations of P* and
the areas (i) and (ii), as depicted in Annex Graph 2, will not be accurate.
Actually, for a number of countries and for a period of years, the P* was
calculated to be higher than Pq and PNQ. In Annex Graph 3(a), the method of
comparing economic welfare as depicted by Annex Graph 2 gives erroneous

: 1: CALCUL,i IUN OF - US /a IF ARE L ItU /b
Date Republic Costa Rica Equador Burundi Tanzania Uganda
1987 0 0 0 0 0 0
1988 0 0 0 0 0 0
1989 0 0 0 0 0 0
1990 25.3 2.8 81.2 29.5 47.1 135.8
1991 12.2 8.0 30.1 11.5 19.2 50.4
1992 3.8 3.6 18.2 8.2 11.6 33.5
1993 11.3 15.1 29.7 12.0 16.4 56.9
1994 11.7 20.4 31.8 12.0 16.6 60.6
1995 10.1 17.6 27.0 10.2 14.2 51.3
1996 8.1 14.5 21.2 7.8 10.4 40.4
1997 5.9 9.8 15.5 5.4 6.5 29.7
1998 5.0 9.4 13.4 4.3 5.0 25.8
1999 4.0 7.7 10.6 3.0 3.2 20.4
2000 1.9 3.5 5.4 0.8 -0.1 10.4
%-n
Papua
Date Zaire Cameroon Rwanda Indonesia New Guinea Philippines
1987 0 0 0 0 0 0
1988 0 0 0 0 0 0
1989 0 0 0 0 0 0
1990 46.7 36.5 11.0 -194.3 6.9 3.4
1991 15.1 -3.2 -0.6 -176.7 -6.5 4.4
1992 6.3 -0.8 4.5 40.3 7.5 -7.7
1993 18.4 15.5 10.6 36.7 9.1 1.8
1994 24.6 25.8 10.7 -59.8 6.2 2.1
1995 18.9 25.2 8.7 -79.8 7.3 -0.0
1996 12.5 19.5 7.0 -62.2 3.6 -3.3
1997 7.5 14.0 5.4 -74.2 -0.4 -8.1
1998 6.0 12.9 5.0 -97.1 -1.1 -10.0
1999 3.5 10.7 4.1 -116.4 -2.0 -12.1
2000 -1.4 5.4 2.1 -132.1 -4.7 -15.4
/a Gain If sign is negative
/b In September 1989.
- 58 -
Annex Graph 3
P.;(e. (r) D B/
/
(a)
DPrice CP) DLS
^~~~~~~ >
(b)

- 59 -
results. In Annex Graph 3(b), producer gains from the lifting of the quota
are overestimated (if the export supply curve shifts in to AB') or
underestimated (if the export supply curve shifts outwards to AB) as compared
to the results obtained from the analysis leading to Annex Graph 2.
Examination of the simulation results revealed that, in fact, the
export supply curves of the majority of the countries considered shifted
substantially with time. Thus, this approach was not adopted in the paper.
Mathematical Appendix
In this appendix the area (ii) in Annex Graph 2 is calculated.
It is assumed here that the export supply equation has constant
elasticity, such as:
ln X = e lnP + A (1)0
where X = export
p = Price
e = price elasticity of supply
AO = intercept
To determine numerically the intercept, it is known that (1) passes through
(PNQ' XNQ) so:

- 60 -
AO = lnXNQ - e ln PNQ (2)
substituting (2) into (1)
ln X = n ln P + ln X NQ - e ln PNQ (3)
when X = X , then P = P*. By substituting X for X and P* for P into (3) and
solving for P*, an expression for P* is obtained.
P* = exp (in (X IXNQ)/e) * PNQ
After calculating P*, the next step is to calculate the area (ii) = (GFC)
in Annex Graph 2. This area is equal to:
(GFC) = (P*CG P - (PKCFP) (4)
where:
(P*CGPNQ) = *NQ exp (e lnP + lnXNQ - e lnPNQ)dp
and:
(PNQ FCP*) = (PNQ - P*) X

- 61 -
By performing the integration, (4) becomes:
(GFC) = XNQ (PNQ - P*) / [(l+e) PNQ] - (PNQ - P*) (5)
After calculating the area (GFC) the producer surplus gain from lifting the
export quota becomes:
DIF = (GFC) - (PQEFPNQ) or,
DIFP= XNQ (PNQ- P*) / ((l+e) PNQ) - (P - p*) X (6)NQ Q

- 62 -
REFERENCES
Akiyama, T., and R.C. Duncan (1982), Analysis of the World Coffee Market,World Bank Staff Commodity Working Paper No. 7, Washington, D.C.
Akiyama, T. and P.K. Trivedi (1987), "Vintage Production Approach to PerennialCrop Supply", Journal of Econometrics 36: pp. 133-161.
Gilbert, C.L., and T.V. Palaskas (1988), "Econometric Commodity Price Models",Institute of Economics and Statistics, Oxford University, mimeo.
Ghosh, S., C.L. Gilbert and A.J. Hughes-Hallett (1987), StabilizingSpeculative Commodity Markets, Clarendon Press, Oxford.
Herrmann, R. (1986), "Free Riders and the Redistributive Effects ofInternational Commodity Agreements: The Case of Coffee", Journal ofPolicy Modeling 8(2): pp. 1-25.
International Coffee Organization, Quarterly Statistical Bulletin, varioubissues, London.
International Monetary Fund, International Financial Statistics, variousissues, Washington, D.C.
Newbery, D.M.G., and J.E. Stiglitz (1981), The Theory of Commodity PriceStabilization, Clarendon Press, Oxford.
Palm, P.C., and E. Vogeluag (1988), Policy Simulations Using a QuarterlyRational Expectations Model for the International Coffee Market, paperpresented at the XXVth International Conference of the Applied EconometricAssociation, International Commodity Market Modeling, World Bank,Washington, D.C., October 24-26, 1988.
Trivedi, P.K. (1986), A Framework for Studying the Supply Response ofPerennial Crops, Commodity Studies and Projections Division Working PaperNo. 1986-1, World Bank, Washington, D.C.
USDA, Foreign Agricultural Service: Coffee, various issues, Washington, D.C.

PPR Working Paper Series
Title Author Date Contact
129 Women In Development: Defining the
Issues Paul Collier December 1988 J. Klaus33745
130 Maternal Education and the Vicious
Circle of High Fertility and Mal-
nutritlon: An Analytic Survey Matthew Lockwood December 1988 J. Klous
Paul Collier 33745
Implementing Direct ConsumptionTaxes In Developing Countries George R. Zodrow December 1988 A. Bhalla
Charles E. McLure, Jr. 60359
Is the Discount on the Secondary MarketA Case for LDC Debt Relief? Daniel Cohen November '988 M. Luna
33729
Lewis Through a Looking Glass: Public
Sector Employment, Rent-Seeking and
Economic Growth Alan Gelb November 1988 A. HodgesJ.B. Knight 61268R.H. Sabot
International Trade In Financial
Services Silvia B. Sagarl January 1989 W. Pitayatonakarn60353
PPR Working Papers Catalog
of Numbers I to 105 PPR Dissem. Center November 1988 Ann Van Aken31022
Pricing Commodity Bonds Using
Binomial Option Pricing Raghuram Rajan December 1988 J. Raulin33715
Trends in Nontariff Barriers of
Developed Countries: 1966 to 1986 Sam Laird December 1988 J. Epps
Alexander Yeats 33710
Fiscal Adjustment and DeficitFinancing During the Debt Crisis William R. Easterly January 1989 R. Luz
61760
A Conceptual Framework forAdjustment Policies Bela Balassa January 1989 N. Campbell
33769

PPR Working Paper Series
Title Author Date Contact
WPS140 Building Educational Evaluation
Capacity in Developing Countries John Middleton
James TerryDeborah Bloch
WPS141 Payroll Taxes for Financing Training
in Developing Countries Adrian Ziderman January 1989 Ci Cristobal33640
WPS142 Vocational Secondary Schooling inIsrael: A Study of Labor Market
Outcomes Adrian Ziderman January 1989 C. Cristo
33640
WPS143 Decentralization In Education:
An Economic Perspective Donald R. Winkler
WPS144 Product Differentiation and the
Treatment of Foreign Trade In
Computable General Equilibrium Modelsof Small Economies Jaime de Me;o
Sherman Robinson
WPS145 Revenue Raising Taxes: General
Equilibrium Evaluation of AlternativeTaxation In U.S. Petroleum Industries Jaime de Melo
Julie Stanton
David Tarr
WPS146 Exchange Rate-Based Disinflation. Wage
Rigidity, and Capital Inflows:Tradeoffs for Chile 1977-81 Timothy Condon
Vittorlo Corbo
Jaime de Melo
WPS147 The Private Sector's Response to
Financial Liberalization In Turkey:
1980-82 Izak Atiyas January 1989 W. Pitayato
60353
WPS148 Impact of the International Coffee
Agreement's Export Quota System on the
World Coffee Market Takamasa Akiyama February 1989 D. Gustafso
Panayotis N. Varangis 33714